 Elizabeth Leigh Wetzler
- United States Military Academy, West Point, NY, United States
This study evaluates how combining multiple grading practices and policies designed to promote excellence, differentiate among high-performing students, or prevent grade inflation at an elite institution affects GPA outcomes for low-performing students. The author evaluated archived performance data from 3,274 cadets completing a required course during a 3-year period at the United States Military Academy (USMA) at West Point. Common grading practices use a restricted percentage range with a high cut-off value for the D category (67.0–69.9%), and, although used for other grades, USMA policy prohibits the use of plus/minus demarcations for the D grade in GPA calculations. Grade distributions were highly irregular, and, when combined with the lack of plus/minus demarcations for D's in GPA calculations, the restricted D range in the grading scale resulted in disproportionate GPA penalties for low-performing students. These penalties masked other notable performance differences at higher levels. Recommendations include (a) conducting a benchmark study to determine the appropriate cut-off score for the current course and (b) conducting a comprehensive, retrospective review of cadets' academic performance data across different courses and semesters to determine the percentage of cadets affected by the disproportionate penalty before deciding on a future course of action.
Various grading scales, systems, and policies used in higher education have garnered recent research attention (Kleinman et al., 2018), especially with concerns about grade inflation (Cushman, 2003; Donaldson and Gray, 2012). In traditional grading practices, instructors assign letter grades for each student at the end of a course, using the A, B, C, D, F system. These letter grades are then allocated a pre-determined number of quality points, which, when multiplied by the number of credit hours for each course, are used to calculate grade point averages (GPAs). Strict letter grade and quality point allocation systems in the United States typically assign 4.0 points for the A, 3.0 points for the B, 2.0 points for the C, 1.0 point for the D, and 0.0 points for the F. In order to better differentiate among students, adding increments (i.e., steps) in between the letter grades by using pluses and minuses has become very popular in recent years. Klienman et al. reported that 513 of 630 higher education institutions in the U.S. Northeast currently use such scales. Numerous researchers have investigated whether the addition of plus/minus letter grades significantly alters GPAs after implementation and have found that there are slight effects on GPA, but that students and faculty may perceive different scales as more or less desirable (Wilamowsky et al., 2008; Barnes and Buring, 2012).
From an assessment perspective, grading practices should reflect overall grade integrity (Sadler, 2009, 2012). That is, grading practices should accurately reflect some sort of quality assurance for the student and for others who review a student's transcript regarding the level of student achievement. Whereas the meaning of certain grades on a transcript may be easily understood by individuals familiar with an institution's practices and policies, as well as how difficult or easy the marking is in different courses and disciplines, it becomes more difficult for outsiders who know nothing of the idiosyncratic or atypical practices used at any given institution. Grades that are artificially inflated or deflated at the instructor, department, or institutional level may misrepresent the level of student achievement, and some efforts to prevent grade inflation may even introduce unintended negative outcomes. To ensure an acceptable level of integrity for the grading system, which relates to general trustworthiness as perceived by individuals both within and outside of the institution, key institutional stakeholders should periodically review the grading practices in use, evaluate the integrity of those systems as a whole, and consider how the various components may interact as they affect students. Of specific concern is how efforts to combat grade inflation and differentiate among high-performing students may systematically disadvantage other groups, such as low-performing students who may already be at risk of failure or dropping out.
The current study uses a particular case to illustrate the complexities of the problem, and although this case is not expected to generalize to all other institutions of higher education, it underscores the importance of considering this issue at a deep level. This consideration includes a review of assumptions made about the properties of the measurement scales in use, along with how the different types of scales should, or perhaps should not, be mathematically combined. The focus is on the combined results of the specific grading practices used in the United States Military Academy (USMA) course, General Psychology for Leaders (PL100), and the quality points assigned to final course grades that are used in subsequent GPA calculations. All cadets complete the core course PL100, and a team of more than a dozen faculty provide instruction. All cadets complete the same graded events, to include daily quizzes, one (or two) papers, Written Partial Reviews (WPRs), which are periodic exams that have undergone a rigorous development and review process, and a final Term End Exam (TEE). The current practice at USMA includes plus/minus grades for the A, B, and C letter grades, though not for the D or F. The USMA GPA is referred to as the Academic Program Score, which is calculated for each term (APST) and cumulatively (APSC). Table 1 reflects the current grading practice in use for PL100 at USMA, and the associated quality points assigned per course credit hour that are used for calculating APSTs.
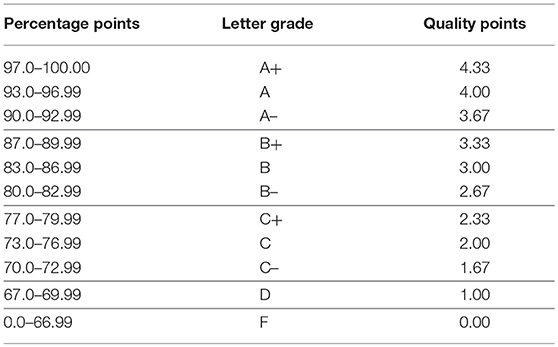
Table 1. Current PL100 grading scale at USMA and quality point allocations.
Of particular interest is that the current grading system reflects an inconsistency in how large the letter grade bands are for each letter category (10.0% for A– to A+, 9.9% for B– to B+, 9.9% for C– to C+, but only 2.9% for all Ds, and subsequently 66.9% for all Fs). The origins of this scale's use at USMA are unknown, and the author's review of available academic program policy documents yielded no useful information in this regard. Moreover, the system is also inconsistent in the use of plus and minus grades, as there are none for the D grade, though this specific practice is not necessarily uncommon across institutions. Wilamowsky et al. (2008) report that many institutions drop the use of plus and minus grades at the low end of the scale, sometimes also dropping the C– grade. Although it may signal that a higher level of performance is expected in order to avoid a failing grade, dropping plus/minus demarcations for the lowest grade categories may make it difficult to differentiate among low-performing students. However, it may be the case that the high cut-off value for the D grade serves a specific purpose that has not been widely disseminated at the institution or that the assessments are better able to differentiate among high performers than among low performers, which might make the restricted D range and high cut-off value valid and appropriate. Without historical information in evidence, understanding the origins of the practice is not easy. Regardless, considering how well the practice of assigning letter grades to various categories of scores currently functions is important for purposes of clarity and grading integrity.
The policy for allocating grade quality points at USMA is also problematic. The letter grades assigned by instructors, which reflect an ordinal level of measurement, are transformed a second time back to numeric values ranging from 0 to 4.33. These numbers are more akin to numeric symbols, though, in that even though they are numeric, they still reflect an ordinal rather than interval scale (Dalziel, 1998; Soh, 2010; Yorke, 2011). Unfortunately, these grade quality points are treated as interval data and used for mathematical calculations for the grade point average, discounting the idea that the distance between two scores may not be consistent as well as other important factors such as the mean and standard deviations for the classes as a whole (Rust, 2011). The same way that trying to calculate an “average” letter grade for a student who earned an A, three B's, and two D's is illogical, as the alphabet letters reflect differences in performance that may or may not be roughly equal, simply transforming the alphabetic symbols to numeric ones does not convey interval level properties to the numeric symbols. If one student earns 95% of the available course points and receives an A letter grade and 4.0 quality points while another student earns only 75% of the points and nets a C and 2.0 quality points, the first student can be said to have earned 20 more percentage points than the second, along with a higher letter grade. However, the numeric symbols assigned to the letter grades for purposes of quality points, if treated as though they are interval rather than ordinal in nature, would suggest that the first student performed twice as well as the second student. Not only is this conclusion incorrect, but it highlights one of the inherent problems that arises when grade points are treated as though they are anything other than ordinal in nature. Arguments against treating the ordinal numbers associated with letter grades as though they were cardinal numbers have been elucidated in various forms by numerous researchers (including Chansky, 1964; Dalziel, 1998; Soh, 2010; Rust, 2011; Yorke, 2011; Handley and Read, 2017).
Beyond the general concern about using the ordinal numbers that are assigned for letter grades as though they were interval level data, the policy for allocating grade quality points at USMA has an additional problem. Every step difference from A+ down is associated with a loss of 0.33 quality points per course credit hour, except for the drop from C– to D, which nets a 0.67 point loss, and the drop from D to F, which results in a full 1.00 point loss. Thus, a cadet with a 70.0% (a C–) in PL100 would net 1.67 points per credit hour for a total of 5.01 points for the three-credit class, a cadet with anywhere from 67.0 to 69.9% (a D) would earn 1.00 quality point per credit hour for 3.00 total points, and a cadet with 66.9% (an F) would score 0.0 quality points. The spread from 66.9 to 70.0% reflects a two-step difference in adjacent grades (from F to D to C–) and an absolute difference of 5.01 quality points earned for the PL100 course, whereas the spread from 76.9 to 80.0% or from 86.9 to 90.0%, which also reflects two grade steps and the same 3.01% difference, each result in a change of only 2.01 quality points. This results in a disproportionately higher penalty at the lower end of the scale, more than twice the penalty of similar differences at other points in the scale, which may have dramatic effects on APST calculations and the cadets' positions in the USMA Order of Merit List (OML).
Whereas the United States Military Academy Dean's (2016) Academic Program policy dictates the specific allocation of quality points for each letter grade, it specifically states, “because there is no standard scale used by all departments for converting marks to grades, cadets should ascertain from their instructors during the first few lessons of each term how the various departments assign grades” (p. 23). Although the quality point allocations appear to be a matter of established USMA policy, decisions on grading scales and cut-off scores appear to rest within the department. In PL100, however, the scale reflecting the restricted range for the D grade is automatically populated within the electronic grade reporting system and is labeled as the “standard” scale.
Given that the quality point allocation policy may further amplify empirically small differences in performance at the lower end of the scale, the specific way that D grades are assigned in any given course merits careful consideration. Aside from mirroring the percentage distances between other adjacent grade steps in the overall scale and conveying that a higher percentage of points are required to achieve the minimal passing grade, it remains unclear if the current USMA grading scale used in PL100 accomplishes some other specific, worthy, and defensible goal by using a restricted range for the D grade. Consider the steps involved between the instructor entering the final course percentage (FCP) and the evaluation of the cadet's overall performance for the set of classes that semester:
1. FCPs are entered into the electronic record system and immediately converted to letter grades according to the grading scale, in this case using a scale with restricted range for the D grade.
2. Letter grades are then translated to grade quality points using the USMA quality point allocation policy and ASPTs are calculated for each cadet.
3. Cadets who fail a course or who fall below a minimum threshold for APSTs are flagged for review by the Academic Board and considered for separation from the academy.
Due to the nature of the transformation of FCP points to letter grades using the current (and inconsistent) USMA letter grade system (Step 1 above) and then back-translating those letter grades into an ordinal numeric format to assign grade quality points (Step 2 above) using a system that has mathematical inconsistencies of its own, even a 0.1% performance difference in FCPs between two cadets in PL100 who are at or just below the current D range may hide much larger performance differences in other courses when APSTs are calculated in Step 3. This problem only becomes apparent when combining the various parts of a grading system that involves several transformations that each introduce error in going from an interval scale for FCPs to an ordinal scale for letter grades and then to an ordinal scale for grade quality points that is erroneously treated as though it has interval scale properties. Thus, a study of the integrity of the grading scale currently being used at USMA for PL100, and its effects on grade distributions and resulting APSTs, appeared to be justified.
Therefore, the purpose of this study was to 2-fold: first to evaluate grade distributions using the current percentage cut-off for the D letter grade in PL100 vs. a more traditional, equally proportioned scale, and second to see how the current practice for assigning D and F grades affects associated APST outcomes for pairs of hypothetical cadets who exhibit small vs. large performance differences at different points on the grading scale. Performance data from PL100 included 3 years of cadets' archived scores on six variables: WPR1, WPR2, WPR3, WPR4, and the TEE, all of which reflect scores on objective multiple-choice tests (some with short answer questions, too), as well as FCPs. The WPR and TEE scores together represent approximately two-thirds of the points that factor into FCPs. Scores on papers and daily quizzes, which comprise the remaining one-third of graded events and which may include a higher level of variability and subjectivity in grading, were not included.
The hypothesis was that the use of the restricted range for D grades (67.0–69.9%) in PL100 at USMA would result in irregular grade distributions for each of the six variables while the use of a more traditional method would yield distributions that appear closer to a normal distribution, even though true normality in grade distributions would not necessarily be expected due to the biasing nature of instruction (Chansky, 1964). The computations of APSTs for varied performance across several courses (in hypothetical scenarios) were expected to illustrate how, when combined, the restricted D range and heavy penalties in quality point allocations for low grades disproportionately penalize cadets who perform on the lower end of the grade spectrum.
Method
The primary analysis for this study used de-identified, archived performance data for cadets who enrolled in PL100 from the spring semester of 2015 to the fall semester of 2017. Grade distributions were compared for two grading scales: the current USMA scale with 67.0–69.9% for D's and an alternative, more traditional one that assigns D's for percentage scores ranging from 60.0 to 69.9%. Calculations for five hypothetical pairs of cadets also were used to demonstrate several variations in how APST outcomes are affected by the current practice, as well as how outcomes would change by using an alternative method of assigning D and F grades and including plus/minus demarcations for the D category. This study was carried out in accordance with the recommendations and approval of the Institutional Review Board at the USMA. The protocol was approved as having exempt status under 32CFR219.101(b)(4) because this is a retrospective study on existing data. As a retrospective study on existing data, no informed consent was solicited; no identifying information was collected.
Results
After calculating descriptive statistics, the first set of analyses focused on changes in grade distributions for each WPR, the TEE, and FCPs for the 3,274 cadets included in the sample. The distributions for each individual variable using the current USMA cut-off score of 67.0% for the D vs. the more traditional cut-off score of 60.0% were compared. The second set of analyses compared APST calculations for pairs of hypothetical cadets who scored similarly in all but one course, with the difference occurring at various points on the lower end of the grading scale (i.e., C– to D and D to F). A fourth comparison tested the hypothesis that small differences in performance at the lower end of the scale would mask large differences at the higher end of the scale. A final comparison evaluated whether adding the plus/minus system to the D grade range while also expanding it to include 60.0–69.9% would bring APSTs into closer mathematical (and logical) alignment with FCPs.
Descriptive Statistics
The average percentage for total points earned in the PL100 course across all six semesters was 83.91% (SD = 7.39), with skewness of −0.24 (SE = 04). The total sample included 3,274 cadets, though 2 cadets did not have scores for the TEE. Thus, all statistics are based on 3,274 data points except the TEE, which included only 3,272. Table 2 reflects the descriptive statistics.
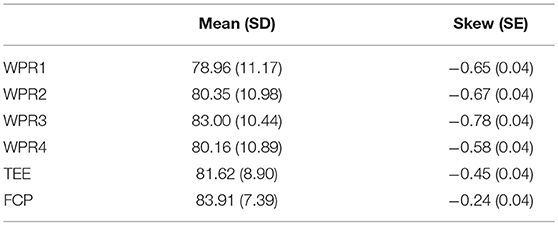
Table 2. Descriptive statistics for WPRs, the TEE, and final course percentages.
In general, cadets' grades centered around the B range. The skew of the distribution indicated that more cadets scored at the higher end of the scale than the lower end. This is not uncommon in grade distributions, though the average score and standard deviation for FCPs suggest that grade inflation was not a problem.
Grade Distributions
As expected, the atypical scheme for assigning D grades using the current USMA approach yielded irregular grade distributions for all variables. Although the results remained skewed for each variable using the more traditional cut-off score of 60.0% for the D grade, the shapes better approximated normality. Figure 1 reflects the grade distribution for the different scales for the first WPR. All other dependent variable distribution comparisons yielded similar patterns.
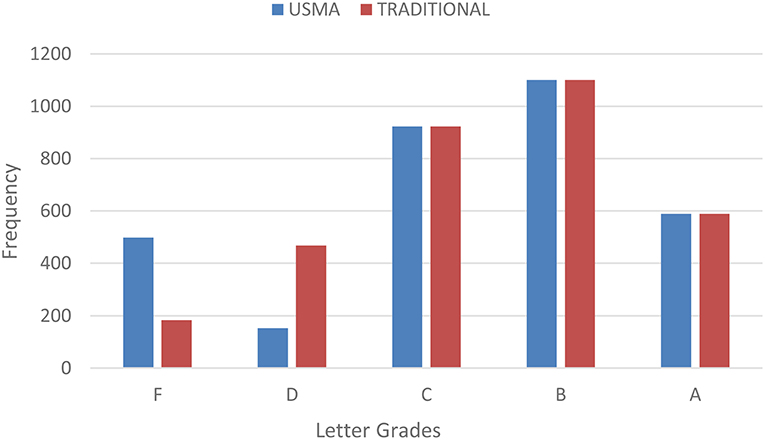
Figure 1. Distribution of letter grades for WPR1 by type of grading scale.
Results from WPR1 indicate that many cadets were assigned F grades using the USMA system who would have earned D grades with the more traditional grading scale used at many institutions of higher education in the United States. In fact, 315 cadets who earned F grades on the first WPR using the USMA scale would have earned D's using the more traditional scale. This means that 9.6% of all the cadets in the sample who took WPR1 fell within the range under scrutiny (60.0–66.9%). Using the USMA scale and cut-off scores for D's and F's, 498 cadets failed the WPR. However, use of the traditional grading scale indicates that only 183 of them scored <60.0%. These data suggest that 15.2% of the sample started the semester off having received a failing grade on the first major graded event even though the average score was a 78.96% on the WPR and more than half of the cadets who received an F would have earned a D under the more traditional scale.
The distribution for grades on WPR2 highly resembles that of WPR1. With the use of the traditional vs. USMA grading scale for D's and F's, there is almost a complete reversal of letter grades at the lower end of the scale. In this case, 245 cadets scored in the range under scrutiny. Using the USMA scale, 387 cadets failed. However, the traditional scale indicates that only 142 of them failed with <60.0%.
The distribution for WPR3 also resembles the previous two, though fewer cadets scored at the lower end of the scale altogether, and the mean score for the WPR was itself higher at 83.0%. In this case, 96 cadets scored in the range between 60.0 and 66.9%, and only 28 failed with <60.0%.
Results from WPR4 once again reflect the reversal pattern for D and F grades. In this instance, 310 cadets scored in the 60.0–66.9% range, which is 9.5% of the entire sample. Using the traditional scale, only 140 of 450 cadets failed with <60.0%, though all 450 received F grades using the USMA scale.
Scores on the TEE followed the same pattern as the WPRs. In this case, 148 cadets scored in between 60.0 and 66.9%. Under the USMA grading scale, 168 cadets failed the TEE. Using the traditional scale, only 28 cadets failed. In other words, only a very small number of cadets (0.86%) scored under 60.0% on the TEE in PL100.
The same pattern of results held true for FCPs. Many cadets who earned an F grade under the current USMA practice would have earned D grades under the more traditional grading scale. Although the absolute number of cadets who earned D's and F's as final course grades was small at 2.53% of the sample, which is likely due to compensation with higher scores on papers and daily quizzes and better performance on the TEE, only 4 of the 26 cadets who earned an F for the course failed at <60.0%. In other words, 84.62% of the cadets who had an F grade recorded on their transcripts for PL100 at USMA between the spring of 2015 and the fall of 2017 would have had a D grade recorded at any other institution of higher education in the United States that uses the more traditional grading scale.
Academic Program Scores (GPAs) for Hypothetical Cadet Pairs
The calculations of APSTs for several pairs of hypothetical cadets based on the USMA policy for how grade quality points are assigned are presented below. Five cases that include pairs of cadets illustrate how differences in FCPs for one or two courses are linked with corresponding APST outcomes. For the sake of simplicity, the hypothetical cadets enrolled in five courses and each course was worth three credit hours, even though most cadets carry more than 16 credit hours per semester and some courses are worth more than three credits.
Case 1
The first case shows how a pair of cadets who perform similarly in most of their classes (based on their FCPs or original percentage points they earned in their courses) seem appropriately dissimilar in their APST scores when one cadet underperforms by one grade step in the PL100 course. The performance difference is between the C grade and the C– grade, where the step down is associated with a 0.33 grade quality point difference. As can be seen in Table 3, the difference in APSTs is reasonable and in the expected direction given the FCPs. The difference in FCPs averaged across the set of courses is 0.02% and the resulting difference in APSTs is 0.07.
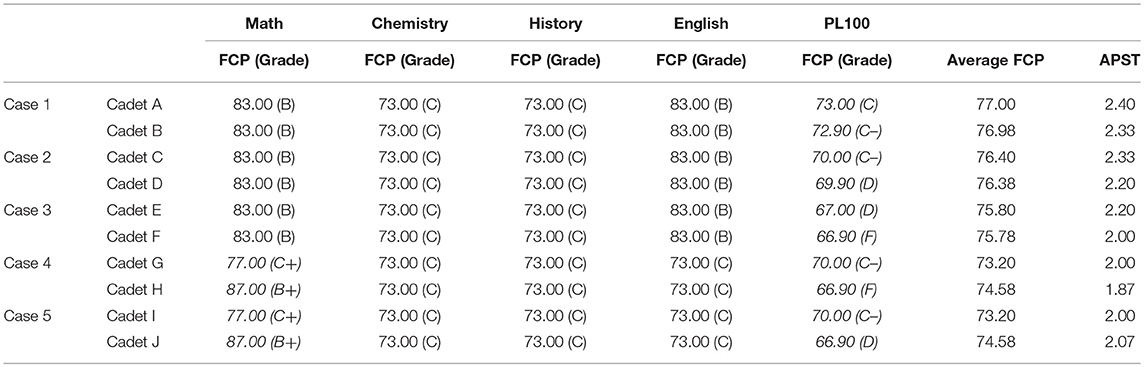
Table 3. Final course percentages and APSTs for five case comparisons.
Case 2
The second case also shows how a pair of cadets who perform similarly in most courses (based on their FCPs or original percentage points they earned in their courses) seem dissimilar in their APST scores when one cadet underperforms by one grade step in the PL100 course. The performance difference in this case, however, is between the C– grade and the D grade, where the step down is associated with a 0.67 grade quality point difference rather than 0.33 from the previous example. As can also be seen in Table 3, the difference in APSTs is in the expected direction given the FCPs, but now the 0.02% difference in average FCPs results in a difference of 0.13 in APSTs. This APST difference is almost twice the difference in Case 1, which was 0.07, even though the absolute difference in average FCPs remains the same, and quite small, at 0.02%.
Case 3
The third case shows how a pair of cadets who perform similarly in most classes (based on their FCPs or original percentage points they earned in their courses) seem highly dissimilar in their APST scores when one cadet underperforms by one grade step in the PL100 course and the change is from the D grade to the F. This step down in grades is associated with a full 1.00 grade quality point difference. Again, Table 3 shows that the difference in APSTs is in the expected direction given the FCPs, but now the 0.02% difference in average FCPs results in a difference of 0.20 in APSTs. This APST difference is almost three times greater than the difference in the Case 1, even though the absolute difference in average FCPs remains the same at 0.02%.
Case 4
In the next case, cadets perform dissimilarly. The first cadet's grades are all in the C+ to C– band. The second cadet outperforms the first by a full 10.0% in the Math course and earns a B+, but underperforms by 3.01% in the PL100 course and earns a F. Due to the higher penalty for grade quality points for performance at the lower end, this F grade disproportionately affects the APST. As can be seen in this example in Table 3, the difference in average FCPs is 1.38%, with the second cadet outscoring the first. However, the resulting APSTs are in the opposite direction. Due to the previously identified mathematical artifact built into the grade point allocation policy that heavily penalizes the steps down from a C– to a D to an F, the first cadet outscores the second by 0.13 points on the APST score; ironically, even though the average FCPs show that the second cadet earned more possible points and therefore is assumed to have achieved more, it is the second cadet whose performance will be reviewed by the Academic Board and considered for separation from USMA due to deficient academic performance. This example clearly illustrates the disproportionate penalty that some cadets who perform on the low end of the scale will experience when the current PL100 grading scale and USMA grade quality point allocation policy are combined. It also illustrates how the current system can even result in APSTs that might lead to some cadets being ordered in an illogical manner within the overall OML, which, among other things, affects their choices of different career branches in the Army, such as combat arms or aviation or finance.
Case 5
The final case example shows how expanding the D range and adding plus/minus grades for the D can help bring APSTs into more consistent alignment with FCPs. Assuming that the range of scores for the D grade were expanded to 60.0–69.9% and that plus/minus scoring were added to the D grades in the same proportional patterns and using similar quality point allocation patterns as are used for the other letter grades in the USMA scale, the problem seen in the Case 4 example can be corrected. As can be seen from this example in Table 3, the second cadet's average FCP and resulting APST fall more logically (and mathematically) into alignment with each other and when compared with the first cadet. The second cadet's underperformance in the PL100 class by 3.10% no longer hides the marked (and superior) 10.0% performance difference in the Math course, no longer results in a reversal of the two cadets on APSTs (and possibly within the OML), no longer triggers an Academic Board review, and no longer provides a potentially false signal to outsiders who review the transcript that the second cadet's overall performance that semester was holistically unsatisfactory. Although these case examples have been selected specifically to illustrate this point, it does not preclude the possibility that such outcomes might actually affect some cadets. Regardless of how likely or unlikely this may be, the fact that such outcomes are possible merits attention.
Discussion
Results from this study show that combining a restricted range for the D category with a grade quality point allocation policy that disallows plus/minus grades for the D category distorts grade distributions and heavily penalizes low-performing students. The restricted range grading scale yields irregular grade distributions, with the number of F grades more closely aligning to what would be the typical number of D grades using a traditional grading scale. Combined with the heavy quality point penalty that lowers APSTs by a greater margin than is mathematically consistent with the rest of the point allocations for grades, students are penalized twice and in a way that may have far-reaching, long-lasting consequences. At least part of this problem can be tied to the numerous steps involved in transforming original FCPs into ordinal letter grades and then transforming those letter grades into grade quality points on an ordinal scale that is treated as though it had interval properties. Thus, the combination of practices and policies that may be considered separately helpful in promoting excellence and curbing grade inflation appears to yield marked negative effects.
Kleinman et al. (2018) found that most institutions of higher education in the Northeast use a plus/minus grading system and this policy information was publicly available on their websites. However, decisions regarding grading scale practices, such as the use 67.0% as the minimum cut-off score for a D grade, more likely are left to the discretion of individual faculty and may vary widely from instructor to instructor. Individual instructors and administrators may not even be aware of the compound negative effects that may result from combining atypical grading scales with quality point allocation policies that treat ordinal data as interval data and that disallow plus/minus demarcations for the D category.
In fact, the decision regarding what cut-off score may be used in any given course may even be somewhat arbitrary. According to Sadler (2009):
…achievement standards are not out there somewhere, as if they were natural phenomena waiting to be discovered. They have no independent existence of their own, but have to be decided upon, essentially subjectively, after due deliberation and taking all relevant factors into account (p. 11).
That Sadler acknowledges there is some subjectivity in setting the standard is important, but what is more important is that he points to the need for thoughtful consideration and due deliberation regarding the relevant variables and context. There are numerous specific, and sometimes labor-intensive, methods for standard setting and deciding on cut-off scores which include, among others, the Angoff and bookmark methods studied by Çetin and Gelbal (2013), along with the borderline, relative, and holistic methods studied by Kaufman et al. (2000). Using a validated method for setting the standard is advisable regardless of what the final cut-off score turns out to be, as it promotes the defensibility and integrity of the final practice adopted. Using a high cut-off score for the D category may appear to be a valid approach to promoting or maintaining excellence, but should be benchmarked to ensure that the cut-off reflects a meaningful standard.
Ultimately, any grading system should reflect overall integrity (Sadler, 2009, 2012). Students and faculty should have a good understanding of what the various letter grades reflect about student achievement and why the cut-off scores have been set at certain points. The key stakeholders, especially the instructors who assign the grades, should understand the systems and how they interact, being able to defend their practices and policies as fair and appropriate. Key stakeholders should be open to examining grading practices and/or quality point allocation policies that not only penalize students who perform at the low end of the grading scale but that doubly penalize them.
Limitations
The current study has numerous limitations. For example, the study does not include an assessment of how administrators, faculty, cadets, or alumni perceive the current grading scale and quality point allocation policy in use or how they might view a potential change to either one or both. Though a change to a more traditional grading scale may be received well by some stakeholders, others may be more cautious. Traditions at USMA and other service academies are strong. The 67.0% cut-off for a D may be perceived as elevating USMA status and standards above those at other service academies and institutions. Changes to USMA academic policy likely would take much more time and would require additional deliberation, research, and discussion among stakeholders. To the extent that any changes in grading scales or broader academic policies tend to be made with good intentions, appropriate considerations of outcomes for a variety of stakeholders are still necessary. See Natali (2003) for a broader discussion of some of the legal issues involved and the myriad factors that may affect how different stakeholders, especially students, perceive changes in academic policies at universities.
Another limitation of the current study is that scores on papers and daily quizzes were not included. Initially, these graded events were excluded because they are considered to be more subjective than the WPRs and TEE, and because the types, lengths, and prompts for the papers have changed more than the other assessments that were included in the current study. However, the paper prompts and rubrics are reviewed and revised often to maintain rigor. The faculty meets regularly to calibrate grading with each other. Daily quizzes were excluded because they fall within the oversight of the individual instructors, and calibration efforts among faculty and standardization of the quiz questions has not been a primary focus within the PL100 Program. Given that the absolute number of cadets who failed the PL100 course was small when compared with the numbers who failed the WPRs, a subsequent study that evaluates grade distributions for papers and daily quizzes seems to be a logical extension. Some faculty may consciously, or unconsciously, compensate for lower scores on WPRs by assigning higher scores on papers or by making daily quizzes easier. Similarly, some cadets may exert extra effort on their papers, integrating instructor feedback from one or more drafts, to offset low WPR grades. The final course grades may reflect a combination of both.
As a necessary first step for understanding how the current grading scale in PL100 affects grade distributions and APSTs, the current study appears to achieve its purpose. However, many additional variables should be considered to better understand which cadets perform at the lower end of the scale, and whether specific variables may allow faculty to predict their at-risk status. The current study did not track or control for variables such as entrance exam scores, prior military service experience, gender, ethnicity, preparatory school experience, or status on athletic teams. A follow-up study that uses these sorts of variables as predictors or in some cases as control variables could yield valuable information regarding which cadets are at greatest risk for scoring at the lower end of the spectrum in PL100 or other core courses and who might be most affected.
Assessment of Options and Implications
Part of the essential work that academicians and educational administrators engage in is recognizing that all grading systems have advantages and disadvantages and need periodic review. Ensuring that the systems and practices at USMA not only promote excellence but display overall grade integrity, and amending them as may be needed, would help ensure internal alignment. This would also better serve cadets; they would be less likely to be inappropriately labeled as failing in their first year, which may undermine motivation and focus. Granted, some cadets might experience increased motivation to perform better if they receive an F for a 66.9% on WPR1 in PL100, but others may not. Shu and Lam (2011) found that success and failure feedback was differentially motivating for students who were high vs. low in a desire to achieve positive outcomes or to prevent negative outcomes. Students who were high in the desire to attain positive outcomes were highly motivated after success feedback but not failure feedback, while students high in the desire to prevent negative outcomes were more highly motivated after failure feedback. If USMA is using a developmental model rather than an attrition one, then signaling subpar performance with a D for a 60.0–66.9% may be sufficiently motivating for at least some portion of the cadets. Although the importance of cadets' actual performance logically outweighs the importance of how cadets feel about their performance ratings, one cannot dismiss the powerful role that negative feedback and labeling have in the performance cycle. Possible differences in motivational outcomes could be studied empirically.
Especially important to note, changing the cut-off scores for the D grade to 60.0% would not inflate course averages. By default, any changes to the range of values that could earn the D letter grade in the future would not mathematically affect actual points earned in the course or the average number of points earned across all cadets; but the resulting letter grade assigned would change. In fact, opening the D range to a wider set of values may result in somewhat lower course averages in the future, as instructors may make greater use of the available range of low scores for the D when grading subjective assignments. Instructors who grade papers and evaluate a paper as a “D” from a holistic perspective currently must assign at least a 67.0%, though they may be inclined to assign as low as a 60.0% if the grade were still recorded as a D rather than an F. On the other hand, changes to the D grade cut-off likely would affect APSTs by bringing them slightly higher but also making them more logically and mathematically aligned with the FCP averages as indicators of performance.
Adopting the more traditional cut-off score for D grades may also yield other types of benefits. For example, fewer cadets might be considered for separation due to academic performance during a time when the Army may need to commission more officers. Given the rigorous screening and selection process for USMA admissions, one can argue that cadets admitted to USMA have a high likelihood of success or they would not be admitted; even cadets who perform at the low end of the scale may still have a high probability of being successful Army officers who are retained over time. Still, the adjustment during their first year can be challenging, especially for cadets who were top performers in the past but who find themselves suddenly earning low grades.
Part of the problem also may be in the numerous steps involved in moving mathematically from FCPs to APSTs, where the multi-step process outlined previously amplifies differences at the lower end. One suggestion is that stakeholders consider whether adopting the plus/minus system within the D range combined with the lower cut-off score of 60.0% for the D might satisfactorily resolve the issues of concern. Doing so would help better differentiate among cadets performing at the lower end of the scale and simultaneously provide them with incentives for moving their performance from the D– to the D or D+ range. More importantly, it would help correct the inconsistencies in both the grading scale and the quality point allocation system, as demonstrated in the results of Case 5 in this study. Volwerk and Tindal (2012) suggest that providing some incentive for students who are performing poorly to keep trying might help prevent them from giving up entirely, which surely would be beneficial for cadets who must repeat a course in a later semester.
Certainly, some key stakeholders may perceive a move to change the cut-off scores for the D and F grades as a move to unequivocally lower standards at USMA. One could argue, however, that such an adjustment would be for the betterment of the integrity of the grading systems as a whole. There likely still will exist individuals who fail to meet the minimum standards and who should be separated, regardless of where the minimum cut-off score is set. Adopting the more traditional approach, though, could allow USMA to retain cadets who likely would become officers at one of the other service academies or through other means of commissioning but who are separated at USMA. There does not appear to be conclusive evidence that cadets who score between 60.0 and 66.9% in PL100 perform significantly worse as Army officers than cadets who score 67.0–69.9%, though this is an important topic for future study.
If the higher cut-off score is maintained in order to ensure that all cadets perform at a higher level, then the other grade bands could be compressed. Currently, the band for A, B, and C grades are all three times larger than for D grades. Retaining the 67.0% cut-off score but then proportionally redividing the grading bands within the compressed set of values between 67.0 and 100.0% may appear to fix the irregular distribution of scores but would likely have a serious deflating effect on APSTs by lowering them dramatically. The use of a proportional but compressed overall scale would move a large number of cadets from the A range down to the B, from the B range down to the C, and from the C range down to the D. This overall downward movement might trigger efforts on the part of faculty to “protect” cadets from the lower grades, which, ironically, could lead to grade inflation.
As previously indicated, grading practices and systems should reflect an acceptable level of trustworthiness to outsiders. If USMA stakeholders review the current approach and decide to retain the restricted range scale, they might also consider a move to define and describe the uncommon, atypical grading scheme for D and F grades on the transcript itself. Doing so would allow outsiders who may review a USMA cadet's transcript (in order to make decisions about the cadet's opportunities for future jobs, acceptance to graduate school, or selection for a competitive program) to make their decisions with these circumstances in mind. Imose and Barber (2015) outline some of the many ways that GPAs are used as a selection tool for job applicants and how using GPAs may affect workforce diversity. Certainly, a student's GPA is one important factor in garnering prestigious scholarships or admission to graduate education programs, so the need to provide stakeholders with relevant information about its contextual grounding at USMA is critical.
Alternative courses of action include abandoning letter grades altogether, either in favor of narrative descriptions of achievement or by transforming FCPs directly into GPAs without ever converting them to letter grades, or abandoning the use of GPAs in favor of other means of representing patterns of student achievement in courses. Volwerk and Tindal (2012) argue that FCPs should be directly translated into a 4-point linear scale without any interim steps involving letter grades. This would allow for differentiation at both the top and bottom ends of the scale, but without any means of factoring in the difficulty of the individual courses or the variation in performance, combining FCPs on a 4-point scale to create a composite index of achievement is still problematic. Brown and Van Niel (2012) propose a way to calculate an adjusted class rank using z-scores. Stricker et al. (1994) propose adjusting GPAs to account for variations in grading standards and course difficulty by using regression. Perhaps a combination of these approaches would be worth investigating in a future study.
On the other hand, some colleges and universities in the U.S. have adopted creative approaches to assessment and communicating information to students and outsiders regarding levels of student achievement. For example, some colleges and universities provide only narrative descriptions of student achievement, which likely is time consuming for faculty and may be impractical to implement. Soh (2010) proposes an attractive alternative that is potentially less cumbersome, which is the idea of providing both a grade profile (GP) and a grade index (GI) for each student rather than a single number, such as the GPA. The GP is akin to a report of all course grades, such as what an official transcript would include. Although the traditional GPA tends to mask deficiencies (Volwerk and Tindal, 2012), the grade profile shows the general pattern of letter grades across the student's entire tenure at the school. The GI would represent the modal letter grade as the measure of central tendency but also include information about the range of grades. For example, a student who most commonly scored C grades, but had one A+ and one F would have a GI of C (A+/F). A student who had mostly C grades but had the highest grade of B– and lowest of C– would have a GI of C (B–/C–). Thus, the GI provides information about how variable the student's performance was across the set of courses. The combination of both the GP and GI would be most informative, but the issue of how to appropriately calculate class rank based on either one is unclear.
Actionable Recommendations
Given the results of the current study and the review of several potential options, the first course of action recommended is to conduct a standard-setting study to establish the minimum cut-off score in the PL100 course at USMA. Student performance records at USMA stretch back several decades and within the records there exist both academic performance scores and military performance scores. Access to this rich information would allow researchers to determine how well performance scores in PL100 (or any USMA course) predict future military performance in a variety of domains. At a minimum, results from the study could help inform what the standard should be for the passing score in the course.
The second recommendation is to conduct a retrospective study using cadet performance data over their 4 years of study at USMA to evaluate how much APSTs and APSCs for USMA cadets would have changed if PL100 (or other classes at USMA) used an expanded D grade range and the +/− demarcations. Such a study could also include information about actual and re-ordered Order of Merit rankings to evaluate what sorts of changes, if any, would likely result. Although conducting a retrospective study would not account for how stakeholders might feel about implementing changes such as +/– demarcations for the D grade in the future and would not track second and third order effects of doing so, it is a logical next step.
A final recommendation is to encourage more dialogue at USMA, or at any institution that relies on GPAs, regarding the problems that make it difficult to rely on and interpret GPAs and to consider viable alternatives. Although the idea of abandoning letter grades entirely in favor of narratives is attractive from an idealistic perspective, it is more likely that considering how z-scores and regression might be implemented so that GPAs do, at least to some extent, include markers of how difficult a course or major might be would garner more serious attention from stakeholders.
Conclusion
This study demonstrates how combining a restricted range for D grades with a policy that heavily penalizes low grades in GPA calculations disproportionately affects low-performing students. Although these systems may promote excellence and help differentiate among high-performing students, they become problematic when combined. Increased awareness of these types of issues should prompt a careful, deliberate review by key stakeholders at any institution of higher education to evaluate whether the current practices and systems in use may disproportionately penalize low-performing students or lack sufficient integrity to be retained.
Data Availability
The datasets for this study will not be made publicly available because they belong to the USMA and cannot be released without authorization. Requests to access the datasets should be directed to the author at ZWxpemFiZXRoLndldHpsZXJAd2VzdHBvaW50LmVkdQ==.
Author's Note
This paper was completed and submitted in partial fulfillment of the Master Teacher Program, a 2-year faculty development program conducted by the Center for Faculty Excellence, United States Military Academy, West Point, NY, 2018.
Author Contributions
The author confirms being the sole contributor of this work and has approved it for publication.
Disclaimer
The views expressed herein are those of the author and do not reflect the position of the United States Military Academy, the Department of the Army, or the Department of Defense.
Conflict of Interest Statement
The author declares that the research was conducted in the absence of any commercial or financial relationships that could be construed as a potential conflict of interest.
References
Barnes, K., and Buring, S. (2012). The effect of various grading scales on student grade point averages. Am. J. Pharm. Educ. 76:41. doi: 10.5688/ajpe76341
Brown, P. H., and Van Niel, N. (2012). Alternative class ranks using z-scores. Assess. Eval. Higher Educ. 37, 889–905. doi: 10.1080/02602938.2011.581749
Çetin, S., and Gelbal, S. (2013). A comparison of Bookmark and Angoff standard setting methods. Educ. Sci. Theory Pract. 13, 2169–2175. doi: 10.12738/estp.2013.4.1829
Chansky, N. M. (1964). A note on the grade point average in research. Educ. Psychol. Meas. 24, 95–99. doi: 10.1177/001316446402400109
Cushman, T. (2003). Who best to tame grade inflation? Acad. Questions 16, 48–56. doi: 10.1007/s12129-003-1063-1
Dalziel, J. (1998). Using marks to assess student performance: some problems and alternatives. Assess. Eval. Higher Educ. 23, 351–366. doi: 10.1080/0260293980230403
Donaldson, J. H., and Gray, M. (2012). Systematic review of grading practice: is there evidence of grade inflation? Nurse Educ. Pract. 12, 101–114. doi: 10.1016/j.nepr.2011.10.007
Handley, F. J., and Read, A. (2017). Developing assessment policy and evaluating practice: a case study of the introduction of a new marking scheme. Perspect. Policy Pract. Higher Educ. 21, 135–139. doi: 10.1080/13603108.2015.1128490
Imose, R., and Barber, L. K. (2015). Using undergraduate grade point average as a selection tool: a synthesis of the literature. Psychol. Manag. J. 18, 1–11. doi: 10.1037/mgr0000025
Kaufman, D. M., Mann, K. V., Muijtjens, A. M., and van der Vleuten, C. P. (2000). A comparison of standard-setting procedures for an OSCE in undergraduate medical education. Acad. Med. 75, 267–271. doi: 10.1097/00001888-200003000-00018
Kleinman, S., Leidman, M., and Longcore, A. (2018). The changing landscape of grading systems in US higher education. Perspect. Policy Pract. Higher Educ. 22, 26–33. doi: 10.1080/13603108.2017.1279692
Natali, M. J. (2003). Judicial deference and university academic policy modifications: when should courts intervene on behalf of injured students. Indiana Law Rev. 37, 503–544.
Rust, C. (2011). The unscholarly use of numbers in our assessment practices: what will make us change? Int. J. Scholarship Teach. Learn. 5:4. doi: 10.20429/ijsotl.2011.050104
Sadler, D. R. (2009). Grade integrity and the representation of academic achievement. Stud. Higher Educ. 34, 807–826. doi: 10.1080/03075070802706553
Sadler, D. R. (2012). Assessment, evaluation and quality assurance: implications for integrity in reporting academic achievement in higher education. Educ. Inq. 3, 201–216. doi: 10.3402/edui.v3i2.22028
Shu, T. M., and Lam, S. F. (2011). Are success and failure experiences equally motivational? An investigation of regulatory focus and feedback. Learn. Individ. Differ. 21, 724–727. doi: 10.1016/j.lindif.2011.08.002
Soh, K. C. (2010). Grade point average: what's wrong and what's the alternative? J. Higher Educ. Policy Manag. 33, 27–36. doi: 10.1080/1360080X.2011.537009
Stricker, L. J., Rock, D. A., Burton, N. W., Muraki, E., and Jirele, T. J. (1994). Adjusting college grade point average criteria for variations in grading standards: a comparison of methods. J. Appl. Psychol. 79:178. doi: 10.1037/0021-9010.79.2.178
United States Military Academy (2016). Academic Program. Available online at: https://westpoint.edu/sites/default/files/pdfs/RedBook_GY2020_20170803.pdf (accessed March 21, 2019).
Volwerk, J. J., and Tindal, G. (2012). Documenting student performance: an alternative to the traditional calculation of grade point averages. J. College Admission 216, 16–23.
Wilamowsky, Y., Dickman, B., and Epstein, S. (2008). The effect of plus/minus grading on the GPA. J. College Teach. Learn. 5, 1–8. doi: 10.19030/tlc.v5i9.1228
Keywords: grade, grade inflation, grading scale, GPA, grade penalty
Citation: Wetzler EL (2019) How Using a Restricted Grading Range Distorts GPAs and Disproportionately Penalizes Low-Performing Students. Front. Educ. 4:23. doi: 10.3389/feduc.2019.00023
Received: 10 November 2018; Accepted: 04 March 2019;
Published: 29 March 2019.
Edited by:
Christopher Charles Deneen, Royal Melbourne Institute of Technology (RMIT University), AustraliaReviewed by:
Timothy Mark O'Leary, University of Melbourne, AustraliaChristopher Desjardins, University of Minnesota Twin Cities, United States
Copyright © 2019 Wetzler. This is an open-access article distributed under the terms of the Creative Commons Attribution License (CC BY). The use, distribution or reproduction in other forums is permitted, provided the original author(s) and the copyright owner(s) are credited and that the original publication in this journal is cited, in accordance with accepted academic practice. No use, distribution or reproduction is permitted which does not comply with these terms.
*Correspondence: Elizabeth Leigh Wetzler, ZWxpemFiZXRoLndldHpsZXJAd2VzdHBvaW50LmVkdQ==