- 1Department of Kinesiology and Educational Psychology, Washington State University, Pullman, WA, United States
- 2Department of Educational Psychology, Ball State University, Muncie, IN, United States
- 3Department of Educational Leadership, Evaluation and Organizational Development, University of Louisville, Louisville, KY, United States
Research has demonstrated that when data are collected in a multilevel framework, standard single level differential item functioning (DIF) analyses can yield incorrect results, particularly inflated Type I error rates. Prior research in this area has focused almost exclusively on dichotomous items. Thus, the purpose of this simulation study was to examine the performance of the Generalized Mantel-Haenszel (GMH) procedure and a Multilevel GMH (MGMH) procedure for the detection of uniform differential item functioning (DIF) in the presence of multilevel data with polytomous items. Multilevel data were generated with manipulated factors (e.g., intraclass correction, subjects per cluster) to examine Type I error rates and statistical power to detect DIF. Results highlight the differences in DIF detection when the analytic strategy matches the data structure. Specifically, the GMH had an inflated Type I error rate across conditions, and thus an artificially high power rate. Alternatively, the MGMH had good power rates while maintaining control of the Type I error rate. Directions for future research are provided.
Introduction
Measurement invariance (MI) is recognized as a critical component toward building a validity argument to support test score use and interpretation in the context of fairness. At the item-level, MI indicates that the statistical properties characterizing an item (e.g., difficulty) are equivalent across diverse examinee groups (e.g., language). As such, it represents a critical aspect of the validity of test data, particularly for ensuring the comparability of item and total scores to guide decisions (e.g., placement) across examine groups. Differential item functioning (DIF) is a direct threat to the MI of test items and occurs when item parameters differ across equal ability groups, resulting in the differential likelihood of a particular (e.g., correct) item response (Raju et al., 2002). DIF detection generally focus on the identification of uniform and nonuniform DIF, where uniform DIF refers to differential item difficulty across equal ability groups, and nonuniform DIF refers to inequality of the discrimination parameters across groups, after matching on ability. DIF studies are encouraged by the Standards for Educational and Psychological Tests (American Educational Research Association et al., 2014), and follow sound testing practices.
Considerable attention has been focused on the development and evaluation of DIF detection methods to identify potentially biased test items (Osterlind and Everson, 2009). The outcome of this work, for example, has provided a basis to judge the efficacy of these methods to detect DIF among dichotomously (Holland and Thayer, 1988; Narayanan and Swaminathan, 1996) and polytomously (French and Miller, 1996; Williams and Beretvas, 2006; Penfield, 2007) scored items. An extension of this work is testing their effectiveness to detect DIF under multilevel data structures (Luppescu, 2002; French and Finch, 2010, 2012, 2013; Jin et al., 2014). Hierarchical data structures, such as students nested in classrooms, are common in educational testing settings (O'Connell and McCoach, 2008). Consequently, the non-independence of observations in multilevel data can result in inflated Type I error rates (Raudenbush and Bryk, 2002), which can result in invalid inferences of DIF detection methods. Whereas adjusted DIF detection procedures (e.g., Mantel-Haenszel [MH], logistic regression [LR]) have been evaluated for dichotomously scored test items (French and Finch, 2012, 2013; Jin et al., 2014), the purpose of this study was to address the literature gap on the use of the generalized Mantel-Haenszel (GMH) procedure for DIF detection of polytomously scored test items in multilevel data.
DIF Assessment for Polytomous Item Response Data Using the Generalized Mantel-Haenszel Statistic
There exist a large number of DIF detection methods for diverse types of item data, several of which have been studied and compared (e.g., Narayanan and Swaminathan, 1996; Penfield, 2001; Kistjansson et al., 2004; Finch, 2005; Woods, 2011; Oliveri et al., 2012; Jin et al., 2014). In the context of polytomous item response data, which is the focus of this study, one of the most proven of these methods is the GMH statistic. Holland and Thayer (1988), and Narayanan and Swaminathan (1996), applied the MH to DIF detection with dichotomous items. Subsequently, it has been used for investigating the presence of DIF with polytomous items, and been shown to be a useful tool for that purpose (Penfield, 2001). The MH procedure is an extension of the chi-square test of association, allowing for comparison of item responses between the focal and reference groups conditioning across multiple levels of a matching subtest score. When testing the null hypothesis of no DIF, the MHχ2 statistic is used (Holland and Thayer, 1988):
where
In Equations (1) and (2), Aj – E(Aj) is the difference between the observed number of correct responses for the reference group on the item being studied for DIF (A) and the expected correct number, nRjand nFj are the sample sizes for the reference and focal group, respectively, at score j of the matching subtest, m1j and m0jrepresent the number of correct and incorrect responses, respectively, at j matching subtest score, and T represents the total number of examinees at matching subtest score j. This statistic is distributed as a chi-square with one degree of freedom and tests the null hypothesis of no uniform DIF. This statistic can be readily extended to accommodate items with more than two categories (Penfield, 2001).
Adjusted MH Test Statistic Method
French and Finch (2013) identified a promising set of adjustments for the MH statistic for DIF detection in the context of multilevel data. Their work was based on an earlier effort by Begg (1999) who demonstrated how the standard MH test statistic could be adjusted to account for multilevel data. The Begg MH (BMH) technique is based on the observation that the score statistic obtained from logistic regression is equivalent to the MH test statistic when the intraclass correlation (ICC) is equal to 0 (see Begg, 1999). Therefore, the variance associated with the logistic regression score statistic is proportional to the variance of the MH test statistic used for DIF detection. Notably, it is the variance and standard error of the MH test statistic that is underestimated in the presence of multilevel data. Given this relationship between the score statistic MH variances, BMH adjusts the MH test statistic by the ratio of the score statistic variance estimated using a logistic regression model accounting for the multilevel data structure with the generalized estimating equation (GEE) to the naïve score statistic variance that does not account for the multilevel nature of the data. The naïve and GEE-based logistic regression models both take the form:
For the naïve LR model, the covariance matrix for the dependent variable with respect to clusters is the identity matrix, in which the off-diagonal elements are 0, reflecting no clustering effects on the outcome (i.e., ICC = 0). The GEE model estimates the off-diagonal elements of the covariance matrix, thus accounting for within cluster correlations among responses. In this case, the unstructured covariance matrix is estimated, meaning that a unique covariance was estimated for each cluster. For both naïve LR and GEE, the variances of the score statistic are obtained and used to calculate their adjustment factor, which appears in Equation (4) below.
If the ICC is 0 in the population, then this ratio will be near 1 for the sample. However, as the within cluster correlation among observations increases so does , f will also increase in value, reflecting the overestimation of the score statistic variance in the presence of multilevel data. The f ratio can then be used to adjust the MH test statistic as seen in Equation (5).
MH is the standard MH chi-square test statistic. As noted above, when the within-cluster correlations are large, will be larger than , leading to a value of f that is relatively large and positive, which, will lead to a larger value of f , which when applied in Equation (5) will decrease the size of MHB relative to MH. This will correct for the within cluster correlation induced by the multilevel data structure.
The use of the MHB statistic for dichotomous DIF detection demonstrated that while it was very effective at controlling the Type I error rate in the presence of multilevel data, it exhibited markedly lower power for relatively small sample sizes, and lower levels of DIF (French and Finch, 2013). Thus, it was suggested that alternative adjustments to f be considered. These alternatives included multiplying f by 0.85 (BMH85), 0.90 (BMH9), or 0.95 (BMH95) to reduce the amount of the correction. These adjustments were selected through an iterative process of experimentation with the method, and validation using Monte Carlo simulations (French and Finch, 2013). Empirical results of the simulation study involving dichotomous data showed that the standard BMH statistic, as well as the BMH95 and BMH9 statistics, were able to maintain the nominal Type I error rate across all study conditions. However, they also demonstrated lower power than MH across many of these same data conditions. On the other hand, MH consistently displayed inflated Type I error rates in the presence of multilevel data for testing DIF with a between clusters variable. The BMH85 statistic offered a reasonable compromise for DIF in the presence of multilevel data, particularly when the ICC was 0.25 or greater given Type I error inflation never exceeded 0.093 (compared to Type I error rates in excess of 0.20 for MH), and it maintained power rates close to MH.
Goals of the Current Study
The goal of this study was to examine the performance of the Begg adjusted methods for MH in the context of polytomous item data and build upon the foundation laid with dichotomous items. Given that the GMH approach has been shown to be an effective DIF detection tool for polytomous data, it was of interest to ascertain how well an adjusted version of the statistic would work in the context of multilevel data, using the Begg adjustment based methods outlined above (i.e., BGMH85, BGMH9, and BGMH95). It was expected that BGMH85 would perform best of the options compared. Thus, the current simulation study examined the Type I error and power rates for DIF detection with polytomous items using GMH, BGMH85, BGMH9, and BGMH95 across manipulated factors (e.g., grouping variable, ICC, subjects per cluster).
Methods
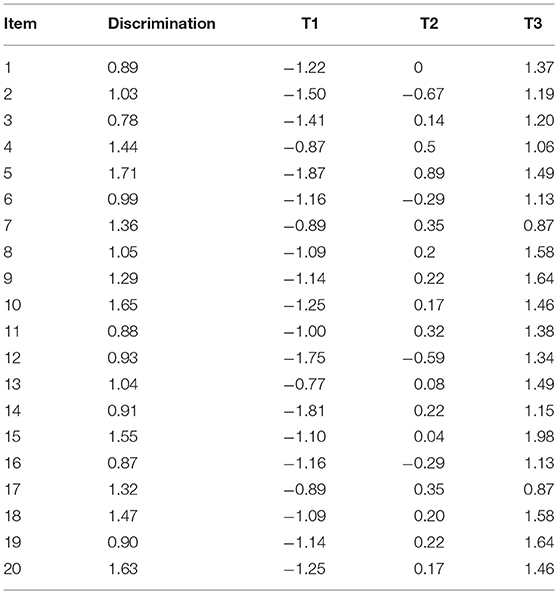
A simulation study (1,000 replications) using SAS (V9.3) compared the performance of the BGMH adjustments to standard GMH for DIF detection with polytomously scored items. Outcome variables of interest included Type I error and power rates across manipulated factors, including: grouping variable, ICC, number of clusters, sample size per cluster, and DIF magnitude. We note that the standard equation for the ICC is different for ordinal variables where the within variance is a constant (i.e., 3.29, Heck et al., 2013). Data were simulated using a multilevel graded response model (MGRM; e.g., Fox, 2005; Kamata and Vaughn, 2011), with item threshold parameters and discrimination values appearing in Table 1. The model can be defined using Kamata and Vaughn's general example:
Where
The latent traits are assumed to be distributed as follows:
This would give the probability of obtaining a certain score or higher and the probability of obtaining a certain category would be computed as the difference between this probability of x or higher and the probability of responding in category x + 1 or higher (e.g., Natesan et al., 2010; Kamata and Vaughn, 2011).
For all simulations, 20 items were simulated, each with 4 response levels, and a purified scale score was used for matching purposes. This latter condition was used to allow for the isolation of the impact of multilevel data, exclusive of other factors that might influence the performance of GMH and the adjustments (e.g., contaminated scale). DIF was simulated for a target item, with magnitudes as described below. In the calculation of the MH statistics, purified raw test scores were used for matching purposes.
Manipulated factors
Grouping Variable
Two grouping variable conditions were simulated: (1) within-cluster (e.g., examinee gender), or (2) between-cluster (e.g., teaching method, teacher gender), consistent with previous research on DIF detection within multilevel data structures (French and Finch, 2013; Jin et al., 2014).
Intraclass Correlation (ICC)
For the studied item and total score, the ICCs were set at five levels: 0.05, 0.15, 0.25, 0.35, and 0.45. These values were in accord with estimates obtained from large national databases (Hedges and Hedberg, 2007), and reflect values observed in practice (Muthén, 1994).
Number of Clusters
The number of simulated level-2 clusters included: 50, 100, and 200. Prior studies (Muthén and Satorra, 1995; Hox and Maas, 2001; Maas and Hox, 2005; French and Finch, 2013) have used similar values.
Number of Subjects Per Cluster
Clusters were simulated to be of equal size, taking the values 5, 15, 25, and 50. These values match those used in previous research (Muthén and Satorra, 1995; Hox and Maas, 2001; Maas and Hox, 2005; French and Finch, 2013).
DIF Magnitude
Four levels of DIF magnitude were simulated for the target item, based on prior DIF simulation for polytomous items (Penfield, 2007), and included: 0, 0.4, 0.6, and 0.8. Uniform DIF was specified by simulating differences in item each threshold parameter value for the target item, between the groups. In other words, the DIF magnitude value was added to each of the threshold values (Table 1) on the target item for the focal group. The focus was on uniform DIF as the MH procedure is not accurate with non-uniform DIF. In addition, uniform DIF tends to occur with greater frequency in assessments compared to non-uniform DIF, as reflected in simulation work (Jodoin and Gierl, 2001; French and Maller, 2007), and applied work (e.g., Maller, 2001). Each replicated dataset per condition was analyzed using standard GMH and the MGMH methods outlined above.
Analysis
To determine which manipulated factors influenced the power and Type I error rates, repeated measures analysis of variance (ANOVA) was used, per recommendations for simulation research (Paxton et al., 2001; Feinberg and Rubright, 2016). A separate such analysis was conducted in which the Type I error or power rates averaged across replications for each combination of conditions served as the dependent variables. The manipulated factors described above, and their interactions, served as the independent variables in the model. In addition to statistical significance of these model terms, the η2 effect size was also reported. We also focus on a visual display of the results to enhance comprehension and efficiency (McCrudden et al., 2015) compared to displaying many tables.
Results
Type I Error Rate
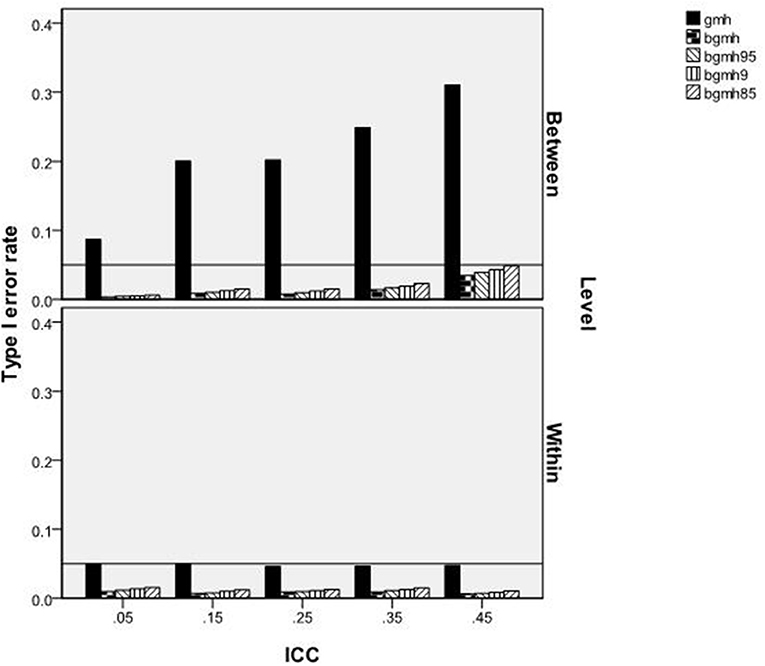
The ANOVA results identified two terms significantly related to the Type I error rate of the GMH and Begg adjusted procedures. These included the 3-way interaction of the test statistic by ICC by grouping variable for which DIF was tested [F(12, 219) = 33.749, p < 0.001, η2 = 0.646], and the 3-way interaction of test statistic by cluster size by grouping variable for which DIF was tested [F(12, 219) = 8.752, p < 0.001, η2 = 0.324). Figure 1 shows the Type I error rates of the statistical tests by the ICC and the grouping variable being tested for DIF. When this variable was at the within-cluster level (e.g., gender), the Type I error rate of the GMH test adhered to the nominal 0.05 level, regardless of the size of the ICC. Similarly, error rates of the Begg adjusted statistics were conservative, fell below the 0.05 level, and were not affected by ICC level. For the between-cluster grouping variable, GMH had inflated Type I error rates well beyond the 0.05 level and increased with ICC values. For the Begg adjusted values, Type I error rates increased slightly across ICC conditions but, nonetheless, were at or below the nominal level.
Figure 2 displays the Type I error rates for each statistical test by cluster size and grouping variable. As shown, when the grouping variable was within-cluster, the Type I error rates of all statistical methods, including the standard GMH, were at or below the nominal level of 0.05. For the Begg corrected tests, the error rate was always below 0.05, and declined with increases in the sample size per cluster. In contrast, when the variable was between-cluster, the Type I error rate for GMH was always greater than the 0.05 level, and increased concomitantly with increases in sample size per cluster. Contrary, the Begg corrected tests maintained error rates below the 0.05 level and decreased with increases in the sample size per cluster.
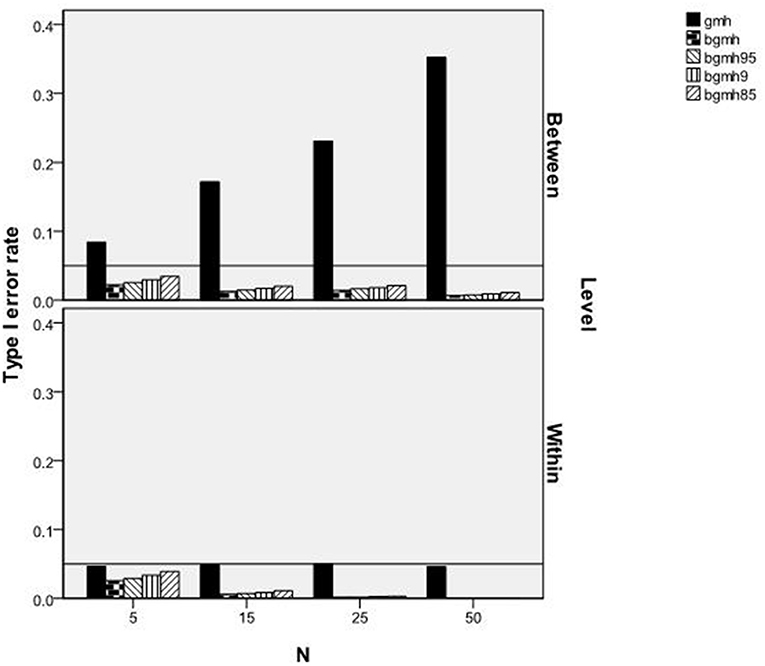
Figure 2. Type I error rates of GMH and BGM test statistics by sample size per cluster and level of variable.
Power
As with the Type I error rate, a repeated measures ANOVA was used to identify the significant main effects and interactions of the manipulated factors in terms of their impact on power rates. The interaction of ICC by method [F(16, 1, 160) = 6.147, p < 0.001, η2 = 0.078], the interaction of level of variable by amount of DIF by method [F(8, 576) = 15.368, p < 0.001, η2 = 0.176], and the interaction of number of clusters by sample size per cluster by method [F(24, 1, 160) = 4.492, p < 0.001, η2 = 0.085] were each significantly related to power.
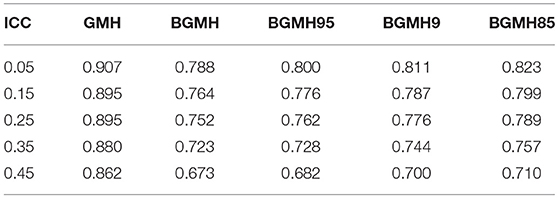
Table 2 reports power rates by method and ICC. Importantly, given the inflated Type I error rates in the between-cluster variable condition, power results for GMH must be interpreted with caution. Only when the ICC = 0.05 were the power rates for the Begg adjusted methods >0.80. Consequently, across the test statistics, power to detect DIF decreased with higher ICC values. Specifically, for the standard GMH, the decline in power from an ICC of 0.05 to 0.45 was approximately 0.045, whereas the Begg adjusted methods decline was 0.11.
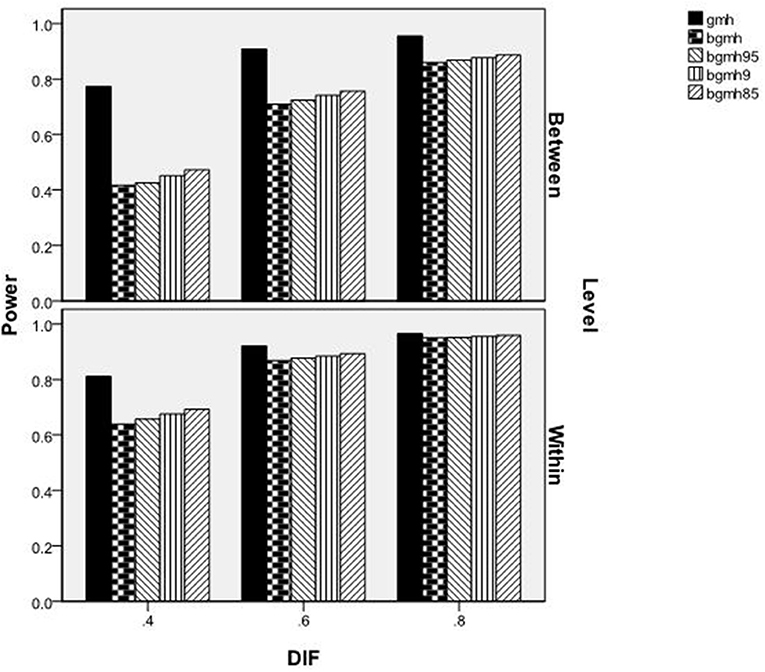
Figure 3 reports power rates by the level of the variable (between, within), amount of DIF, and statistical test. As shown, for each test statistic, power increased concomitantly with increases in the amount of DIF present in the data. Furthermore, power rates were lower for the between-levels variable for all methods, except for GMH with DIF = 0.80, in which case power was approximately 1.0 across conditions. The GMH statistic had a distinct power advantage over the Begg adjusted methods for between- and within-level variables when DIF = 0.40, and for between-level variables when DIF = 0.60. At the two highest DIF levels, power for BGMH85 (the adjusted method with the highest power rates) was approximately equal to that of GMH for the within-cluster variable. However, power for all of the adjusted methods was at least 0.07 lower than that of GMH in the between-cluster variable condition. As previously noted, however, power rates for GMH in the between-cluster condition must be interpreted with caution, due to inflated Type I error rates.
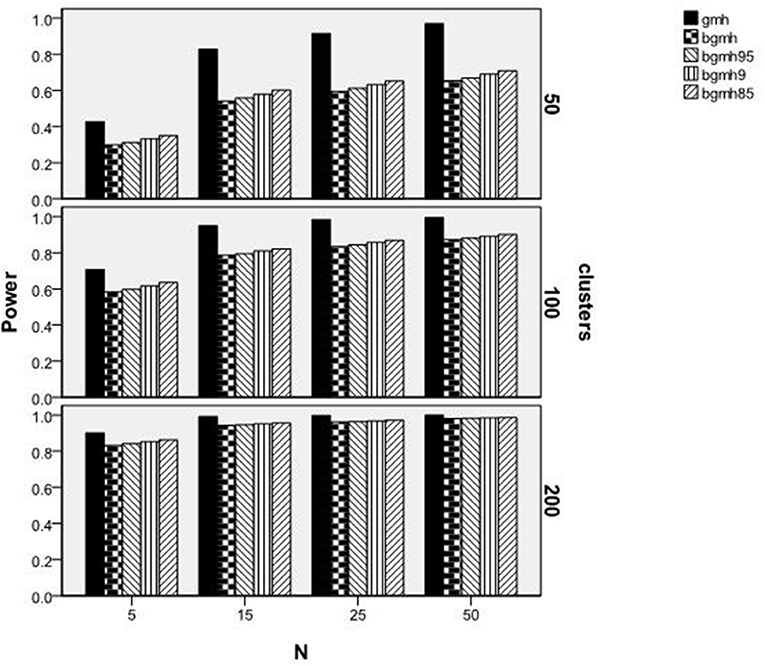
Figure 4 displays power rates by statistical test, number of clusters, and sample size by cluster. Again, given the Type I error inflation for GMH that was reported earlier, these results must be interpreted with caution. For all of the methods studied here, power was higher with larger sample sizes and, for most conditions, power was greater for GMH when compared to the Begg adjusted methods. In addition, with more clusters the difference in power between GMH and the adjusted methods declined. For example, for the 100 clusters with 25 members per cluster condition and the 50 clusters with 50 members per cluster, both had a total sample size of 2,500. In both conditions, power for the GMH statistics was ~0.98. However, for the Begg adjusted methods, the power in the 50 clusters condition was ~0.20 lower than in the 100 clusters condition, despite that the total sample sizes for the two cases were identical. Indeed, for the 100 clusters with 25 members per cluster case, the power for BGMH85 was 0.08 lower than that of GMH, whereas it was 0.27 lower in the 50 clusters with 50 members per cluster condition. This example demonstrates the nature of the interaction among method, number of clusters, and cluster size; namely, that with more clusters the power of the Begg adjusted methods was greater, regardless of total sample size. Finally, in the presence of 200 clusters, the difference in power rates of the GMH and Begg adjusted methods were always <0.05, regardless of cluster size.
Discussion
The goal of this study was to investigate the performance of the GMH and adjusted Begg methods for the detection of uniform DIF for polytomous test items in the presence of multilevel data. As such, it sought to extend the availability of DIF procedures to the context of multilevel data gathered on examinees grouped in clusters (e.g., classrooms, schools). The availability of multilevel statistical procedures ensures that analyses align with the data structure to ensure valid inferences to guide decisions (Raudenbush and Bryk, 2002; O'Connell and McCoach, 2008). Screening educational tests for DIF is an important step toward ensuring the accuracy of inferences based on between-group score differences within (e.g., language) and/or between clusters (e.g., schools). Furthermore, it is a critical step toward promoting fair testing practices in that tests function similarly across diverse examinee groups (American Educational Research Association et al., 2014). Therefore, it is crucial that appropriate DIF detection procedures exist to identify items that perform differentially for subgroups, when item response data are collected in a multilevel framework.
The Type I error rates of GMH and the Begg adjusted methods differed according to the manipulated factors. In particular, the statistical significance of separate 3-way interactions indicated that the GMH procedure had inflated Type I error rates for specific conditions, whereas the Begg adjusted methods were more conservative and, in general, adhered to the nominal alpha level. Specifically, the procedures differed based on the grouping variable and ICC. For the within-cluster condition, all procedures reported Type I error rates at or below the nominal level, with the Begg adjusted methods being slightly more conservative than the GMH procedure. When the grouping variable was between-cluster (e.g., examinee gender), the collection of Begg adjusted methods reported acceptable Type I errors rates, whereas the GMH method was considerably more liberal. Notably, the Type I error rates for all procedures increased with associated increases of the ICC. The methods were also found to differ when combined with the grouping variable and number of subjects per cluster. As previously reported, when the grouping variable was within-cluster, all procedures adhered to the nominal 0.05 error rate, although the GMH procedure was slightly higher than the Begg adjusted methods. Additionally, the Type I error rates were found to decrease as the number of subjects per cluster increased. Conversely, when the grouping variable was between-cluster (e.g., schools assigned to different treatment conditions), the GMH procedure reported inflated Type I errors and increased when the number of subjects per cluster increased. On the other hand, the Begg adjusted methods adhered to the nominal 0.05 level, with their Type I error rates decreasing as the number of subjects per cluster increased. These findings contribute to the body of literature that standard DIF procedures (MH, LR) have inflated Type I error rates in the presence of multilevel data (Jin et al., 2014).
The statistical power of the GMH and Begg adjusted methods were also found to vary depending on manipulated factor. Although the statistical power of the GMH procedure exceeded 0.80 across ICC levels, it should be interpreted with great caution due to its inflated Type I error rates. Therefore, in the presence of multilevel data, the GMH procedure would be expected to erroneously report the presence of DIF among test items. Only when the ICC was 0.05 did the Begg adjusted methods report power estimates above the desired 0.80 level. As the variance associated to the cluster increases (ICCs 0.05–0.45), the statistical power of the methods decreased approximately 0.11 across the Begg adjusted procedures. Power rates also varied by level of the grouping variable (within or between) and amount of DIF. Notably, regardless of level of variable, power rates were lowest for the lowest level of DIF condition (i.e., 0.40), whereas GMH power was near 0.80. Again, despite the GMH procedure yielding power at or above 0.80 across conditions, the corresponding Type I error rates demand cautious interpretation. For both the within- and between-cluster conditions, power rates of the Beggs adjusted methods increased approximately to or above 0.80. Only when the DIF magnitude was 0.60 did the Begg methods report statistical power above 0.80, irrespective of the grouping variable. Finally, across GMH procedures, power rates increased with the number of clusters (e.g., 50, 100) and the number of subjects per cluster. Notably, all procedures reported power rates <0.50 with 50 clusters and five subjects per cluster. Only when the number of clusters was 100 or 200 did the Begg methods report an acceptable level of power for DIF detection.
Empirical findings of the current study provide a framework for the application of the GMH and Begg adjusted procedures for DIF detection. In applied settings, the GMH procedure should be restricted for consideration in the absence of multilevel data. Even with an ICC of 0.05 and at the between-level, its Type I error rate was ~0.10. This is similar to results with the MH and logistic regression procedures which are less precise in identifying DIF in multilevel data structures (French and Finch, 2010, 2013; Jin et al., 2014), particularly at the between-group level. On the other hand, the Begg adjusted values have generally reasonable power (>0.67) to detect DIF under varying multilevel conditions while maintaining an error rate at the nominal 0.05 level. One caveat is that when the number of clusters may be small (50 or less) and the sample size per cluster is also small, power for the Begg methods was found to be attenuated. Therefore, the collective set of Begg adjusted methods examined in this study seem most favorable for multilevel level data, although their power rates are expected to be slightly lower when the number of clusters is smaller. Study findings also provide a basis for ongoing investigations of DIF procedures under various conditions that may be found in applied testing contexts. For example, Jin et al. (2014) extended the work of French and Finch (2010, 2013) regarding the performance of hierarchical LR, LR, and MH under multilevel data structures when the ICC of the item was less than the ICC of the latent trait, in addition to other manipulated factors (e.g., item type, model type).
The confluence of results supports the need for continued research to identify DIF procedures that are accurate at identifying various types of DIF items under various multilevel structures expected in applied testing settings. For the practitioner, this work should allow one to screen for DIF items when multilevel data are present while maintaining control of Type I error and having adequate power to detect DIF. This increase in DIF accuracy, due to analyses matching the data structure, should guard against resources being wasted on reviewing items for problems as a result of in inflated error rate if an adjustment was not employed. In addition, software to implement these methods easily is needed. A SAS package with an easy to use interface is available from the authors for the Begg method for the dichotomous conditions. SAS and R packages are in development, which move the ideas presented here through simulation into practice.
This study contributes to the literature on the effectiveness of adjusted statistical methods for DIF detection in the presence of multilevel data. In particular, under multilevel data structures, the Begg adjusted methods performed most favorably in the detection of DIF for polytomous items. Nonetheless, the extent to which the methods examined in this study compare to other DIF detection methods proposed for polytomously scored items ( e.g., French and Miller, 1996; Penfield, 2008) within a multilevel framework offers directions for continued research. Likewise, the manipulated factors examined represent a step toward examining additional factors that may contribute to the functioning of these methods in applied settings. The development and evaluation of DIF detection methods with multilevel data will contribute to the psychometric tools available to ensuring accurate item and total test scores to guide test-based decisions.
Data Availability
The datasets for this manuscript are not publicly available because these were simulated datasets. They can be reproduced. Requests to access the datasets should be directed toZnJlbmNoYkB3c3UuZWR1.
Author Contributions
BF was responsible for conceptualization of the idea, design, and conducting the study. WF was responsible for conceptualization of the idea, design, and conducting the study. JI was responsible for assisting with the review of the literature, editing, and quality control.
Funding
The research reported here was supported by the Institute of Education Sciences, U.S. Department of Education, through Grant R305D110014 to Washington State University. The opinions expressed are those of the authors and do not represent views of the Institute or the U.S. Department of Education.
Conflict of Interest Statement
The authors declare that the research was conducted in the absence of any commercial or financial relationships that could be construed as a potential conflict of interest.
References
American Educational Research Association American Psychological Association, and National Council on Measurement in Education. (2014). Standards for Educational and Psychological Testing. Washington, DC: American Educational Research Association.
Feinberg, R. A., and Rubright, J. D. (2016). Conducting simulation studies in psychometrics. Educ. Meas. Issues Pract. 36–49. doi: 10.1111/emip.12111
Finch, H. (2005). The MIMIC method as a method for detecting DIF: comparison with Mantel-Haenszel, SIBTEST, and the IRT likelihood ratio. Appl. Psychol. Meas. 29, 278–295. doi: 10.1177/0146621605275728
Fox, J. P. (2005). “Multilevel IRT model assessment,” in New Developments in Categorical Data Analysis for the Social and Behavioral Sciences, eds L. A. van der Ark, M. A. Croon, and K. Sijtsma (New York, NY: Taylor & Francis), 227–252.
French, A. W., and Miller, T. R. (1996). Logistic regression and its use in detecting differential item functioning polytomous items. J. Educ. Meas. 33, 315–332. doi: 10.1111/j.1745-3984.1996.tb00495.x
French, B.F., and Finch, W. H. (2010). Hierarchical logistic regression: accounting for multilevel data in DIF detection. J. Educ. Meas. 47, 299–317. doi: 10.1111/j.1745-3984.2010.00115.x
French, B. F., and Finch, W. H. (2012). April. “Extensions of Mantel-Haenszel for multilevel DIF detection,” in Paper Presented at the American Educational Research Association Conference (Vancouver, BC).
French, B. F., and Finch, W. H. (2013). Extensions of the Mantel-Haenszel for multilevel DIF detection. Educ. Psychol. Meas. 73, 648–671. doi: 10.1177/0013164412472341
French, B. F., and Maller, S. J. (2007). Iterative purification and effect size use with logistic regression for differential item functioning detection. Educ. Psychol. Meas. 67, 373–393. doi: 10.1177/0013164406294781
Heck, R. H., Thomas, S., and Tabata, L. (2013). Multilevel Modeling of Categorical Outcomes Using IBM SPSS. New York, NY: Routledge. doi: 10.4324/9780203808986
Hedges, L. V., and Hedberg, E. C. (2007). Intraclass correlation values for planning group-randomized trials in education. Educ. Eval. Policy Anal. 29, 60–87. doi: 10.3102/0162373707299706
Holland, P. W., and Thayer, D. T. (1988). “Differential item performance and the Mental-Haenszel procedure,” in Test Validity, eds H. Wainer and H. I. Braun (Hillsdale, NJ: Lawrence Erlbaum), 129–145.
Hox, J. J., and Maas, C. J. M. (2001). The accuracy of multilevel structural equation modeling with pseudobalanced groups and small samples. Struct. Eq. Model. 8, 157–174. doi: 10.1207/S15328007SEM0802_1
Jin, Y., Myers, N. D., and Ahn, S. (2014). Complex versus simple modeling for DIF detection: When the intraclass correlation coefficient (ρ) of the studied item is less than the ρ of the total score. Educ. Psychol. Meas. 74, 163–190. doi: 10.1177/0013164413497572
Jodoin, M. G., and Gierl, M. J. (2001). Evaluating type I error and power rates using an effect size measure with the logistic regression procedure for DIF detection. Appl. Meas. Educ. 14, 329–349. doi: 10.1207/S15324818AME1404_2
Kamata, A., and Vaughn, B. K. (2011). “Multilevel item response theory modeling,” in Handbook of Advanced Multilevel Analysis, eds J. Hox and J. K. Roberts (New York, NY: Routledge), 41–57.
Kistjansson, E., Aylesworth, R., McDowell, I., and Zumbo, B. (2004). A comparison of four methods for detecting differential item functioning in ordered response items. Educ. Psychol. Meas. 65, 935–953. doi: 10.1177/0013164405275668
Luppescu, S. (2002). “DIF detection in HLM,” in Paper Presented at the Annual Meeting of the American Educational Research Association (New Orleans, LA).
Maas, C. J. M., and Hox, J. J. (2005). Sufficient sample sizes for multilevel modeling. Methodology 1, 86–92. doi: 10.1027/1614-2241.1.3.86
Maller, S. J. (2001). Differential item functioning in the WISC-III: Item parameters for boys and girls in the national standardization sample. Educ. Psychol. Meas. 61, 793–817. doi: 10.1177/00131640121971527
McCrudden, M. T., Schraw, G., and Buckendahl, C. (eds.) (2015). Use of Visual Displays in Research and Testing: Coding, Interpreting, And Reporting Data (Charlotte, NC: Information Age Publishing).
Muthén, B.O. (1994). Multilevel covariance structure analysis. Sociol. Methods Res. 22, 376–398. doi: 10.1177/0049124194022003006
Muthén, B.O., and Satorra, A. (1995). Complex survey data in structural equation modeling. Sociol. Methodol. 25, 267–316. doi: 10.2307/271070
Narayanan, P., and Swaminathan, H. (1996). Identification of items that show nonuniform DIF. Appl. Psychol. Meas. 20, 257–274. doi: 10.1177/014662169602000306
Natesan, P., Limbers, C., and Varni, J. W. (2010). Bayesian estimation of graded response multilevel models using Gibbs sampling: formulation and illustration. Educ. Psychol. Meas. 70, 420–439. doi: 10.1177/0013164409355696
O'Connell, A. A., and McCoach, D. B. (eds.) (2008). Multilevel Modeling of Educational Data (Charlotte, NC: Information Age Publishing).
Oliveri, M. A., Olson, B. F., Ercikan, K., and Zumbo, Z. (2012). Methodologies for investigating item and test-level measurement equivalence in international large-scale assessments. Int. J. Testing 12, 203–223. doi: 10.1080/15305058.2011.617475
Osterlind, S. J., and Everson, H. T. (2009). Differential Item Functioning, 2nd Edn. Thousand Oaks, CA: Sage.
Paxton, P., Curran, P. J., Bollen, K. A., Kirby, J., and Chen, F. (2001). Monte Carlo experiments: design and implementation. Struct. Equat. Model. 8, 287–312. doi: 10.1207/S15328007SEM0802_7
Penfield, R. D. (2001). Assessing differential item functioning among multiple groups: a comparison of three Mantel-Haenszel procedures. Appl. Meas. Educ. 14, 235–259. doi: 10.1207/S15324818AME1403_3
Penfield, R. D. (2007). Assessing differential step functioning in polytomous items using a common odds ratio estimator. J. Educ. Meas. 44, 187–210. doi: 10.1111/j.1745-3984.2007.00034.x
Penfield, R. D. (2008). Three classes of nonparametric differential step functioning effect estimators. Appl. Psychol. Meas. 32, 480–501.
Raju, N. S., Laffitte, L. J., and Byrne, B. M. (2002). Measurement equivalence: a comparison of methods based on confirmatory factor analysis and item response theory. J. Appl. Psychol. 87, 517–529.
Raudenbush, S. W., and Bryk, A. S. (2002). Hierarchical Linear Models: Applications and Data Analysis Methods, 2nd edn. Thousand Oaks, CA: Sage.
Williams, N. J., and Beretvas, N. S. (2006). DIF identification using HGLM for polytomous items. Appl. Psychol. Meas. 30, 22–42. doi: 10.1177/0146621605279867
Keywords: multilevel, differential item functioning, invariance, validity, test and item development
Citation: French BF, Finch WH and Immekus JC (2019) Multilevel Generalized Mantel-Haenszel for Differential Item Functioning Detection. Front. Educ. 4:47. doi: 10.3389/feduc.2019.00047
Received: 05 March 2019; Accepted: 10 May 2019;
Published: 18 June 2019.
Edited by:
Elisa Pedroli, Istituto Auxologico Italiano (IRCCS), ItalyReviewed by:
Yong Luo, Educational Testing Service, United StatesRaman Grover, British Columbia Ministry of Education, Canada
Copyright © 2019 French, Finch and Immekus. This is an open-access article distributed under the terms of the Creative Commons Attribution License (CC BY). The use, distribution or reproduction in other forums is permitted, provided the original author(s) and the copyright owner(s) are credited and that the original publication in this journal is cited, in accordance with accepted academic practice. No use, distribution or reproduction is permitted which does not comply with these terms.
*Correspondence: Brian F. French, ZnJlbmNoYkB3c3UuZWR1; W. Holmes Finch, d2hmaW5jaEBic3UuZWR1
 Brian F. French
 W. Holmes Finch
 Jason C. Immekus3