 John F. LaDisa Jr.
 Christopher E. Larkee
- 1Department of Biomedical Engineering, Marquette University and Medical College of Wisconsin, Milwaukee, WI, United States
- 2Opus College of Engineering, Marquette University, Milwaukee, WI, United States
The MARquette Visualization Lab (MARVL) is a large-scale immersive virtual environment for research, teaching, collaboration and outreach at our mid-sized liberal arts university. MARVL consists of multiple display surfaces including an extra wide front wall and floor, and two side walls. This resource includes stereoscopic viewing, motion tracking and space for a large audience. MARVL’s versatile configuration facilitates viewing of content by 30 people, while also projecting on the entire width of the floor. This feature uniquely facilitates comparative or separate content visible simultaneously via “split mode” operation (two 3-sided environments), as well as detailed motion for applications such as gait analysis and performing arts. Since establishing the lab, its members have received numerous queries and requests pertaining to how system attributes and applications were determined, suggesting these and related decisions remain a challenge nearly three decades since the first CAVE was constructed. This paper provides an overview of MARVL including the processes used in identifying a diverse group of cross campus users, understanding their collective vision for potential use, and synthesizing this information to create the resource described above. The subsequent design, qualitative and quantitative approaches to vendor selection, and software decisions are then discussed. Steps implemented for dealing with simulator sickness and latency are presented along with current approaches being implemented for project development with end users. Finally, we present results from the use of MARVL by several end users identified in the early planning stage, and recent upgrades to the system.
Introduction
Research suggests immersive experiences that allow for motion in a realistic environment promote active learning, critical thinking, informed decision making and improved performance (Patel et al., 2006). For example, a diver is more likely to recall specific instruction when it is learned and practiced in water rather than on land (Baddeley, 1993). This was the motivation to establish the MARquette Visualization Lab (MARVL), a facility designed to be used by interested members of our community to (1) create technologically advantageous visualization content, (2) demonstrate how visualization technology can be used in learning, research, and industry, and (3) ultimately teach the theory rooted in this technology.
Since establishing MARVL, its members have received numerous requests pertaining to how system attributes and applications were determined. The allure of immersive systems, especially with a resurgence of virtual and augmented reality devices, is prompting interest from potential end users across disciplines, some without prior experience of important hardware and software and considerations. In the current work we provide an overview of MARVL including the processes used in identifying a diverse group of users, understand their collective vision for potential use, and synthesize this information to create a unique resource that differentiates our institution with a particularly strong background in education among immersive facilities locally. The subsequent design, qualitative and quantitative approaches to vendor selection, and software decisions are then discussed. We then present lessons learned during early operation of our large-scale immersive visualization (IVE) system and results of its use by several end users identified in the early planning stages. Finally, we discuss ongoing costs and recent upgrades implemented within MARVL.
Materials and Methods
During the planning process, members of the Marquette University community generally listed in Table 1 were identified from responses to an email sent to department chairs throughout the university. Meetings were then held over several months with interested staff and faculty members of all academic ranks regarding their potential use of a visualization facility. Some of these individuals were intrigued but did not have a specific application in mind. However, most potential end users shared extensive visions with specific objectives geared toward research and teaching, as well as industry collaboration and outreach. Perhaps not surprisingly for our educational institution, several potential end users envisioned using the forthcoming facility in their classes to better help students understand and realize the complexity within or systems or scenarios. While discussing the vision of each end user, members of MARVL were particularly careful to help potential end users, when needed, to identify unique ways of achieving a proposed vision in a manner that takes advantage of stereoscopic viewing and could not be conducted using a desktop computer, large monitor or standard projection system.
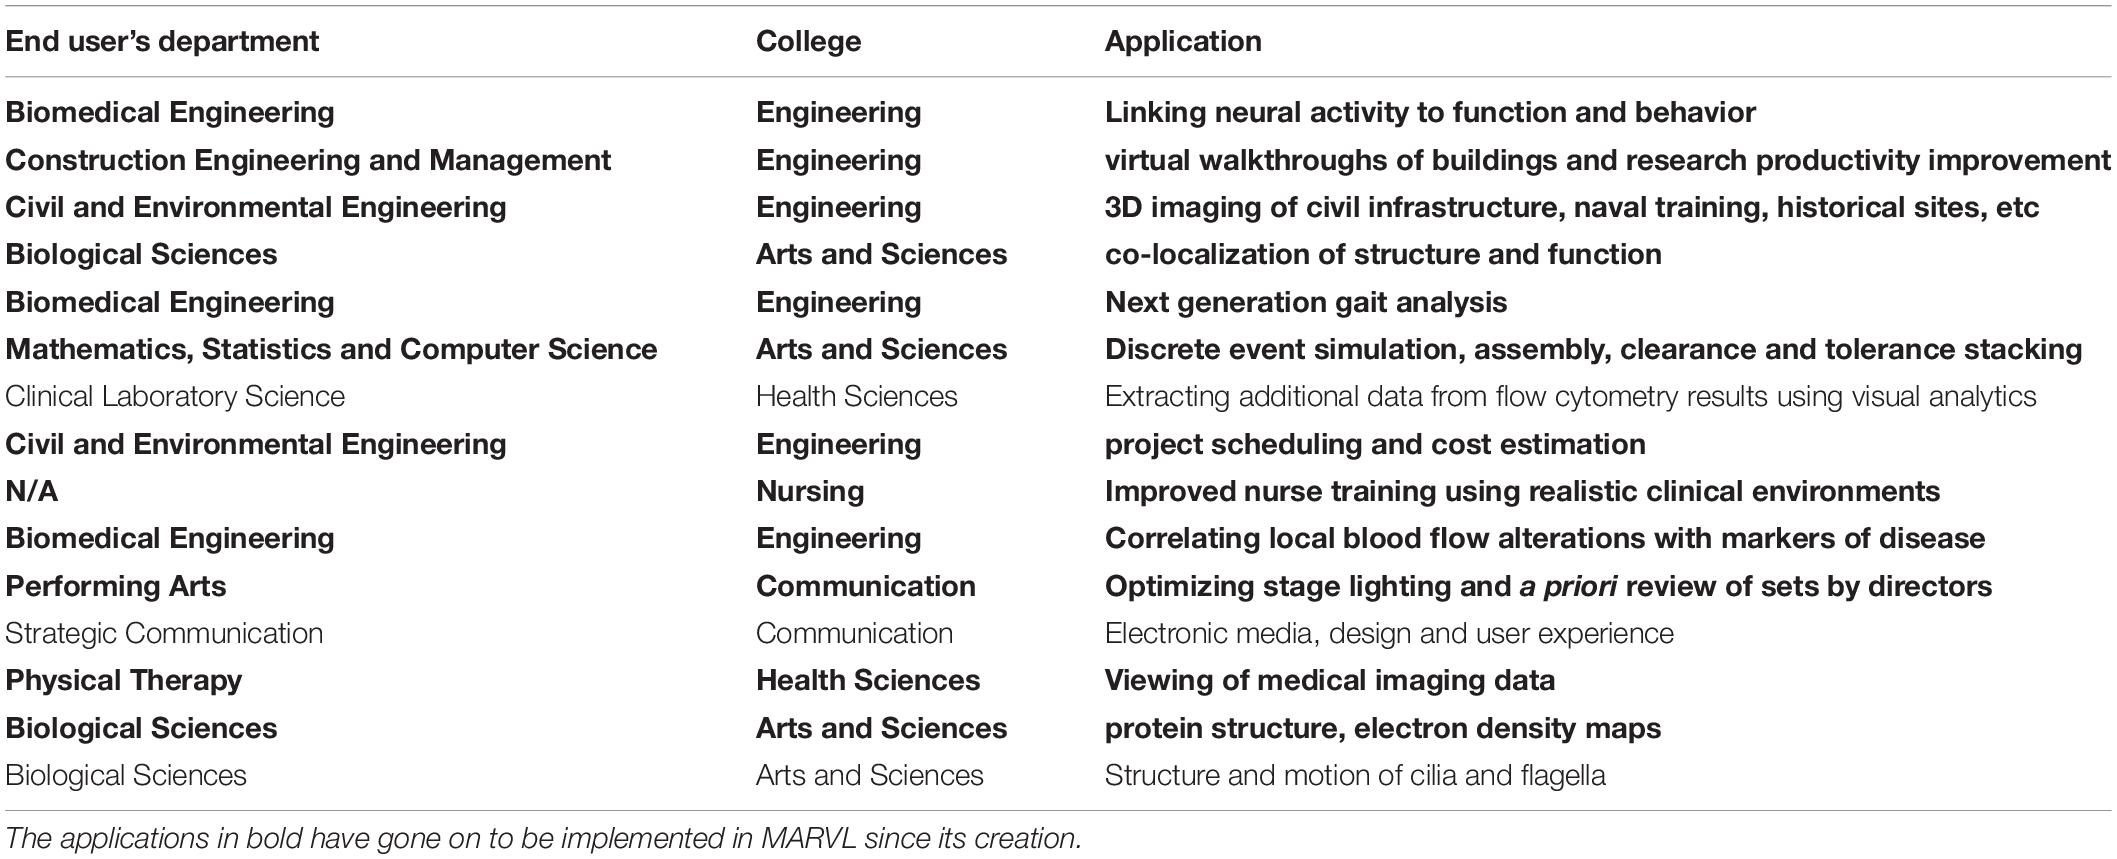
Table 1. Potential end users identified during the planning stages of MARVL.
Several potential large-scale IVEs were discussed upon learning of each end user’s application and intended use. Approaches discussed generally included a projection-based cylindrical or dome structure, a 4-6 walled CAVE-type (CAVE Automatic Virtual Environment) system (Plato, 1974; Cruz-Neira et al., 1992), or a large-scale panel-based system with narrow bezels (Febretti et al., 2013). Table 1 indicates that several of our end users focused on applications involving rooms as structures that would be stationary with right angles (e.g., civil engineering, nursing, theater). While a curved system would not preclude the viewing of such structures, a CAVE intrinsically lends itself to these applications without inhibiting use by other applications. Although exceptional systems have recently been created using panels with ultra-small bezels that are attractive for a number of reasons, our end users were unanimous in their dislike for this approach. Most of these end users were too distracted by the bezels despite their modest dimensions. End users also identified collaboration via a shared visualization experience as paramount, which dampened enthusiasm for a series of tethered head-mounted displays in communication with one another. This feedback by potential users of MARVL suggested that a CAVE-type environment would be beneficial and most favorable to the greatest number of users. CAVE systems consist of between three and six walls of a room onto which a specific environment is projected and adapted through the movements of one or more users within it. Five vendors capable of providing CAVE-type solutions were contacted regarding the attributes for the MARVL system identified by its potential users as discussed in greater detail below.
Components of the Visualization System
Visualization systems generally contain the four components:
(1) Structure, projectors and screens - structural elements such as modular framing, vertical and floor projection surfaces, glasses with emitters for creating a 3D experience, stereoscopic 3D projectors and cabling
(2) Image generators (i.e., computers) - a series of computers containing high-end, but not necessarily specialized, components and synchronization electronics used to control content viewed in the large-scale immersive environment
(3) Visualization software - Commercial or open-source software, sometimes specialized for a particular application, that facilitates viewing of content in stereoscopic 3D
(4) Tracking system - cameras and associated interaction devices that allow the system to know the users precise position in space, and adapt the rendered content being viewed based on the user’s perspective and actions
Desired Attributes Expressed by End Users
As alluded to above, potential users of MARVL from Engineering, Arts and Sciences, Health Sciences and Nursing made it clear that a CAVE-type environment would be beneficial to the greatest number of users. Moreover, responses during the planning stage suggested a system of limited size could actually preclude investigators with more established visions from using the facility (e.g., performing arts, gait analysis). There are flexible systems available from several vendors that feature a reconfigurable visual environment with the ability to move or open screens on the side walls of a CAVE. This option can provide a large front display configuration that was desirable to many potential users at our institution. The benefits afforded by this option may be offset by alignment issues and the chance for failure of mechanical parts inherent in an articulating structure. Anecdotal feedback from centers that had employed this approach indicated that changes to the configuration were infrequent, for many of these reasons. Members of the MARVL therefore decided the system would consists of an extra wide front wall and floor, with standard-sized side walls. These attributes were selected for a number of important reasons:
1. An IVE with an extra wide front wall facilitates viewing of content by a large audience, while also projecting on the entire width of the floor. In contrast, a flexible IVE in the open position only has a portion of the floor projected.
2. An extra wide IVE also permits rendering of multiple environments. For example, a comparison between two building attributes could be rendered side by side to evaluate preferences, or a realistic Intensive Care Unit, for example, containing beds for two simulated patient scenarios with a curtain between them could be rendered with application to nursing education.
3. An extra wide IVE further permits detailed motion within the environment for applications such as gait analysis and/or performing arts.
4. In contrast to a standard cubic IVE, there are relatively fewer CAVEs with an extra wide front wall and floor (Kageyama and Tomiyama, 2016), therefore differentiating the MARVL facility from other IVEs locally and around the country.
5. An extra wide IVE avoids potential issues associated with keeping articulating parts aligned.
Proposed Vendor Solutions and Onsite Demonstrations
After contacting representatives from five vendors, faculty members in the Opus College of Engineering for which the IVE was to be purchased and housed sought bids from two vendors willing to offer quotes for a system with attributes discussed in the previous section (denoted here as Vendor A and Vendor B to limit commercialism). While every attempt was made to obtain similar quotes, differences did exist due to vendor preferences, technical capabilities and component availability. Figure 1 provides a schematic illustration of systems proposed by the two vendors that address their interpretation of design requirements articulated by the collection of end users. Table 2 provides an at-a-glance comparison of the initial quotes from each vendor.
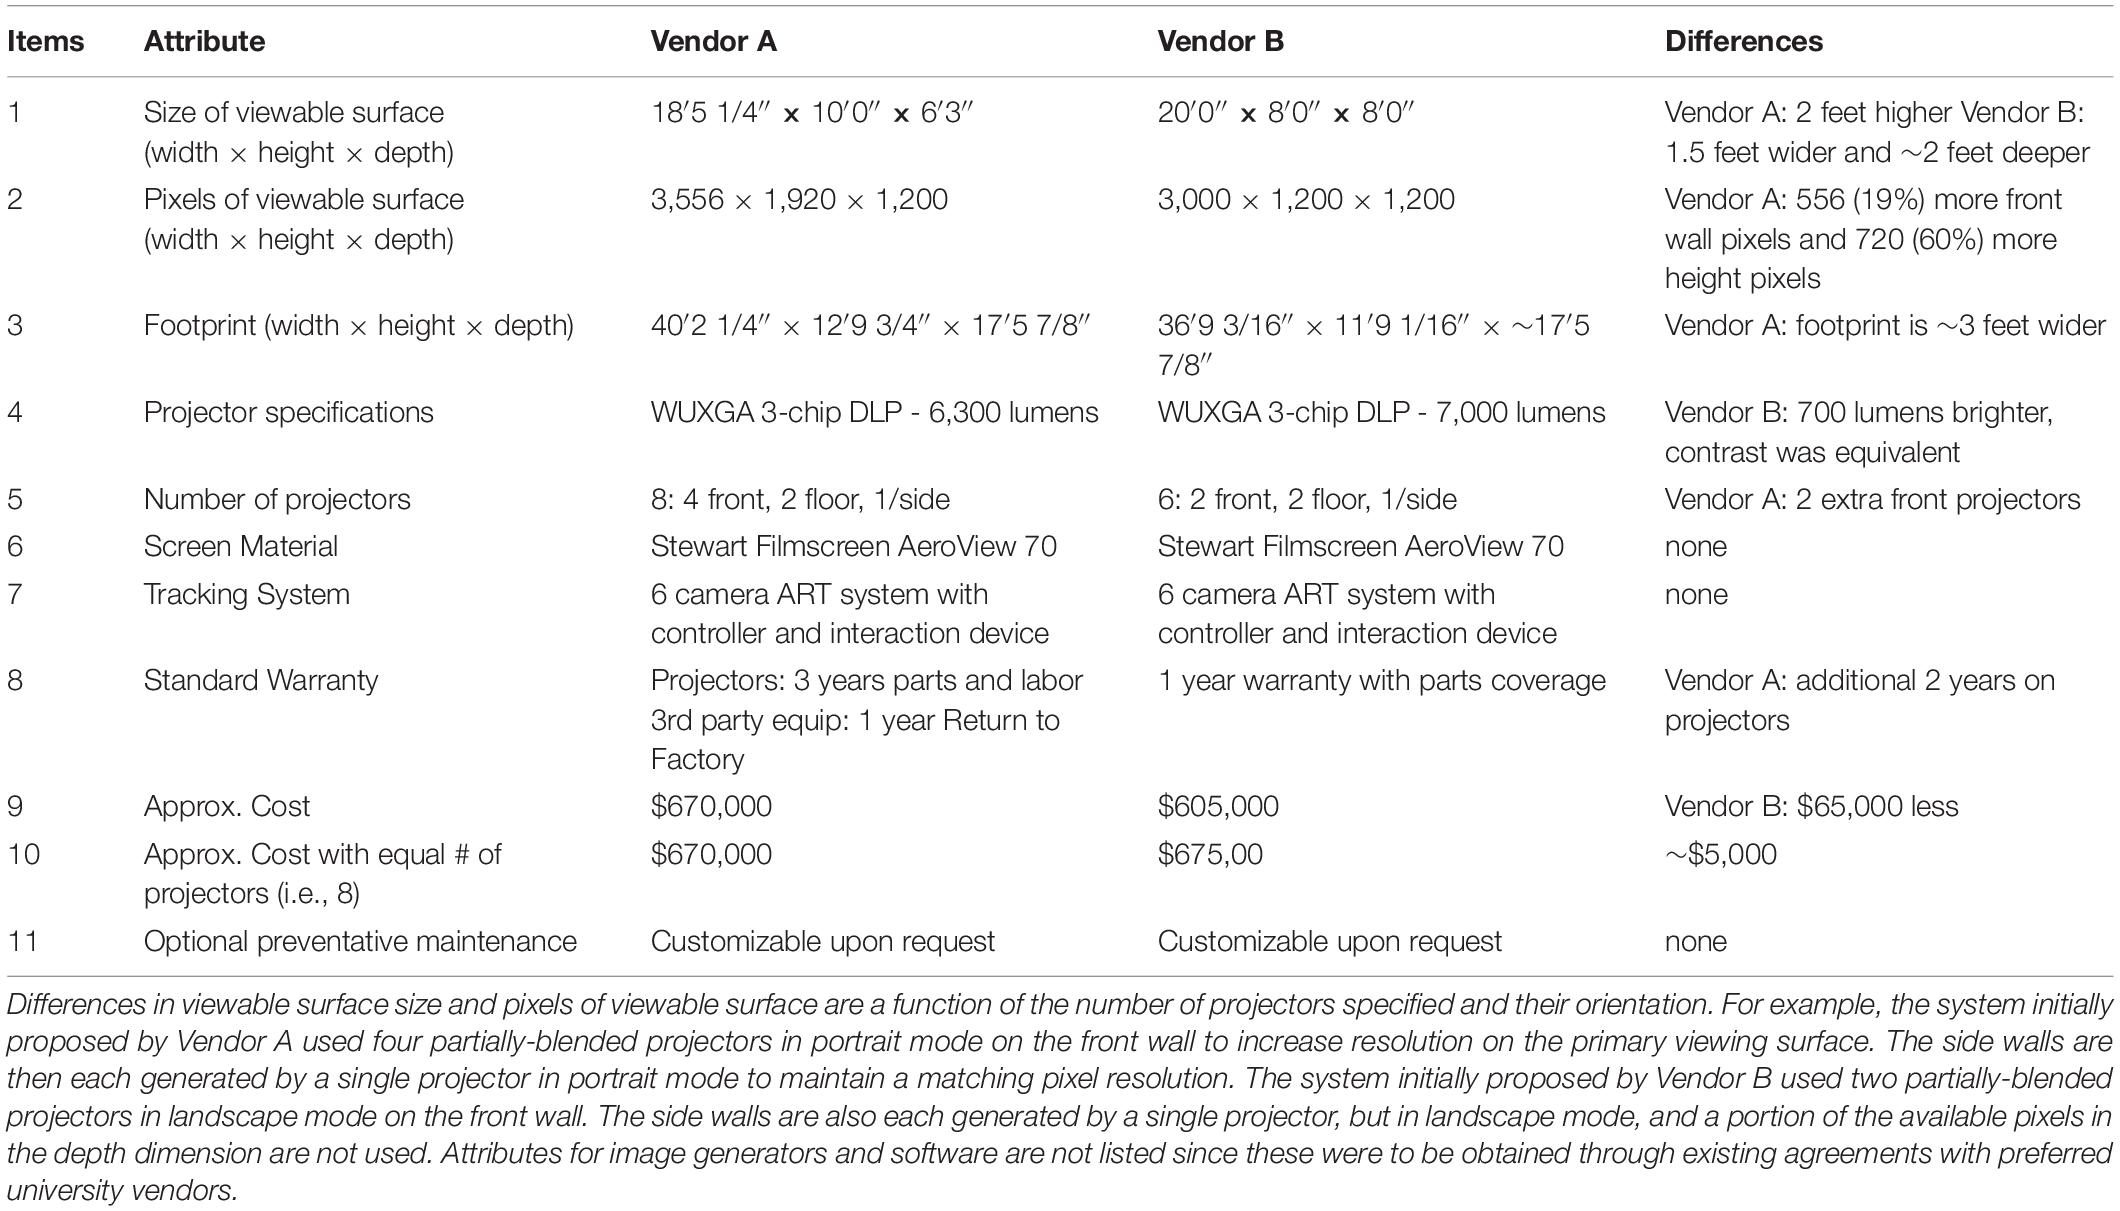
Table 2. At-a-glance comparison of vendor system specifications from their initial quotations.
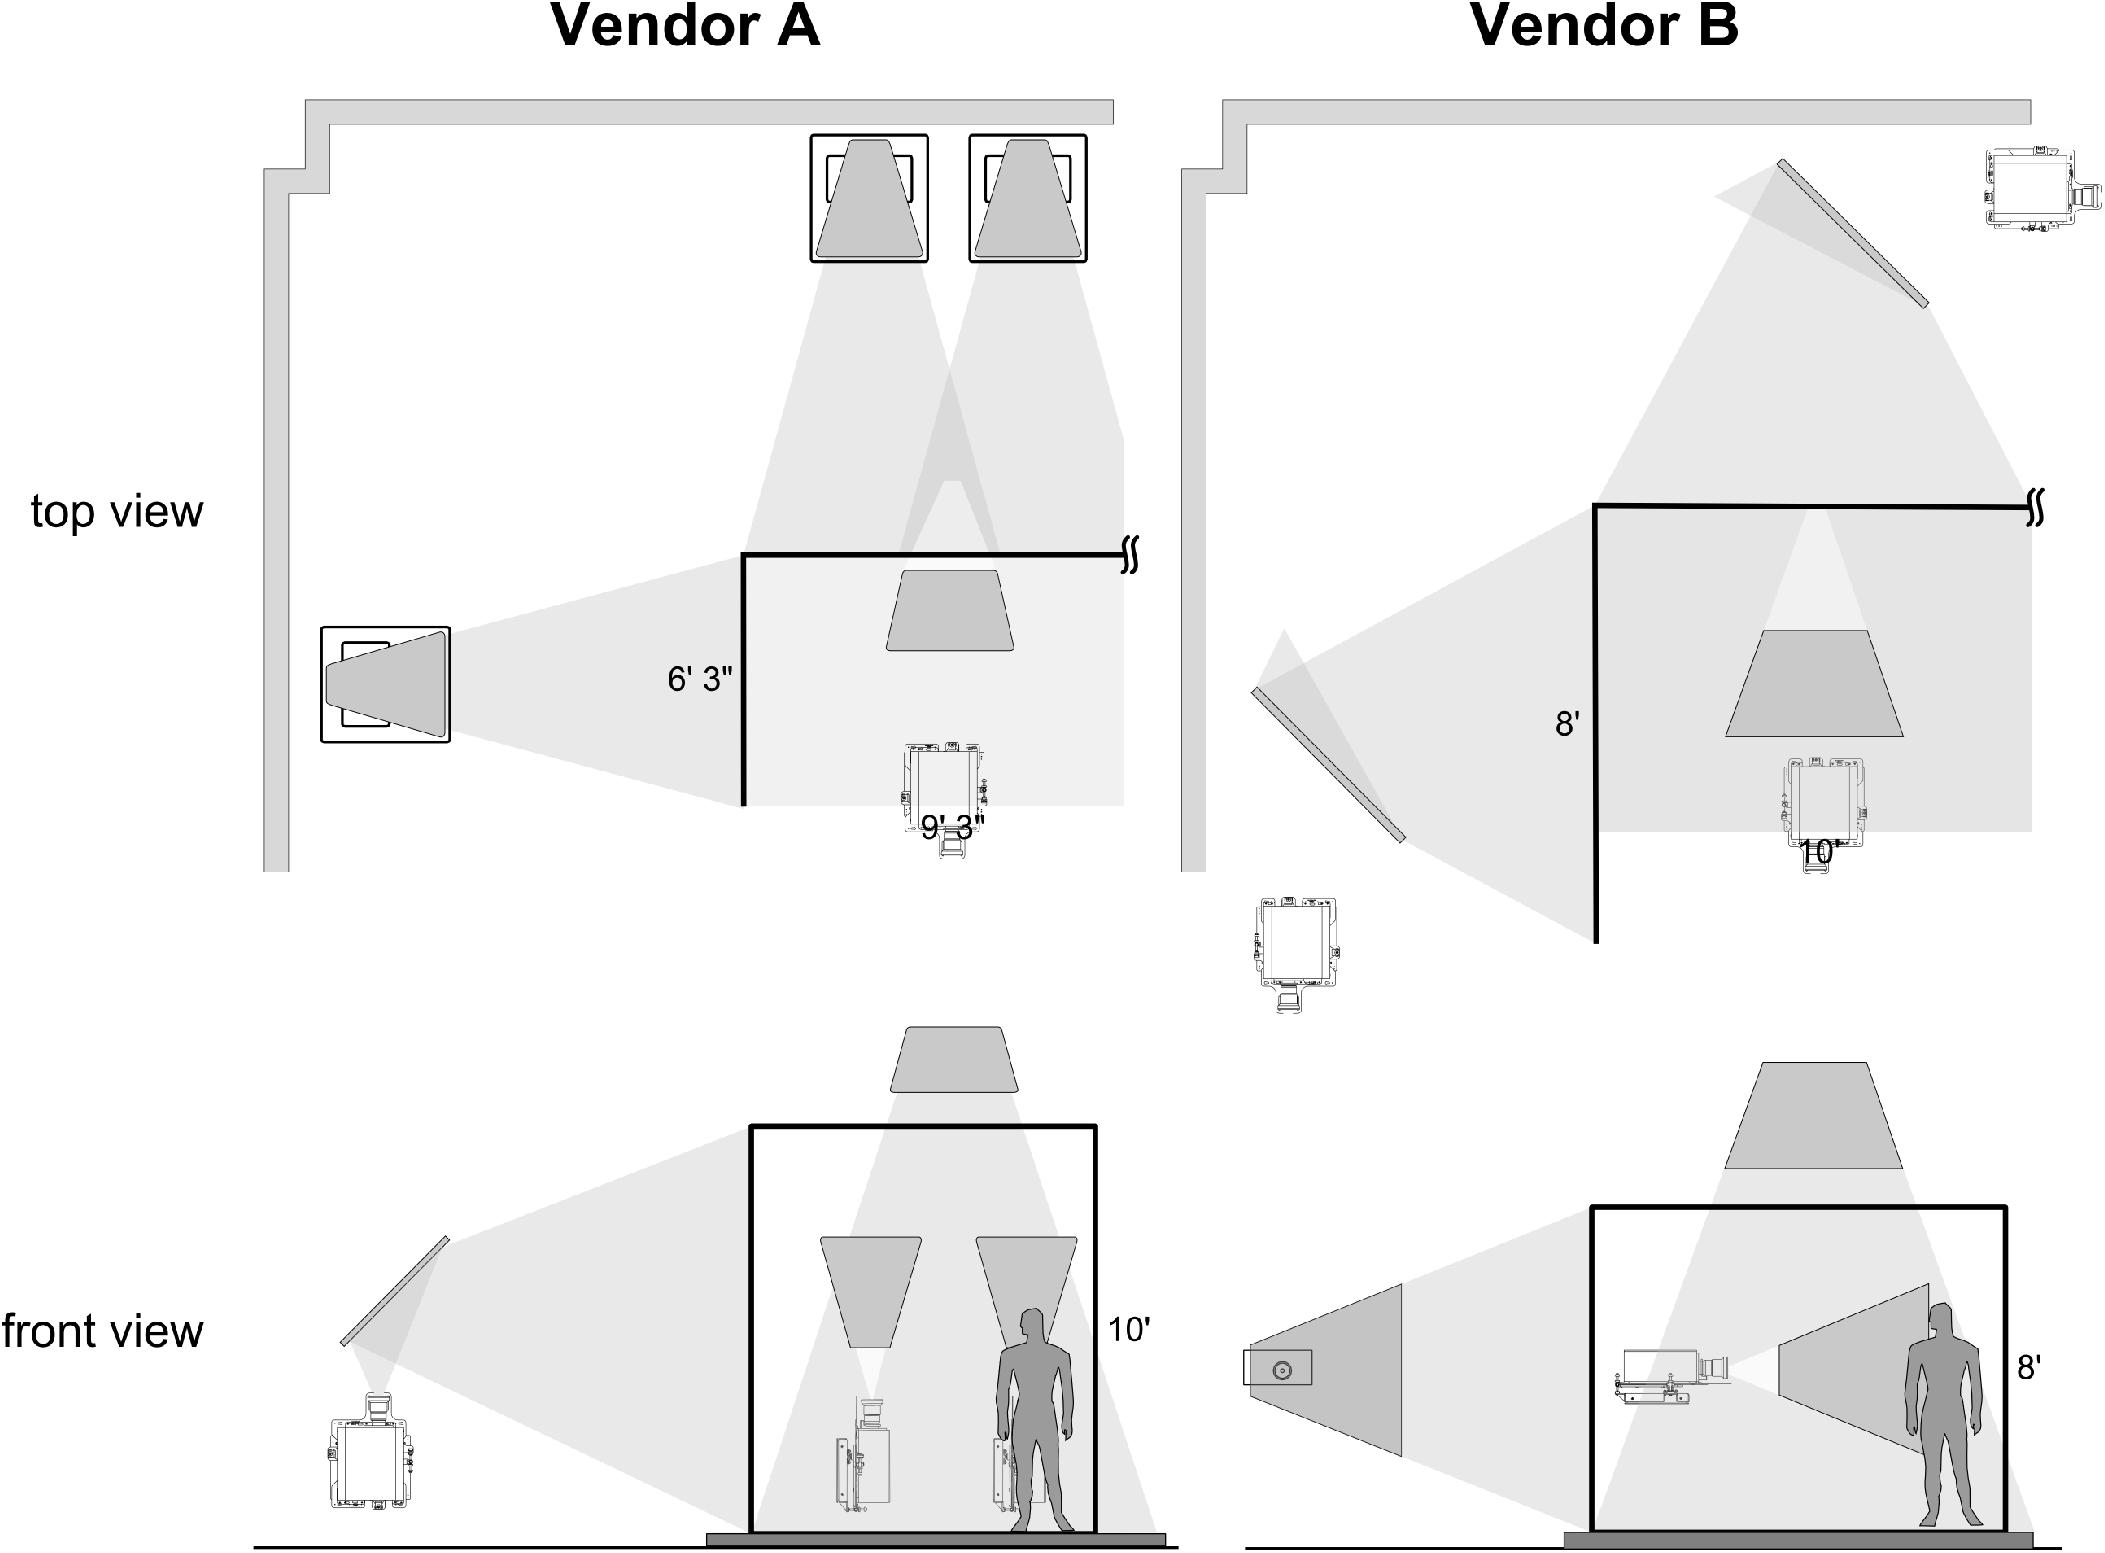
Figure 1. Schematic illustrations of systems proposed by two vendors that address design requirements articulated by the collection of end users. The figure illustrates the differences in vendor designs by examining the projector arrangement on the left side of the visualization space. The right side of the spaces proposed is a mirror image of those shown on the left side. Both designs use projectors that project a 16:10 widescreen image, but Vendor A initially suggested using more projectors and arranging them vertically, which makes the projected area taller but less deep.
Given the similarities in quotes between vendors, each vendor was asked to offer a demonstration (i.e., demo) at our institution. Potential end users throughout campus were invited by email to attend these demos, which were scheduled at equivalent times on back-to-back days. Attendees were noted and a questionnaire was then emailed directly to each potential user to obtain his or her impressions from each demo. Care was taken to keep attributes consistent between vendors during demos. Each vendor was provided with electronic files of the same content for demonstration before arriving to campus. Vendors arrived one day before their demo to setup associated equipment and troubleshoot potential issues. Demos did not include the full systems described in the accompanying quotes from each vendor, since each system is custom and can only be fabricated once ordered. However, the demos did include the primary components that impact perceived image quality. These components primarily include the projectors and screen material specified by the vendor, which were setup in an interior room with no windows to control ambient light. The demos from each vendor therefore used two projectors of their specified model that were partially blended on equivalently-sized screens as shown in Figure 2. The screen used during the demo also matched the screen material specified by both vendors.
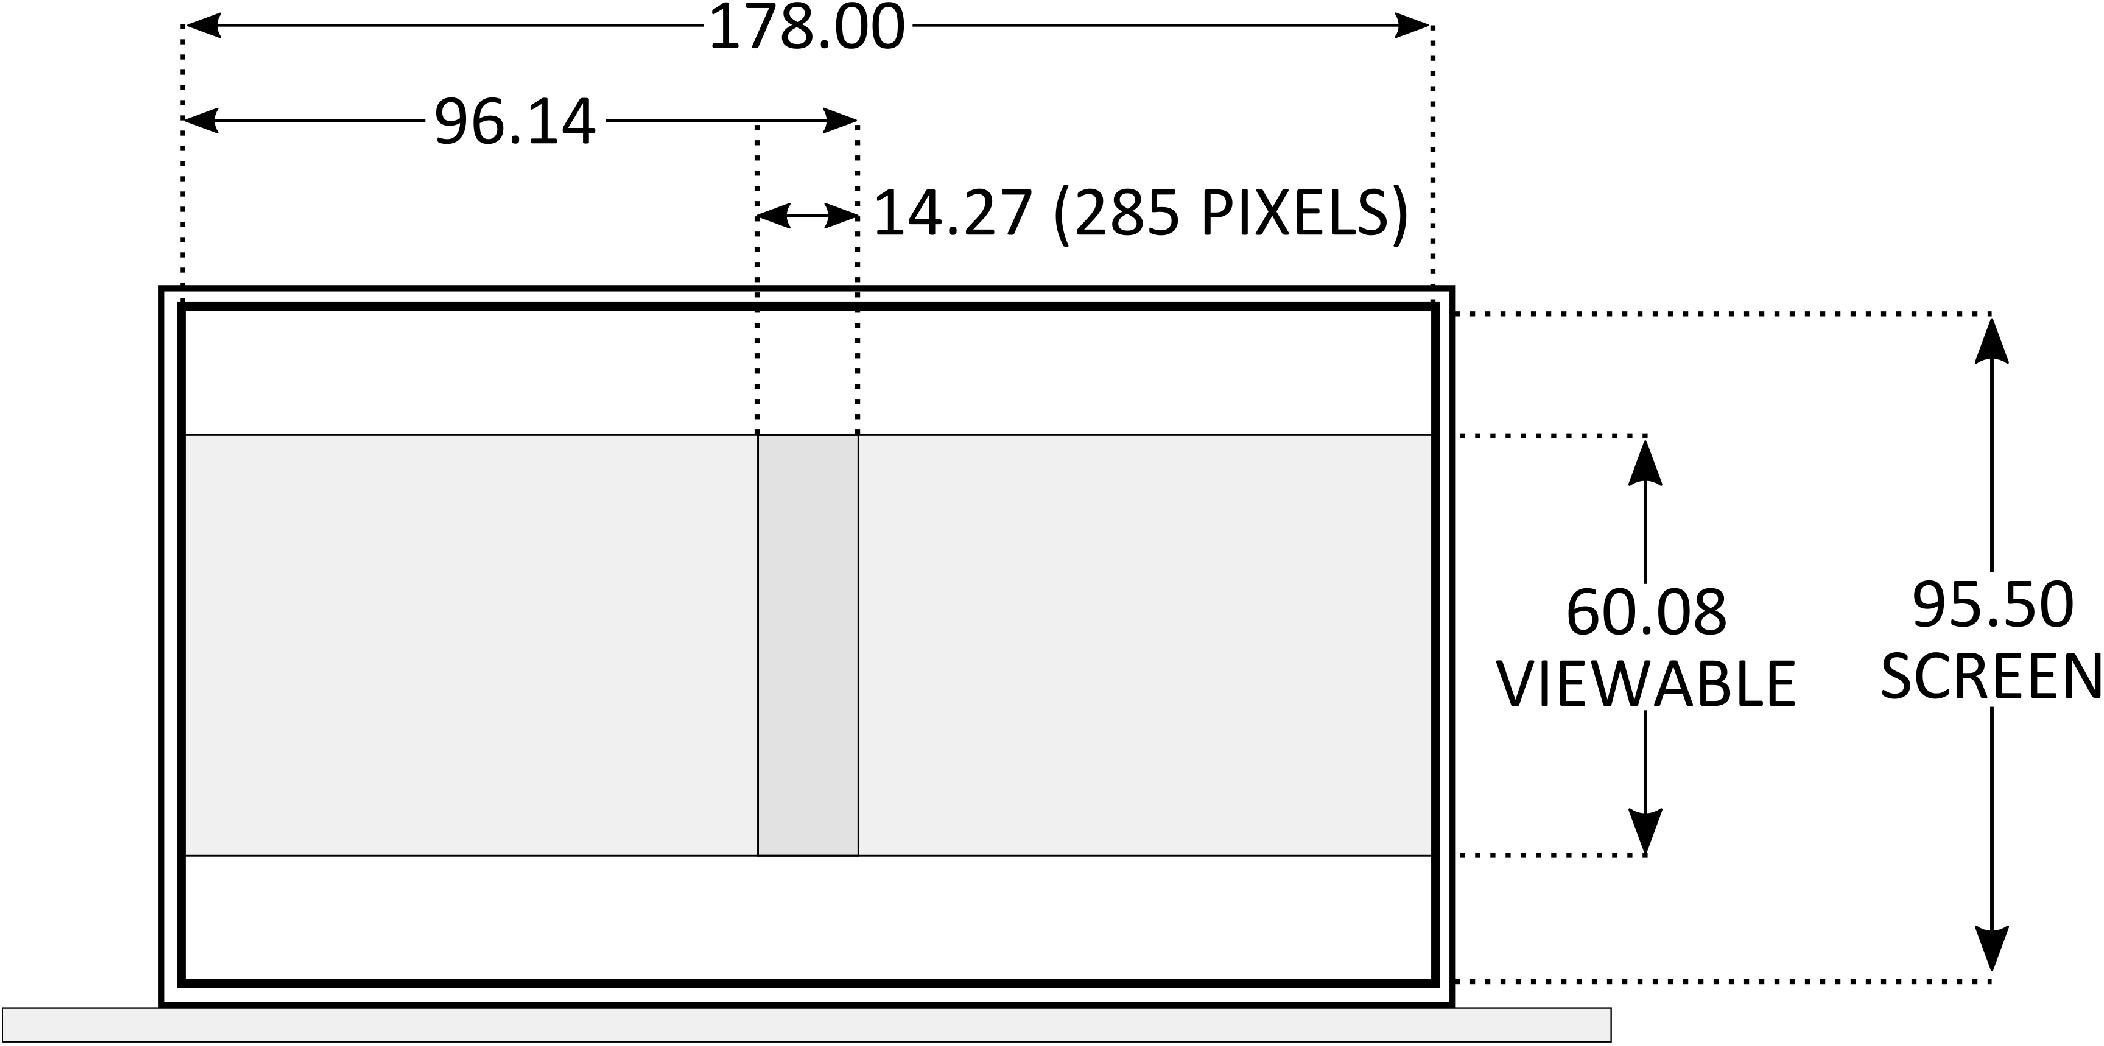
Figure 2. Specification for vendor demonstrations using key equipment impacting image quality.
In addition to qualitative feedback, contrast and uniformity was quantified across the projected surface demonstrated by each vendor. Specifically, a professional photographer employed by our institution obtained digital images of a checkerboard test pattern that was displayed and photographed before the start of each vendor demo. Images were taken after vendors had acknowledged that they optimized the combination of screen and projectors to the best of their ability within the allotted time. The time allotted for setup was consistent between vendors. Care was taken to ensure that the exposure settings on the camera were consistent when obtaining photographs. The test image used for the demos is shown in Figure 3 (top) along with the intensity profile generated from a horizontal query of 8-bit grayscale values through the indicated portion of the image (bottom) using the Plot Profile function within ImageJ1. This represents the ideal (i.e., best case) output from photographs of this image as projected during each demo. The photographs obtained from each demo were similarly analyzed offline with ImageJ to quantify contrast and uniformity between white and black levels across the projected surface demonstrated by each vendor.
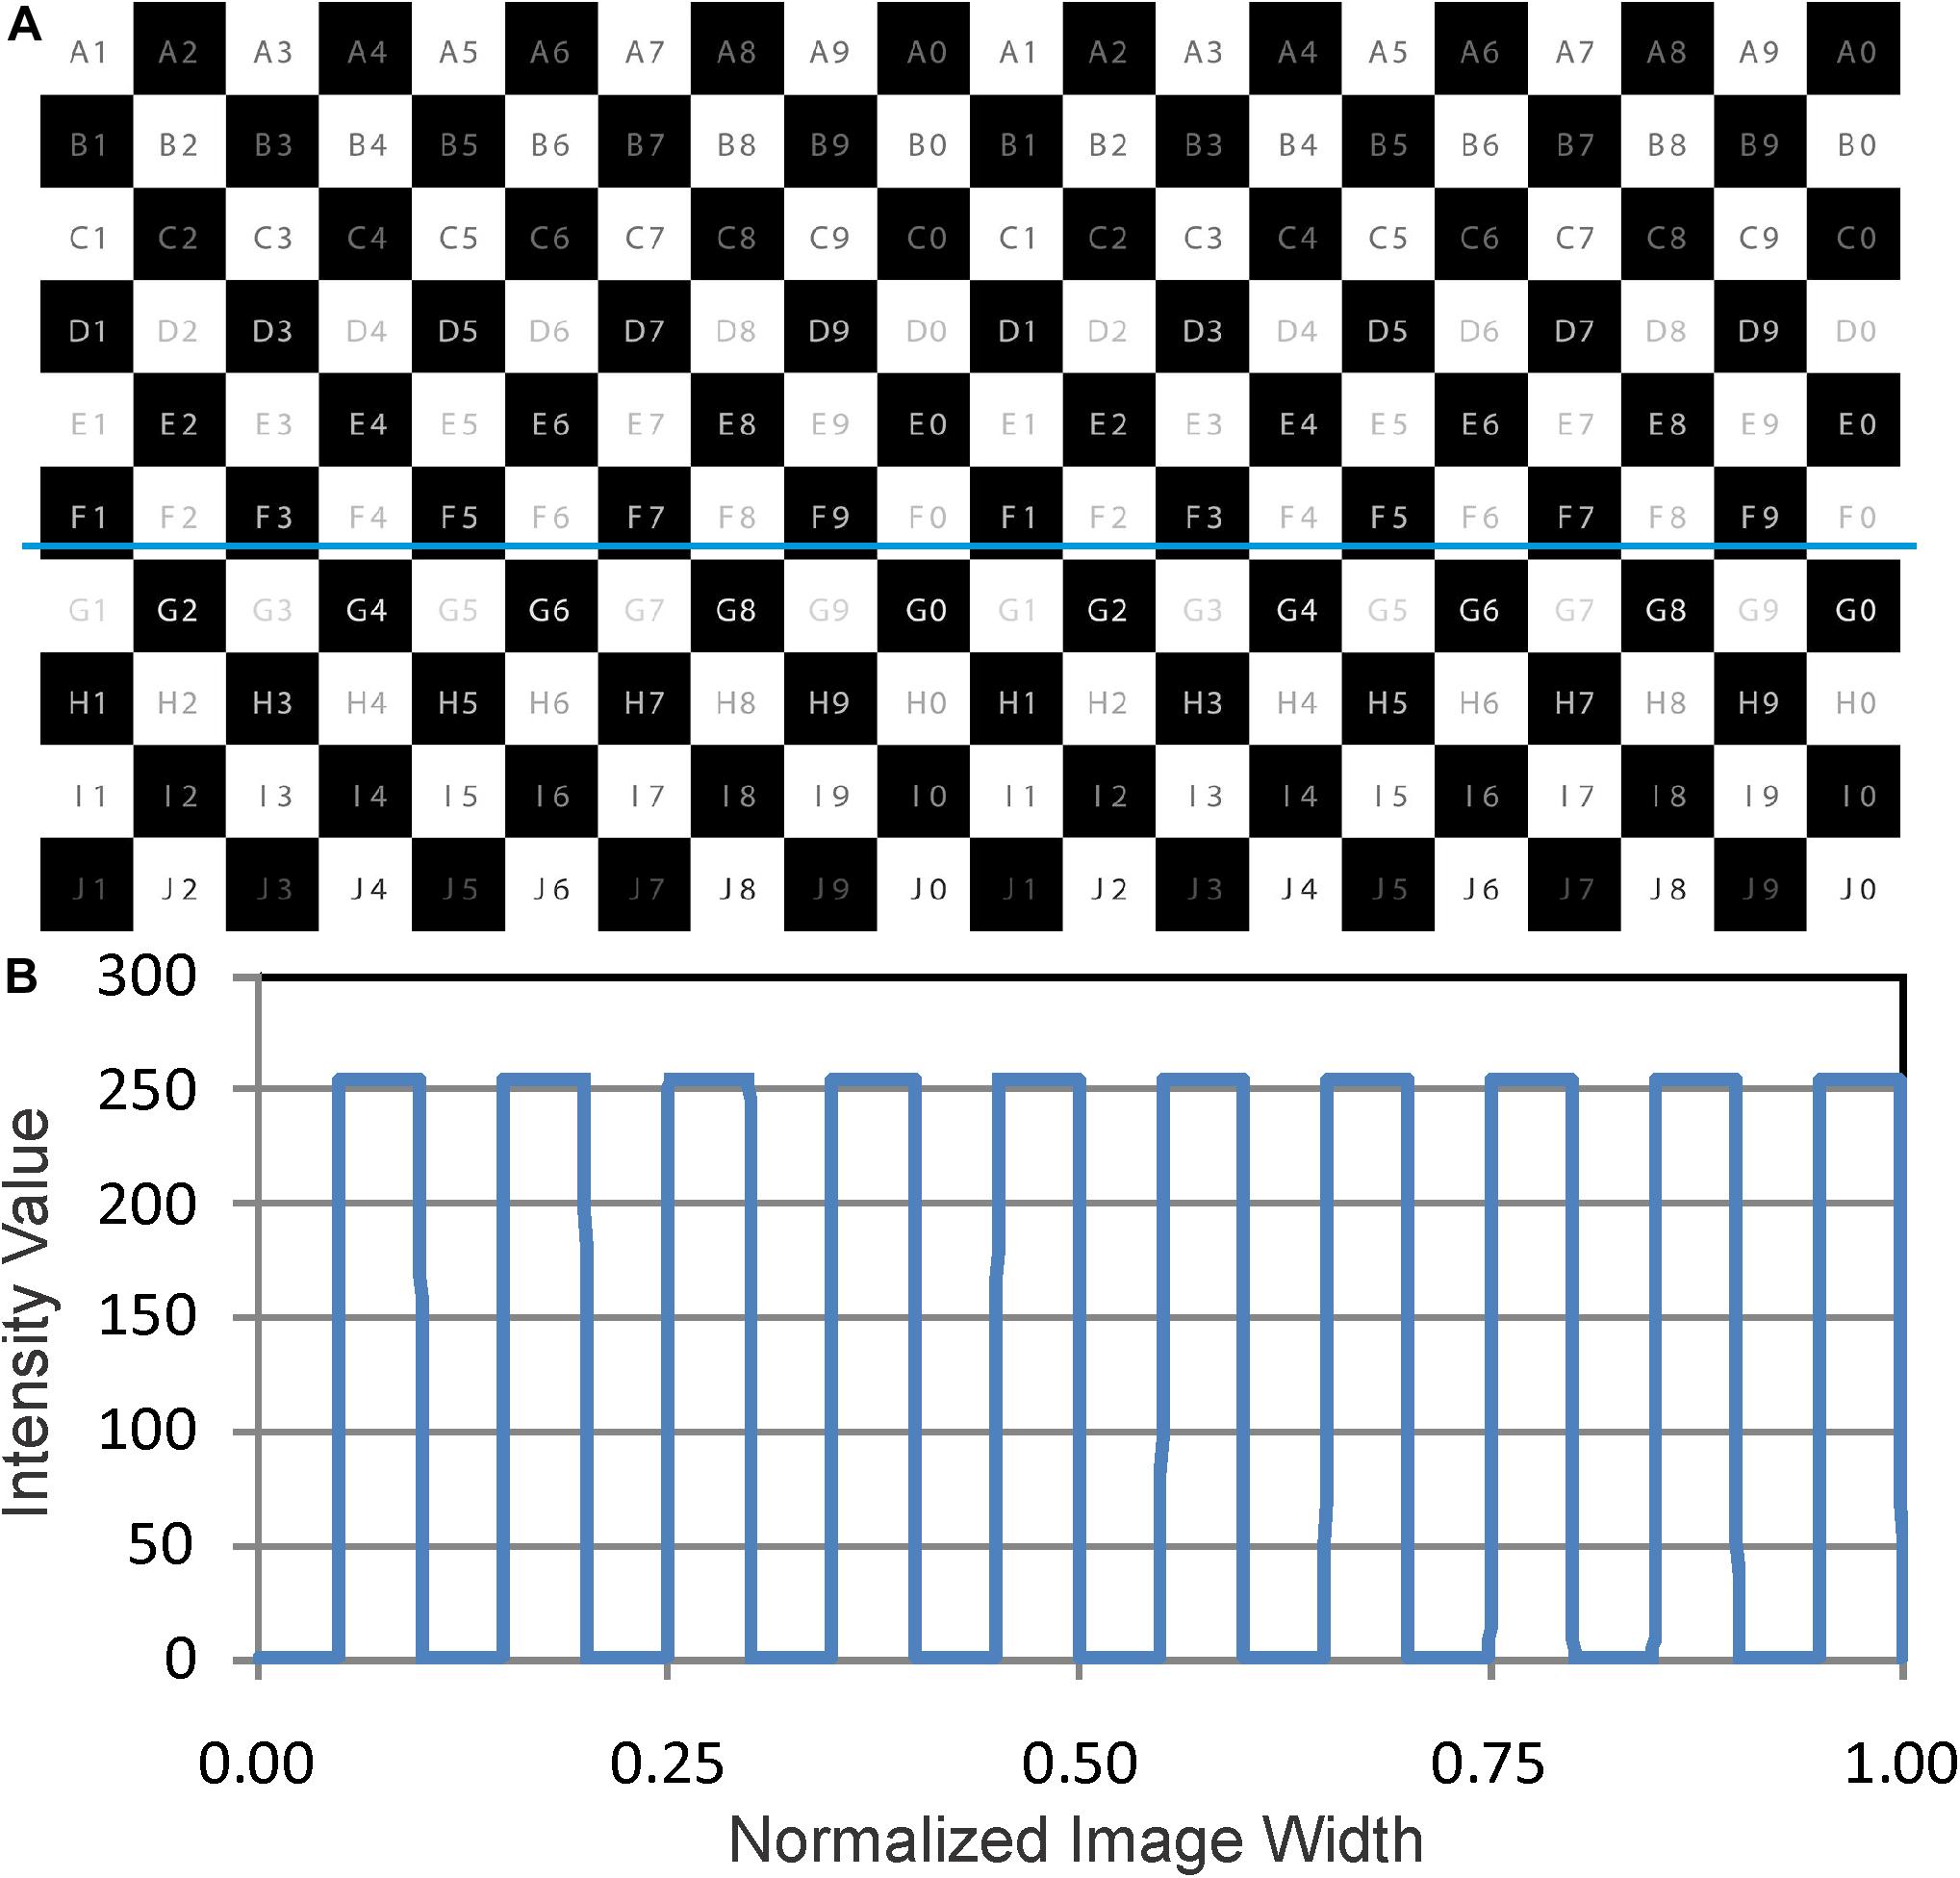
Figure 3. A test image for the demos is shown (A) along with the intensity profile generated from a horizontal query of values through the indicated portion of the image (B). This represents the ideal (i.e., best case) output from photographs of this image as projected during each demo.
Image Generators
As mentioned above, image generators used to display content in an IVE consist of high-end, but not necessarily specialized, components. Quotations were therefore obtained from two preferred vendors of our institution. This approach minimized costs and additional markup that would be passed along to our institution if image generators were obtained from either vendor. Both vendors accommodated our request to keep costs down via this approach. There are several ways the image generators could be configured. The configuration discussed in the results section was recommended by technical staff within our institution to deliver solid performance while also managing cost.
Visualization Software
The software expected to be used within the large-scale MARVL IVE based on end users identified during planning is listed in Table 3, along with the application, associated details and approximate cost at the time of system construction. Where possible, open source and trial licenses (coupled with software vendor demos) were to be implemented to keep costs down and ensure we purchase software solutions that are most appropriate for a wide range of users. Open source solutions were recommended based on extensive discussions with leading visualization researchers around the country and focused on those with a large base of users and available documentation.
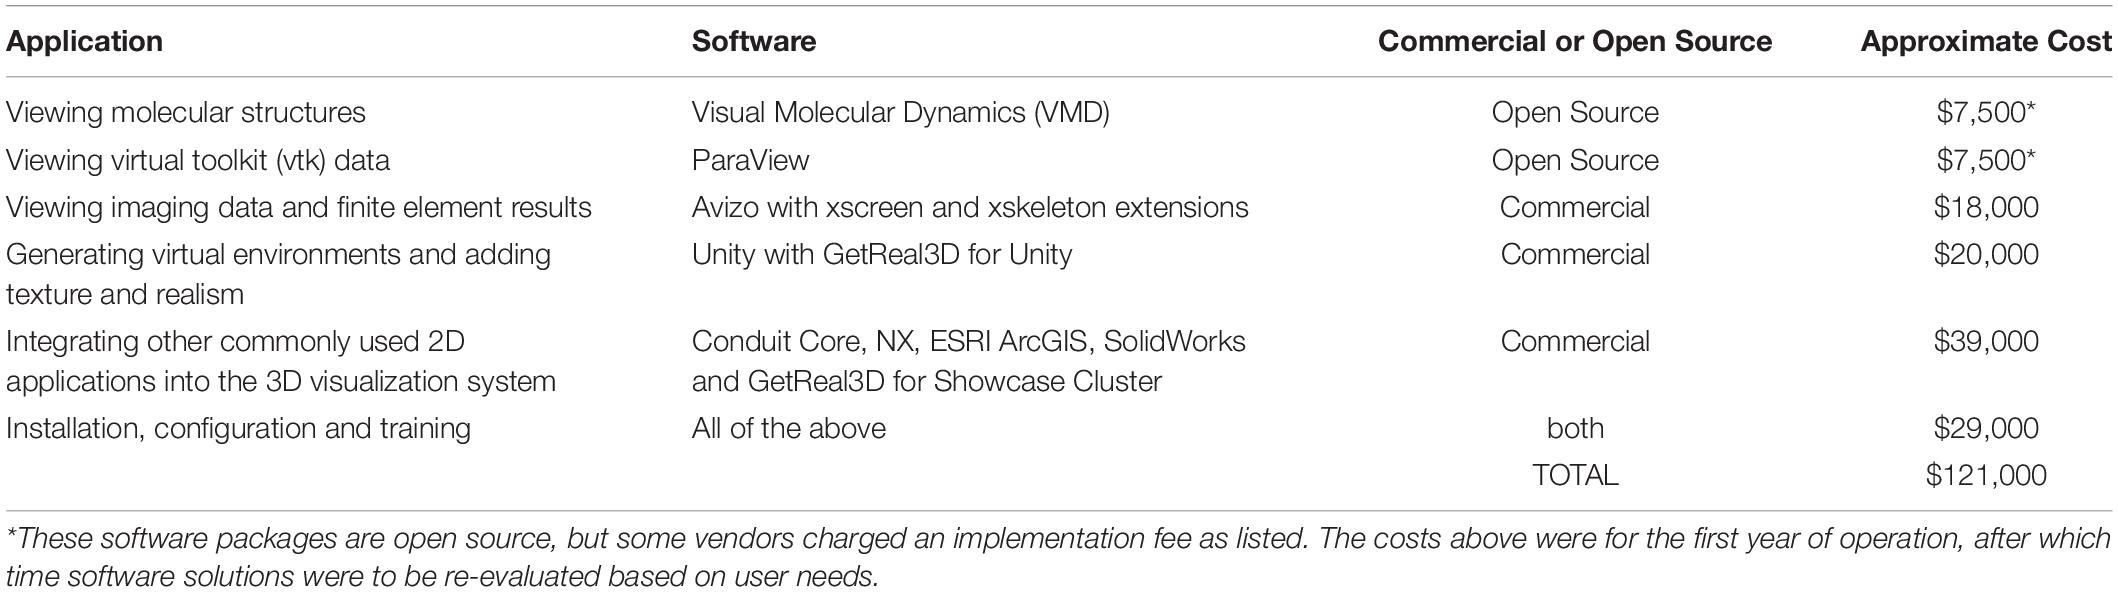
Table 3. Software solutions identified for potential users of MARVL.
Results
System Selection
The test patterns generated during the demos of each vendor as digitally captured are shown in Figure 4. Quantification locations (top, middle, and bottom) correspond to the lines in Figure 4 located at approximately 10, 50, and 90% of the viewable height, respectively, and illustrate the level of uniformity and contrast levels across the projected surfaces offered by each vendor during their demonstration. The results of this quantification indicate that Vendor A provided a combination of screen material and blended projection of the test pattern that was superior to that offered by Vendor B in the instances tested at our institution. These benefits of more seamless blending and uniformity also extended to content provided by MARVL that was shown during Vendor A’s demo. Feedback from potential users indicated, almost unanimously, that the Vendor A team was more prepared since they had configured 3D content sent by end users for viewing and were more knowledgeable of the details in their quoted solution when asked related questions. In response to feedback from potential end users around the time of these demonstrations, Vendor B provided a revised quote for a system with resolution similar to that provided by Vendor A. Similarly, end users liked the increased depth of the solution offered by Vendor B, which prompted a revised quote from Vendor A that included one additional projector per side of the proposed IVE.
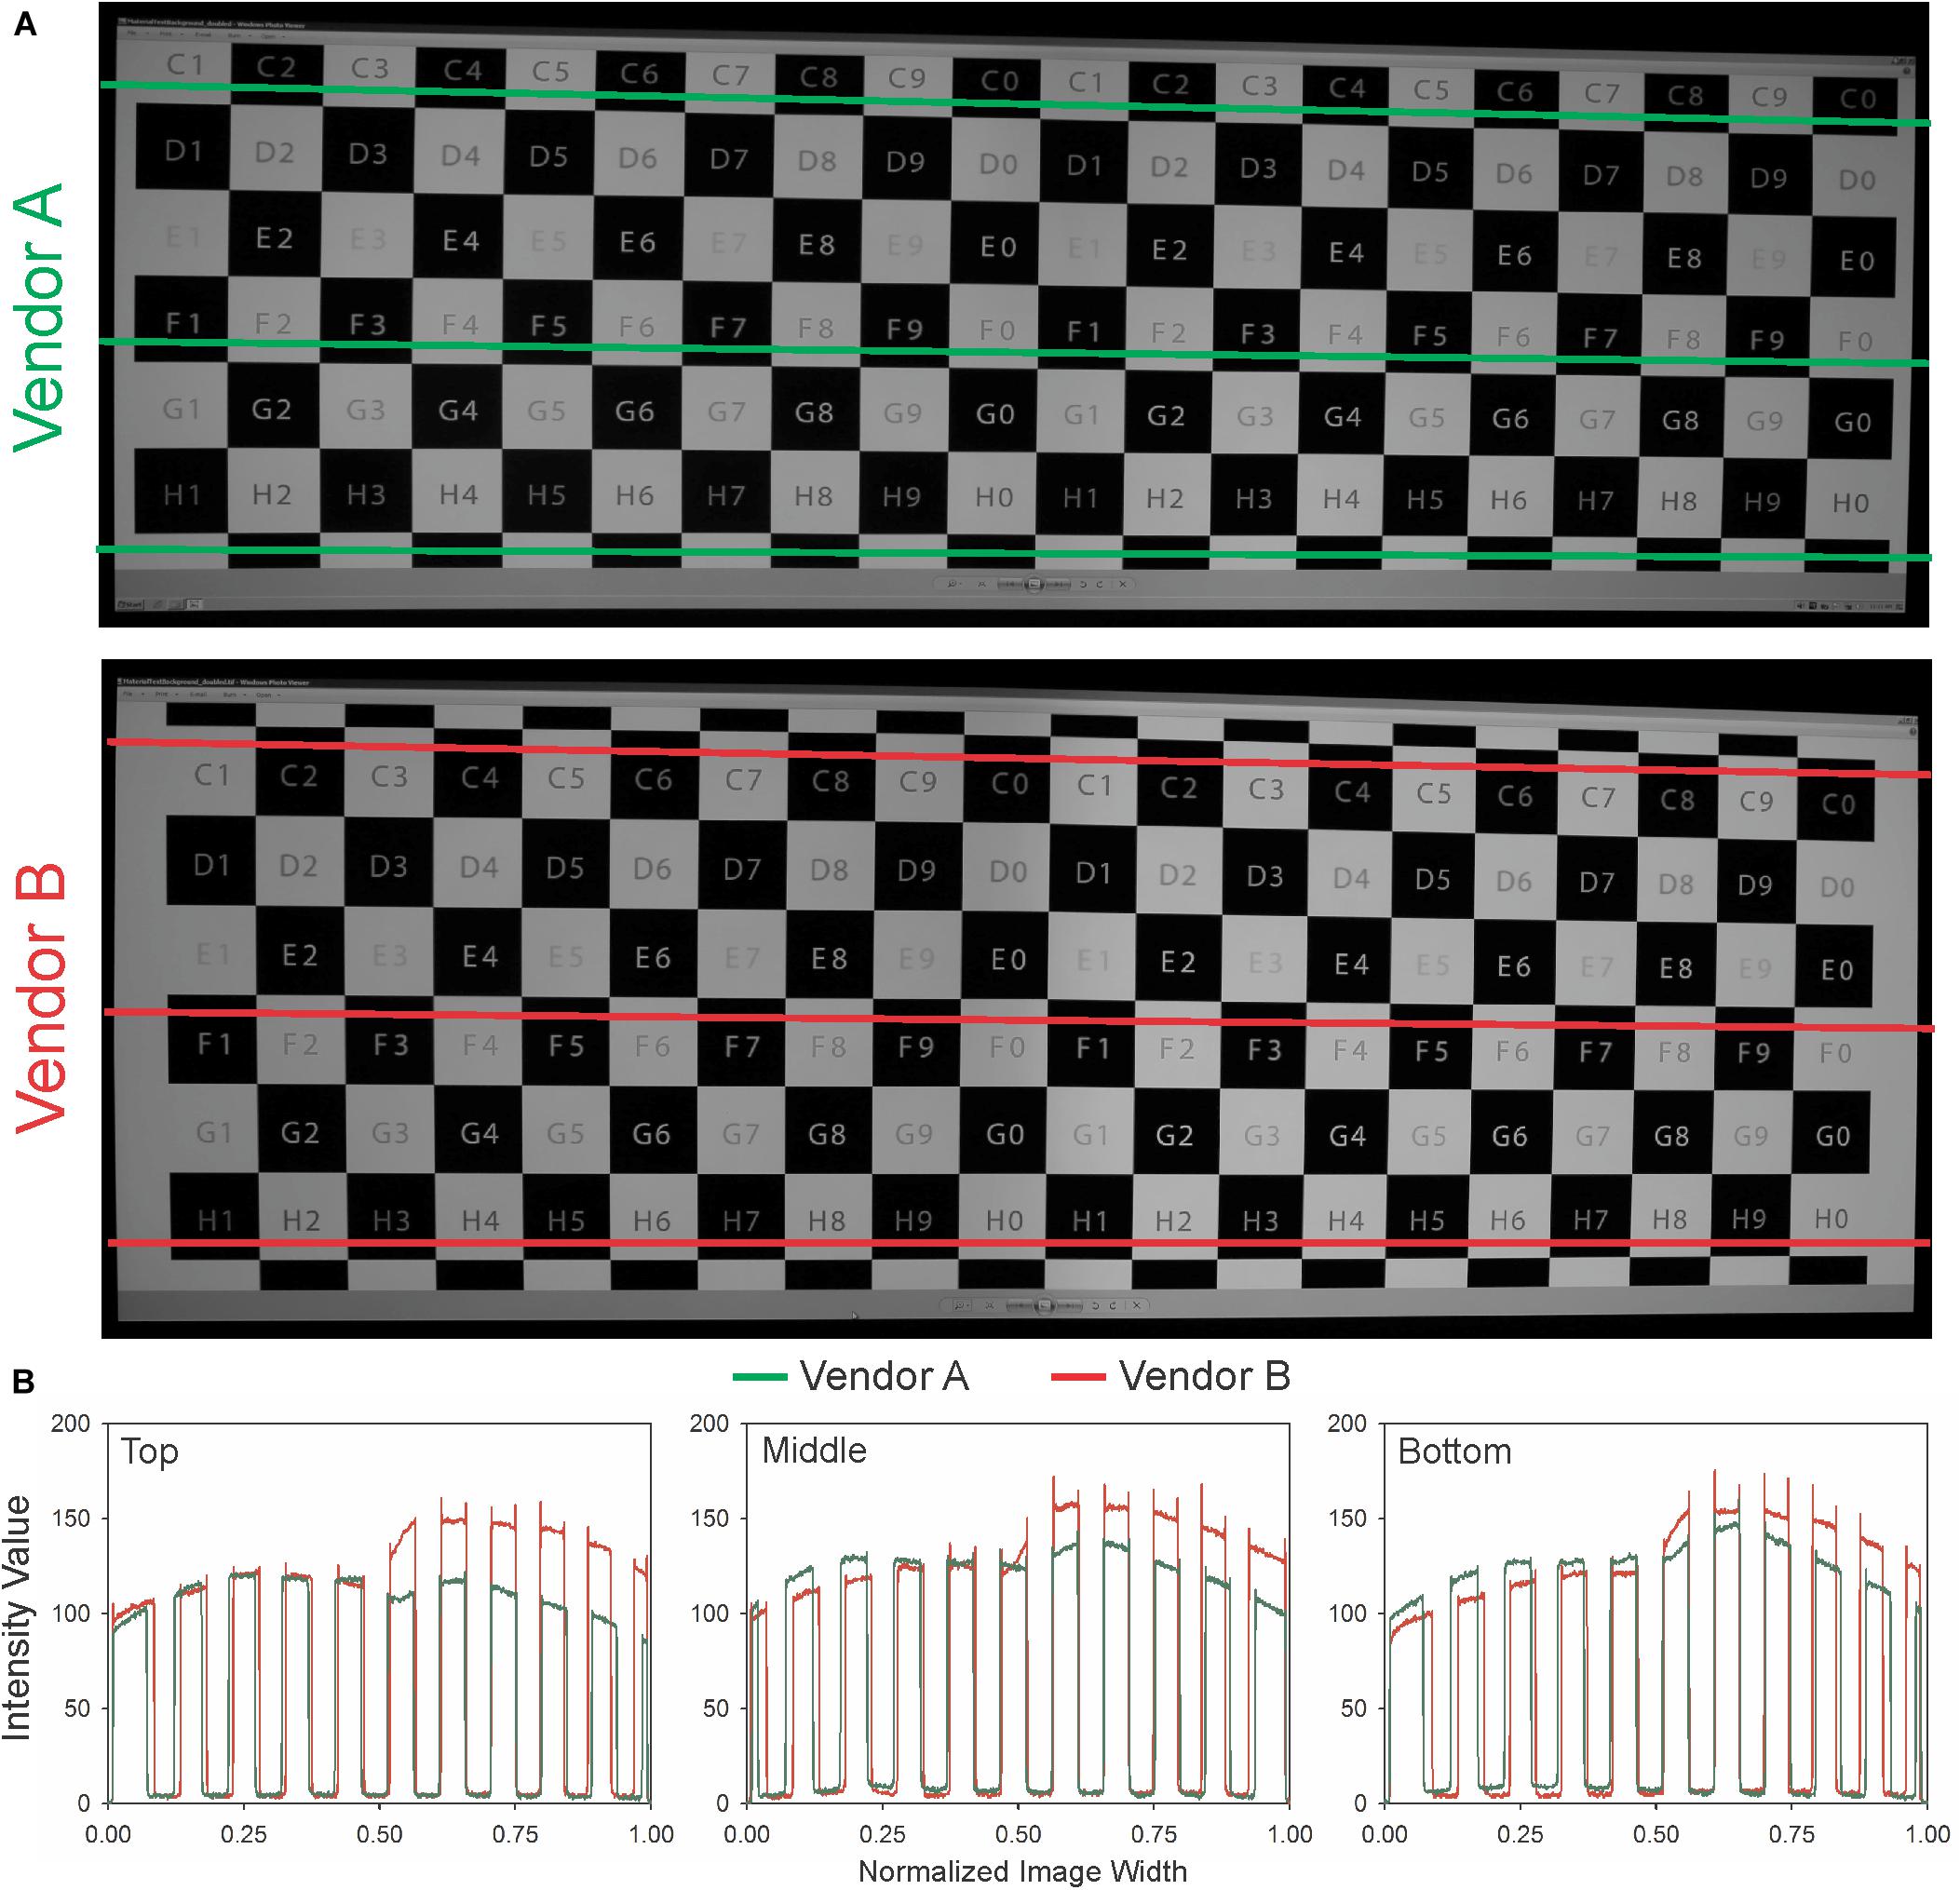
Figure 4. Images of the test pattern generated by the systems of each vendor and captured as digital images by our professional institutional photographer (A,B). The horizontal lines represent spatially-equivalent locations where each photograph was analyzed offline to quantify uniformity and contrast between white and black levels across the projected surface. The three green and red lines are located at approximately 10, 50, and 90% of the viewable height, respectively (A), and the colors correspond to those in the quantification below the images. Quantification of these test patterns (B) illustrate uniformity and contrast between white and black levels across the projected surfaces offered by each vendor during their demonstration.
Based on feedback obtained from potential users following on-site demonstrations by each vendor, the quantitative metrics mentioned above, consideration of important differences between system attributes such as resolution and size, and upon consideration of system price, Vendor A was contracted with to install the structure, projectors, screens and tracking system for MARVL, consistent with the details provided in their revised quotation. A rendering of the system as envisioned prior to installation is shown in Figure 5. The time to functionality upon selecting a vendor and generating purchase orders was 34 days, which included installation and completion of punch-list items.
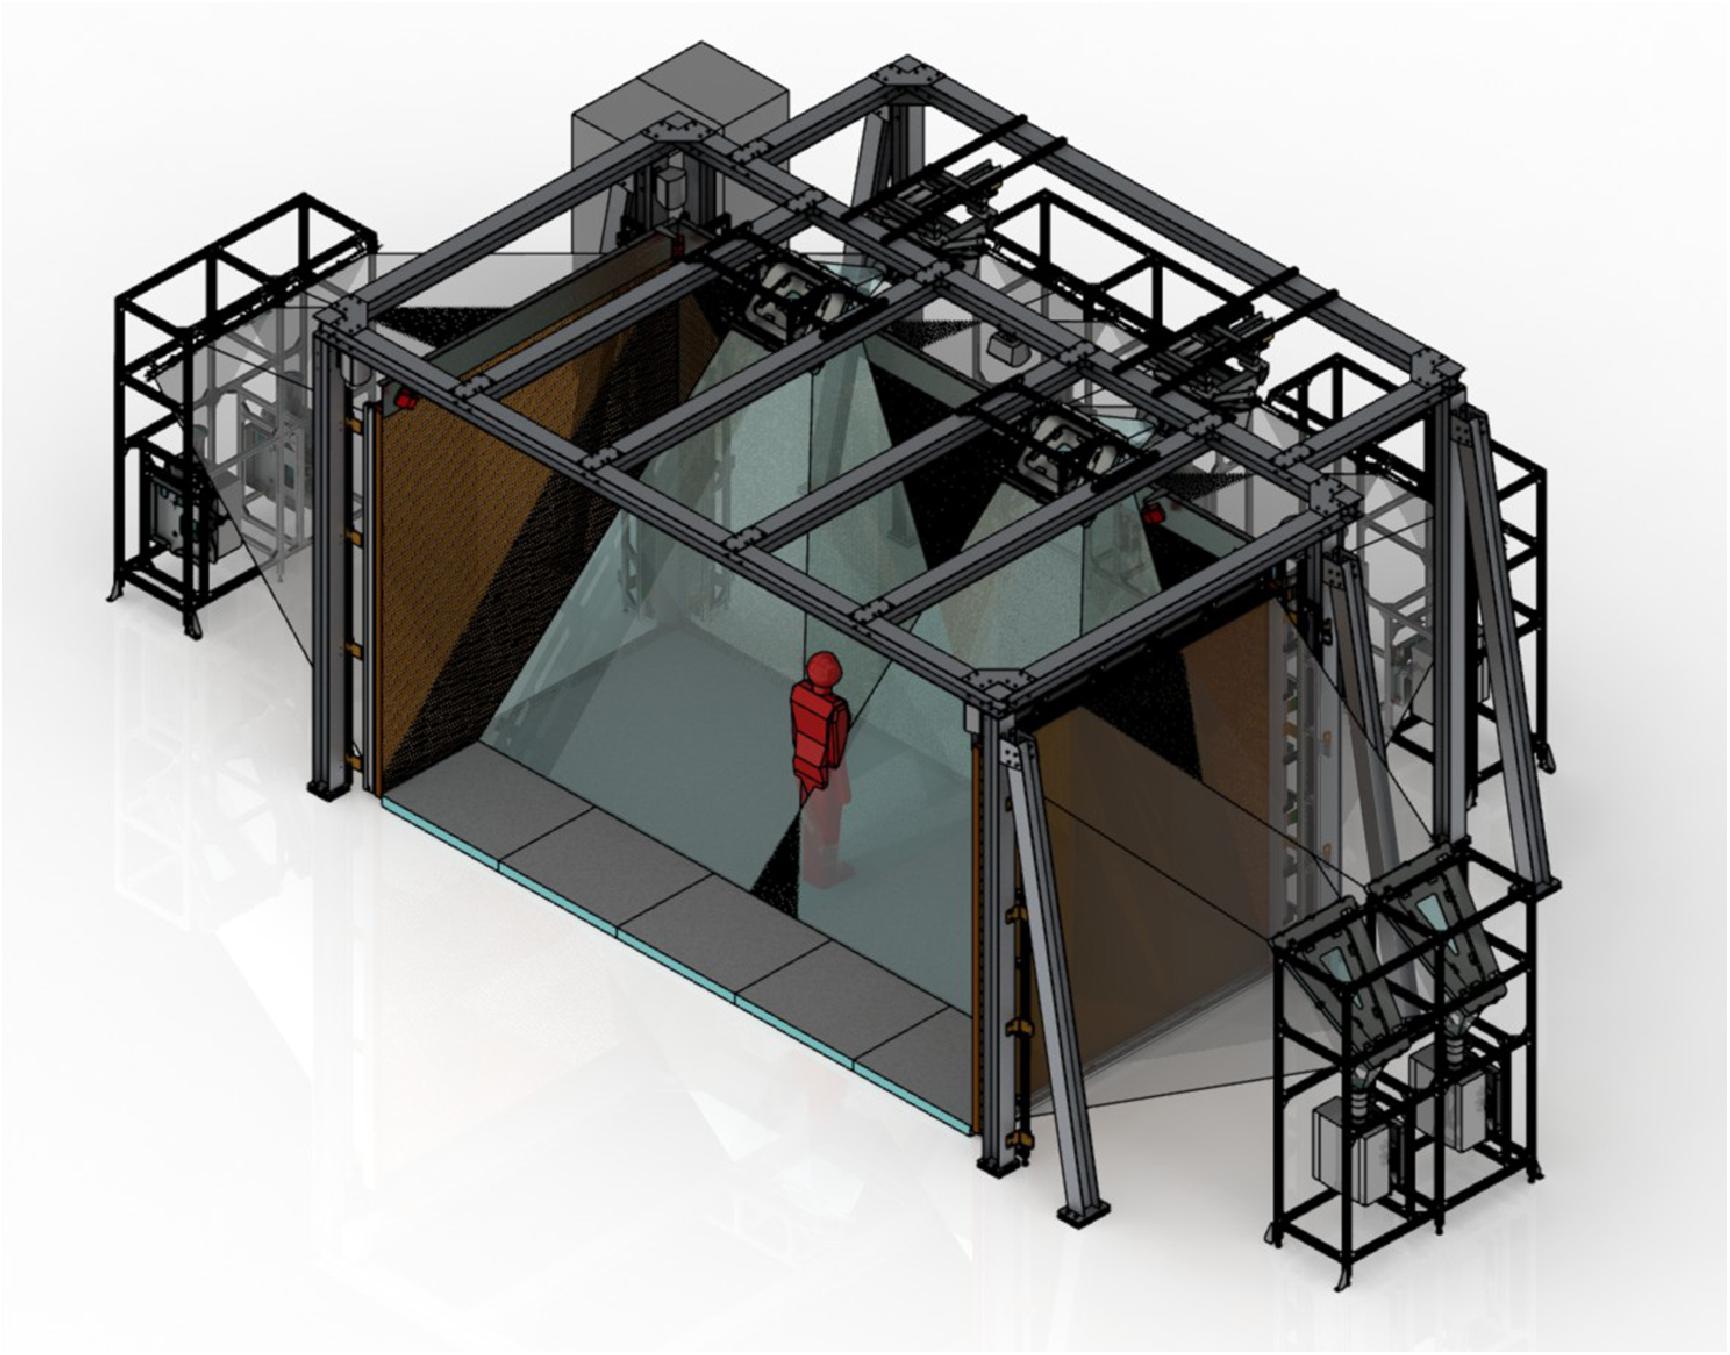
Figure 5. Rendering of the immersive virtual environment selected for MARVL as envisioned prior to installation.
Specifications of Image Generators and Operation
It was determined that content for use within the large-scale IVE provided by Vendor A would be driven by hardware consisting of six image generators. This included a primary image generator (Z820 E5-2670 workstation with 1 TB HDD and 32 GB RAM; Hewlett-Packard, Palo Alto, CA, United States) containing a single graphics card (Quadro K5000; Nvidia Corp., Santa Clara, CA, United States), which communicated control to five additional Z820 image generators via a local Ethernet network isolated from the institutional network. Image generators beyond the primary node were configured with two Nvidia Quadro M4000 graphics cards and a single Quadro Sync Interface Board. The graphics cards collectively provide 10 output channels, one for each of MARVL’s ten projectors (Mirage WU7K-M projectors with Twist; Christie Digital, Cypress, CA, United States). Images rendered by the 10 projectors are warped and blended to cover multiple display surfaces including the extra wide front wall (four projectors) as well as the floor, and two side walls (two projectors each). The result is stereoscopic projection and enhanced depth cues over a viewable dimension of 18′6″ (front) × 9′3″ (height) × 9′3″ (depth). Resolution is ∼4 K on the front wall, with a total system resolution of 15.7 megapixels. All image generators were dual-booted, running Xubuntu Linux and Microsoft Windows 7 Professional 64-bit. Interaction within the virtual environment is afforded by a tracking system consisting of 6 ARTTRACK2 cameras and two FlyStick2 wireless interaction devices (Advanced Realtime Tracking; Weilheim, Germany).
The subsequent initial operation of MARVL’s large-scale IVE is shown in Figure 6. This figure demonstrates how synchronization signals propagated at the time, and how they impact multiple components within the visualization space (left). Multiple layers of calibration are necessary to align all the projectors in used in the space (right). Original plans did not use SLI Mosaic, because it was unstable in previous driver versions. However, on Windows, SLI Mosaic does handle rotation. On Linux, rotation conflicts with the stereoscopic 3D settings, so rotation must be implemented in each application’s configuration files.
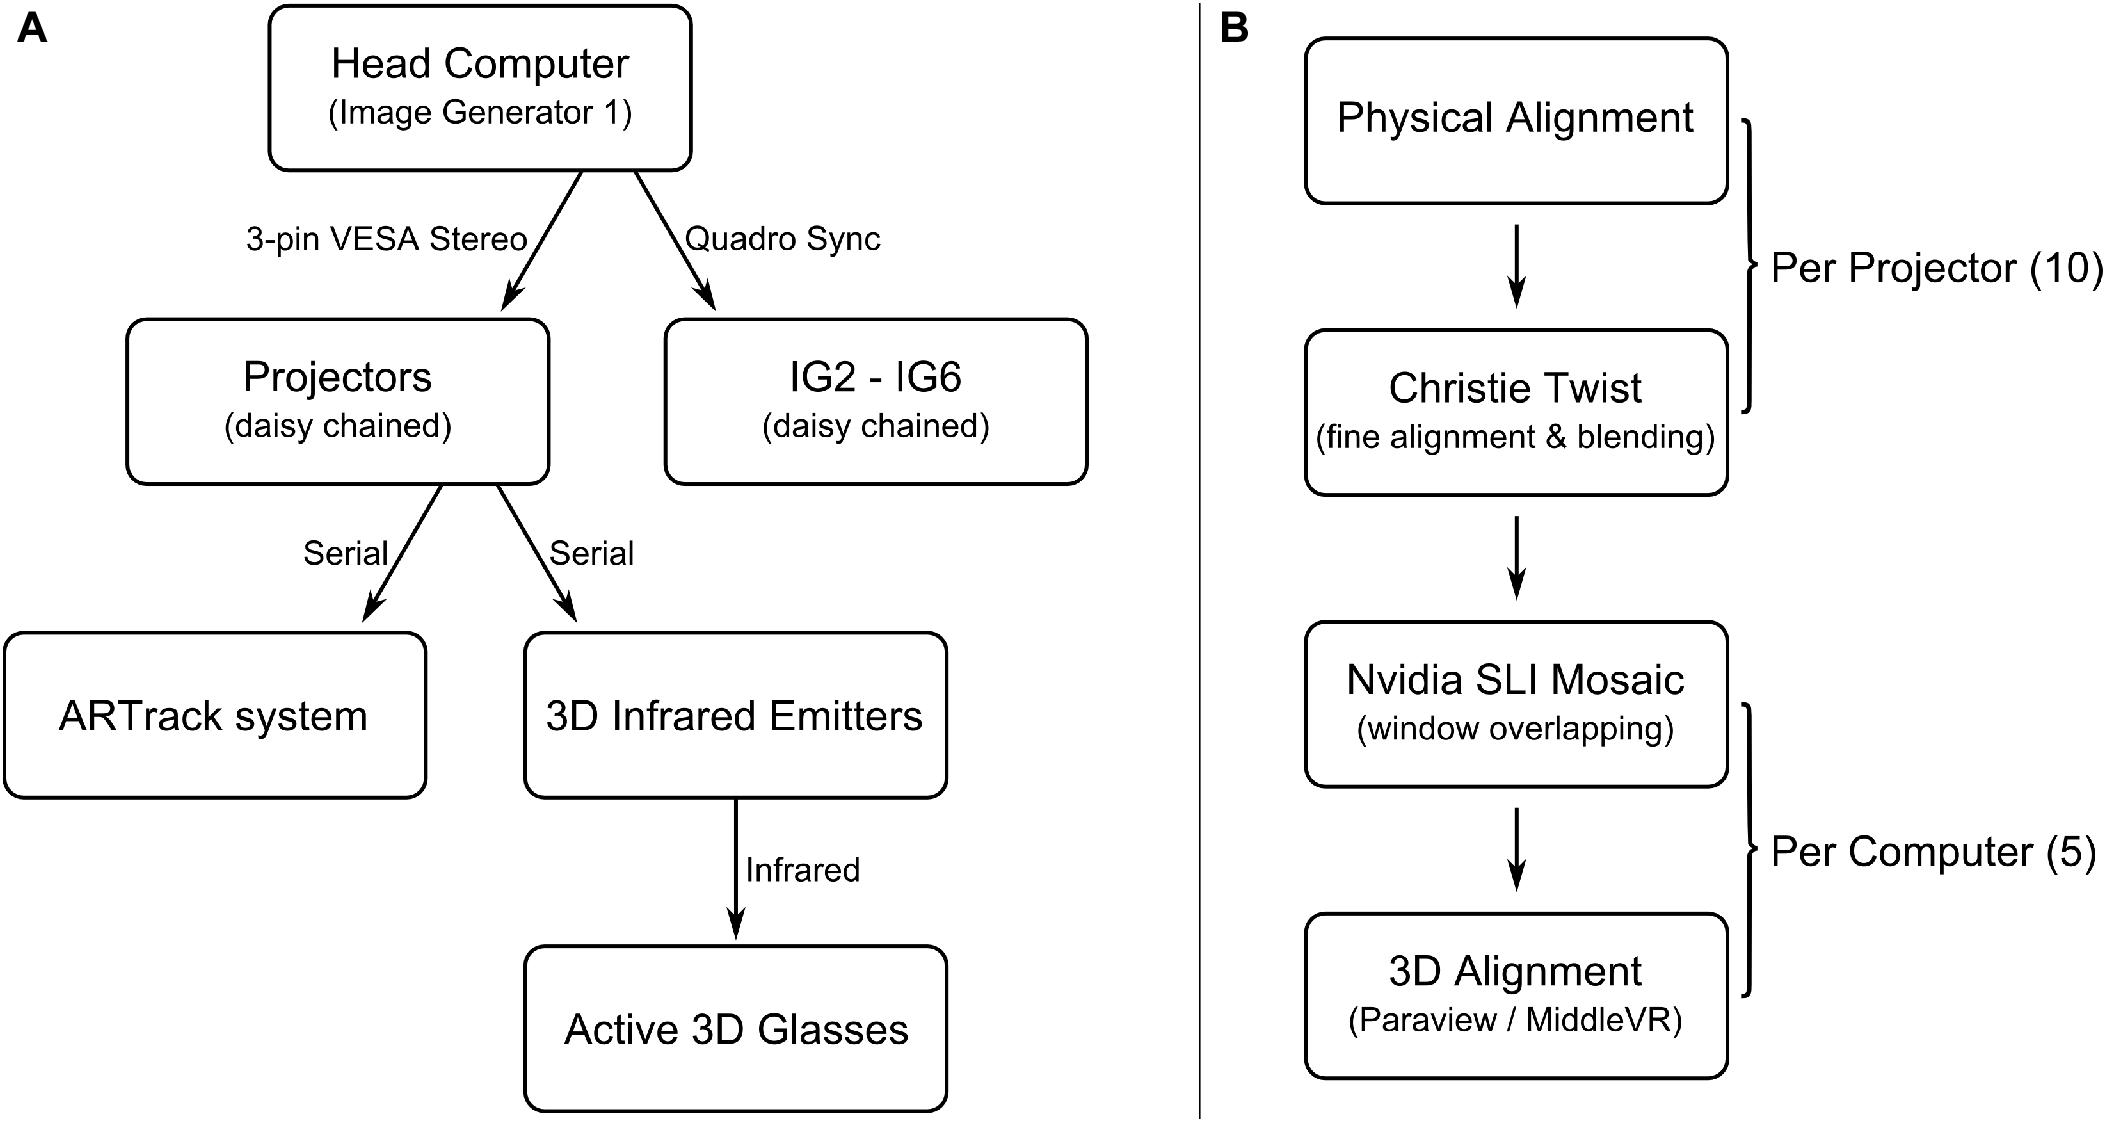
Figure 6. Alignment and synchronization of MARVL. This illustrates how synchronization signals propagate, and how it impacts multiple components within the visualization space (A). Multiple layers of calibration are necessary to align all the projectors in used in the space (B). The original plans did not use SLI Mosaic, because it was unstable in previous driver versions. On Windows, SLI Mosaic handles rotation. On Linux, rotation conflicts with the stereoscopic 3D settings, so rotation must be implemented in each application’s configuration files.
Software Selections
The potential software costs outlined in Table 3 were intractable with our available budget, particularly when several packages required annual renewal. Fortunately, several other options were gaining prominence around the time our system installation was being completed. Members of MARVL subsequently explored other cost-effective options that appeared robust and could provide the functionality needed by our end users. These options centered around Blender (Blender Foundation; Amsterdam, Netherland) and the Unity game engine (Unity Technologies, San Francisco, CA, United States). The combination of these programs would become the basis for all projects conducted in MARVL to date. Briefly, Blender is generally used for mesh processing and to prepare models for immersive visualization. Within Blender all model objects are set to have a consistent scale and default orientation, and their origin is established in a sensible position near an object’s center of gravity. In some cases, the decimate filter within Blender is used to reduce an object’s vertex count. After the models are prepared, it is a straightforward procedure to import them into Unity using a typical workflow. An environment is created to house models, the models are positioned in the scene, lighting is established, and complementary features or data are added as needed for a particular application. MiddleVR (Le Kremlin-Bicêtre, France) was added to the Unity project, providing support for displaying the virtual scene across the clustered set of image generators, as well as to provide a user movement system via the ART FlySticks and tracking system. The total cost for this collection of software packages was approximately $25,000 upon establishing the MARVL large-scale IVE and software renewals have cost approximately $3,000 annually to date.
It is worth noting that the presentation of software solutions at the time when we were planning our system was generally less of a consideration for most vendors. Even some of the most prominent CAVE research papers do not spend much time discussing software, which future work from respected groups has subsequently published pertaining to specific software developed for a given application (Febretti et al., 2013; Nishimoto et al., 2016; Renambot et al., 2016). In contrast we treat Unity, and our leveraging of Blender as part of this process, as a standard solution. This relates back to our facility being within an educational institution and being able to assist in the content creation and presentation process for a variety of applications, rather than developing a particular software solution that is then to be used by end users within a particular discipline.
As mentioned above, we developed a list of planned applications, and a list of necessary software to match during the planning stage of our large scale IVE. The initial version of this facility was configured to dual boot between Xubuntu and Windows, in order to provide the greatest amount of flexibility in software. For the first year of operation, we ran most simulations in ParaView VR and Blender Game Engine on Linux, and Unity with MiddleVR on Windows. We continued to run experiments and trial versions of other software, but as we gained more development experience, we settled into a more consistent content development pipeline of using Blender and Unity for nearly all applications. As new content challenges arrived, such as a new 3D model format, video playback, or other interaction devices, in most cases were able to integrate them into Unity in order to bring them to our large scale IVE.
Project Development Process and Decision Points With End Users
With hardware and software selections in place to form a functioning immersive facility, MARVL personnel have settled into a process for projects and decisions made in conjunction with our end users. Although not rigid, MARVL personnel typically ask versions of the following four questions when new projects have been proposed by potential end users.
(1) How does the application that the experience and content addresses benefit from an immersive approach?
(2) What is the purpose of the immersive experience and its associated content?
(3) What resources and personnel are available to support content creation and delivery?
(4) What measures will be obtained from the immersive experience, and can they be evaluated statistically in potential support of the added effort spent on immersive content creation and delivery.
To date, MARVL personnel have not made the decision about which projects move forward within our facility. If questions 1 and 2 above have tractable answers, and the project has a champion, then it has historically moved forward organically by its own motivation. Given our focus on education within our institution and college, applications favoring educational objectives have been a priory. Those projects with defined outcomes and measures that could result in external funding or manuscript submission have similarly moved forward frequently, as efforts on such projects have the ability to grow MARVL and its user base. Historically, the only projects that we have strongly suggested not progress have been those desiring to recreate physical spaces in their current or near current form that we can reasonably travel to near campus, and content that would not have distinct benefits to immersive viewing upon creation. Currently we do not charge for educational projects since our content development personnel is partially supported by the college. In short, we operate as service organization for the college and university, while also having investigator-driven research goals that are now starting to be realized through grants and contracts.
Data Collection
Most projects to date have used existing data. For example, our computational fluid dynamics content discussed below uses converged simulation results that are viewed in new ways, including comparatively between groups of experiments or with complementary data not often viewed when looking at CFD results using conventional approaches. In most cases, data are not generated during an immersive viewing session within our large scale IVE. Although the ARTTRACK camera system is registering the location of the FlyStick within the tracked space, this information is streamed and not stored. When applications have required storing of associated data, separate data acquisition systems have been brought into the immersive space for that purpose and results have been stored either remotely or on a dedicated share of our network attached storage (NAS) drive, depending on end user preference. Even the performance and visual arts work featured below is based on an existing framework of materials. MARVL personnel do not necessarily have a preference for the use of data-driven content relative to free 3D sculpting (for example) that would not be based on data. This outcome has simply been a byproduct of the visions expressed by of our end users to date. The data-driven experiences to date, together with the background of current MARVL personnel in film, animation and graphic design has also organically led to our focus on a high degree of realism within the content that is created.
Simulator Sickness
During the installation and calibration of MARVL’s large scale IVE, enabling head-tracking was a major milestone required to convincingly immersive users within the space so they would temporarily forget about the boundaries of the screens and their current location in the room. However, our early experiences using head-tracking with classes of students quickly indicated that this hallmark of many immersive systems (i.e., head-tracking) was not well-received by our audience. When discussing this issue with other immersive facilities, we were reassured that issues pertaining to simulator sickness were much less of a concern with large-scale IVE than with head-mounted displays because the users’ vision was not fully dominated by the display. However, upon opening MARVL to larger audiences, only a few users in the room (i.e., the person being tracked and those closest to him or her) were experiencing the immersion to the desired degree, while other patrons (i.e., secondary users) had a suboptimal experience for several reasons. Most noticeably, the head motions of the tracked user were visible to the entire audience, which created a high amount of camera motion. This camera motion was especially pronounced as a result of the subtle motions that accompanied tracked users standing or speaking. The secondary users experienced stereopsis issues because their heads were rarely aligned with the stereo axes tracked from the primary user’s head. If the secondary users looked at the side projection screens when the primary user was not, the stereo axis would be ∼90° off. Fortunately, we were able to resolve these issues by disabling headtracking. Instead of attaching the virtual cameras to a position read from the tracking system, we chose a position and orientation representative of a seated height in the center of the room and locked the virtual cameras to that point. The stereo axis of each screen was aligned to the face normal of each screen, which allowed the audience to see a stereo image on all screens, at the expense of a more pronounced screen boundary.
Motion to photon latency (Solari et al., 2013) became a major concept to measure head-mounted virtual reality system latency around 2013. Unfortunately, this metric was not discussed during the design phase of our facility. It was assumed that powerful computer hardware and high-quality components would be enough to avoid issues, but we did not have a method for predicting system latency until our system and facility were fully functional. We did not conduct a rigorous timing of the headtracking latency, but there is a slight noticeable lag when using tracked controllers and head-tracking together. Factors that contributed to our latency were 60 to 120 Hz rate conversion on the projectors, GPU buffering due to external synchronization, VRPN-based system complexity, and MiddleVR’s cluster synchronization method. Innovative optimizations like asynchronous time warping and instanced rendering were coming to head-mounted displays, but those technologies were difficult to apply to a clustered configuration such as that of our large-scale IVE. We were able to make minor improvements to our latency issue through software configuration changes, but without head-tracking, we were no longer obligated to move the camera position for every frame, making the camera position appear to be more stable and stationary, except during deliberate movements. There are also a few design guidelines we now follow in order to reduce eye fatigue and avoid simulation sickness. For example, whenever text or UI elements are used, they are always placed on the convergence plane. When a speaker is in the immersive space, they stand on the edges of the front screen, especially if there is a scene utilizing negative parallax.
Example Content
Some examples of content created and visualized through collaboration with the original end users identified during the planning stage are shown in Figure 7 and discussed in more detail below. We begin these examples by describing the processes above implemented for a project aimed at training of nursing students using realistic clinical environments.
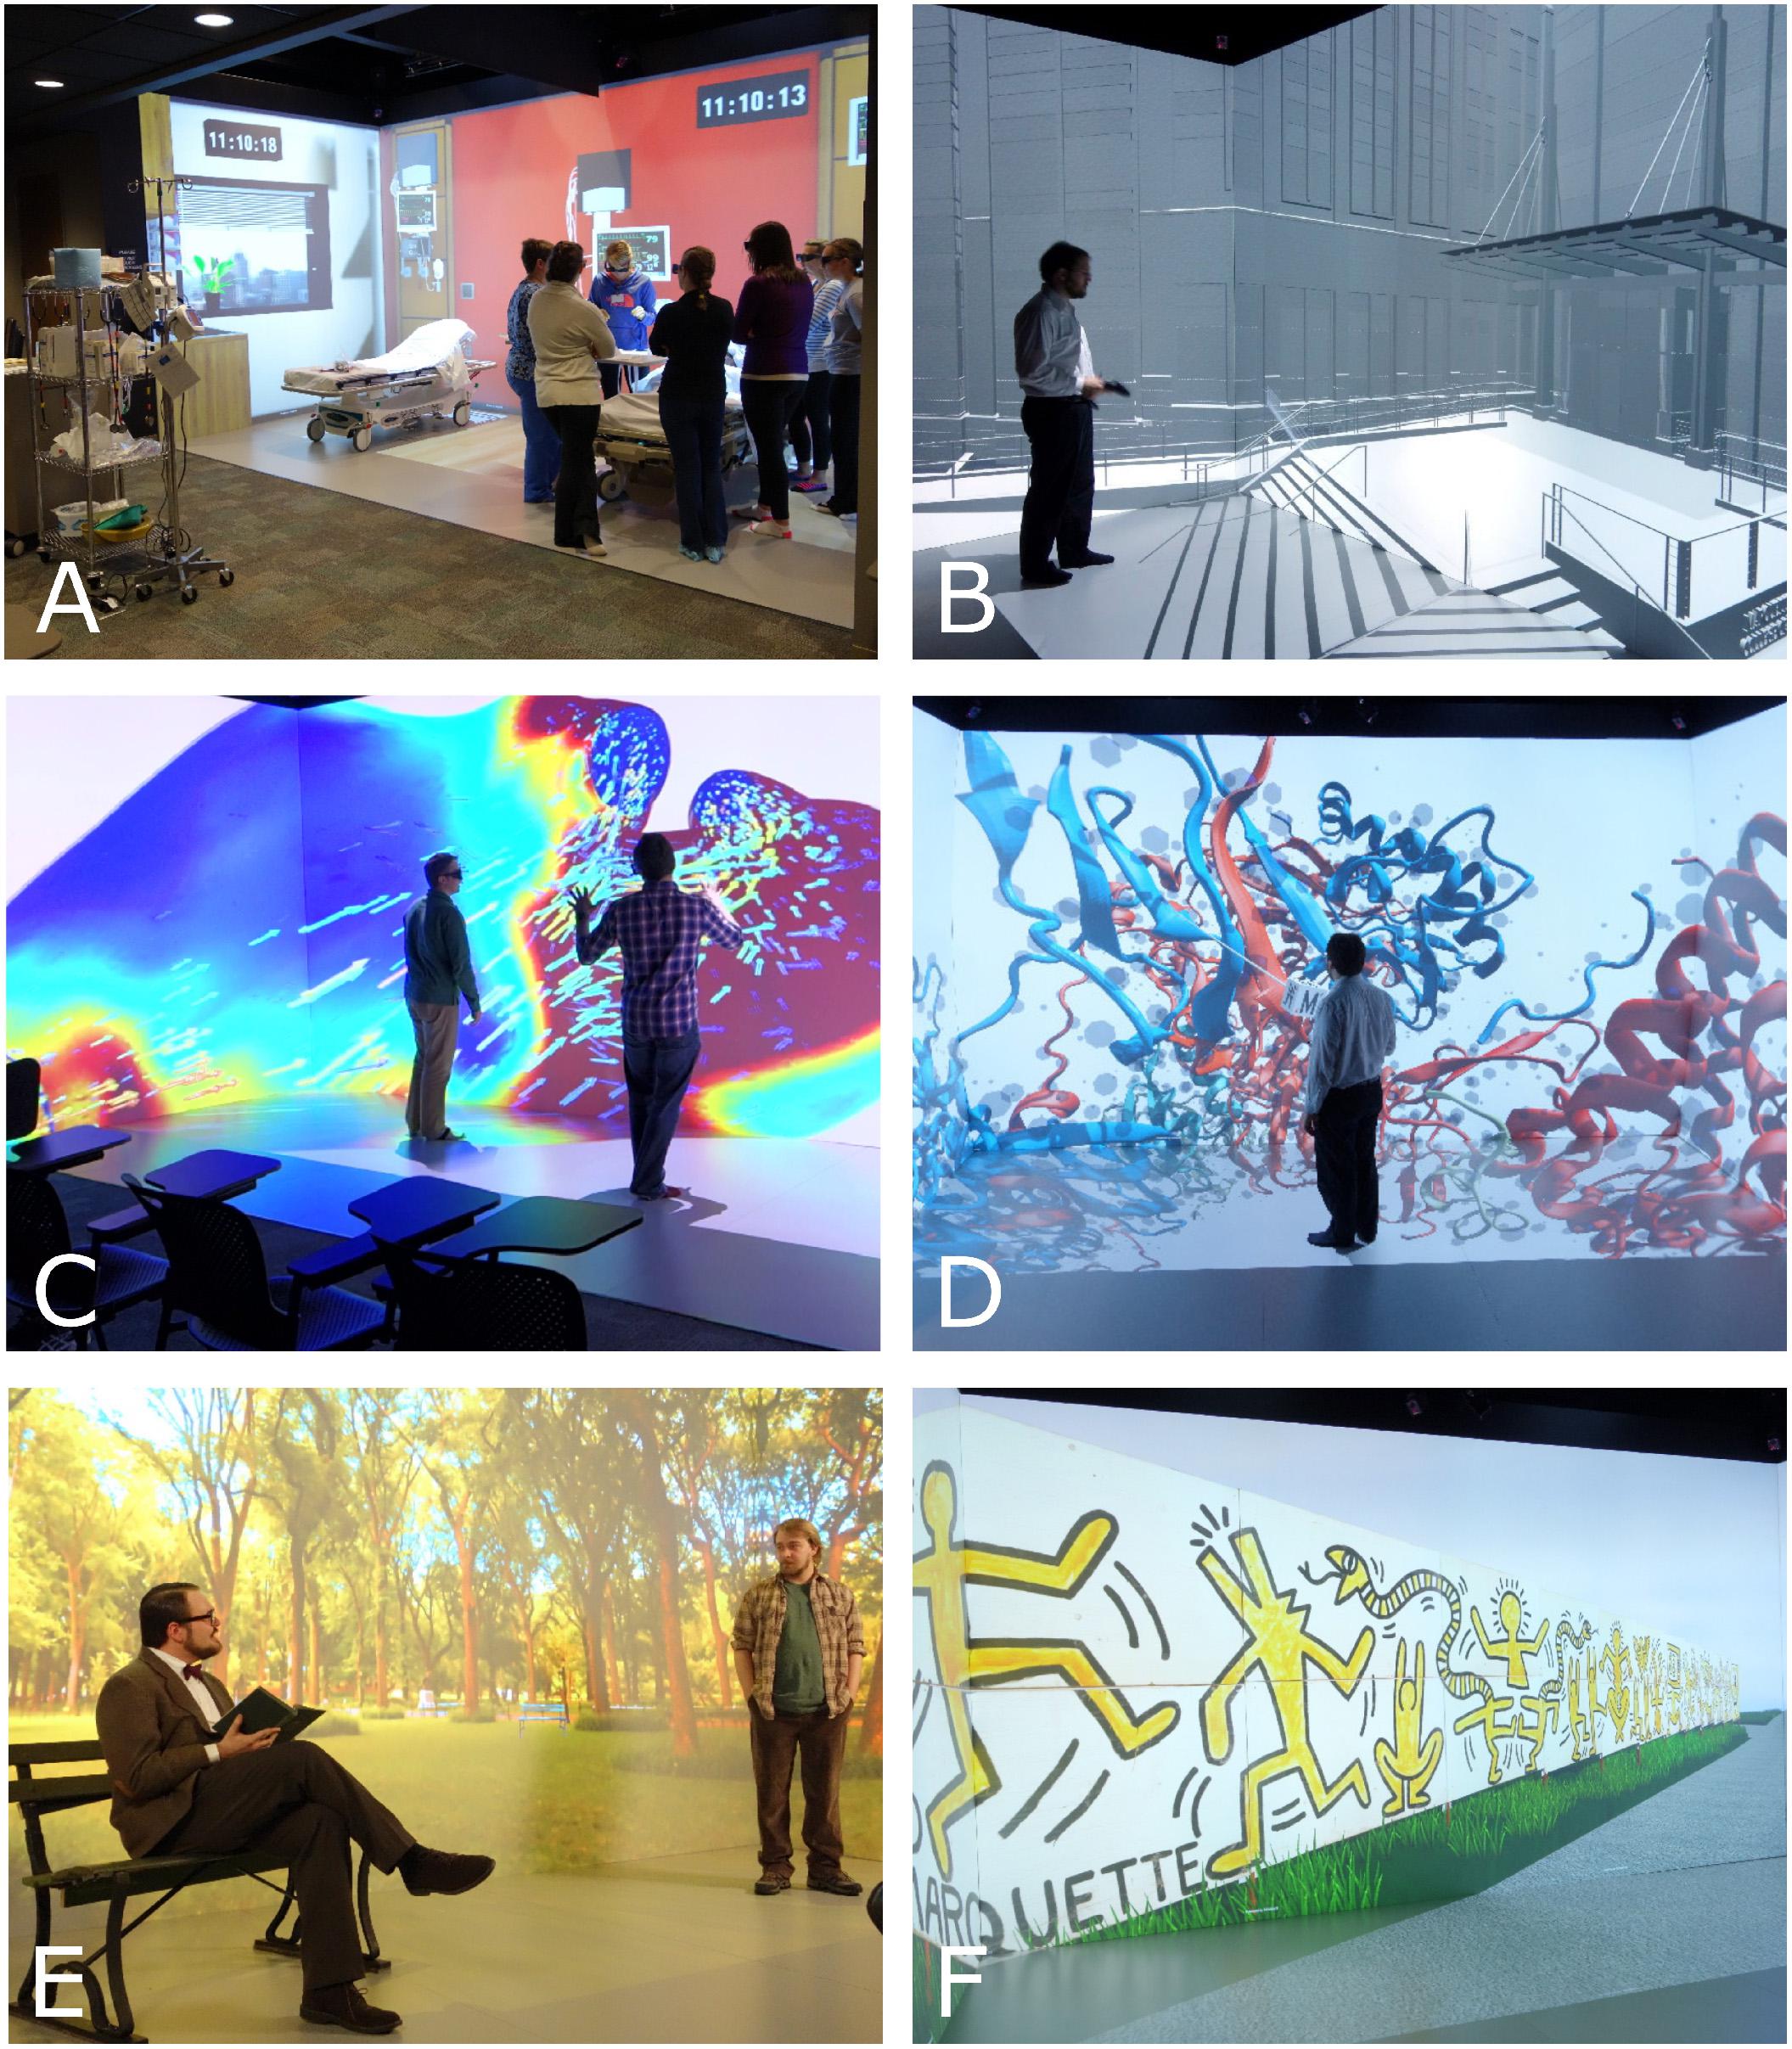
Figure 7. Example content from end users identified during planning of the visualization space. Written informed consent was obtained from all individuals in the featured content. Applications include augmenting training experiences for nursing students (A), enhanced viewing of civil engineering infrastructure, architecture, and computer aided design models (B), immmersive visualization of biomedical computational fluid dynamics results (C), viewing of protein structure and electron density maps (D), performing arts (E), and visual arts (F).
Augmenting Nurse Training Opportunities Using Realistic Clinical Environments (Figure 7A)
The use of simulation is common in nursing education. Many institutions have dedicated physical areas designed to resemble specific clinical environments, including applicable equipment for nursing students and other healthcare trainees to hone their skills. Unfortunately, often there is not enough space at a given institution to physically replicate all the clinical or home health care environments that students will experience in practice. Moreover, it can be difficult and, in some cases potentially unsafe, to place trainees into a real clinical environment. A large-scale IVE has the potential to mitigate these space and safety issues with virtually constructed environments. Figure 7A shows an example of a program implemented with this in mind.
Faculty within the College of Nursing at our institution were familiar with immersive approaches as a result of the nearby Virtual Environments Group (formerly known as the Living Environments Lab) (Brennan et al., 2013a). Several faculty members therefore reached out to MARVL during the planning stage and joined its personnel during visits to other immersive visualization facilities. As alluded to above, the ultimate goal of our nursing collaboration was to extend the number of clinical training facilities beyond what was physically possible within the existing simulation lab in the College of Nursing. For example, the existing simulation facility includes rooms mimicking surgical units, but not an emergency room. As a first step before creating new immersive, virtual spaces for training, our collaborators sought to quantify the ability of nursing students to learn in an immersive facility meant to replicate an existing clinical environment. Although the creation of such content is contrary to the details mentioned in our project development section above (i.e. not to recreate an existing physical space in close proximity), MARVL personnel agreed it was important to ensure students could transfer learned skills in an immersive environment to a similar level as they could in the physical environment before extending the collaboration to additional clinical environments that were not physically available. MARVL personnel therefore visited the physical space (Conover, 2014) to photograph elements to be replicated virtually. MARVL’s visualization technologist worked with four animation students from a local technical college to create 3D models of the environment, using Blender, 3D Studio Max, and Unity. Members of MARVL will frequently invite students and occasionally work with animation consultants as needed in the content creation process, depending on the scale and objectives of a particular project. Here again the location of MARVL within an educational setting has led to a tendency to involve undergraduate and graduate students in research and immersive experiences whenever possible.
Upon completion of the virtual space, ∼50 Master’s level nursing students from our institution were randomly assigned to learn nursing skills in a physical clinical environment or MARVL’s IVE (Conover, 2014). The skills taught focused on acute care assessments, aseptic technique, naso-gastric tube insertion, tracheostomy suctioning, and Foley catheter insertion. During an orientation session, students completed a questionnaire regarding comfort and prior exposure to immersive visualization approaches including virtual reality. Each week of the course thereafter, all students met in the physical clinical environment where they received a demonstration of that week’s skill, which was then practiced by half of the students in the immersive version of the physical clinical environment. Students in both the physical and immersive environments were given an equal amount of time to practice and perform a repeat demonstration of the skill that was presented in the combined group teaching session. Student skill performance in both groups was assessed using the same performance rubric. At the end of the course, students who trained in the immersive environment also took their final exam in the physical environment to determine whether these students could transfer their learning from the immersive environment to reality. Students who trained in the immersive environment performed at least equal to those of the other group on all skills tests. It is worth noting that MARVL’s end user nursing collaborators felt that interaction with details within the virtual environment would be crucial for the translation of skills. Therefore, rather than using a haptic approach or virtual reality gloves, we opted to recreate the clinical sights and sounds with a dynamic environment and position physical material that students needed to interact within into the immersive space. This underscores the utility of the extra wide IVE for which this and other applications were designed.
Additional content has subsequently been created for use with nursing students in MARVL using an approach similar to that discussed above. For example, our most recent collaboration used content that was created to immerse students in a simulated study abroad trip to Peru. Photos of the study abroad clinical spaces the students would experience were used to generate content and representative audio was selected from royalty free sources. Students navigated the immersive space and interacted with a physical Spanish-speaking actor trained in the clinical experience prior students had encountered. Pre-test and post-test questionnaires were used together with a wireless data acquisition system to temporally quantity changes in respiration, heart rate, galvanic skin response and other measures related to anxiety and preparedness during several simulations prior to the study abroad experience.
3D Viewing of Civil Engineering Infrastructure, Architecture, and Computer Aided Design Models (Figure 7B)
Advances in immersive visualization make it possible to conduct careful study of architectural features and civil engineering infrastructure, including better understanding of sightlines and building information modeling. Whether the objective is pre-visualization prior to erecting a structure (Figure 7B), or reconstruction of building complexities from the distant past that are made accessible for the first time for a new generation, such study is made possible by the procedures implemented within MARVL’s large-scale IVE. The interactivity provided by an IVE offers the chance to focus attention on the details, decisions and/or symbolic meaning that may accompany each portion of a project. The basis of the control system used to navigate within structures in MARVL is a three-dimensional optical tracking system affording movement in any direction using the FlyStick2 as discussed in more detail below.
Correlating Local Blood Flow Alterations With Markers of Disease (Figure 7C)
Computational fluid dynamics (CFD) is a method of simulating fluid passing through or around an object using digital computers. This approach is common for several researchers at our institution (Bowman and Park, 2004; Borg, 2005; Borojeni et al., 2017; Ellwein et al., 2017). The use of CFD is a common way of calculating blood flow patterns within lumens of the body in order to better understand a particular disease. These simulations can routinely involve millions of elements for which the governing equations of fluid flow are iteratively solved tens of thousands of times to represent a single second of physical time such as one heartbeat. Despite modern biomedical CFD simulations producing 4D (i.e., spatial and temporal) results, these results are often viewed at a single point in time, on standard 2D displays, and rarely incorporate associated data. Figure 7C shows an example of how members of MARVL are using immersive visualization as an approach to mitigate these issues and extract more information from CFD results (Quam et al., 2015) by combining them with available complementary data related to a given application.
Protein Structure, Electron Density Maps (Figure 7D)
During the planning stages of our facility, the end user for this application recounted how he was already using 3D visualization and analysis of protein structure in his publications and classes, but that the implementation of such structures was mostly through 2D and prerendered images using desktop monitors. The end user sought to make better use of the 3D models by presenting them in an immersive and interactive way to assist students in understanding complex 3D structures. This approach is common in immersive visualization and virtual reality. The end user’s prior workflow relied on the open source program, PyMOL2, to convert the protein data bank files into 3D models. PyMOL’s options for exporting its generated meshes were limited at the time of implementation, so MARVL provided personnel support to recreate the models using Visual Molecular Dynamics (VMD)3 as an alternative. Upon optimizing the visual representation, the end user worked with MARVL personnel to import mesh data into Blender, and then Unity. The functionality within Unity was programed to display a series of structures in a linear sequence like an interactive 3D slideshow, as well as display captions, and provide navigation of the space around the structure, but now scaled up to room-size within MARVL’s large-scale IVE (Figure 7D).
Performing Arts (Figure 7E)
Our collaboration in this area began to yield a more immersive way of visualizing lighting and stage design in hopes of limiting edits following physical construction of sets. The collaboration has also focused on dynamic evolution of sets with a focus on small-scale theater, but with a larger audience than could be accomplished with one or more tethered head-mounted displays. As its first production, MARVL worked with the Department of Digital Media and Performing Arts with the Diederich College of Communication at our institution to present The Zoo Story (Figure 7E). This Edward Albee play about two men in Central Park ran for 6 shows and sold over 200 tickets. The director’s vision called for dynamically changing the projected set to coincide with character evolution. This has fostered new ways of achieving digital excellence for productions in the region using an innovative approach to set design that uniquely engages actors and audiences. The Zoo Story was not offered in stereoscopic 3D, but each of the subsequent performances in MARVL included stereoscopic backgrounds with live and virtual actors as most recently portrayed in William Shakespeare’s Macbeth (Hauer, 2017).
Visual Arts (Figure 7F)
Our institution is fortunate to have a dedicated museum on campus. The Haggerty Museum of Art opened in late 1984 as a teaching facility. The goals of the Haggerty Museum of Art are to enhance the undergraduate educational experience by engaging students in various disciplines to think about the world and their subject matter through the lenses of the visual arts. With this in mind, MARVL has transformed work from the Haggerty Museum of Art permanent collection to be experienced in new ways, such as recreating large pieces within era-appropriate representations, and when important pieces may be on loan from the museum. For example, Salvador Dali’s Madonna of Port Lligat comes to life in 3D as an interactive piece with togglable annotations about its history and content. Similarly, a 100-foot-long mural painted by Keith Haring for the construction site of the HMA can also be viewed, in situ, as it was in 1983 (Figure 7F). These versions allow for accessibility and for minute details obscured in a typical installation to be clearly seen.
Discussion
The MARquette Visualization Lab has become a valuable campus resource through its first few years of operation. Since its creation, its members have received numerous queries and requests pertaining to how system attributes and applications were selected. Hence, the goal of the current work was to provide an overview of the process used in creating MARVL, including those used in identifying end users, understanding their potential applications, and synthesizing this information into its subsequent design and operation. We described our qualitative and quantitative approaches to vendor selection along with initial and current software decisions. While companies do offer out-of-the-box turnkey solutions, such systems did not meet the diverse needs and variety of applications expressed by our potential end users. Despite the custom setup of our system discussed above, it was (and continues to be) imperative for us to have a set of processes in place that are general enough for most applications that present. It is important to note that the approaches used to gather input from potential end users, decide on a CAVE-type IVE, and assist in vendor selection were conducted with frequent feedback and transparency at our institution. While the processes described seems to have worked well at our institution, it is reasonable to surmise that other institutions may want to consider different approaches in order to best meet the needs of their end users and overall objectives.
Development of Subsequent Resources
With the development of MARVL’s large-scale IVE came the need for additional space and resources to be used in the development and testing of content. MARVL’s Content Development Lounge (CDL) was established in a room adjacent to the large-scale IVE (Figure 8). The CDL is accessible through a set of double doors, which also permits transport of larger equipment into the IVE as needed. In contrast to a typical classroom or lab, the CDL was designed to be an inviting place for potential contributors to create and share content, hold meetings for ongoing or new projects, and serve as a recording and debriefing site for experiences held in the adjacent large-scale IVE. The CDL includes spacious leather seating, programmable indirect lighting and ergonomic pods with local task lighting. There are several pass-through gang boxes with removable wall plates between the large-scale IVE and CDL to permit communication between the two locations. The CDL contains high-end workstations with 3D monitors and a smaller-scale display system with the same stereoscopic viewing and tracking technology included in the large-scale IVE.
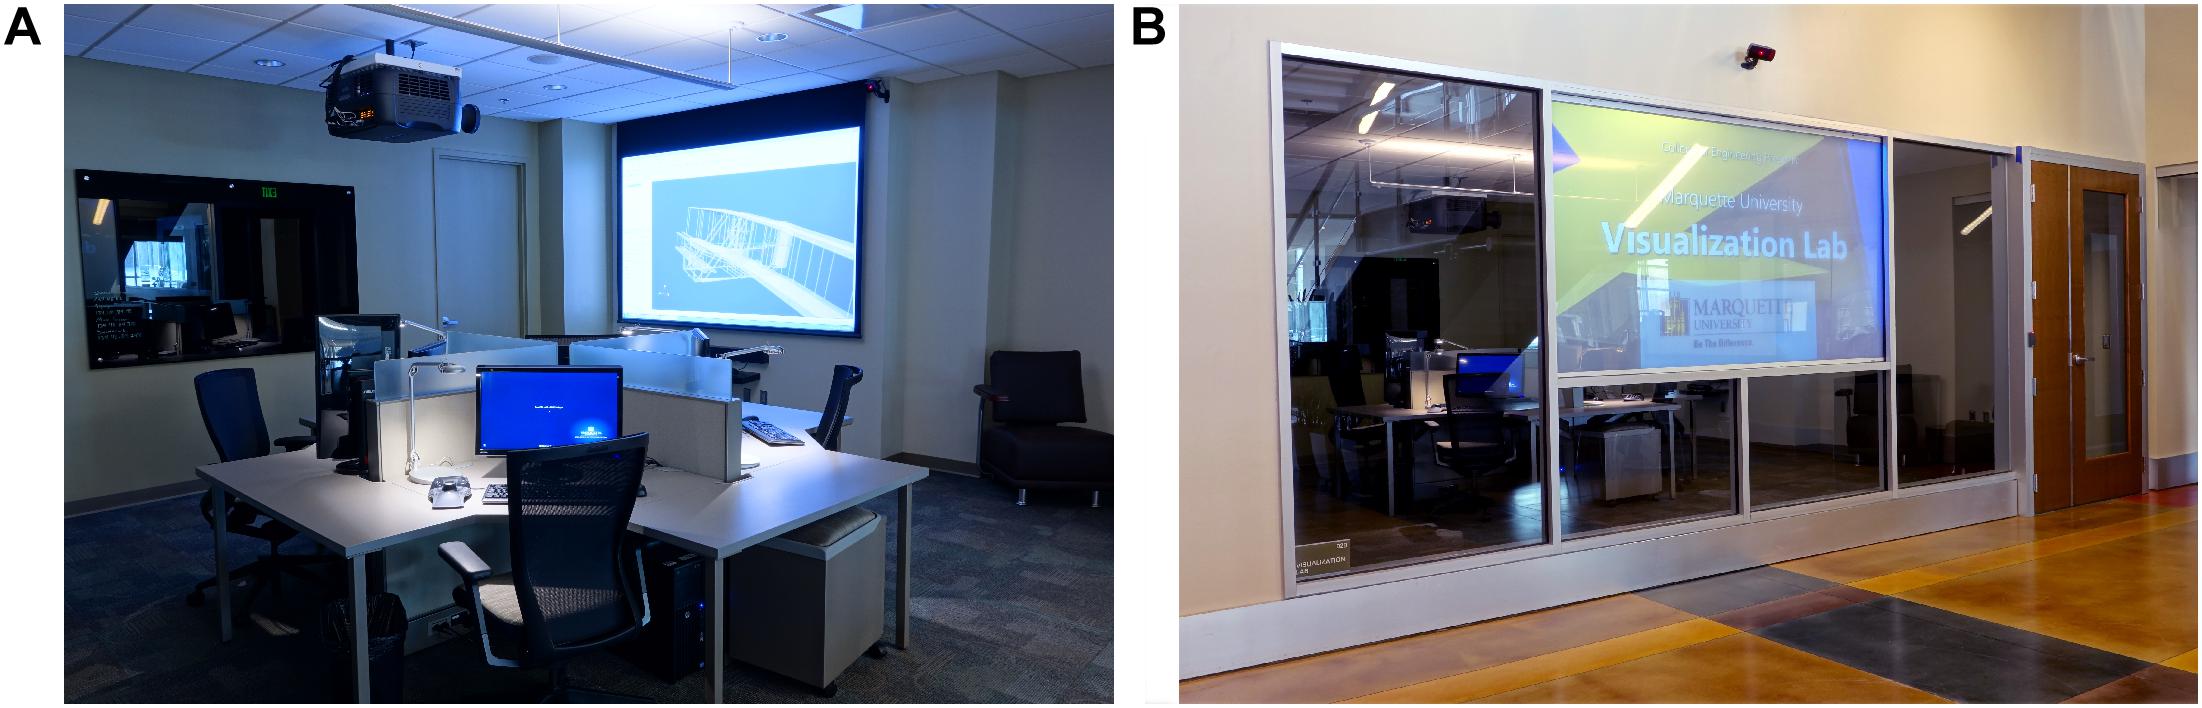
Figure 8. MARVL’s Content Development Lounge (CDL) was established in a room adjacent to the large-scale IVE. The interior of the CDL (A) contains high-end workstations, state-of-the-art display systems and tracking equipment for use in developing digital content, which can also be viewed from its exterior (B).
Consistent with a theme of transparency and fostering collaboration that is apparent throughout Engineering Hall where MARVL is located, the entrance of the CDL contains a holographic rear projection system that allows viewers to look at, and through, the screen. The Holo Screen (Da-Lite; Warsaw, IN, United States) displays digital signage of scheduled events and content being featured in current initiatives. The Holo Screen is coupled with a 3D ready projector and emitter that permit seamless viewing of content among all MARVL’s display surfaces using a single type of stereoscopic glasses during featured exhibits and events. In theory, these tiered resources for use in developing immersive content (desktop - > single projector systems - > large-scale IVE) are designed to minimize cost and optimize the use of MARVL’s key resources.
A NAS device is used to share project files and resources among all lab users. Although the institution provides a shared server for this purpose, MARVL required our own file server due to the expected storage and bandwidth requirements. Typically, executable programs are stored on the NAS, and all image generators launch the program simultaneously when the content is loaded. This is referred to by MiddleVR as the server starting a simulation. However, we noticed a significant reduction in launch times after we mirrored the shared folder to each computer’s local SSD drive, instead of loading the program through the network. This mirroring is done automatically through an rsync script.
When MARVL opened, the initial NAS device was a Drobo B800FS, but this unit was recently replaced with a Synology RS12919+. The upgrade increased the total available storage from 18 to 62 TB, but the primary motivator for the upgrade was a need for increased network transfer bandwidth. Both devices used a RAID 6 system to prevent data loss from mechanical drive failures, but a series of USB drives also serve as an offline mirror backup. The backup is run manually, using the Hyper Backup software running directly on the Synology server.
Limitations
One early discussion among end users pertaining to the arrangement of MARVL concerned the use of display surfaces on the floor vs. ceiling. The vision for MARVL involves its use as a differentiating factor in educational experiences and extramural grant applications. With the presence of a 6-sided IVE nearby (Brennan et al., 2013b) and input from our end users, it was determined that a fully immersive (i.e., 6-sided) system would not be pursued. End users also expressed a preference for projecting on the floor rather than ceiling. However, there were some limitations to overcome with this decision. When walking into a physical structure in real life, most individuals will direct their gaze upward to examine the space. It was therefore important to include this experience. Taking architecture (Figure 7B) as an example, the absence of a projected ceiling within MARVL required implementing additional functionality into its interactivity tool in order to appreciate the higher portions of structures and elements, and to simulate a patron’s gaze from the lower locations. A deliberate choice was therefore made not to implement a collision system so that the virtual camera used in MARVL would be completely uninhibited. This decision facilitates exploration anywhere within created or reconstructed content, including below virtual floors and through walls. The movement of a virtual camera within structural environments is therefore controlled by a script moving the view from a conventional horizontal position to a vertical one directed toward the top of a structure by rotating the camera upward. While in this rotated view, movements for further exploration of the structure are still enabled. More specifically, the current implementation used with civil engineering, architecture and related structures within MARVL simply uses a button press to toggle between forward, upward or downward facing gazes. Additional camera control implemented into the interaction device works to provide end users with control of the virtual camera’s height. For example, the thumb control on the FlyStick2 interactivity tool can be tapped in the up or down directions to instantly transport patrons to the various levels of the structure. This represents one approach that worked well for our facility, and others are likely available.
The MARquette Visualization Lab is spatially restricted to our campus in downtown Milwaukee, Wisconsin. In some cases, this created an impediment to collaborations. For example, clinicians interested in viewing biomedical CFD results at nearby hospitals and clinics often do not have the time to frequently travel ∼5 miles to view patient-specific results. Members of MARVL have therefore started to use head-mounted displays to remotely deliver content created for MARVL’s large-scale IVE. Specifically, members of MARVL now have experience developing exceptional content for the Oculus Rift, Oculus Quest, Samsung GearVR and Microsoft HoloLens, among others.
Recent Updates, Expenses and Current Uses
At launch, our intent was to support as many software packages as possible, therefore the system was configured to dual boot between Windows 7 and Linux (Xubuntu 12.04). ParaView was the first program to run in the IVE, which required custom launcher scripts written in Bash, and a customized build of ParaView. After several experiments with other software, we found the most success with the combination of Unity 4 and MiddleVR. With only a few exceptions, most MARVL projects are now built on Windows 10, MiddleVR 1.7, and Unity 2018.4.
Due to the wide shape of our installation, some users desired to use the IVE as a large format display, but due to the clustered nature of the system, we could not use pre-existing software without unreliable workflows such as high-bandwidth VNC feeds or OpenGL redirection techniques. Therefore, we developed several projects that use desktop-style functionality such as web browsing, video playback, and presentations. These applications were utilitarian, but never fully showcased by MARVL because they only use a subset of its features. For example, these applications use the IVE’s stereoscopic features and its high resolution, but do not necessarily emphasize immersion or feature sets of the more established desktop programs they emulated. Hence, when the opportunity to upgrade the image generators arrived, we opted to change the system architecture from a 6 node cluster to a single, more powerful image generator that could accommodate both the immersive experiences of a large-scale IVE, but also improvised experiences with standard desktop software. Our large-scale IVE now uses four nVidia Quadro P4000s with 8GB of VRAM each, powering all 10 projectors from a single workstation. An nVidia Quadro Sync II card is required to synchronize the GPUs with each other and the tracking system. The CPU configuration is two Intel Xeon Gold 6134s, with 8 cores and 16 threads running at 3.2 gHz each, with 96GB of DDR4 RAM. The dual CPU option was chosen not for performance reasons, but because a second physical CPU doubles the amount of PCIe bandwidth to the GPUs, which is a common bottleneck in multi GPU setups. This computer upgrade was approximately $17,000. Other hardware upgrade costs to date included are projector lamp replacements ($9,000) and an onsite service call for a heating issue for the ceiling mounted projectors that display content for the floor ($5,000). A schematic illustration of the current hardware setup in MARVL’s large-scale immersive environment is shown in Figure 9.
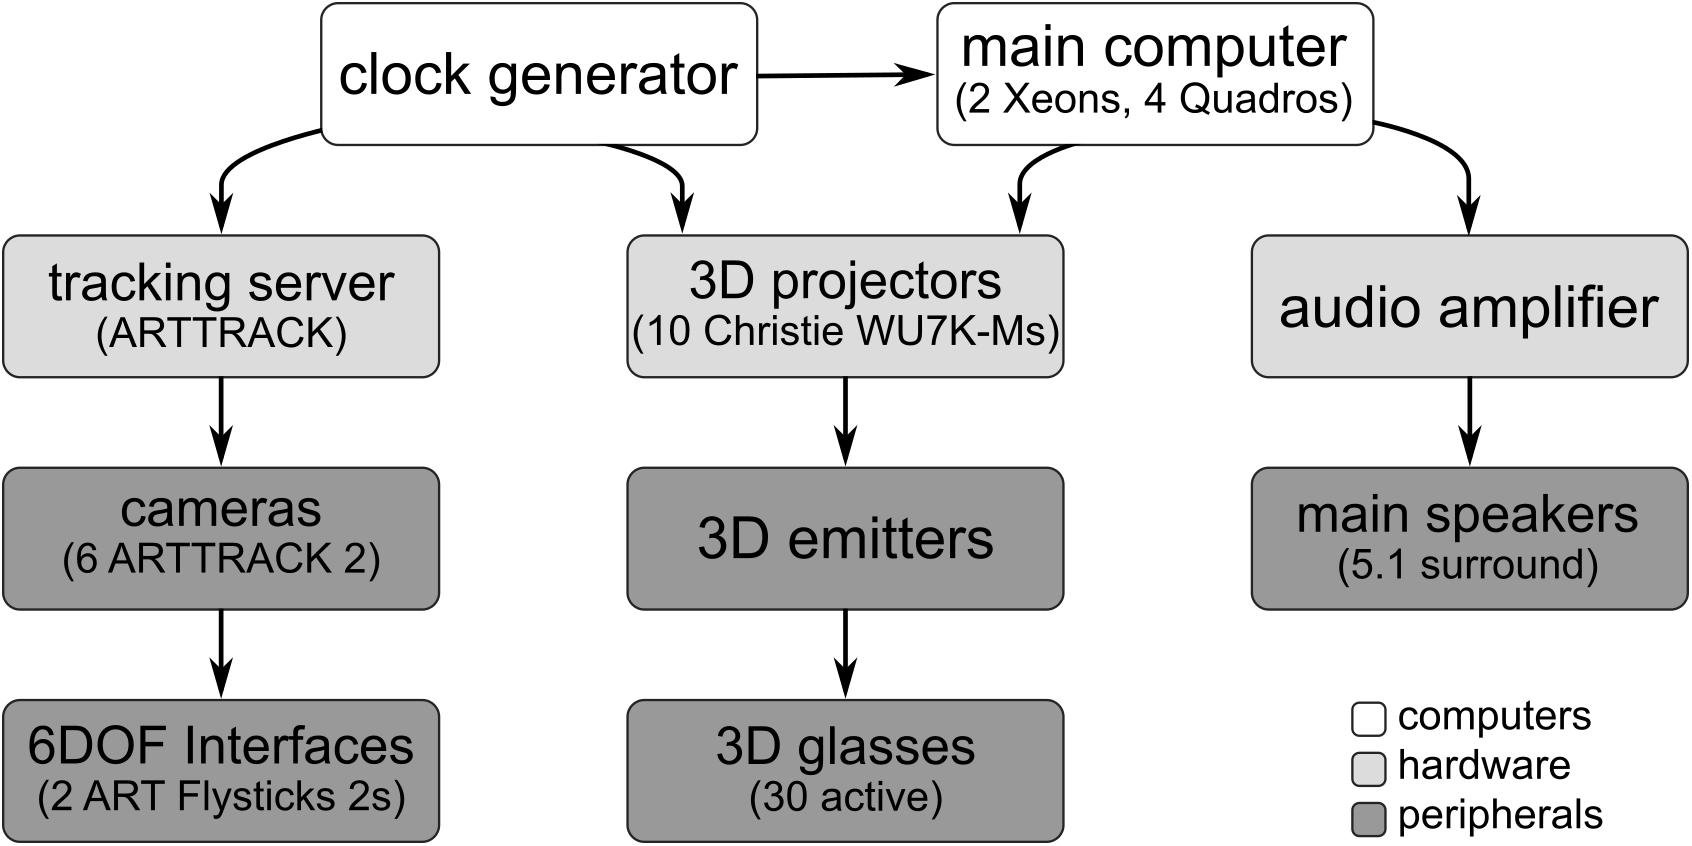
Figure 9. Schematic illustration of the current hardware setup in MARVL’s large-scale immersive environment.
The MARquette Visualization Lab’s user base continues to grow. In addition to the original end users discussed in detail above, more recent applications continue to include interactive engineering class content aimed at better understanding complex principles and a focus on more efficient scientific data visualization through the combined use of data reduction and accentuation tools to study and communicate the most important features in scientific results. Several of the initial application areas have also continued to create content for derivative immersive experiences, such as the preparation of nursing students for study abroad experiences discussed above, and five additional theatrical performances.
In summary, the approach employed here has set the stage for MARVL to be an important resource at our institution. Nearly all of the end users’ applications uncovered during planning stages of the facility (Table 1) have since been implemented. Careful selection of the workflow and processes implemented to create this resource has therefore resulted in cross-functionality with current head-mounted displays and limited the expenses incurred through enhancements to date. We are optimistic, based on interest in MARVL to date, that at least a portion of the current information will be useful for other institutions who are also considering developing an immersive visualization facility.
Data Availability Statement
The datasets generated for this study will not be made publicly available to avoid commercialism and to maintain the confidentiality of vendors evaluated as part of the current work. Requests to access the datasets should be directed to the corresponding author.
Author Contributions
Both authors contributed conception and design of the study. JL wrote the first draft of the manuscript. Both authors wrote sections of the manuscript, contributed to manuscript revision, read, and approved the submitted version.
Funding
Creation of MARVL was supported by the Marquette University Opus College of Engineering. Support for the biomedical CFD results shown was provided by NIH grant R15HL096096 and American Heart Association Grant-In-Aid award 15GRNT25700042.
Conflict of Interest
The authors declare that the research was conducted in the absence of any commercial or financial relationships that could be construed as a potential conflict of interest.
Acknowledgments
The authors thank collaborators whose applications are featured in the current work including Kerry Kosmoski-Goepfert Ph.D RN, Roschelle Manigold RN MSN CHSE, Chester Loeffler-Bell, Martin St. Maurice Ph.D, and Lynne Shumow. The authors also thank Erik Hendrikson, Matt Derosier, and Brad Bonczkiewicz for their technical assistance.
Footnotes
References
Borg, J. P. (2005). “Numerical simulation of pressure drop through a rotating plenum fan,” in ASME 2005 Power Conference, Chicago: IL, 95–100.
Borojeni, A. A. T., Frank-Ito, D. O., Kimbell, J. S., Rhee, J. S., and Garcia, G. J. M. (2017). Creation of an idealized nasopharynx geometry for accurate computational fluid dynamics simulations of nasal airflow in patient-specific models lacking the nasopharynx anatomy. Int. J. Numer Method Biomed. Eng. 33:10.1002/cnm.2825. doi: 10.1002/cnm.2825
Bowman, A. J., and Park, H. (2004). “Cfd study on laminar flow pressure drop and heat transfer characteristics in toroidal and spiral coil system,” in ASME 2004 International Mechanical Engineering Congress and Exposition, Anaheim, CA, 11–19.
Brennan, P. F., Arnott Smith, C., Ponto, K., Radwin, R., and Kreutz, K. (2013a). Envisioning the future of home care: applications of immersive virtual reality. Stud Health Technol. Inform. 192, 599–602.
Brennan, P. F., Nicolalde, F. D., Ponto, K., Kinneberg, M., Freese, V., and Paz, D. (2013b). Cultivating imagination: development and pilot test of a therapeutic use of an immersive virtual reality cave. AMIA Annu. Symp. Proc. 2013, 135–144.
Conover, E. (2014). 3d Technology Adds New Dimension to Marquette University Teaching. Milwaukee, WI: Milwaukee Journal Sentinel.
Cruz-Neira, C., Sandin, D. J., DeFanti, T. A., Kenyon, R. V., and Hart, J. C. (1992). The cave: audio visual experience automatic virtual environment. Commun. ACM 35, 64–72. doi: 10.1145/129888.129892
Ellwein, L., Samyn, M. M., Danduran, M., Schindler-Ivens, S., Liebham, S., and LaDisa, J. F. Jr. (2017). Toward translating near-infrared spectroscopy oxygen saturation data for the non-invasive prediction of spatial and temporal hemodynamics during exercise. Biomech Model Mechanobiol. 16, 75–96. doi: 10.1007/s10237-016-0803-4
Febretti, A., Nishimoto, A., Thigpen, T., Talandis, J., Long, L., Pirtle, J. D., et al. (2013). Cave2: a hybrid reality environment for immersive simulation and information analysis. Eng. Real. Virtual Real. 2013:8649.
Hauer, S. (2017). Marquette 3d lab adds virtual ghosts and witches to ‘macbeth’. Milwaukee J. Sentinel Published April 7, 2017.
Kageyama, A., and Tomiyama, A. (2016). Visualization framework for cave virtual reality systems. Int. J. Model Simul. Sci. 7:1643001. doi: 10.1142/s1793962316430017
Nishimoto, A., Tsoupikova, D., Rettberg, S., and Coover, R. (2016). “From cave2tm to mobile: adaptation of hearts and minds virtual reality project interaction,” in Human-Computer Interaction. Interaction Platforms and Techniques: 18th International Conference, HCI International 2016, Toronto, ON, 400–411. doi: 10.1007/978-3-319-39516-6_38
Patel, K., Bailenson, J. N., Hack-Jung, S., Diankov, R., and Bajcsy, R. (2006). “The effects of fully immersive virtual reality on the learning of physical tasks,” in The 9th Annual International Workshop on Presence, New York, NY.
Quam, D. J., Gundert, T. J., Ellwein, L., Larkee, C. E., Hayden, P., Migrino, R. Q., et al. (2015). Immersive visualization for enhanced computational fluid dynamics analysis. J. Biomech. Eng. 137, 0310041–03100412. doi: 10.1115/1.4029017
Renambot, L., Marrinan, T., Aurisano, J., Nishimoto, A., Mateevitsi, V., Bharadwaj, K., et al. (2016). Sage2: a collaboration portal for scalable resolution displays. Future Gener. Comp. Syst. 54, 296–305. doi: 10.1016/j.future.2015.05.014
Keywords: immersive visualization, virtual reality, augmented reality, mixed reality, simulation, student-centered learning
Citation: LaDisa JF Jr and Larkee CE (2020) The MARquette Visualization Lab (MARVL): An Immersive Virtual Environment for Research, Teaching and Collaboration. Front. Educ. 5:38. doi: 10.3389/feduc.2020.00038
Received: 22 November 2019; Accepted: 26 March 2020;
Published: 21 April 2020.
Edited by:
Tom Crick, Swansea University, United KingdomReviewed by:
Manuela Chessa, University of Genoa, ItalyMary Roduta Roberts, University of Alberta, Canada
Copyright © 2020 LaDisa and Larkee. This is an open-access article distributed under the terms of the Creative Commons Attribution License (CC BY). The use, distribution or reproduction in other forums is permitted, provided the original author(s) and the copyright owner(s) are credited and that the original publication in this journal is cited, in accordance with accepted academic practice. No use, distribution or reproduction is permitted which does not comply with these terms.
*Correspondence: John F. LaDisa Jr., am9obi5sYWRpc2FAbWFycXVldHRlLmVkdQ==