 Marcus Strömbäck Hjärne
 Per-Erik Lyrén
- Department of Applied Educational Science, Umeå University, Umeå, Sweden
The aim of this paper was to study fairness in testing by analyzing the quality of subscores for different groups of test takers. This is done by studying the value added ratio (VAR) for all subscores in the test, which here is a Swedish college admission test. Comparisons were made between test takers who take the regular test and test takers who are taking the test with extended time adaptation, as well as between males and females. Significant group differences in such subscore value would raise questions about fairness for that testing program. In particular, differences in subscore value between subgroups based on accommodations could indicate problems with the appropriateness of the accommodation. We found that the value added ratio (VAR) for all subscores in the studied test were slightly larger for males than for females. There were some differences between subgroups with respect to the extended time accommodation, but they were not systematic in the same way as for males and females. While the differences in the subscores' added value were small in general, they may in some instances be large enough to pose a threat to a valid and fair interpretation and use of test scores, and thus raises questions about fairness.
Introduction
When tests are used in education, it is most common to report and use the total score. However, sometimes subscores are also reported, with the purpose of providing more detailed information that for instance can be used for formative purposes to help test-takers to achieve in accordance with their full potential on a future test administration. Subscores can also be used to provide information on what candidate is most suitable in a selection process, where a certain profile is provided. Subtests are used as building blocks for a composite test score, where each subscore is an important contributor to the score meaning and to the internal structure of a test. However, when the quality of tests is being evaluated, the focus is generally on the total test, or on items in the test. Subscores are seldom at focus, which can be problematic from a validity perspective. As expressed in The Standards for Educational and Psychological Testing (American Educational Research Association, 2014) (hereafter, Standards), it is important that testing programs are aware of the need for finding validity evidence to support the reporting and use of subscores. Subscores that lack added value should preferably not be reported since it can lead to misinformation (e.g., Feinberg and Jurich, 2017).
In this paper we analyze how much value that subscores are adding to the total score in a standardized college admission test. The overall aim is to examine if there are any differences in subscore value depending on specific group membership. If such differences are detected, this would mean that the test works differently for different groups of test takers, which is problematic from a fairness perspective, especially since test scores are used for rank ordering and selecting individuals to attractive study positions.
Before continuing with the analysis, the issue of fairness will be addressed, as it can have quite different meanings for the general public and the psychometric community. In Standards, fairness is a term that is generally given several different meanings, but it involves how a test affects the validity of interpretation of results and the consequences of test usage:
The term fairness has no single technical meaning and is used in many different ways in public discourse. It is possible that individuals endorse fairness in testing as a desirable social goal, yet reach quite different conclusion about the fairness of a given testing program. A full consideration of the topic would explore the multi functions of testing in relation to its many goals, including the broad goal of achieving equity of opportunities in our society. It should consider the technical properties of tests, the ways in which that affect the validity of score interpretations, and consequences of test use (p. 49).
A more practical definition of fairness is that “(…) a test is fair if any group differences in performance are derived from construct-relevant sources of variance. The existence of group differences in performance does not necessarily make a test unfair, because the groups may differ on the construct being measured” (Educational Testing Service, 2014, p. 57). These two descriptions of fairness make it clear that fairness and validity are related concepts, which is also emphasized by Kane (2010). Now, going back to the issue of subscore (added) value, Sinharay and Haberman (2014) note that examining variability in subscore value over different subgroups in combination with follow-up analyses “constitute a fairness procedure” (p. 30) similar to examining population invariance in equating (e.g., Dorans and Holland, 2000), score equity assessment, or differential prediction analysis (e.g., Dorans, 2004). Also, Haberman and Sinharay (2013) argue that examining the impact of subgroup information on the estimation of true subscores (which is similar to examining variations in subscore value), is “a test fairness procedure” (p. 453). What these procedures all have in common is that they involve (1) gathering validity evidence, and (2) analyzing differences between subgroups of test-takers. These procedures tap different sources of validity evidence as expressed in the Standards. For example, differential prediction concerns relations to other variables, while score equity assessment concerns internal structure. Examinations of subscore value variations across subgroups may be viewed as concerning both internal structure (based on score interpretation), and consequences of testing (based on score use), which makes it a valuable and informative fairness procedure. To sum up, if we were to find that subscore value added differ between subgroups of test-takers, there is a threat to the fairness of the test.
As mentioned earlier, the aim of this article is to examine how subscore value differs between subgroups of test-takers, using real data from a college admissions test. Specifically, we look at two research questions: (1) Are there differences in the added value of subscores between subgroups based on test adaptation in terms of extended testing time? Test-takers with extended testing time is in this case test-takers with dyslexia. Test takers with dyslexia is by far the largest group of test takers permitted extended time for this college admission test. (2) Are there differences in the added value of subscores between males and females?
It is interesting to examine subscore value for males and females because these groups have for a long time been in the focus when discussing equity and fairness in society in large, and we know that they differ in several test-taking aspects, such as overall test performance, test anxiety and use of test-taking strategies (Stenlund et al., 2017, 2018), as well as performance on constructed-response vs. multiple-choice items (Livingston and Rupp, 2004). Such group differences will show as gender bias only when these differences is unrelated to the intended test construct but still has an impact on the test result. Gender bias cause unfairness if test results are used without consideration of the implications of test bias. Halpern (2000) presents an extensive summary of empirical evidence for sex differences in cognitive ability and the conclusion is that there are no evidence for differences in general intelligence. However, there are a vast amount of research in specific cognitive domains (for summaries see Gipps and Murphy, 1994; Willingham and Cole, 1997; Halpern, 2000). How these differences in domain specific cognitive abilities will cause potential unfair selections to higher education is an empirical question that needs to be investigated separately for each testing program that strive for valid and fair selection. It is for example known that admission tests in general under-predicts college grades for females (Fischer et al., 2013).
For subgroup categorizations based on test-taker background (age, sex, ethnicity, etc.) the presence of subgroup differences would lead to general investigations about fairness. Sinharay and Haberman (2014) provides an example where the added value of subscores is different for native and non-native speakers for a test of English. In this case, they suggest that follow-up analyses could examine if this could be due to the similarity of the native languages of the subgroups, differences in the mode of instruction of the subgroups, or cultural bias in some of the test items (of which the latter could be solved by redesigning the test).
When it comes to groups based on accommodations, the main reason for why it is interesting to examine subscore value for these groups is that the provision of accommodations on the one hand is based on fairness concerns for the accommodated test-takers and on the other hand may actuallyprompt fairness concerns for the non-accommodated test-takers. Students with disabilities are often offered to take a test under non-standard test administration conditions and there are increasing demands to include more groups of test-takers with different disabilities in college admission testing, such as neuro psychiatric disabilities, dyscalculia etc. Extended testing time, for example, is one of the most common accommodations offered to test-takers with dyslexia and other learning disabilities (Stretch and Osborne, 2005). This and other accommodations are designed to level the playing field so that all test-takers can demonstrate their true ability (e.g., Sireci et al., 2005). However, providing extra time is an exception from the standardization. Such accommodations require the reestablishment of the argument used to validate the standardized test (Sheinker et al., 2004; Kane, 2013).
Some summaries of research on time accommodations have been published (e.g., Sireci et al., 2005; Jennings, 2014). Sireci et al. (2005) conclude that existing research is inconsistent regarding the effect of providing extended time as a test accommodation. Jennings (2014) presents a summary of research on the utility of extended time as adaptation and concludes that the evidence suggests that all students, regardless of disability status, are equally benefitted from extra time. It must be noted that there are wide differences in the settings of the tests included in existing studies (e.g., test content, the stakes of the test, amount of extended time, length of test, age of test-takers, disability status of test-takers). Due to the conflicting research findings, recommendations for high-stakes testing programs with accommodations should be to specifically study the effect of the accommodation provided.
If we were to find that the added value of subscores, and consequently the basis for using and reporting subscores in any respect, differed between test-takers with a certain accommodation and test-takers that took the test under standard conditions, we would be concerned about at least two things. First, we would question whether subscores should be reported at all. Second, we would question the appropriateness of the accommodation. Many educational tests, not least high-stakes admissions tests, are likely to have a speededness component (Sireci et al., 2005) and speededness can affect test scores in terms of both reliability (Gulliksen, 1950) and internal structure (Lu and Sireci, 2007). Consequently, because subscore value is dependent on reliability and intercorrelations, differences in subscore value between accommodated and regular test-takers could indicate differences in speededness between the two groups and hence problems with the appropriateness of that accommodation.
While several studies have examined subscores with respect to added value for the general test-taking population in a variety of testing contexts (e.g., Sinharay et al., 2007; Haberman, 2008; Lyrén, 2009; Puhan et al., 2010; Sinharay, 2010; Wedman and Lyrén, 2015; Meijer et al., 2017; Sawaki and Sinharay, 2017), only a couple of studies have examined the variability of the added values of subscores over different subgroups (Haberman and Sinharay, 2013; Sinharay and Haberman, 2014). Furthermore, only one of them (Sinharay and Haberman, 2014) examines added value in the same way as in the studies of general test-taking populations, while the study by Haberman and Sinharay (2013) is more focused on bias in the estimation of subscores. There are no published studies of the differences between males and females with respect to added value of subscores on exams used for selection to higher education, and there are no previous studies that have examined subscore value for subgroups based on extended time accommodations.
The study by Sinharay and Haberman (2014) examined three types of testing programs: a multidisciplinary achievement test battery, teacher-certification tests, and an English proficiency assessment. The subgroups they considered were based on ethnicity, gender, and first language. In general, they found that most subscores did not have added value. For the achievement test battery, they found some differences between the ethnic groups in the added values of the subscores for one of the tests, but they found no such differences for the other test. For the English proficiency assessment there were little variation between the language groups in terms of added values. One of the teacher-certification tests showed little variation between males and females, while the other teacher-certification test showed little variation between males and females but more variation between ethnic groups.
Method
Data and Participants
The data come from the Swedish Scholastic Aptitude Test (SweSAT), a standardized exam used for selecting eligible candidates to higher education in Sweden. The test can be retaken unlimited times, and is considered to be high-stakes as it is possible for a candidate that have met the generally lenient eligibility requirements (a pass grade in the upper secondary school courses) to be selected to attractive study programs on the basis of the test score, without a need for higher school grades. The test has a quantitative (Q) and a verbal (V) section with 80 items and four subtests each, where the sections and the subtests form the bases for the subscores. The section scores are normed and equated separately, and the total normed score is calculated as the average of the two normed section scores. Currently, only the total normed score is used in the selection, except for some trials that apply differential weighting of the section scores.
The quantitative subtests involve problem solving (Q1), quantitative comparisons (Q2), data sufficiency (Q3), and interpretation of diagrams, tables and other quantitative information (Q4). The verbal subtests are vocabulary (V1), reading comprehension (V2), sentence completion (V3), and English reading comprehension (V4). For more information about the SweSAT (including validity and fairness issues), the reader is referred to Lyrén and Wikström (2019), Wedman (2018) and Stenlund et al. (2017). Test administrations are held twice a year, in spring and autumn, with one test form per administration. We examined the two test forms administrated in 2016, denoted 16A (spring; n = 76,948) and 16B (autumn; n = 55,033). Descriptive score information is provided in Table 1 and the distribution of test-takers is provided in Table 2.
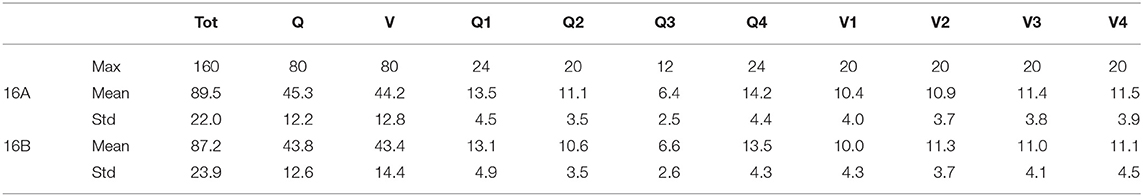
Table 1. Descriptive statistics for test administration 16A (N = 76,948) and 16 B (N = 55,033), maximum possible score, mean, and standard deviation.
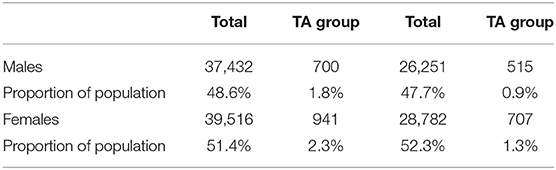
Table 2. Number of female and male test-takers in total and representation in the group taking the time accommodated test for administration 16A (left column) and 16B (right column).
Data Analysis
Estimating the Added Value of Subscores
The method for examining the added value of reporting subscores over total scores described by Haberman (2008) is the methodological basis for this study. Haberman's method is used to examine if a predictor based on the observed subscore is better than a predictor based on the observed total score in estimating the true subscore. The method compares the proportional reduction in mean square error (PRMSE) for the predictors based on the subscore and the total score in relation to the trivial predictor, which in this case is the subscore mean. These PRMSE's are denoted PRMSEs and PRMSEx, where PRMSEx is the squared correlation between a linear model of the true subscore and the observed total score. In other words, PRMSEx is a measure of the proportion of the variance of the true subscore explained by the observed total score (e.g., Feinberg and Jurich, 2017). These PRMSE's are then compared in order to determine the best approximation of the true subscore. If PRMSEs is larger than PRMSEx, the observed subscore has added value to the observed total score. The PRMSE's are conceptually similar to reliability, and the PRMSE for the predictor based on the observed subscore is exactly the same as the reliability of the subscore.
where is the reliability of the subscore. Furthermore,
where ρ2 denotes the squared correlation, x the observed total score, xt the approximated true total score and st the approximated true subscore.
In this article this method of comparing PRMSE's is used to find out if the added value of a subscore is invariant over subgroups. The method is used to analyze the added value for each subgroup, in accordance with the study by Sinharay and Haberman (2014). Hence, the calculations of for example PRMSEx and PRMSEsfor females is based only on the results from female test-takers.
In order to facilitate interpretation of results from subscore value analyses, Feinberg and Wainer (2014) proposed using the value added ratio, VAR, expressed as the ratio of PRMSEs and PRMSEx.
Feinberg and Jurich (2017) developed rules of thumbs for VAR values based on statistical significance and effect sizes, and recommended to never report subscores when VAR ≤ 0.9. Reporting of subscores under such conditions is considered misleading. When 0.9 < VAR < 1.1 the subscore is considered redundant, thus not contributing to additional information on the subtest construct. Reporting redundant subscores can be considered harmless. VAR ≥ 1.1, is the threshold for when the observed subscore contributes significantly to information on the subscore construct. “Beginning at this threshold, subscores explain a statistically significant amount of the true subscore variance above that yielded by the total score, except when sample size is small (e.g., n = 100).” (Feinberg and Jurich, 2017, p. 8). In addition to looking at the VAR value, one should also consider the subscore reliability (PRMSEs) separately. Recommendations for reliability vary depending on the testing context and the author(s) making the recommendations, but as an example, Feinberg and Jurich point out that a score reliability below 0.5 is “generally considered unacceptable for a reported score.”
Bias in Estimates of True Subscores When Ignoring Subgroup Information
In addition to using Haberman's added value methodology as a fairness examination procedure, Haberman and Sinharay (2013) suggested examining differences in estimates of true subscores when ignoring subgroup information compared to when incorporating this information. If the bias is large enough, that is, if incorporating subgroup information leads to better estimates of true subscores, then the suggestion is to further examine why subgroup information matter in the specific case. ss is a predictor of the true subscore based on the subscore s, and according to Haberman and Sinharay (2013) the bias of ss when subgroup information is ignored for subgroup g is given by
where is the reliability estimate of subscore s and sg is the subscore for subgroup g.
RMSEg (the root mean square error for subgroup g) is an estimate of the standard deviation of the true subscore for subgroup g. Then the normalized bias is
According to Haberman and Sinharay (2013) the normalized bias βsg is considered small when its square is smaller than 0.1(1− PRMSEs) for subgroup g. This is here reformulated as an index, β*
where PRMSEs is calculated from data only including members of subgroup g.
Following Haberman and Sinharay (2013), the recommendation is that β* should be smaller than 0.1 to be considered small, and a β* larger than or equal to 0.1 means that the subgroup's subscores should be investigated further.
Subgroups
The subgroups considered in this study are based on time accommodated administration of the test and sex. Hence, the subgroups we analyzed are: Subgroup with time accommodation (TA group), no accommodation (NA group), females and males. The TA group is analyzed in relation to the NA group, and females is analyzed in relation to males. The NA group is by far the largest group and consists of more than 95% of the test-takers, hence the aggregated data for this group is almost identical to the aggregated data of the whole test-taking population. Hence, the NA group is not reported, instead the population is used in all comparisons with the analyzed subgroups.
As seen in Table 3 there is a larger proportion of female test-takers than male test-takers in the TA group, the ratio is almost 40/60. This difference remains, but is much smaller when looking at the whole population. The age distribution is roughly the same between the TA group and the test-taking population.
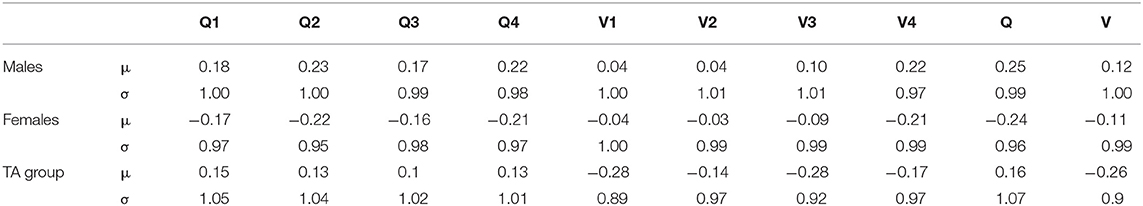
Table 3. Standardized subscore means and standard deviations for males (N = 37,432) and females (N = 39,516) and TA group (N = 1,641) for test administration 16A (the results from 16B shows an equal pattern).
To enable comparability between the subtests, all scores are standardized with a mean of zero and standard deviation of one in Table 3 and Figure 1. Hence, a positive group mean score means that the group perform above average and a negative group mean score means that the group performs below the average.
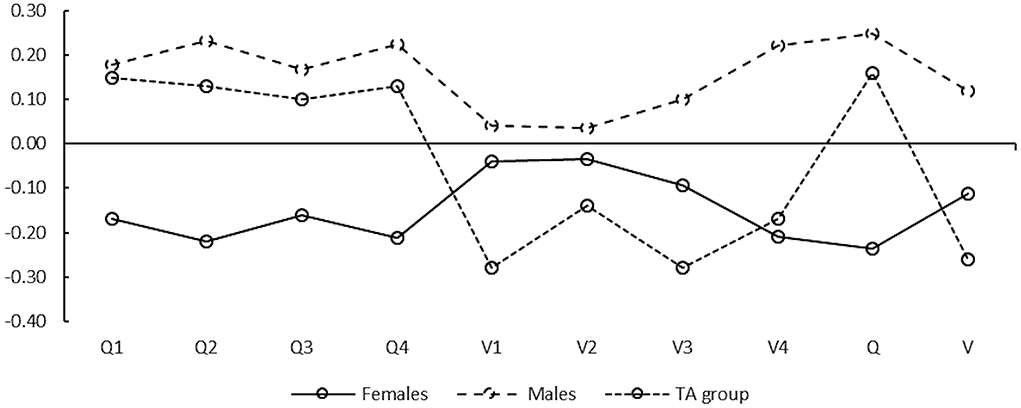
Figure 1. Standardized subscore means for test-takers with time accommodations (TA group), Males and Females.
Males performs better than females on all subtests and the standard deviations for the standardized means for both females and males are ~1 (Table 3). Figure 1 illustrates the differences between the groups. As seen the differences between males and females are larger for the quantitative subtests, and smaller on the verbal subtests with exception for subtest V4. The performance of the TA group is interesting in the sense that compared to all other test-takers, the TA group performs better on the quantitative subtests and worse on the verbal subtests.
Results
As seen in Tables 4, 5, the value added ratio for the population and for all analyzed subgroups shows that the verbal and the quantitative sections of the test both has added value to the total score for both test administrations (16A and 16B). The bias index and the magnitude of PRMSE is almost identical for both tests. Hence, PRMSEs, PRMSEx and the bias index (β*) is reported only for test 16A (Table 4). The results indicated by VAR is reported for both 16A (Table 4) and 16B (Table 5).
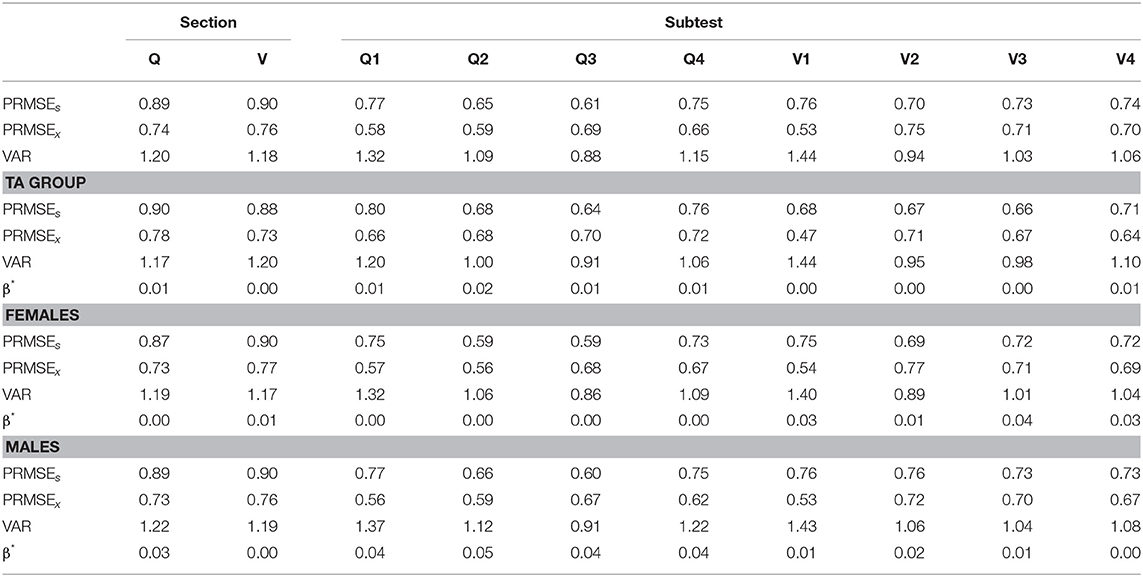
Table 4. PRMSEs, PRMSEx, and Value added ratio (VAR) for the population, the TA group, females and males based on test administration 16A.
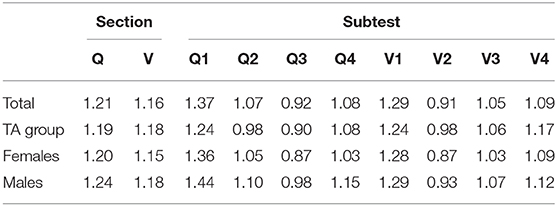
Table 5. Value added ratio (VAR) for the population, the TA group, females and males based on test administration 16B.
None of the subscores shows a bias that indicates the need of further investigations. The male group's Quantitative subscore Q2 has the largest β* at 0.05. In general, the subscores for the TA group shows smaller bias than the subscores for males and females.
Looking at the VAR index from test administration 16A (Figure 2), the pattern is similar between the TA group and the population for the Quantitative and the Verbal section. When comparing the scores from individual subtests, the pattern is more elusive. The quantitative subtest Q3 is recommended to not to be reported for the population but is redundant for the TA group, and subtest Q4 has considerable added value for the population but is redundant for the TA group. Moreover, this pattern in added value from individual subtests is not repeated in the data from test administration 16B (Table 5) where all subtests except for subtest V4 is categorized equally in adding value for the TA group and the population. However, the added value for the verbal and quantitative section of the test remains in 16B and shows roughly the same values as in 16A. This indicates stability and equity in the added value for the verbal and quantitative section.
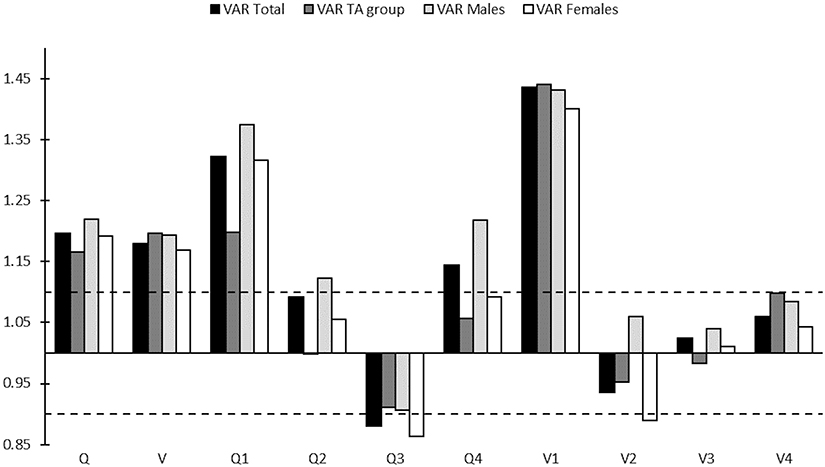
Figure 2. 16A Value added ratio (VAR) for the different subgroups and the total population on all subtests and both sections (Quantitative and Verbal) of the test. Threshold values, indicating the interval for redundant subscores (between 0.9 and 1.1), are displayed as dotted horizontal lines.
The VAR shows an inconsistent pattern when comparing males and females. In test administration 16A the subtests Q2 and Q4 have added value for males but are redundant for females, and Q3 and V2 are recommended to not be reported for females while the subtests are redundant for males. Interesting to notice is that all subtests and sections of the test shows higher VAR for males than females in both test administrations. This puts attention to the subscore reliability, in this case expressed as PRMSEs, which is higher for males than females on every individual subscore and section of the test.
Discussion
Differences in subscore value between subgroups based on certain accommodations could indicate problems. Such differences would question the appropriateness of the accommodation. We found noticeable differences in test results on the subtests between males and females and between test-takers with time accommodations and test-takers taking the test under standard conditions. Regarding accommodations, the difference in performance between the groups is in line with research on the American SAT. For example, Mandinach et al. (2005) found that the effects of extended time are more pronounced for the mathematics section of the SAT. Given the patterns in score differences in the present study it does seem as if the effects of accommodations in the SweSAT context are similar to those in the SAT context. This similarity was not unexpected since the American SAT and the SweSAT has similar design and purpose.
We also noted some differences in the value of subscores between the compared groups. On the other hand, the bias estimates do not indicate any need for further investigations. These differences in the added value of subscores between subgroups lead to different recommendations in how to interpret, report and use some of the subscores for different groups. In correspondence with the guidelines by Feinberg and Jurich (2017) we conclude that the subscore information from this test would potentially mislead the average test-taker of some groups to think that the subtest score is a better estimate of their true score on the subtest than the total score is, while the average test-taker of other groups may benefit from the same subscore information. If using subtest Q4 as an example, we can see that the subscore adds value above what is provided by the total score for the population, but not for test-takers with time accommodation. Looking solely at the VAR values, the recommendation would be to report the subscore for all test-takers except test-takers with this accommodation. However, a subscore reporting procedure that is conditional on subgroup membership makes little sense and could be highly problematic from a policy perspective. Still, we end with a situation where if subscores are reported to all test-takers one can argue that it would be unfair due to some group being misinformed, while if it is not reported to all test-takers it would be unfair to the majority of test-takers because they are not getting information that could be potentially valuable to them. If using the terminology from the fairness concept proposed by Kane (2010) the substantial fairness values of inclusion with test accommodations can be argued to cause procedural unfairness since the recommendations on how to interpret the subscores varies between the population and the TA-group. Furthermore, there is a cost efficiency originated belief that the vast amount of data that a testing program holds could be used for more precise selection without introducing more tests. This will potentially result in a not insignificant public pressure for extended use of subscores for different high stake purposes (e.g., college admission). Since subscore value differs between groups, we would risk a more unfair selection if subscores from this test are used as an extension or as an alternative to the total score to identify suitable candidates in a selection process. These results are consistent with earlier research on subscore value for different subgroups (e.g., Haberman and Sinharay, 2013; Sinharay and Haberman, 2014). The results presented by Sinharay and Haberman concludes that the added values of the subscores in their data sets occasionally varies over the subgroups in their study. When studying the ratio of PRMSEs and PRMSEx for subtests for different subgroups (based on ethnical background) presented in the study by Haberman & Sinharay it shows a similar pattern as the VARs in this study, that is, the subscore value is considerably different for some subgroups and would lead to different recommendations of how to use the results of the subtest. From the analyses of compared subgroups, we do not find any evidence supporting the claim not to report the verbal (V) and the quantitative (Q) part of the test separately. Hence, reporting of subscore Q and V can potentially offer the benefits from subscore reporting.
A lack of fairness in general can be approached at different levels. First, a potential fairness issue such as group-dependent subscore value must consider how the subscores are reported or used separately. Second, if the subscores are reported but not used to enhance performance in future test administrations or interpreted to construct self believes by individual test-takers or groups of test-takers, reporting of subscores is unproblematic, and perhaps meaningless. Third, both the test itself as well as how individuals are categorized into subgroups are important to investigate further when it is found that the subscore values differ between subgroups. This is especially important when comparing groups based on unclear categorization criteria. For example, we found there were some differences in subscore values between the test population and the TA group, and since the reliability in the selection of individuals to the TA group is unknown this should lead to further investigations on both how the subgroup is selected and the suitability of the accommodation for this group. Hence, it is important to stress that the results from this study cannot be used as the sole basis for making decisions about the use of time accommodation from a fairness perspective. Nonetheless, there is a need for further research on the validity of test score interpretations from accommodated test administrations, and a need for variety of forms of evidence to be used (e.g., Sireci et al., 2005), and our results would contribute to this with suggestions of further research on the validity of interpretations of the results from subtests that shows significant difference in subscore value for the TA group.
It is noticeable that the VAR for all subtests and sections of the test is lower for the female population than for the male population. The differences are small in general, but as they would lead to different conclusions with respect to the threshold values for four of the eight subscores (Q2, Q3, Q4, and V2) they indicate that there can be a fairness issue in the interpretation and use of the test scores with respect to males and females for the analyzed tests. The lower VAR can be explained with a lower subscore reliability, which most likely is a consequence of a lower variance for females than for males. The difference in test results between males and females, where males have higher scores on all subscores, can potentially explain some of the differences in subscore value. It is possible that the match between the test's difficulty and the score distribution is worse for females that for males, which could have led to the smaller variance and the lower reliability. This could be a topic for further research.
It is interesting that accommodations are provided to promote fairness, while such procedures actually can result in other fairness problems. A generic three-tier structure for categorization of the impact of accommodations on the test construct was originally proposed by CTB/McGraw-Hill (2000). In this categorization extended time is placed in category two, that is, accommodations that may affect test results and the interpretation based on these results (McGraw-Hill, 2000; Jennings, 2014). When tests have a speededness component then most test-takers would probably benefit from extended testing time. Other common accommodations such as large print, small rooms, braille, etc., are unlikely to be very beneficial for other test-takers than those with certain needs. Therefore, testing programs developing standardized power tests need to pay special attention to timing issues, and to reduce the speededness of the tests as much as possible.
In conclusion, group differences in subscore values can be a threat to test fairness especially when the consequences of subscore use is high-stakes for the individual test-taker. We have shown some minor differences in subscore value between males and females in a typical college admission test. The results showed that Females have lower VAR in all sections and subtests of the test. Furthermore, we have shown that the group using the most common accommodation, i.e., extended time, has considerably different subscore values for some subtests. This indicates a need for further research on the effect of time accommodations on the subscore level. Other suggestions for further research would include more subgroups in VAR-analyses, development of methods for test developers to find an acceptable number of subtest items to ensure added value of subscores for all subgroups, and further investigations on gender differences in subscore reliability.
Data Availability Statement
The raw data supporting the conclusions of this article will be made available by the authors, without undue reservation, to any qualified researcher.
Author Contributions
MH and P-EL contributed to the theoretical framework and its implementation and to the writing of the manuscript. MH contributed to the calculations and the statistical analysis. Both authors discussed the results and contributed to the final manuscript.
Conflict of Interest
The authors declare that the research was conducted in the absence of any commercial or financial relationships that could be construed as a potential conflict of interest.
Acknowledgments
The authors are grateful to Ph.D. Jonathan Wedman for providing supportive statistical tools (software) to confirm the results. The authors are also grateful to Ph.D. Ewa Rolfsman and Ph.D. Christina Wikström for valuable comments and suggestions.
References
American Educational Research Association American Psychological Association, and National Council on Measurement in Education. (2014). Standards for Educational and Psychological Testing. Washington, DC: American Educational Research Association.
Dorans, N. J. (2004). Using subpopulation invariance to assess test score equity. J. Educ. Measure. 41, 43–68. doi: 10.1111/j.1745-3984.2004.tb01158.x
Dorans, N. J., and Holland, P. W. (2000). Population invariance and the equatability of tests: basic theory and the linear case. J. Educ. Meas. 37, 281–306. doi: 10.1111/j.1745-3984.2000.tb01088.x
Feinberg, R. A., and Jurich, D. P. (2017). Guidelines for interpreting and reporting subscores. Educ. Meas. 36, 5–13. doi: 10.1111/emip.12142
Feinberg, R. A., and Wainer, H. (2014). A simple equation to predict a subscore's value. Educ. Meas. 33, 55–56. doi: 10.1111/emip.12035
Fischer, F. T., Schult, J., and Hell, B. (2013). Sex-specific differential prediction of college admission tests: a meta-analysis. J. Educ. Psychol. 105, 478–488. doi: 10.1037/a0031956
Gipps, C. V., and Murphy, P. (1994). A Fair Test? Assessment, Achievement and Equity. Buckingham: Open University Press.
Haberman, S. J. (2008). When can subscores have value? J. Educ. Behav. Stat. 33, 204–229. doi: 10.3102/1076998607302636
Haberman, S. J., and Sinharay, S. (2013). Does subgroup membership information lead to better estimation of true subscores? Br. J. Math. Stat. Psychol. 66, 452–469. doi: 10.1111/j.2044-8317.2012.02061.x
Jennings, C. R. (2014). Extended Time as a Testing Accommodation for Students with Disabilities. (Master's thesis), UT Southwestern Medical Center.
Kane, M. T. (2013). Validating the interpretations and uses of test scores. J. Educ. Meas. 50, 1–73. doi: 10.1111/jedm.12000
Livingston, S. A., and Rupp, S. L. (2004). Performance of men and women on multiple-choice and constructed-response tests for beginning teachers. ETS Res. Rep. Series. 2004, 1–25. doi: 10.1002/j.2333-8504.2004.tb01975.x
Lu, Y., and Sireci, S. G. (2007). Validity issues in test speededness. Educ. Meas. 26, 29–37. doi: 10.1111/j.1745-3992.2007.00106.x
Lyrén, P.-E. (2009). A Perfect Score: Validity Arguments for College Admission Tests. (Doctoral dissertation), Umeå university.
Lyrén, P.-E., and Wikström, C. (2019). “Admissions practices in Sweden,” in Higher Education Admission Practices: An International Perspective, eds M. Oliveri and C. Wendler (Cambridge: Cambridge University Press), 203–216. doi: 10.1017/9781108559607.012
Mandinach, E. B., Bridgeman, B., Cahalan-Laitusis, C., and Trapani, C. (2005). The impact of extended time on SAT® test performance. ETS Res. Rep. Series 2005, 1–35. doi: 10.1002/j.2333-8504.2005.tb01997.x
McGraw-Hill, C. (2000). Guidelines for Using the Results of Standardized Tests Administered Under Nonstandard Conditions. Monterey, CA: Author.
Meijer, R. R., Boeve, A. J., Tendeiro, J. N., Bosker, R. J., and Albers, C. J. (2017). The use of subscores in higher education: when is this useful? Front. Psychol. 8:305. doi: 10.3389/fpsyg.2017.00305
Puhan, G., Sinharay, S., Haberman, S., and Larkin, K. (2010). The utility of augmented subscores in a licensure exam: an evaluation of methods using empirical data. Appl. Meas. Educ. 23, 266–285. doi: 10.1080/08957347.2010.486287
Sawaki, Y., and Sinharay, S. (2017). Do the TOEFL iBT® section scores provide value-added information to stakeholders? Lang. Test. 34, 529–556. doi: 10.1177/0265532217716731
Sheinker, A., Barton, K. E., and Lewis, D. M. (2004). Guidelines for Inclusive Test Administration 2005. Monterey, CA: CTB/McGraw-Hill. Retrieved from: https://valrc.org/courses/tabeonline2/accommodations%20guidelines.pdf (accessed March 06, 2019).
Sinharay, S. (2010). How often do subscores have added value? Results from operational and simulated data. J. Educ. Meas. 47, 150–174. doi: 10.1111/j.1745-3984.2010.00106.x
Sinharay, S., Haberman, S., and Puhan, G. (2007). Subscores based on classical test theory: to report or not to report. Educ. Meas. 26, 21–28. doi: 10.1111/j.1745-3992.2007.00105.x
Sinharay, S., and Haberman, S. J. (2014). An empirical investigation of population invariance in the value of subscores. Int. J. Test. 14, 22–48. doi: 10.1080/15305058.2013.822712
Sireci, S. G., Scarpati, S. E., and Li, S. (2005). Test accommodations for students with disabilities: an analysis of the interaction hypothesis. Rev. Educ. Res. 75, 457–490. doi: 10.3102/00346543075004457
Stenlund, T., Eklöf, H., and Lyrén, P.-E. (2017). Group differences in test-taking behaviour: an example from a high-stakes testing program. Asses. Educ. 24, 4–20. doi: 10.1080/0969594X.2016.1142935
Stenlund, T., Lyrén, P.-E., and Eklöf, H. (2018). The successful test taker: exploring test-taking behavior profiles through cluster analysis. Eur. J. Psychol. Educ. 33, 403–417. doi: 10.1007/s10212-017-0332-2
Stretch, L. S., and Osborne, J. W. (2005). Extended time test accommodation: directions for future research and practice. Pract. Asses. Res. Eval. 10, 1–8. doi: 10.7275/cs6a-4s02
Wedman, J. (2018). Reasons for gender-related differential item functioning in a college admissions test. Scan. J. Educ. Res. 62, 959–970. doi: 10.1080/00313831.2017.1402365
Wedman, J., and Lyrén, P.-E. (2015). Methods for examining the psychometric quality of subscores: a review and application. Pract. Asses. Res. Eval. 20:21. doi: 10.7275/ng3q-0d19
Keywords: fairness, subscores, gender, dyslexia, test, adaptation, accomodation
Citation: Hjärne MS and Lyrén P-E (2020) Group Differences in the Value of Subscores: A Fairness Issue. Front. Educ. 5:55. doi: 10.3389/feduc.2020.00055
Received: 27 January 2020; Accepted: 21 April 2020;
Published: 13 May 2020.
Edited by:
Maria Assunção Flores, University of Minho, PortugalReviewed by:
Jason Fan, The University of Melbourne, AustraliaJade Caines Lee, University of New Hampshire, United States
Copyright © 2020 Hjärne and Lyrén. This is an open-access article distributed under the terms of the Creative Commons Attribution License (CC BY). The use, distribution or reproduction in other forums is permitted, provided the original author(s) and the copyright owner(s) are credited and that the original publication in this journal is cited, in accordance with accepted academic practice. No use, distribution or reproduction is permitted which does not comply with these terms.
*Correspondence: Marcus Strömbäck Hjärne, bWFyY3VzLnN0cm9tYmFjay5oamFybmVAdW11LnNl