 Nina Minkley
 Kate M. Xu
 Moritz Krell
- 1Behavioral Biology and Biology Education, Faculty of Biology and Biotechnology, Ruhr-Universität Bochum, Bochum, Germany
- 2Faculty of Educational Sciences, Open University of the Netherlands, Heerlen, Netherlands
- 3Biology Education, Freie Universität Berlin, Berlin, Germany
The present study is based on a theoretical framework of cognitive load that distinguishes causal factors (learner characteristics affecting cognitive load e.g., self-concept; interest; perceived stress) and assessment factors (indicators of cognitive load e.g., mental load; mental effort; task performance) of cognitive load. Various assessment approaches have been used in empirical research to measure cognitive load during task performance. The most common methods are subjective self-reported questionnaires; only occasionally objective physiological measures such as heart rates are used. However, the convergence of subjective and objective approaches has not been extensively investigated yet, leaving unclear the meaning of each kind of measure and its validity. This study adds to this body of research by analyzing the relationship between these causal and assessment (subjective and objective) factors of cognitive load. The data come from three comparable studies in which high school students (N = 309) participated in a one-day out of school molecular biology project and completed different tasks about molecular biology structures and procedures. Heart rate variability (objective cognitive load) was measured via a chest belt. Subjective cognitive load (i.e., mental load and mental effort) and causal factors including self-concept, interest, and perceived stress were self-reported by participants on questionnaires. The findings show that a) objective heart rate measures of cognitive load are related to subjective measures of self-reported mental effort but not of mental load; b) self-reported mental effort and mental load are better predictors of task performance than objective heart rate measures of cognitive load; c) self-concept, interest and perceived stress are associated with self-reported measures of mental load and mental effort, and self-concept is associated with one of the objective heart rate measures. The findings are discussed based on the theoretical framework of cognitive load and implications for the validity of each measure are proposed.
Introduction
Cognitive load can be broadly defined as a psychological construct representing an individual's cognitive resources used to learn or perform a task. As such, cognitive load is an established construct in education and psychology, often used as a guidance to optimize instructional designs (e.g., Paas and van Merriënboer, 1994; Kirschner et al., 2006) and is considered as a control variable in assessment contexts (e.g. Minkley et al., 2018; Nehring et al., 2012). It is assumed that measures of cognitive load under various experimental conditions represent the working memory resources exerted or required during task performance. Within assessment contexts but traditionally also within instructional design contexts, cognitive load has been conceptualized in terms of the perceived complexity of tasks (mental load) and the invested mental effort while working on the tasks (e.g., Paas and van Merriënboer, 1994; Choi et al., 2014; Krell, 2017; Skuballa et al., 2019). Mental load refers to the amount of cognitive resources required to solve the problem, whereas mental effort refers to the cognitive sources that are actually invested during problem solving. This theoretical distinction is powerful because it allows to separate internal and external dimensions of cognitive load and can guide further research (Paas and van Merriënboer, 1994; Choi et al., 2014). However, mental load and mental effort are typically assessed using subjective self-reports on questionnaires (e.g., Krell, 2017), which assumes that the respondents are aware of their actual amount of cognitive load, which they invested to solve a task (Solhjoo et al., 2019). Furthermore, such subjective measures have been critically discussed due to issues of validity (de Jong, 2010; Kirschner et al., 2011; van Gog and Paas, 2008). Hence, some studies use objective, physiological measures as indicators for cognitive load (e.g., various heart rate or pupillometric measures; Solhjoo et al., 2019; Zheng and Cooke, 2012). However, it is not clear to which extent objective measures converge with subjective measures as indicators for an individual’s cognitive load in the corresponding contexts. The convergence of assessment methods provides evidence for validity of these measures.
Validity is an integrated evaluative judgment on the extent to which the appropriateness and quality of interpretations and measures based on test scores (or other diagnostic procedures) are supported by empirical evidence and theoretical arguments (Messick, 1995; Kane, 2013). According to the argument-based approach to validation (Kane, 2013), validation depends on the intended interpretation and use of test scores and requires to provide argumentative evidence that an intended test score interpretation is legitimate. Hence, the validation of an instrument is not a routine procedure, but is carried out through theory-based research, with which different interpretations of a test score can be legitimized or even falsified (Hartig et al., 2012). In the Standards for Educational and Psychological Testing, it is emphasized that “validity refers to the degree to which evidence and theory support the interpretations of test scores for proposed uses of tests” (AERA et al., 2014, p. 11). The authors further elaborate on different “sources of evidence that might be used in evaluating the validity of a proposed interpretation of test scores for a particular use” (p. 13), including validity evidence based on relations to other variables. Hence, what has been named the external aspect of construct validity (Messick, 1995) are conceptualized as one source of validity evidence in the argument-based approach to validation (Kane, 2013). Specifically, comparison studies with subjective and objective measures of cognitive load “may lead to new insights on convergence between biological [i.e., objective] and subjective measures and on what these different types of measures are measuring” (Leppink et al., 2013, p. 1070). Hence, comparison between subjective and objective measures have been proposed as a source of validity evidence for subjective measures (Solhjoo et al., 2019).
Clearly more research about subjective and objective cognitive load measures, their interrelationships, and association with theoretically important variables such as emotion and motivation are needed to contribute to a comprehensive understanding of cognitive load and its assessment approaches. The present study contributes to this body of research by examining the convergence of subjective and objective measures of cognitive load and the relationship between causal and assessment factors of cognitive load.
Causal Factors and Assessment Factors of Cognitive Load
In a theoretical framework of how cognitive load might be conceptualized in the context of problem solving, Paas and van Merriënboer (1994) distinguished between causal and assessment factors of cognitive load. Causal factors include learner characteristics (e.g., prior knowledge, cognitive capabilities, motivation, and affect) as well as task environment (e.g., task complexity, time pressure). In a more recent revision of the framework, the dimension of task environment in the causal factors has been subdivided into learning task and the physical learning environment (Choi et al., 2014). Furthermore, two- and three-way-interactions illustrate the fact that each causal dimension may affect cognitive load depending on characteristics of the other dimensions. For example, the amount of cognitive load a learner invests to solve a given task might depend on task complexity, the specific context or goal (e.g., just for fun vs. high stakes test), and the learner's interest related to the given problem. In terms of assessment factors, the authors distinguished between a task-relevant cognitive load dimension of mental load, a person-relevant cognitive load dimension of mental effort and task performance (Paas and van Merriënboer, 1994). Mental load is based on characteristics of the task, representing the cognitive capacity needed to process a task. In contrast, mental effort reflects an individual’s invested cognitive capacity while working on a task. Assessments of mental effort are thought to provide information about the amount of controlled processing a person is engaged in (Paas and van Merriënboer, 1994).
Some of the assessment factors are hypothesized to be affected by the causal factors during problem solving. In particular Paas and van Merriënboer (1994) conceptualized mental load as independent from person characteristics and, thus, as being constant for a given task (e.g., in terms of cognitive capacity necessary to process the number of elements in a given task). Whereas mental effort and task performance are affected by all three causal dimension factors. Sweller et al. (2011) propose mental load and mental effort as being two different but, in most cases, positively correlated constructs, with the former being the hypothetically required and the latter being the occurring cognitive resources in relation to the learning task. However, the relationship between mental load and mental effort, as well as the relationship between mental load, mental effort, and task performance, might not necessarily be positive. For example, both high or low mental load could result in rather low mental effort due to the moderating role of person characteristics such as motivational variables and persons may reach the same number of correct answers on a test but need to work with different amounts of mental effort (Paas et al., 2003). Relatedly, Moreno (2010) suggested conceptualizing cognitive load within a cognitive-affective theory of learning and emphasizes ‘that cognitive capacity is a parameter that students bring to the learning task whereas motivation determines the actual amount of cognitive resources invested in the learning task’ (p. 137).
This framework provides a powerful tool for researchers as it allows to further investigate cognitive load by narrowing down into its constituent dimensions and provides venues for further research. For example, relating measures of mental effort and task performance allows to investigate the cognitive capacity needed for reaching a specific level of performance (Paas and van Merriënboer, 1994). Further research questions that can be derived from the framework are related to the specific relationships between learner characteristics, such as emotion and motivation, and individual’s invested mental effort (Moreno, 2010; Hawthorne et al., 2019; Skuballa et al., 2019).
The present study focuses on this framework of cognitive load (Figure 1) and is, therefore, related to the assessment and causal factors of cognitive load, assuming that the actual cognitive capacity that needs to be investigated to process a given task (i.e., mental load) is necessarily intertwined with the causal factors such as learner characteristics (especially relatively stable characteristics such as prior knowledge) and, thus, is likely to vary between individuals. Thus, it focuses on the associations between the assessment factors and causal factors, in particular the learner characteristic aspects in terms of motivation and affect. Furthermore, we examined the level of convergence between cognitive load measures obtained via objective and subjective approaches. Below we first elaborate on recent research on subjective and objective measures of assessment factors of cognitive load, then we review literature on learner characteristic related variables including self-concept, interest, and perceived stress as causal factors of cognitive load.
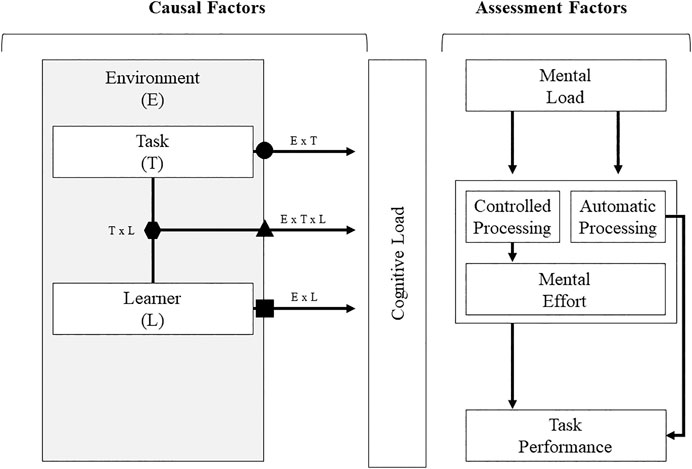
FIGURE 1. Cognitive load as reflected by causal factors and assessment factors, including two- and three-way interactions between the causal factors (adapted from Choi et al., 2014, p. 229).
Subjective Measures of Cognitive Load
Subjective measures of cognitive load ask respondents to self-report the amount of cognitive load after working on a task (Sweller et al., 2011) and this has been the primary approach in research practice (e.g., Paas 1992; Nehring et al., 2012). One basic assumption of subjective measures is that individuals are aware and can quantify and report on their cognitive load (Solhjoo et al., 2019). One of the first scales that have been proposed for subjective measurement of cognitive load was developed by Paas (1992), who introduced a single-item nine-point mental effort rating scale. This scale asks respondents to rate their invested mental effort, ranging from “very, very low mental effort” to “very, very high mental effort”.
However, subjective measurement of cognitive load ‘has become highly problematic’ (Kirschner et al., 2011, p. 104). Krell (2015) summarized several reasons for this:
(1) Many studies adapt the scale initially developed by Paas (1992) and change the wording or number of category labels without re-evaluating its psychometric properties (Paas et al., 2003; van Gog and Paas 2008).
(2) Often, only a single item is used to measure cognitive load, although the use of several items would increase measurement precision (Leppink et al., 2013).
(3) Sometimes, it is not entirely clear which construct the items are aimed to measure. Whereas Paas (1992) focused on mental effort, many researchers use category labels related to task complexity such as ‘difficulty’ and still consider it as measures of cognitive load (van Gog and Paas 2008; de Jong 2010).
(4) Finally, van Gog and Paas (2008) emphasize that most measures target cognitive load as a whole and not specific dimensions of it, such as mental effort or mental load.
In response to such criticisms, new subjective measures of cognitive load have been proposed. For example, some authors (Klepsch et al., 2017; Leppink et al., 2013) developed instruments to assess three dimensions of cognitive load: intrinsic load, extraneous load, and germane load (cf. Paas et al., 2003). These dimensions reflect the cognitive capacity caused by the complexity of a problem (intrinsic cognitive load), the design of learning material (extraneous cognitive load), and the effort invested to solve a given task (germane cognitive load). Hence, related to the framework used in the present study (Figure 1), germane and extraneous cognitive load are related to ME, whereas intrinsic cognitive load is related to mental load (Choi et al., 2014). For both instruments, validity evidence based on various sources (e.g., internal structure, test content) have been provided (cf. AERA et al., 2014) and the authors conclude that their instrument is useful, feasible, and reliable (Klepsch et al., 2017) or that it could be used for research purposes in various knowledge domains (Leppink et al., 2013), respectively.
Related to the framework of cognitive load, which is used in the present study (Figure 1), Krell (2015, 2017) proposed the Students’ Mental Load and Mental Effort in Biology Education-Questionnaire (“StuMMBE-Q”). This instrument was designed to measure students’ mental load and mental effort on 12 rating scale items. Besides its development in the context of student assessment in biology education, it has been widely applied in various other contexts (e.g., Nebel et al., 2016; Knigge et al., 2019). Evidence for the valid interpretation of the ratings as indicators for students’ mental load and mental effort have been provided based on test content, internal structure, and relation to other variables (AERA et al., 2014). For example, psychometric analyses confirmed a two-dimensional data structure, representing measures of mental load and mental effort (Krell, 2015). Furthermore, students’ self-reported mental load and mental effort significantly increased with increasing task-complexity (Krell, 2017). In preceding studies using the StuMMBE-Q, students’ task performance was significantly negatively correlated with their self-reported mental load but not associated with their self-reported mental effort (Krell, 2015, 2017).
In sum, subjective measurement has been the primary approach in assessment of cognitive load. However, this approach is subject to influence from causal factors, in particular individual differences such as prior knowledge, interest and motivation. Thus, subjectively perceived cognitive load might not accurately reflect the characteristics and demands of the learning task. Objective measures, on the other hand, may provide more accurate reflection on task complexity presented to the learner.
Objective Measures of Cognitive Load
Besides the measurement of cognitive load via self-reports on questionnaires (e.g., Paas, 1992; Leppink et al., 2013; Krell, 2017), other approaches suggest or use more objective, physiological measures as indicators for respondents’ cognitive load (cf. Sweller et al., 2011); such as eye movements (Ikehara and Crosby, 2005; Zu et al., 2019), degree of pupil dilation (Huh et al., 2019), or physiological stress parameters such as heart rate and cortisol secretion (Veltman and Gaillard, 1993; Kennedy and Scholey, 2000; Cranford et al., 2014). Previous research has attempted to triangulate both objective and subjective cognitive load measures (Kahneman and Peavler., 1969; Antonenko et al., 2010; Zu et al., 2019). Physiological measures have also been proposed as sources for validity evidence for self-reports, if positive correlations between both measures can be shown (e.g., Solhjoo et al., 2019). However, some studies were able to show such positive relations (e.g. Solhjoo et al., 2019), while others found differences between self-reports and physiological measures, suggesting that both might assess separate aspects of cognitive load (e.g., Zheng and Cooke, 2012 for pupillometric measures).
Based on the Biopsychosocial Model of Challenge and Threat (Blascovich and Mendes, 2000; Blascovich, 2008) individuals can perceive performance tasks as 'challenge' or 'threat', depending on how they assess task demands and their own resources. 'Challenge' occurs when resources exceed demands (comparable with low mental load) and 'threat' if demands exceed resources (comparable with high mental load). In this model, the individual relevance of the performance goal is also important, as task engagement (comparable to mental effort) is necessary for challenge and threat states (Blascovich and Mendes, 2000). Challenge and threat states are marked by different cardiovascular patterns. Challenge states are indexed by increases in heart rate, dilation of arteries and increased blood pump, whereas threat states result in little or small increase in heart rate, constriction, and less bloodstream (Seery, 2011; Seery, 2013).
Besides the measurement of the heart rate itself (heart rate, e.g., Solhjoo et al., 2019), some heart rate variability measures were also used in educational and psychological research, including the ratio between high frequency and low frequency components (LF/HF ratio, e.g., Minkley et al., 2018), and the time-related root mean square of successive differences (RMSSD, e.g., Minkley et al., 2018). If a person is confronted with a complex problem or task, where demands exceed their resources, the RMSSD typically decreases (e.g., Malik et al., 1996), as it represents parasympathetic activity which in turn characterizes relaxation (Laborde et al., 2017). In contrast the LF/HF ratio as well as the heart rate increases (e.g., Malik et al., 1996; Isowa et al., 2006). Both parameters basically represent (at least the proportion of; LF/HF ratio) sympathetic activity, which in turn increases under stress (Laborde et al., 2017).
Thus, it is plausible to assume a relationship between subjective measures and heart rate- or hormone- based objective measures of cognitive load, which is rarely investigated yet. One study of the authors found a significant positive correlation between self-reported mental load (i.e., perceived task complexity) and perceived stress but no or rather small correlations between self-reported mental load and physiological stress responses (cortisol concentration, heart rate variability; Minkley et al., 2018). Veltman and Gaillard (1993) report similar findings and conclude that cortisol concentration might not be a valid indicator for mental activity and that heart rate variability might indicate cognitive load only in high demanding tasks. The study of Kennedy and Scholey (2000) points in a similar direction: Although a correlation between heart rate and demanding (mental arithmetic, word retrieval) vs. non demanding (control) tasks could be observed, this correlation was not present when the mental arithmetic tasks were further differentiated regarding their difficulty (serial subtraction of three vs. seven). In contrast, Cranford et al. (2014) observed a higher heart rate in chemical tasks designed to achieve high cognitive load compared to the heart rate in low cognitive load tasks. Unfortunately, the authors did not assess any self-report measure of cognitive load from their participants. However, a recent study by Solhjoo et al. (2019) found positive correlations between self-report measures of cognitive load and heart rate variability for a small sample of ten medical students. In contrast, Woody et al. (2018) found no association between cognitive load and cortisol concentration or heart rate. Hence, it is still vague regarding to what extent and under which circumstances objective measurements capture cognitive load and to what extent they converge with subjective measures of cognitive load.
Motivation and Emotion as Causal Factors of Cognitive Load: Interest, Self-Concept, and Stress Perception
As shown in Figure 1, in the theoretical framework proposed by Paas and van Merriënboer (1994), causal factors of cognitive load consist of both task characteristics and learner characteristics. To date much research of causal factors have focused on varying task characteristics such as worked example vs problem solving. Although there has been research on the roles of learner characteristics in terms of learner prior knowledge (Kalyuga et al., 2003) and age (van Gerven et al., 2002) on cognitive load, less is known about motivation and emotion and how they affect cognitive load. The related cognitive theory of multimedia learning (Moreno, 2010) also suggested that learner’s motivational and affective factors play an important role in the cognitive processes that are captured by the germane cognitive load, which in part is reflected by the learner’s invested mental effort. Motivated learners are more likely to be engaged during the learning process, thus their cognitive resources are more likely directed at schema constructions important for knowledge acquisition. In a similar way, empirical research also confirmed that factors such as learner’s emotion, enjoyment, or stress, can influence available working memory resources (Plass and Kalyuga, 2019) thus affecting the learner’s experienced cognitive load, whereas other constructs such as academic self-concept are less studied in the current context but may also affect cognitive load (Seufert, 2020). In the present study, we look specifically at constructs representing interest, stress related emotion, and academic self-concept of ability (ASCA) and how they may relate to cognitive load measurements. Below we review relevant literature in these motivational (interest and ASCA) and affective (emotion - stress) causal factors and how they affect or could theoretically affect cognitive load. Additionally, to account for the relevance of objective and subjective differentiation of cognitive load measures in the present study, we also review a relatively small pool of literature that studied the relationships between motivation, emotion and objectively measured cognitive load.
Interest
According to Ainsley et al. (2002), p.545, interest is an individual’s “predisposition to attend to certain objects and events and to engage in certain activities”. Since an interested learner is more likely to attend to the learning tasks, their working memory resources are more effectively directed at processing new information afforded by the learning task (i.e., more germane processing and thus higher mental effort). On the other hand, the focused attention and positive affect associated with interest (or “flow”; see Csikszentmihalyi, 2013) could also mean the learner may experience less perceived task difficulty (i.e., less mental load). Learner’s interest is often found inversely associated with perceived cognitive load during task performance and higher invested effort. For example, learners with higher learning interest viewed the same tasks to be less difficult (i.e., mental load) even when they invested more effort (Milyavskaya et al., 2018). Skuballa et al. (2019) also found that learner’s topic interest was associated with decreased perceived task difficulty. It seems that the more motivated the learner is, the less difficulty they perceive the task, and the more mental effort the learner will invest in the learning task. This body of literature largely supports the role of interest as a causal factor of cognitive load.
Academic Self-Concept
The ASCA represents one’s self-evaluation of their competencies in academic domains (Marsh et al., 2012). Although to our knowledge no previous study has investigated the association between ASCA and cognitive load, ASCA may affect the perceived cognitive load in several possible ways. ASCA has been shown to have reciprocal relationships with both the learner’s achievement and their interest (e.g., Marsh et al., 2005). The bi-directional relationships with achievement and interest implies that a learner with a higher ASCA may also have a higher level of prior knowledge (i.e., achievement), and is also more interested in the topic. For a given task, a higher prior knowledge is likely to be associated with less cognitive load, because the learner already has consolidated knowledge “chunks” and therefore the number of elements to be processed for performing the task is reduced (Sweller et al., 2019). Consequently, the learner is likely to experience relatively less cognitive load, in particular perceived difficulty (i.e., mental load). Similarly, since ASCA is reciprocally related to interest, a learner with high ASCA is likely to be interested in the task, perceive less task difficulty (i.e., mental load), and invest more effort (i.e., mental effort). Based on this theoretical conjecture, ASCA is a causal factor of cognitive load, and this relationship is likely supported by empirical research.
Emotion (Stress)
Emotions, in particular negative valence emotions, have been suggested to be a source of increased extraneous load (Sweller et al., 2019). Plass and Kalyuga (2019) elaborated on how emotion might affect cognitive load and they suggested that negative emotion such as stress may indeed increase the burden of neural circuitry involved in learning thus increasing cognitive load and reducing task processing efficiency. Moreover, Blascovich (2008) claims that individuals perceive tasks as 'challenge' or 'threat', depending on their assessment of task difficulty and possibilities of dealing with them. As a result, the individual may pursue or disengage with the task. Empirical research has yielded somewhat inconsistent results regarding this proposition (e.g., Fraser et al., 2012; Knörzer et al., 2016). Based on a sample of undergraduate medical students who worked on a simulation training, Fraser et al. (2012) found that stress-related invigorating emotions are associated with higher perceived cognitive load. In their experimental study, Knörzer et al. (2016) induced negative emotions prior to a learning task. Although participants in the experimental group rated higher perceived task difficulty (i.e., mental load) than those in the control group (neutral emotion), this effect was not statistically significant. The ratings on mental effort also did not differ between the two groups. However, both studies were based on relatively small sample sizes (n < 100) thus further evidence is needed in larger, multiple samples to provide stronger statistical power. In sum, although there is a theoretical basis for a learner’s emotion to be a causal factor of cognitive load, further empirical research is necessary to confirm this hypothesis.
Motivation, Emotion and Objectively Measured Cognitive Load
Most of the literature relating motivation and affect to cognitive load is based on cognitive load reported from questionnaire measurements. There is limited empirical research examining whether objectively assessed cognitive load is also associated with motivation and affect (typically measured by questionnaire-based method). In an early experimental study, Kahneman and Peavler (1969) demonstrated the potential effect of motivation by showing that individuals performed better on the test items associated with higher monetary values. Furthermore, while working on task items with higher incentive, participants also showed larger pupillary dilation - an objective indicator of mental effort (Goldinger and Papesh, 2012). As discussed by Paas and van Merriënboer (1994), a higher performance could indicate higher mental effort, thus, the link between causal and assessment factors is supported by an association between motivation (prompt by monetary value) and cognitive load (illustrated by performance). Kahneman and Peavler (1969)’s research showed that there may be an association between motivation and objectively measured cognitive load. Given the scarcity of the existing research demonstrating the relationship between motivation, affect and objectively measured cognitive load, the present study aims to contribute to the literature by investigating the relationship between interest, ASCA, stress and cognitive load measures assessed both subjectively via questionnaire as well as objectively through heart rate.
Aims of the Study, Research Questions and Hypotheses
The aims of this study are to evaluate the convergence between subjective (self-reports on mental load and mental effort) and objective (heart rate measures LF/HF ratio, RMSSD and heart rate) measures of cognitive load (Leppink et al., 2013; Solhjoo et al., 2019) and to provide evidence for the assumed relationships between assessment factors of cognitive load, that is mental effort and mental load (Paas and van Merriënboer, 1994) and conceptually related causal factors in terms of positive and negative motivation and affect, that is self-concept, interest and perceived stress (cf. Moreno, 2010; Minkley et al., 2014; Minkley et al., 2018; Solhjoo et al., 2019).
Research Questions
(1) How do cognitive load measures converge via subjective and objective measures?
H1: There is a linear relationship between subjective and objective measures of cognitive load (positive for LF/HF ratio and heart rate, negative for RMSSD), with still a medium to large variance component specific to each measure, because subjective and objective measures are likely to capture separate aspects of cognitive load (Zheng and Cooke, 2012; Solhjoo et al., 2019).
(2) How do subjective and objective measures of cognitive load predict task performance?
H2: It is expected that (1) subjective (i.e., mental load and mental effort) and (2) objective (i.e., RMSSD, LF/HF ratio, and heart rate) measures of cognitive load contribute to predict students’ task performance because (1) a higher level of mental load indicates more challenging tasks (Krell, 2017) whereas higher mental effort indicates a more intense engagement with tasks (Paas et al., 2003). (2) Regarding objective measures, RMSSD typically decreases, whereas the LF/HF ratio and heart rate increase with increasing task difficulty (e.g., Malik et al., 1996; Isowa et al., 2006).
(3) How do students' self-concept, interest and stress perception predict their subjectively (mental effort, mental load) and objectively measured cognitive load?
H3a: It is expected that students' (1) self-concept and interest, (2) but not their stress perception, predict their self-reported level of mental effort, because (1) higher amounts of self-concept and interest might elicit a more intense engagement with tasks (Milyavskaya et al., 2018; Skuballa et al., 2019). (2) In contrast, the effect of personal classification of perceived stress (as challenge or threat) is less consistent and can lead to either increased ambition or give up (Lazarus and Folkman, 1984).
H3b: It is expected that students' (1) self-concept and interest (2) and also their stress perception predict their self-reported level of mental load, because (1) higher amounts of self-concept and interest might elicit a perception of less complex tasks (Milyavskaya et al., 2018; Skuballa et al., 2019) and (2) demanding tasks, beyond what is manageable according to the self-concept, should be perceived as threatening, leading to a stress response (Dickerson and Kemeny, 2004) thus a higher perceived mental load.
H3c: It is expected that students' self-concept and interest, (2) but not their stress perception, predict objective measures of cognitive load (i.e., RMSSD, LF/HF ratio, and heart rate), because (1) higher self-concept and interest contribute to perceive a task as less challenging (Milyavskaya et al., 2018; Skuballa et al., 2019). (2) In contrast, most previous studies did not find systematic associations between stress perception and cognitive load measures, assuming inter alia that both measures differ between individuals and are affected by the time of measurement in varying degrees (Campbell and Ehlert, 2012).
Materials and Methods
Context and Design of the Studies
The data come from three earlier studies, one of which (study 1) has been published elsewhere (Minkley et al., 2018), and which are secondarily analyzed for the purpose of this study. In each of the three studies, high school students participated in a one-day out of school learning project about molecular biology techniques with instructional and practical hands-on phases, aimed at identifying genetically modified food in the teaching and learning laboratory at Ruhr-Universität Bochum. The procedure and design of the three studies were the same and also the structure of the tasks' and the measurements. The differences between the three studies lie in the fact that the content of the tasks differed in each study, although they all dealt with topics in molecular biology (see sections “Procedure” and “Tasks”).
Participants
The participants (N = 309, from three studies; Table 2) were upper-level students with a mean age of 17.48 years (SD = 1.07; Table 1), from 22 high schools in North Rhine-Westphalia, Germany. Complete heart rate variability measurements were obtained from 227 participants. Among the 82 participants which were excluded from further analysis, some did not complete the study tasks. For those who did complete the task, there were technical errors; e.g., a lack of coupling between the measurement sensor and the storage device, which leads to the fact that the measurement data could not be read out, or too many measurement artifacts. For the latter, according to the procedure of Laborde et al. (2017), the threshold value for data being considered as artifacts, was set to 0.45 s (= very low) difference between a single heartbeat interval from the local average. That is, participants with regular fluctuations above a range of 0.45 s were excluded from the data set. To avoid possible confounding effects, 18 participants with a body mass index >30 kg/m2, serious medical conditions or frequent smoking were excluded from all heart rate variability analyses (Piestrzeniewicz et al., 2008; Thayer et al., 2010). Thus, we examined heart rate variability parameters from 209 students.
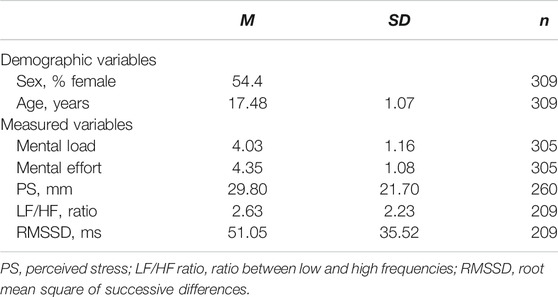
TABLE 1. Demographic characteristics and measurement values.
Procedure
In all three studies the procedure was comparable in terms of learning environment and tasks. After arrival, the students', respectively their parents' written informed consent was collected and the participants were informed about the procedure of the following studies, which were conducted in accordance with the Declaration of Helsinki and approved by the Ethics Commission of the local medical school. Thereafter all students participated in the same molecular biology project, which was not associated with the present studies. The actual study started after about one half of the molecular biology project. Before the students worked on the test tasks, they were equipped with a chest belt and moved to another room. Then each of them was placed in front of a laptop, separated from each other. The students also filled in a demographic questionnaire (sex, age) including medical information (weight, height, chronic diseases, medication intake), and two scales measuring the ASCA and interest regarding biology (Sparfeldt et al., 2004; Rost et al., 2007; Wilde et al., 2009; Minkley et al., 2014). All participants were randomly seated in front of a laptop, on which the test booklets were installed. The laptops were separated from each other, so that the participants could not see the tasks of their schoolmates. The students got 10 up to 20 min to work on the tasks (depending on the study). After completion of the tasks, the students filled in a questionnaire to self-report their mental load and mental effort during working on the tasks (Krell, 2015, 2017) and indicated their perceived stress on a Visual Analogue Scale (Luria, 1975; cf. Table 2). Heart rate variability was measured continuously via a chest belt and a storage device (Polar V800).
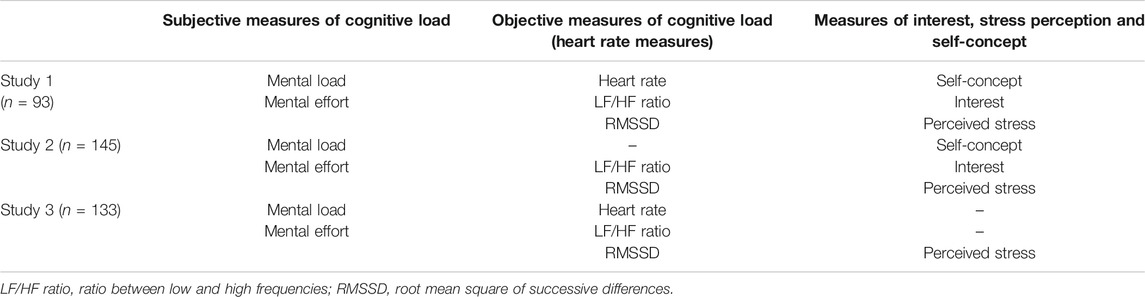
TABLE 2. Assessments in the three studies.
Tasks
In each of the three studies, participants completed several tasks that had the same structure and differed only slightly in content, but all related to molecular structures and phenomena covered in biology classes (e.g., DNA structure, diffusion). In order to achieve a test design that is as close to school reality as possible, we have checked the tasks for alignment with the course content and the biology curriculum in high school. In each task, there was a representation of a molecular structure or process. The task complexity was varied by considering different cognitive demands in all three studies. In the simpler tasks (about one half) the participants had to recognize and select the correct name or a true statement about a depicted molecular structure or process from several answering options (i.e., single-best answer format). In the more complex tasks, the participants had to explain or compare the depicted molecular structure or process in a short written text (i.e., constructed response format). The tasks also differed regarding the types of representation (one half of the tasks included purely symbolic representations, the other half combined symbolic–textual representations; Minkley et al., 2018). The distribution between simple and complex tasks as well as the type of representation was systematically distributed in all three studies. The tasks have been discussed in several rounds by the first and the last author of this article to evaluate their content validity. In the present study, however, task complexity is not a focus, given the abundance of prior research.
Assessments
The instruments used in the present investigation are comparable across the studies included. Table 2 lists the assessments in the three studies. Further explanations are provided in the text below. All assessed data have been z-standardized for further analyses.
Mental Load and Mental Effort
The StuMMBE-Q instrument was applied in the present study to achieve indicators for the students’ mental load and mental effort (Krell, 2015, 2017). For both dimensions of cognitive load, that is mental load (e.g., "The tasks were challenging.") and mental effort (e.g., "I have tried hard to answer the tasks correctly."), six rating scale items for self-reporting are included in the StuMMBE-Q. For each item, a seven-point rating scale ranging from ‘not at all’ (=1) to ‘totally’ (=7) was provided. Measures for mental load and mental effort have been computed by calculating the mean score of the six respective items. For the total sample, mean scores are MMental load = 4.09 (SD = 1.19) and MMental effort = 4.39 (SD = 1.09), respectively. The internal consistency of the questionnaire is satisfying, with Cronbach’s alpha for mental load = 0.85 and for mental effort = 0.81.
Academic Self-Concept of Ability (ASCA)
In order to assess students’ biology-specific ASCA in study 1 and 2, we used a modification (Minkley et al., 2014) of the DISC-Grid (Rost et al., 2007). There, the participants have to rate eight items (e.g., “For me it is easy to solve biology problems.” or “I have a good feeling when thinking about my achievements concerning biology.”) on a 6-point rating scale, ranging from 1 (“does not apply to me at all”) to 6 (“fully applies to me”). Measures of ASCA have been computed by calculating the sum score of the eight items. The mean score is MASCA = 32.34 (SD = 9.74). The internal consistency of the questionnaire is excellent, with Cronbach’s alpha for ASCA = 0.92.
Interest
In study 1, the students' interest regarding biology was assessed by rating 8 items on a 6-point rating scale ranging from “does not apply to me at all” (=1) to “fully applies to me” (=6) (e.g., “I am interested in Biology.” or “I enjoy working on tasks in biology.”) adapted from Sparfeldt et al. (2004). In study 2, three items with a 7-point rating scale ranging from “does not apply to me at all” (=1) to “fully applies to me” (=7) have been used to assess the same construct based on Wilde et al. (2009) (e.g.,” Biology lessons are interesting.” or “I enjoy biology lessons.”). Measures of interest have been computed by calculating the mean score of the items. For the total sample, mean scores are MInterest = 3.89 (SD = 1.04) for study 1 and MInterest = 5.29 (SD = 1.26) for study 2, respectively. The internal consistency of the questionnaire is excellent, with Cronbach’s alpha = 0.91 (for study 1) and = 0.91 (for study 2).
Perceived Stress
The perceived stress was assessed using a Visual Analogue Scale (Luria, 1975) in all three studies. The Visual Analogue Scale consists of a 100mm-long line, with the label ‘no stress’ on the left end and ‘maximum stress’ on the right end. The participants placed a cross on this line at that point which expresses how stressed they felt at that moment. Afterward the distance between the left end of the line and the participants' cross was measured; therefore, the possible score range is from 0 to 100. For the total sample, the mean score is MStress = 29.84 (SD = 21.82).
Heart rate Variability Measures
The heart rate variability of the participants was measured continuously via a chest belt with an integrated ECG-sensor (V800, Polar). After the measurement, the data was transmitted to a software (Kubios) to calculate time and frequency domain measures. We calculated the root mean square of successive differences (RMSSD) as a common time domain measure of heart rate variability, reflecting vagal tone (Laborde et al., 2017), or rather parasympathetic activity (Malik et al., 1996; Hjortskov et al., 2004). Additionally, we calculated LF/HF ratio as a frequency domain measure reflecting the ratio between parasympathetic (high frequency components; 0.15–0.4 Hz) and sympathetic (low frequency components; 0.04–0.15 Hz) nervous system activity. For the total sample, mean scores are MHeart rate = 90.28 (SD = 17.65), MRMSSD = 51.64 (SD = 36.11), and MLF/HF ratio = 2.63 (SD = 2.29), respectively.
Task Performance
To assess task performance, performance expectations were prepared for all tasks and points were awarded as follows. For the tasks in single-best answer format, respondents received a full score for the correct answer (=1) or no points if they selected a wrong answering option. For the constructed response items, scoring was done according to a predetermined scoring scheme, which also allowed for partially correct answers. This performance expectation was discussed and revised in several rounds as part of the task development (see section 2.4). To calculate a task performance score, the percentage of achieved points relative to maximum points was used; therefore, the possible score range is from 0 to 100. For the total sample, the mean score is MPerformance = 41.83 (SD = 24.03).
Data Analysis
The Software IBM SPSS Statistics was Used for Data Analysis.
Measurements of almost all scales had skewness and kurtosis statistics between -2 and 2 (except kurtosis of LF/HF ratio = 3.55 ± 0.32), indicating approximately normal distribution (Gravetter and Wallnau, 2012).
For the analysis of the convergence of cognitive load measures via subjective and objective measures (RQ 1), correlational analyses were performed with mental load or mental effort and the objective measures (heart rate, LF/HF ratio, RMSSD).
For the analysis of how subjective and objective measures of cognitive load predict task performance (RQ 2), first a basic analysis of the correlations between mental load, mental effort, objective measures, and task performance was carried out. Subsequently, a joint test of the variables was performed in the form of a regression analysis with objective and subjective measures of cognitive load as predictor variables for task performance.
For the analysis of how students' self-concept, interest and stress perception predict their subjectively and objectively measured cognitive load (RQ 3), also basic analyses of the correlations between subjective and objective measures of cognitive load, self-concept, interest, and stress perception were carried out. Subsequently, linear regression analyses were performed with subjective and objective measures of cognitive load as dependent variables and self-concept, interest, and perceived stress as predictor variables.
For all linear regression analyses, no serious violations of assumptions could be found; the Durban-Watson-statistic is in the range of 1 and 3, indicating that there is no considerable autocorrelation, and VIF is < 10 for all items, indicating no serious multicollinearity (Field, 2009). (See regression tables for the exact values.)
Results
In the following, findings are presented for the total sample (N = 309). The separate findings for the three individual studies (n1 = 93, n2 = 145, n3 = 133; Table 2) can be found in the Supplementary Material.
Related to our research question on how cognitive load measures converge via subjective and objective measures (RQ1), the findings (Table 3) show no statistically significant correlation between self-reported mental load and the objective measures; for mental effort, there are statistically significant correlations between mental effort and LF/HF (p <0.05) and mental effort and heart rate (p <0.001). For RMSSD, the p-values indicate marginally significant correlations. However, even statistically significant correlations are mostly small and indicate shared variance (R2) of less than 10%.
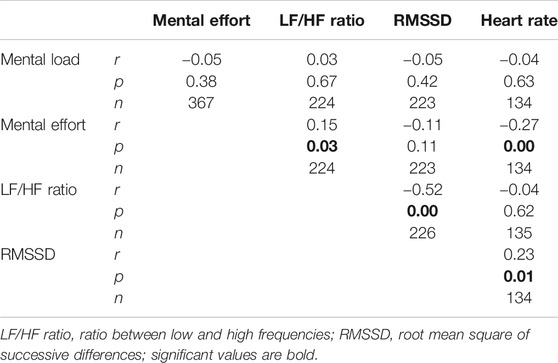
TABLE 3. Pearson correlation coefficients r between objective and subjective measures of cognitive load for the total sample.
Related to our research question on how subjective and objective measures of cognitive load predict task performance (RQ2), initial basic correlational analyses findings show a significant negative correlation between mental load and task performance and a significant positive correlation between mental effort and task performance; the correlation coefficients are small to medium (Table 4). There is a positive correlation toward LF/HF and a negative toward heart rate, both with small correlation coefficients.
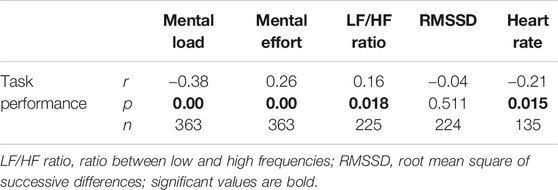
TABLE 4. Pearson correlation coefficients r between objective and subjective measures of cognitive load and task performance for the total sample.
In the subsequent linear regression analysis with objective and subjective measures of cognitive load as predictor variables for task performance, both mental effort and mental load contribute significantly to predict task performance, while LF/HF contributes marginally significantly (Table 5).
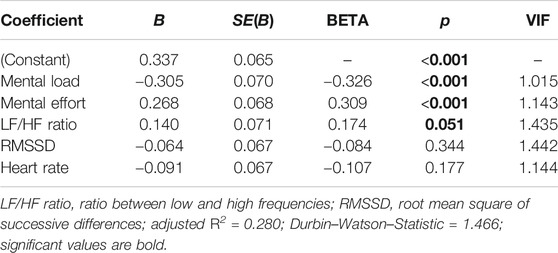
TABLE 5. Linear regression analysis with objective and subjective measures of cognitive load as predictor variables for task performance (for the total sample).
Related to our research question on how students' self-concept, interest and stress perception predict their subjectively and objectively measured cognitive load (RQ3), the initial basic correlational analyses show significant correlations between mental load and mental effort and the motivation variables (i.e., ASCA and interest). While mental effort is positively related to ASCA (r = 0.23) and interest (r = 0.20), the opposite could be found for mental load (ASCA: r = −0.29; interest: r = −0.18). Perceived stress was found to be not related to mental effort, but significantly related to mental load (r = 0.14). The effect sizes are mostly small (Table 6).
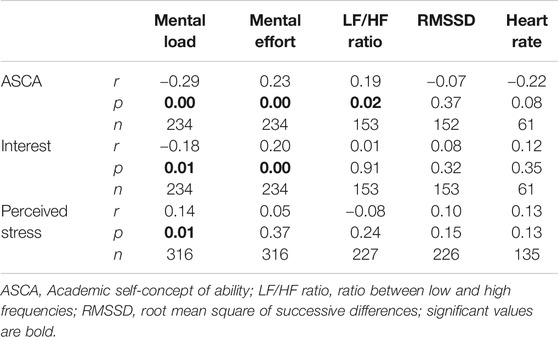
TABLE 6. Pearson correlation coefficients r between ASCA, interest, perceived stress, and subjective and objective measures of cognitive load for the total sample.
Subsequent linear regression analyses with mental effort (Table 7), mental load (Table 8), LF/HF ratio (Table 9), RMSSD (Table 10), and heart rate (Table 11) as dependent variables and ASCA, interest and perceived stress as predictor variables show more specific results. While mental effort is not significantly explained by any of the three variables (H3a), ASCA (negatively) and perceived stress (positively) contribute to explain mental load (H3b). Related to the objective cognitive load measures (H3c), the same two variables contribute to explain LF/HF ratio (ASCA positively, perceived stress negatively), while this is only the case for one of these two predictor variables for RMSSD (perceived stress contributes negatively) and heart rate (ASCA contributes positively).
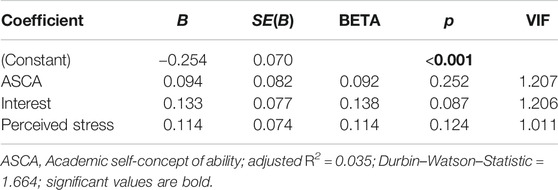
TABLE 7. Linear regression analysis with variables ASCA, interest and perceived stress as predictor variables for mental effort (for the total sample).

TABLE 8. Linear regression analysis with variables ASCA, interest and perceived stress as predictor variables for mental load (for the total sample).

TABLE 9. Linear regression analysis with variables ASCA, interest and perceived stress as predictor variables for LF/HF ratio (for the total sample).
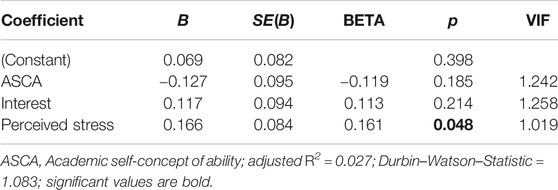
TABLE 10. Linear regression analysis with variables ASCA, interest and perceived stress as predictor variables for RMSSD (for the total sample).
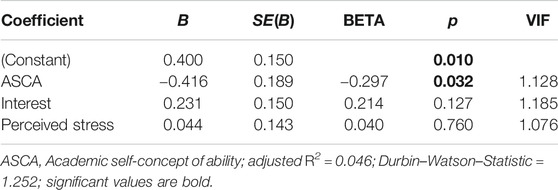
TABLE 11. Linear regression analysis with variables ASCA, interest and perceived stress as predictor variables for heart rate (for the total sample).
Discussion
The aims of this study were to evaluate the convergence between subjective (self-reports on mental load and mental effort) and objective (heart rate measures: LF/HF ratio, RMSSD and heart rate) measures of cognitive load and to provide evidence for the assumed relationships between cognitive load and conceptually related constructs of positive and negative motivation and affect (self-concept, interest, and perceived stress). Related to the convergence of cognitive load measures via subjective and objective measures (RQ1), we only found significant correlations between self-reported ME and two of the heart rate variability measures (positive for LF/HF ratio and negative for heart rate) and no correlation between self-reported mental load and any heart rate measure. Hence, the assumption of a significant linear relationship between subjective and objective measures of cognitive load (positive for LF/HF ratio and heart rate, negative for RMSSD; H1), can only be confirmed for the specific relationship between mental effort and LF/HF ratio. Even for this relationship, the shared variance is rather small. Therefore, the present findings support the assumption that subjective and objective measures are likely to capture separate aspects of cognitive load (Zheng and Cooke, 2012; Solhjoo et al., 2019).
Related to the question how subjective and objective measures of cognitive load predict task performance (RQ2), we found that the subjective measures contributed significantly to explain variance in students' task performance and one of the objective measures (LF/HF ratio) contributed marginally significantly. Based on these findings, the assumption of a contribution of subjective and objective measures of cognitive load to predict students' task performance can be confirmed for mental effort and mental load and also for LF/HF ratio. As suggested in prior research, higher mental load indicates the perception of a more challenging task and is, thus, associated with lower achievement, whereas higher mental effort indicates students' engagement (Krell, 2017). However, in the basic correlational analysis the coefficients are rather small, indicating that different relationships may also exist. For example, for some students, high mental effort might also indicate high load because of an overly demanding task (Paas et al., 2003).
Regarding the question, how students' self-concept, interest and stress perception predict their subjectively and objectively measured cognitive load (RQ3), the assumption of a positive linear relationship between learner characteristics (self-concept and interest) and self-reported level of mental effort has to be rejected and the missing of a linear relationship between stress perception and students’ self-reported level of mental effort (H3a) can be confirmed, because none of the variables self-concept, interest and perceived stress significantly explained self-reported mental effort. Hence, unlike it was found in preceding studies (Milyavskaya et al., 2018; Skuballa et al., 2019), the students' self-concept and interest did not elicit a more intense engagement with the tasks. Related to mental load, a negative linear relationship to measures of self-concept and interest can be partly confirmed (for ASCA) and also a positive linear relationship to students' stress perception (H3b) can be confirmed. This indicates that the students' self-concept and perceived stress significantly contributed to how cognitively challenging the tasks were perceived. Hence, unlike originally proposed by Paas and van Merriënboer (1994), the present measures of mental load are not independent from person characteristics: although it is possible to objectively define a given task's complexity (e.g., in terms of interacting elements to be processed or level of cognitive demands; Krell, 2018; Minkley et al., 2018), the perception of task complexity and amount of cognitive resources, which are necessary to process it, is intertwined with person characteristics, such as self-concept.
Finally, related to the objective measures and based on the regression analyses, the assumption of a linear relationship between objective measures of cognitive load and measures of self-concept and interest and of no linear relationship to perceived stress (H3c) can only be partly confirmed: ASCA contributes to heart rate (positively) and LF/HF ratio (positively), while perceived stress contributes to LF/HF ratio (negatively) and RMSSD (negatively). The former refuses earlier findings where higher ASCA values are associated with less stress (Minkley et al., 2014), as we found higher LF/HF and heart rate values in students with a higher self-concept compared to those with a lower self-concept. This contrasts with the Biopsychosocial Model of Challenge and Threat (Blascovich and Mendes, 2000; Blascovich, 2008), according to which threat and stress arises when task demands exceed resources. For students with a high self-concept—which corresponds to high resources—tasks should be more a challenge than a threat, as they should assess their own resources to exceed task demands. But perhaps in our study the threat increases also for the students with a high self-concept because they want to maintain their own high ASCA and fear not to meet it in the test, which seems to be quite difficult indicated by the relatively high mental load reported by the participants and the rather low test performance.
The assumed and (at least partly) confirmed lack of a relationship between objective stress measurements and perceived stress might result from the differences between physiological and psychological stress responses, which—like mental load—corresponds with the complexity of a task (e.g., Kahneman and Peavler, 1969; Veltman and Gaillard, 1993; Hjortskov et al., 2004; Minkley and Kirchner, 2012): According to the transactional stress model of Lazarus and Folkman (1984) and the Biopsychosocial Model of Challenge and Threat (Blascovich and Mendes, 2000; Blascovich, 2008), stress is the result of the interplay between situational demands and individual resources. Thus, the perception of high demands and low resources creates the feeling of being stressed and raises various physiological responses (e.g., decreased heart rate variability, increased cortisol secretion; Rensing et al., 2006) which are often not related to the respondents’ perceived stress (for a review see Campbell and Ehlert, 2012). Several studies which already investigated the association between physiological (primarily cortisol secretion) and psychological (perceived stress or anxiety) stress responses reported heterogeneous results (for a review see Campbell and Ehlert, 2012). In most studies, there was no systematic relationship between these parameters (Buchanan et al., 1999; Weekes et al., 2006; Campbell and Ehlert, 2012; Minkley et al., 2014; Kärner et al., 2018; Ringeisen et al., 2019). Only a few studies found low or moderate associations between increased cortisol concentration and perceived stress (e.g., Spangler et al., 2002; Lindahl et al., 2005). Campbell and Ehlert (2012) discuss various factors as possible reasons for this disassociation (e.g., differing assessment protocols, mediating factors and interindividual differences in the degree of psychophysiological correspondence). Beyond these formal reasons—which are partly founded in the matter itself—it is also conceivable that physiological and psychological stress responses represent different aspects of a person's reaction toward a stress situation.
Comparing the findings for the total sample presented above with the findings for the three individual studies (Supplementary Material), it becomes evident that - in most cases - there is the same trend in the individual studies and the total sample. Caused by the smaller sample sizes, several coefficients do not reach the 5% p-level in the individual studies but then do in the total sample analysis. For example, while there are four statistically significant correlation coefficients in Table 4, only two (studies 1 and 2) or one (study 3) of them reaches the 5% level in the individual studies (Supplementary Material); however, there have been significant results in some of the single studies that could not be detected in the total sample. Most notably, related to the convergence of cognitive load measures via subjective and objective measures (Table 3), no significant association between LF/HF ratio and heart rate was found for the total sample but for study 1 and study 3. Albeit not being related to one of the research questions and hypotheses addressed here, the opposed findings from two studies indicate the challenging nature of assessing physiological measures of cognitive load. One challenge here could be that our tests did not take place under real conditions at school and therefore may only have had a low personal relevance for the participants. This can lead to a generally low physiological stress response, since the factor “personal relevance”, which contributes to something becoming a stressor, is not or only slightly pronounced. With these rather low stress responses, even small differences (e.g., regarding the content of the tasks) could have different effects on the different heart rate variability measures.
It has been suggested that comparison studies with subjective and objective measures of cognitive load may lead to new insights on what these two types of measures are in fact measuring, hence advancing our understanding of the construct of cognitive load in terms of its subjective and objective measurement (Leppink et al., 2013). Other scholars proposed such comparison studies as a source of validity evidence for subjective measures (Solhjoo et al., 2019). As several objective (i.e., physiological) measures of cognitive load have been suggested (e.g., various heart rate or pupillometric measures; Solhjoo et al., 2019; Zheng and Cooke, 2012; cf. Sweller et al., 2011), it remains unclear as to which objective measure can be validly interpreted as an indicator for an individual’s cognitive load and in which contexts. This is additionally highlighted in the present study, with specific findings for the three heart rate measures (e.g., Table 3). Nevertheless, taken that each cognitive load measure may capture specific aspects of cognitive load (Zheng and Cooke, 2012), a systematic association between subjective and objective measures of cognitive load, with still a medium to large variance component specific to each measure, might be seen as providing evidence for the measures in fact indicating cognitive load. As this study revealed, objective heart rate measures of cognitive load are significantly related to self-reported mental effort but not to mental load. Such objective measures might primarily be used in future studies to indicate the person-relevant cognitive load dimension of mental effort and not the task-relevant cognitive load dimension of mental load (Paas and van Merriënboer, 1994). Similarly, the relationships between subjective measures of mental load and mental effort and further variables of task performance and learner characteristics are generally in line with what has been expected based on the framework presented in Figure 1. This can be seen as further validity evidence based on relations to other variables for the subjective measures of mental load and mental effort (Krell, 2015, 2017). Opposed to this, the findings related to the objective heart rate measures are less clear. This further illustrates the challenges associated with establishing objective cognitive load measures; for example, “physiological measures have proved insufficiently sensitive to indicate the differences in cognitive load generated by the instructional designs used by cognitive load theory” (Sweller et al., 2011, p.81). In sum, as validity refers to the extent to which evidence and theory support the intended interpretation of test scores (Kane, 2013; AERA et al., 2014), a clear theoretical framework of cognitive load including the different objective measures would be needed to derive clear hypotheses about the specific relationships between measures of cognitive load and, hence, allow to interpret related findings as validity evidence for single measures. From this point of view, the present study rather adds to our understanding of the construct of cognitive load in terms of its subjective and objective measurement (Leppink et al., 2013), than to provide strong validity evidence for subjective measures (Solhjoo et al., 2019).
Limitations
Naturally, this study has several limitations. First, self-reported measures are vulnerable to several biases (e.g., social desirability, cultural background), especially in the case of measuring “interest”, where we have used different instruments. Second, we assumed, tested, and found linear relationships between some of the included variables; however, for some variables, non-linear relationships might be considered as well. For example, Paas et al. (2003) discuss a non-linear relationship between task performance and ME. Third, we did not systematically investigate the causal factors of learning task and learning environment (Choi et al., 2014) and also did not consider the two- and three-way-interactions proposed in the framework for cognitive load (Figure 1). As a minor limitation, one of the measurements (LF/HF ratio) shows kurtosis above 2, which is outside normal distribution. This could be due to sample fluctuation. Hence, future studies should investigate whether the specific relationships between person characteristics and dimensions of cognitive load, which were found in this study, might be specific for the present tasks and environment (i.e., tasks dealing with molecular structures and phenomena, presented digitally on laptops, and solved during an out-of-school experience). Also, future study could replicate the findings through other objective measures such as pupillary measures and skin conductance measures.
Data Availability Statement
The raw data supporting the conclusions of this article will be made available upon request to the first author.
Ethics Statement
The studies involving human participants were reviewed and approved by Ethik Kommission der Medizinischen Fakultät der Ruhr-Universität Bochum, Gesundheitscampus 33, 44801 Bochum, Germany. Written informed consent to participate in this study was obtained from participants and their legal guardians if they were under the age of majority.
Author Contributions
NM conceived the project, designed the study, conducted the experiment, analyzed the data, and wrote the manuscript. MK conceived the project, designed the study, analyzed the data, and wrote the manuscript. KX specified the theoretical framework and wrote the manuscript.
Conflict of Interest
The authors declare that the research was conducted in the absence of any commercial or financial relationships that could be construed as a potential conflict of interest.
Supplementary Material
The Supplementary Material for this article can be found online at: https://www.frontiersin.org/articles/10.3389/feduc.2021.632907/full#supplementary-material.
References
AERA, APA, and NCME. (2014). Standards for educational and psychological testing. Washington, DC: American Educational Research Association.
Ainley, M., Hidi, S., and Berndorff, D. (2002). Interest, learning, and the psychological processes that mediate their relationship. J. Educ. Psychol. 94 (3), 545. doi:10.1037/0022-0663.94.3.545
Antonenko, P., Paas, F., Grabner, R., and van Gog, T. (2010). Using electroencephalography to measure cognitive load. Educ. Psychol. Rev. 22 (4), 425–438. doi:10.1007/s10648-010-9130-y
Blascovich, J. (2008). “Challenge, threat, and health,” in Handbook of motivation science. Editors W. L. Gardner, and W. L. Gardner (New York: The Guilford Press), 481–493.
Blascovich, J., and Mendes, W. B. (2000). “Challenge and threat appraisals: the role of affective cues,” in Studies in emotion and social interaction, second series. Feeling and thinking: the role of affect in social cognition. Editor J. P. Forgas (New York: Cambridge University Press), 59–82.
Buchanan, T. W., al'Absi, M., and Lovallo, W. R. (1999). Cortisol fluctuates with increases and decreases in negative affect. Psychoneuroendocrinology 24 (2), 227–241. doi:10.1016/s0306-4530(98)00078-x
Campbell, J., and Ehlert, U. (2012). Acute psychosocial stress: does the emotional stress response correspond with physiological responses? Psychoneuroendocrinology 37 (8), 1111–1134. doi:10.1016/j.psyneuen.2011.12.010
Choi, H.-H., van Merriënboer, J. J. G., and Paas, F. (2014). Effects of the physical environment on cognitive load and learning: towards a new model of cognitive load. Educ. Psychol. Rev. 26, 225–244. doi:10.1007/s10648-014-9262-6
Cranford, K. N., Tiettmeyer, J. M., Chuprinko, B. C., Jordan, S., and Grove, N. P. (2014). Measuring load on working memory: the use of heart rate as a means of measuring chemistry students' cognitive load. J. Chem. Educ. 91 (5), 641–647. doi:10.1021/ed400576n
de Jong, T. (2010). Cognitive load theory, educational research, and instructional design: some food for thought. Instr. Sci. 38, 105–134. doi:10.1007/s11251-009-9110-0
Dickerson, S. S., and Kemeny, M. E. (2004). Acute stressors and cortisol responses: a theoretical integration and synthesis of laboratory research. Psychol. Bull. 130 (3), 355–391. doi:10.1037/0033-2909.130.3.355
Fraser, K., Ma, I., Teteris, E., Baxter, H., Wright, B., and McLaughlin, K. (2012). Emotion, cognitive load and learning outcomes during simulation training. Med. Educ. 46 (11), 1055–1062. doi:10.1111/j.1365-2923.2012.04355.x
Goldinger, S. D., and Papesh, M. H. (2012). Pupil dilation reflects the creation and retrieval of memories. Curr. Dir. Psychol. Sci. 21 (2), 90–95. doi:10.1177/0963721412436811
Gravetter, F. J., and Wallnau, L. B. (2012). Statistics for the behavioral sciences. Belmont, CA: Wadsworth Cengage Learning.
Hartig, J., Frey, A., and Jude, N. (2012). “Validität,” in Testtheorie und Fragebogenkonstruktion. Editors H. Moosbrugger, and A. Kelava (Berlin, Heidelberg: Springer). doi:10.1007/978-3-642-20072-4_7
Hawthorne, B. S., Vella-Brodrick, D. A., and Hattie, J. (2019). Well-being as a cognitive load reducing agent: a review of the literature. Front. Educ. 4, 121. doi:10.3389/feduc.2019.00121
Hjortskov, N., Rissn, D., Blangsted, A. K., Fallentin, N., Lundberg, U., and Sgaard, K. (2004). The effect of mental stress on heart rate variability and blood pressure during computer work. Eur. J. Appl. Physiol. 92 (1-2), 84–89. doi:10.1007/s00421-004-1055-z
Huh, D., Kim, J. H., and Jo, I. H. (2019). A novel method to monitoring changes in cognitive load in video‐based learning. J. Comput. Assist. Learn. 35, 721–730. doi:10.1111/jcal.12378
Ikehara, C. S., and Crosby, M. E. (2005). “Assessing cognitive load with physiological sensors,” in Proceedings of the 38th Annual Hawaii international conference on system sciences, 1–9.
Isowa, T., Ohira, H., and Murashima, S. (2006). Immune, endocrine and cardiovascular responses to controllable and uncontrollable acute stress. Biol. Psychol. 71 (2), 202–213. doi:10.1016/j.biopsycho.2005.04.002
Kahneman, D., and Peavler, W. S. (1969). Incentive effects and pupillary changes in association learning. J. Exp. Psychol. 79 (2Pt.1), 312–318. doi:10.1037/h0026912
Kalyuga, S., Ayres, P., Chandler, P., and Sweller, J. (2003). The expertise reversal effect. Educ. Psychol. 38, 23–31. doi:10.1207/S15326985ep3801_4
Kane, M. T. (2013). Validating the interpretations and uses of test scores. J. Educ. Meas. 50 (1), 1–73. doi:10.2307/23353796doi:10.1111/jedm.12000
Kärner, T., Minkley, N., Rausch, A., Schley, T., and Sembill, D. (2018). Stress and resources in vocational problem solving. Vocations Learn. 11 (2), 365–398. doi:10.1007/s12186-017-9193-8
Kennedy, D. O., and Scholey, A. B. (2000). Glucose administration, heart rate and cognitive performance: effects of increasing mental effort. Psychopharmacology 149, 63–71. doi:10.1007/s002139900335
Kirschner, P. A., Ayres, P., and Chandler, P. (2011). Contemporary cognitive load theory research: The good, the bad and the ugly. Comput. Human Behav. 27 (1), 99–105. doi:10.1016/j.chb.2010.06.025
Kirschner, P. A., Sweller, J., and Clark, R. E. (2006). Why minimal guidance during instruction does not work: an analysis of the failure of constructivist, discovery, problem-based, experiential, and inquiry-based teaching. Educ. Psychol. 41, 75–86. doi:10.1207/s15326985ep4102_1
Klepsch, M., Schmitz, F., and Seufert, T. (2017). Development and validation of two instruments measuring intrinsic, extraneous, and germane cognitive load. Front. Psychol. 8, 1997. doi:10.3389/fpsyg.2017.01997
Knigge, M., Krauskopf, K., and Wagner, S. (2019). Improving socio-emotional competencies using a staged video-based learning program? Results of two experimental studies. Front. Educ. 4, 142. doi:10.3389/feduc.2019.00142
Knörzer, L., Brünken, R., and Park, B. (2016). Facilitators or suppressors: effects of experimentally induced emotions on multimedia learning. Learn. Instruct. 44, 97–107. doi:10.1016/j.learninstruc.2016.04.0
Krell, M. (2017). Evaluating an instrument to measure mental load and mental effort considering different sources of validity evidence. Cogent Educ. 4, 1280256. doi:10.1080/2331186X.2017.1280256
Krell, M. (2018). Schwierigkeitserzeugende Aufgabenmerkmale bei Multiple-Choice-Aufgaben zur Experimentierkompetenz im Biologieunterricht: eine Replikationsstudie. ZfDN 24, 1–15. doi:10.1007/s40573-017-0069-0
Krell, M. (2015). Evaluating an instrument to measure mental load and mental effort using item response theory. Sci. Educ. Rev. Lett. Res. Lett. 2015, 1–6. doi:10.18452/8212
Laborde, S., Mosley, E., and Thayer, J. F. (2017). Heart rate variability and cardiac vagal tone in psychophysiological research - recommendations for experiment planning, data analysis, and data reporting. Front. Psychol. 08, 1–18. doi:10.3389/fpsyg.2017.00213
Leppink, J., Paas, F., van der Vleuten, C. P. M., van Gog, T., and Van Merriënboer, J. J. G. (2013). Development of an instrument for measuring different types of cognitive load. Behav. Res. 45 (4), 1058–1072. doi:10.3758/s13428-013-0334-1
Lindahl, M., Theorell, T., and Lindblad, F. (2005). Test performance and self-esteem in relation to experienced stress in Swedish sixth and ninth graders--saliva cortisol levels and psychological reactions to demands. Acta Paediatr. 94, 489–95. doi:10.1111/j.1651-2227.2005.tb01922.x
Luria, R. E. (1975). The validity and reliability of the visual analogue mood scale. J. Psychiatr. Res. 12 (1), 51–57. doi:10.1016/0022-3956(75)90020-5
Malik, M., Bigger, J. T., Camm, A. J., Kleiger, R. E., Malliani, A., Moss, A. J., et al. (1996). Heart rate variability: Standards of measurement, physiological interpretation, and clinical use. Eur. Heart J. 17 (3), 354–381. doi:10.1093/oxfordjournals.eurheartj.a014868
Marsh, H. W., Trautwein, U., Lüdtke, O., Köller, O., and Baumert, J. (2005). Academic self-concept, interest, grades, and standardized test scores: reciprocal effects models of causal ordering. Child. Dev. 76 (2), 397–416. doi:10.1111/j.1467-8624.2005.00853.x
Marsh, H. W., Xu, M., and Martin, A. J. (2012). “Self-concept: a synergy of theory, method, and application,” in Theories, constructs, and critical issues. APA educational psychology handbook. (New York, NY: American Psychological Association), 427–458.
Messick, S. (1995). Validity of psychological assessment: validation of inferences from persons' responses and performances as scientific inquiry into score meaning. Am. Psychol. 50, 741–749. doi:10.1037/0003-066x.50.9.741
Milyavskaya, M., Galla, B., Inzlicht, M., and Duckworth, A. (2018). More effort, less fatigue: how interest increases effort and reduces mental fatigue. PsyArXiv http://psyarxiv.com/8npfx/
Minkley, N., Kärner, T., Jojart, A., Nobbe, L., and Krell, M. (2018). Students' mental load, stress, and performance when working with symbolic or symbolic-textual molecular representations. J. Res. Sci. Teach. 55, 1162–1187. doi:10.1002/tea.21446
Minkley, N., and Kirchner, W. H. (2012). Influence of test tasks with different cognitive demands on salivary cortisol concentrations in school students. Int. J. Psychophysiology 86 (3), 245–250. doi:10.1016/j.ijpsycho.2012.09.015
Minkley, N., Westerholt, D. M., and Kirchner, W. H. (2014). Academic self-concept of ability and cortisol reactivity. Anxiety Stress Coping 27, 303–316. doi:10.1080/10615806.2013.848273
Moreno, R. (2010). Cognitive load theory: more food for thought. Instr. Sci. 38, 135–141. doi:10.1007/s11251-009-9122-9
Nebel, S., Beege, M., Schneider, S., and Rey, G. D. (2016). The higher the score, the higher the learning outcome? Heterogeneous impacts of leaderboards and choice within educational videogames. Comput. Hum. Behav. 65, 391–401. doi:10.1016/j.chb.2016.08.042
Nehring, A., Nowak, K., Upmeier zu Belzen, A., and Tiemann, R. (2012). Doing inquiry in chemistry and biology: the context’s influence on the students’ cognitive load. La Chimica nella Scuola IV, 253–258. doi:10.4324/9781315748047
Paas, F. G. W. C. (1992). Training strategies for attaining transfer of problem-solving skill in statistics: a cognitive-load approach. J. Educ. Psychol. 84, 429–434. doi:10.1037/0022-0663.84.4.429
Paas, F. G. W. C., and Van Merriënboer, J. J. G. (1994). Instructional control of cognitive load in the training of complex cognitive tasks. Educ. Psychol. Rev. 6 (4), 351–371. doi:10.1007/BF02213420
Paas, F., Tuovinen, J. E., Tabbers, H., and van Gerven, P. W. M. (2003). Cognitive load measurement as a means to advance cognitive load theory. Educ. Psychol. 38, 63–71. doi:10.1207/S15326985EP3801_8
Piestrzeniewicz, K., Łuczak, K., Lelonek, M., Wranicz, J. K., and Goch, J. H. (2008). Obesity and heart rate variability in men with myocardial infarction. Cardiol. J. 15 (1), 43–9. doi:10.1207/s15326985ep3801_8
Plass, J. L., and Kalyuga, S. (2019). Four ways of considering emotion in cognitive load theory. Educ. Psychol. Rev. 31 (2), 339–359. doi:10.1007/s10648-019-09473-5
Rensing, L., Koch, M., Rippe, B., and Rippe, V. (2006). Mensch im Stress. Psyche, Körper, Moleküle. [Man under stress], München: Spektrum,
Ringeisen, T., Lichtenfeld, S., Becker, S., and Minkley, N. (2019). Stress experience and performance during an oral exam: the role of self-efficacy, threat appraisals, anxiety, and cortisol. Anxiety Stress Coping 32 (1), 50–66. doi:10.1080/10615806.2018.1528528
Rost, D., Sparfeldt, J., and Schilling, S. (2007). DISK-GITTER mit SKSLF-8. Differentielles schulisches Selbstkonzept-Gitter mit Skala zur Erfassung des Selbstkonzepts schulischer Leistungen und Fähigkeiten [The DISC-grid with SKSLF-8. Differential self-concept grid with a scale for capturing the self-concept of school relevant accomplishments and abilities]. Göttingen: Hogrefe.
Seery, M. D. (2011). Challenge or threat? Cardiovascular indexes of resilience and vulnerability to potential stress in humans. Neurosci. Biobehav. Rev. 35 (7), 1603–1610. doi:10.1016/j.neubiorev.2011.03.003
Seery, M. D. (2013). The biopsychosocial model of challenge and threat: using the heart to measure the mind. Social Personal. Psychol. Compass 7 (9), 637–653. doi:10.1111/spc3.12052
Seufert, T. (2020). Building bridges between self-regulation and cognitive load-an invitation for a broad and differentiated attempt. Educ. Psychol. Rev. 32, 1151–1162. doi:10.1007/s10648-020-09574-6
Skuballa, I. T., Xu, K. M., and Jarodzka, H. (2019). The impact of co-actors on cognitive load: when the mere presence of others makes learning more difficult. Comput. Hum. Behav. 101, 30–41. doi:10.1016/j.chb.2019.06.016
Solhjoo, S., Haigney, M. C., McBee, E., van Merriënboer, J. J. G., Schuwirth, L., Artino, A. R., et al. (2019). Heart rate and heart rate variability correlate with clinical reasoning performance and self-reported measures of cognitive load. Sci. Rep. 9, 14668. doi:10.1038/s41598-019-50280-3
Spangler, G., Pekrun, R., Kramer, K., and Hofmann, H. (2002). Students' emotions, physiological reactions, and coping in academic exams. Anxiety Stress Coping 15 (4), 413. doi:10.1080/1061580021000056555
Sparfeldt, J. R., Rost, D. H., and Schilling, S. R. (2004). Schulfachspezifische interessen—ökonomisch gemessen. Psychol. Erziehung Unterricht 51, 213–220. doi:10.1207/s15326985ep3801_8
Sweller, J., Ayres, P., and Kalyuga, S. (2011). “Measuring cognitive load,” in Cognitive load theory. Editors J. Sweller, P. Ayres, and S. Kalyuga (New York: Springer), 71–85.
Sweller, J., van Merriënboer, J. J. G., and Paas, F. (2019). Cognitive architecture and instructional design: 20 years later. Educ. Psychol. Rev. 31 (2), 261–292. doi:10.1007/s10648-019-09465-5
Thayer, J. F., Yamamoto, S. S., and Brosschot, J. F. (2010). The relationship of autonomic imbalance, heart rate variability and cardiovascular disease risk factors. Int. J. Cardiol. 141, 122–131. doi:10.1016/j.ijcard.2009.09.543
van Gerven, P. W. M., Paas, F. G. W. C., Van Merriënboer, J. J. G., and Schmidt, H. G. (2002). Cognitive load theory and aging: effects of worked examples on training efficiency. Learn. Instruction 12, 87–105. doi:10.1016/s0959-4752(01)00017-2
van Gog, T., and Paas, F. (2008). Instructional efficiency: revisiting the original construct in educational research. Educ. Psychol. 43 (1), 16–26. doi:10.1080/00461520701756248
Veltman, J. A., and Gaillard, A. W. K. (1993). Indices of mental workload in a complex task environment. Neuropsychobiology 28, 72–75. doi:10.1159/000119003
Weekes, N., Lewis, R., Patel, F., Garrison-Jakel, J., Berger, D. E., and Lupien, S. J. (2006). Examination stress as an ecological inducer of cortisol and psychological responses to stress in undergraduate students. Stress 9 (4), 199–206. doi:10.1080/10253890601029751
Wilde, M., Bätz, K., Kovaleva, A., and Urhahne, U. (2009). Überprüfung einer Kurzskala intrinsischer Motivation (KIM). Z. für Didaktik der Naturwissenschaften 15, 31–45. doi:10.1007/978-3-658-02539-7_7
Woody, A., Hooker, E. D., Zoccola, P. M., and Dickerson, S. S. (2018). Social-evaluative threat, cognitive load, and the cortisol and cardiovascular stress response. Psychoneuroendocrinology 97, 149–155. doi:10.1016/j.psyneuen.2018.07.009
Zheng, R., and Cook, A. (2012). Solving complex problems: a convergent approach to cognitive load measurement. Br. J. Educ. Technol. 43, 233–246. doi:10.1111/j.1467-8535.2010.01169.x
Keywords: cognitive load, causal and assessment factors, stress, interest, self-concept, heart rate, mental load, mental effort
Citation: Minkley N, Xu KM and Krell M (2021) Analyzing Relationships Between Causal and Assessment Factors of Cognitive Load: Associations Between Objective and Subjective Measures of Cognitive Load, Stress, Interest, and Self-Concept. Front. Educ. 6:632907. doi: 10.3389/feduc.2021.632907
Received: 24 November 2020; Accepted: 08 February 2021;
Published: 12 April 2021.
Edited by:
Sedat Sen, Harran University, TurkeyReviewed by:
Mary Roduta Roberts, University of Alberta, CanadaH. Cigdem Bulut, Çukurova University, Turkey
Copyright © 2021 Minkley, Xu and Krell. This is an open-access article distributed under the terms of the Creative Commons Attribution License (CC BY). The use, distribution or reproduction in other forums is permitted, provided the original author(s) and the copyright owner(s) are credited and that the original publication in this journal is cited, in accordance with accepted academic practice. No use, distribution or reproduction is permitted which does not comply with these terms.
*Correspondence: Nina Minkley, bmluYS5taW5rbGV5QHJ1Yi5kZQ==