 Francisca Calderón
 Jorge González
- 1Department of Statistics, Faculty of Mathematics, Pontificia Universidad Católica de Chile, Santiago, Chile
- 2Laboratorio Interdiciplinario de Estadística Social, LIES, Facultad de Matemáticas, Pontificia Universidad Católica de Chile, Santiago, Chile
School Climate is an essential aspect in every school community. It relates to perceptions of the school environment experienced by various members of the educational system. Research has shown that an appropriate school climate impacts not only on the quality of life of all members in the educational system, but also on learning outcomes and education improvements. This study aims to explore a measure of School Climate on Chilean students. A sample of 176,126 10th grade students was used to investigate the factor structure of the items composing the School Climate construct, and to evaluate the potential presence of Differential Item Functioning between male and female groups. Both explanatory and confirmatory factor analysis as well as Rasch models were used to analyze the scale. Differential item functioning between male and female groups was investigated using the Langer-improved Wald test. The results indicated a multidimensional structure of the School Climate construct and that measurement bias for male and female groups exist in some of the items measuring the construct.
1 Introduction
Achievement tests developed by measurement programs have become relevant worldwide, as many decisions in educational policy are based on the information gathered using these instruments. In addition to measuring cognitive abilities (e.g., mathematics or language), these programs have incorporated measures of non-cognitive indicators such as perceptions and attitudes on academic motivation, school climate, participation and civic education, and healthy lifestyles, among others. This information is usually obtained from the answers to questionnaires administered to different participants of the educational system (i.e., teachers, students, parents). These measurements are useful not only to monitor non-academic aspects that are fundamental to students’ general education, but also because they have an impact on learning outcomes and education improvement (McEvoy and Welker, 2000; Tubbs and Garner, 2008; Maxwell et al., 2017) (Høigaard et al., 2015; Cerda et al., 2019; Wang et al., 2020).
In Chile, the Agency of Quality of Education1 (the Agency in what follows) is the governmental organization responsible for measuring cognitive and non-cognitive aspects in the educational system. Currently, together with the “Education Quality Measurement System” test (Sistema de Medición de la Calidad de Educación, SIMCE, by their initials in spanish) (Agencia de Calidad de la Educación, 2015), Chilean students, teachers and parents, express their perceptions and attitudes towards different non-academic aspects, through the Quality and Education Context (QEC) questionnaires (Agencia de Calidad de la Educación, 2017a). These questionnaires collect information on personal and social development indicators (Indicadores de Desarrollo Personal y Social, IDPS, for their initials in spanish) and are administered annually on a census application. The QEC questionnaires include dichotomous and polytomous (Likert-type) items related with four indicators: Academic Motivation, School Climate, Participation and Civic education, and Healthy lifestyles. The measured indicators have been defined by the Curriculum and Assessment Unit (Ministerio de Educación de Chile, 2014) and theoretically founded by a literature review in each of the assessed areas (Unidad de Currículum Evaluación - Ministerio de Educación, 2013). The Agency has made an effort to build a conceptual model for the constructs by incorporating multiple factors in each of the measured dimensions and establishing an evaluation frame that allows having operational definitions that contribute to the measurement process of the constructs (Agencia de Calidad de la Educación, 2017a). These multiple factors have been validated not only using appropriate literature reviews but also in internal workshops that considered the conceptual foundation of the constructs, together with the opinion of external experts in the topics. In this paper we focus our attention on the School Climate indicator.
School climate is an important aspect in every school community. Schools aim to identify features of the school environment that can be intervened to improve student outcomes. Schools initiatives seek for improving school climate as a previous step that lead to student academic and social well-being (Durlak et al., 2011). Although there is no clear consensus on a general definition of the construct, school climate is largely recognized as multidimensional, including the academic, community, safety, and institutional environment categorizations (Wang and Degol, 2016).
School climate and school coexistence have been researched from many different angles. For instance, Costa et al. (2020) describe the educational management of school coexistance at the intermediate level. The profile and role of professionals in charge of school coexistence in schools is investigated by Cortez Muñoz et al. (2018). Fierro-Evans and Carbajal-Padilla (2019) operationalize the concept of school climate in three areas of school life: pedagogical-curricular, organizational-administrative and socio-community, and elaborate on the relevance of having an instrument to evaluate school coexistence and its relationship with other variables or aspects. Wang and Degol (2016) analyzed the quality of interpersonal relationships within a school, both between teachers and authorities, and between teachers and students and presented a theoretical framework for the study of school climate that emphazise various features of the construct.
In 2011, the Chilean Law about School Violence (Ley, 2011), established the creation of school boards or committees of peaceful coexistence at educational centers as well as declares the obligation of having a person responsible for peaceful school-wide climate at every educational center. Since then, school climate has gained a protagonist role in educational practices and culture in spite of the wider variety of socioeconomic contexts and school practices and systems (Mineduc, 2011; Mineduc, 2015; Mineduc, 2019).
Research has shown that an appropriate school climate impacts not only on the quality of life of all members in the educational community, but also on learning outcomes and education improvements (see, e.g., Thapa et al., 2013; Zullig et al., 2010; Wang and Degol, 2016; Fan and Williams, 2018, among others). Moreover, evaluation of measurement invariance as a precondition for comparisons across groups becomes relevant, because male and female students’ perceptions of school characteristics may differ (Bauer, 2017). In the context of school climate, any differences in item responses should reflect only respondents’ perceptions of school climate factors, and not group membership (McGrath et al., 2020). Previous research show that school climate perception exhibits significant differences by gender and grade (Yates, 2001; Yates, 2003).
Some studies have analyzed the factor structure and measurement bias in non-cognitive tests (Prati et al., 2017; Lombardi et al., 2019; Tapia-Fonllem et al., 2020). A review of published studies until 2015 using school climate instruments that have been tested psychometrically is found in Ramelow et al. (2015). Previous research in Chile has analyzed scales adapted from other instruments and used in other countries, using only small samples of students from schools in Santiago, Chile (e.g., Cornejo and Redondo, 2001; López et al., 2014). Other related research including analyses on school-climate scales can be found in Muñoz et al. (2018) and Gálvez-Nieto et al. (2017). However, to date no studies exist that specifically look at the scale used in the Chilean national QEC questionnaires. This research aims to fill in this gap by studying the factor structure and item measurement bias in a School Climate scale of the national non-cognitive assessment carried out through the QEC questionnaires.
Internal consistency reliability was assessed using Cronbach’s α. The structure of the School Climate item set was analyzed using both exploratory factor analysis (EFA) and confirmatory factor analysis (CFA). Rasch analysis was applied to further analyse the quality of the instrument. The combined used of CFA and Rasch analyses have been successfully implemented in validation studies (Immekus et al., 2019; Yan, 2020). Item measurement bias (i.e., diferential item functioning, DIF) (Camilli, 2006) was evaluated using the Langer-improved Wald test for DIF (Langer, 2008; Wood et al., 2013).
2 Materials and Methods
2.1 Instrument
The School Climate section of the QEC questionnaire is composed of 46 items and involves multiple factors following the conceptual scheme established by the Agency (see Agencia de Calidad de la Educación, 2017a, Table 3, p. 53). These factors are described as follows: perceptions and attitudes about respectful interactions among members of the educational community, the valuation of diversity, and the absence of discrimination inside the school. Students’ perceptions regarding taking care of the school and respect for the environment. Opinions about the existence of clear and well-known rules, demanded and respected by all, and the predominance of effective conflict resolution mechanisms. Attitudes that students have regarding the norms of coexistence and their transgression. The degree of security and physical and psychological violence at school, as well as the existence of prevention mechanisms and action against it. Attitudes against bullying and the factors that affect their physical or psychological integrity. Table 1 shows the 46 items that compose the scale and the corresponding response scale format used to answer them.
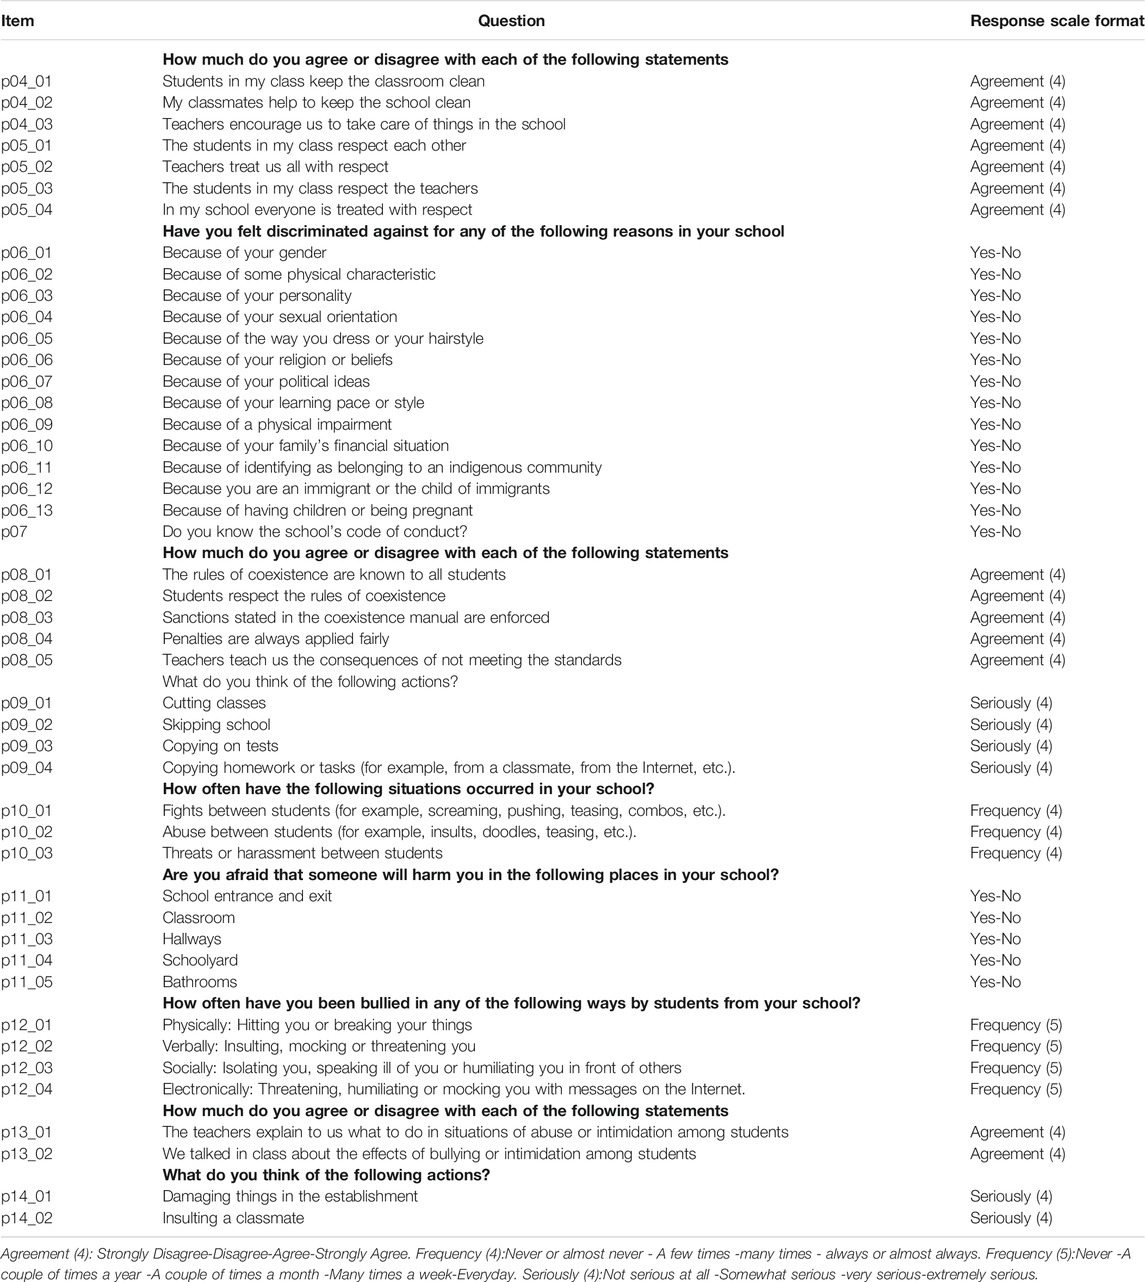
TABLE 1. Student school climate questionnaire Chile 2017.
2.2 Data
We use data collected by the Chilean Agency of Quality of Education through the administration of the QEC questionnaires to students in 2017 (Agencia de Calidad de la Educación, 2017b). For the analyses that follow, we use the responses of students on the School Climate indicator.
A total of
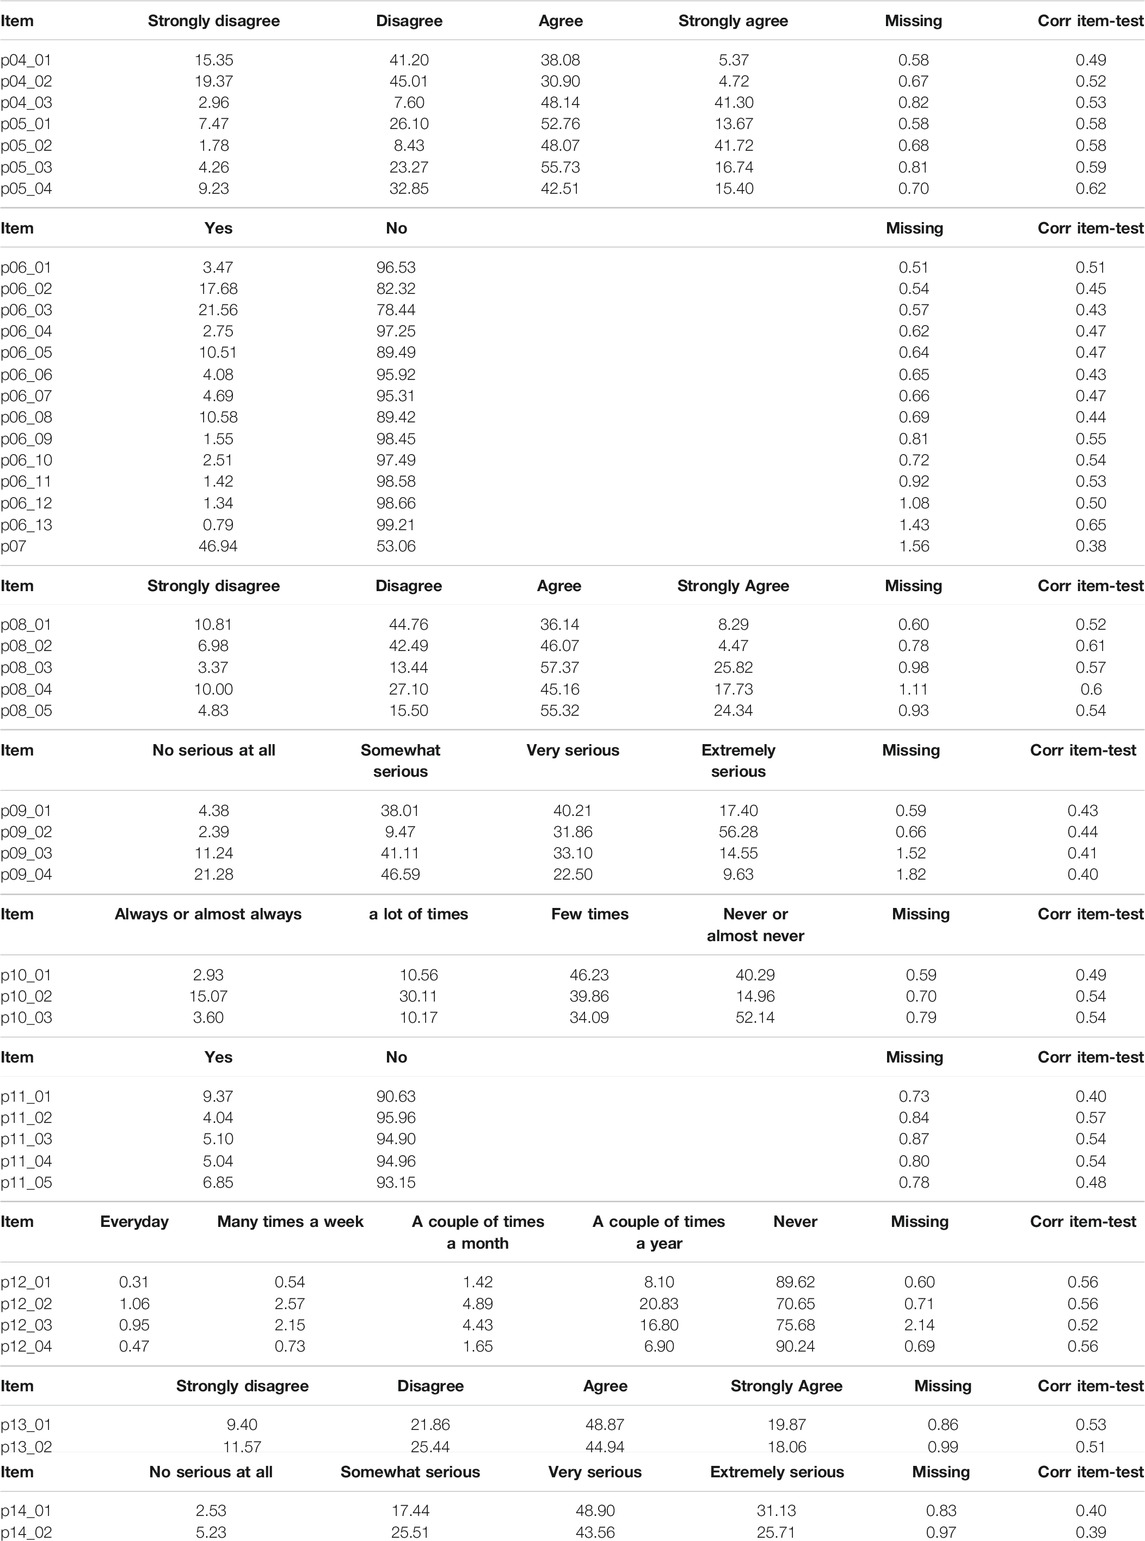
TABLE 2. Distribution of answers in each item category (in percentages).
2.3 Statistical Analysis
The adequacy of items measuring the school climate construct was first evaluated using item-test correlations. Internal consistency reliability was assessed using Cronbach’s α (Cronbach, 1951).
EFA was performed using the correlation matrix of the 46 school climate items. Preliminary analyses to assess the suitability of the data for factor analysis included the Kaiser–Meyer–Olkin measure (Kaiser, 1974a) and Bartlett’s test of sphericity (Bartlett, 1951).
The decision on the number of factors to retain was make using a scree-plot (Cattell, 1966), in which the eigenvalues are plotted against their rank, and the number of factors to retain is indicated by the elbow of the curve (Joreskog, 2007).
CFA with maximum likelihood (ML) estimation was performed to test the structural validity under two scenarios: 1) a model was fitted to assess the structure found in the EFA analysis; and 2) a second model was fitted to test whether the multiple factors defined by the Agency followed a three-factor model with three main dimensions: Respectful environment, Organized environment, and Safe environment.
The evaluation of model-data fit was analysed using the comparative fit index (CFI; Bentler, 1990), Tucker-Lewis index (TLI; Bentler and Bonett, 1980; Tucker and Lewis, 1973), and the root mean square error of approximation (RMSEA; Steiger, 1990; Steiger and Lind, 1980). RMSEA is an absolute fit index in that it assesses how far a hypothesized model is from a perfect model. On the contrary, CFI and TLI are incremental fit indices that compare the fit of a hypothesized model with that of a baseline model (i.e., a model with the worst fit) (Yan and Yanyun, 2018).
Rasch analyses (Wright and Masters, 1982) were conducted to further analyze the quality of the scale. Different models were evaluated in terms of global measures of fit (e.g., AIC, BIC, log-likelihood); item fits statistics (Infit and Outfit MNSQ); and reliability (i.e., EAP reliabilities).
In order to examine DIF between male and female groups, we used the Langer-improved Wald test (Langer, 2008; Cai et al., 2011; Cai, 2012). The Langer-improved Wald test statistic is implemented in IRTPro (Cai et al., 2011) and flexMIRT (Cai, L., 2017) software.
Reliability, item correlation, exploratory factor analyses and Rasch analyses were performed using R (R Core Team, 2020), CFA was implemented using Mplus version 8.4 (Muthén and Muthén, 2007), and DIF analyses were carried out using the flexMIRT software (Cai, L., 2017).
3 Results
3.1 Item-Test Correlation and Reliability
Olsson et al. (1982) considered values of polyserial correlation as low (
Following Nunnally and Bernstein (1994), Cronbach’s alpha coefficients
3.2 Exploratory Factor Analysis
The Bartlett’s test of sphericity was significant (
The correlation matrix was computed using the mixedCor function (Revelle, 2020) in R. This function allows the combination of continuous, polytomous and dichotmous variables providing the appropriate correlation in each case (i.e., polychorics for the polytomous items, tetrachorics for the dichotomous items, and the polyserial or biserial correlations for the various mixed variables).
EFA with oblique rotation (CF-quartimax) was applied to reduce the large dimensionality in this data set. Figure 1 shows the scree plot which suggests a nine-factor structure. The nine-factor solution explained 52.2% of the common variance. The percentage of explained variance by each factor is shown in Table 3.
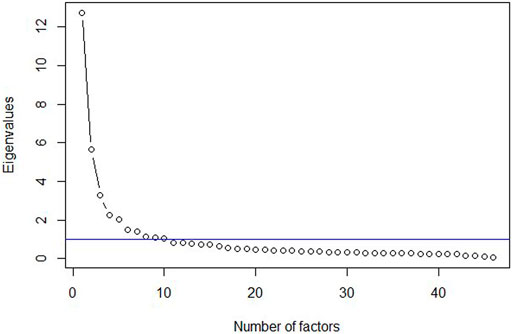
FIGURE 1. Scree plot for the students QEC questionnaire.
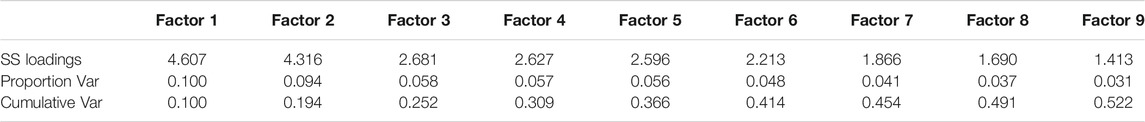
TABLE 3. Results for EFA with nine factors.
While some might argue that less than sixty percent of explained variance is not acceptable (Hair et al., 2013, p. 107), and that nine factors add complexity to the practical interpretation, we have combined both empirical and theoretical foundations to report the results of EFA as a model to be tested for validity, not only focusing on the percentage of explained variance and number of factors, but rather attempting to offer a practical explanation and interpretation taking into account the conceptual multi-factor scheme adopted by the Agency for the definition of the school climate construct. As a matter of fact, the nine factors can be named and interpreted as follows (see also Table 3):
F1 Tolerance of diversity produced an eigenvalue of 12.766 and explained 10.0% of the common variance. F2 Perception to be afraid inside school produced an eigenvalue of 5.640 and explained 9.4% of the common variance. F3 Attitude towards cheating produced an eigenvalue of 3.269 and explained 5.8% of the common variance. F4 Respect for others and for school facilities produced an eigenvalue of 2.235 and explained 5.7% of the common variance. F5 Experience with bullying produced an eigenvalue of 2.032 and explained 5.6% of the common variance. F6 Respect for the student code of conduct produced an eigenvalue of 1.504 and explained 4.8% of the common variance. F7 Experience with violence produced an eigenvalue of 1.397 and explained 4.1% of the common variance. F8 Teacher support in dealing with bullying produced an eigenvalue of 1.146 and explained 3.7% of the common variance. And finally, F9 Experience with discrimination produced an eigenvalue of 1.098 and explained 3.1% of the common variance.
Summarizing, the results lead to conclude that the School Climate scale appears to be multidimensional. In fact, these results are somewhat expected in that for constructs measured based on a theory that incorporates multiple factors in each of the measured dimensions, a multidimensional structure can be anticipated. The structural validity of the 9-factor model is tested using CFA in the next section.
3.3 Confirmatory Factor Analysis
Two different models were evaluated. Model 1 (see Figure 2) is guided by the results of the EFA and considered the nine factor solution described in the previous section. The second model, Model 2 (see Figure 3), represents the hypothesized structure of three main dimensions of the School Climate construct: respectful environment, organized environment and, safe environment. RMSEA values less than 0.05 are considered good, between 0.05 and 0.08 are considered adequate, and between 0.08 and 0.10 are considered mediocre (Schermelleh-Engel et al., 2003). Values of CFI larger than 0.95 and TLI more than 0.95 indicate a good fit. An acceptable fit is indicated by a CFI value larger than 0.90 and a TLI large than 0.90 (McDonald and Ho, 2002). Table 4 shows the RMSEA, CFI and TLI index. It can be seen that Model 1 not only fitted better than Model 2, but also its model-data fit is satisfactory according to the fit indexes (Hu and Bentler, 1999). Table 5 shows the correlations among person latent trait estimates on the nine factors. As expected, (F1) Tolerance of diversity, (F5) Experience with bullying and, (F9) Experience with discrimination were significantly associated. All the items composing these factors are related to questions about tolerance and discrimination. Factors composed of items regarding respect were also highly correlated, i.e., (F4) Respect for others and for school facilities, (F6) respect for the student code of conduct, and (F7) Experience with violence. On the other hand, (F2) Perception to be afraid inside school and (F3) Attitude towards cheating had a negative but very low association, which means that both factors are dissociated.
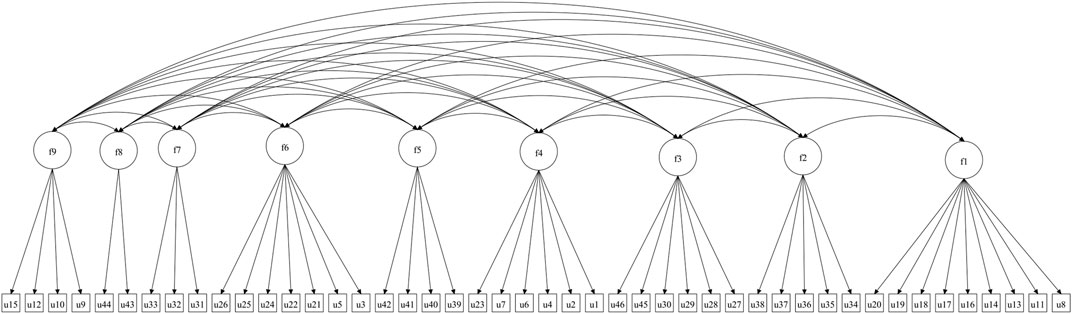
FIGURE 2. Model 1 CFA structure.
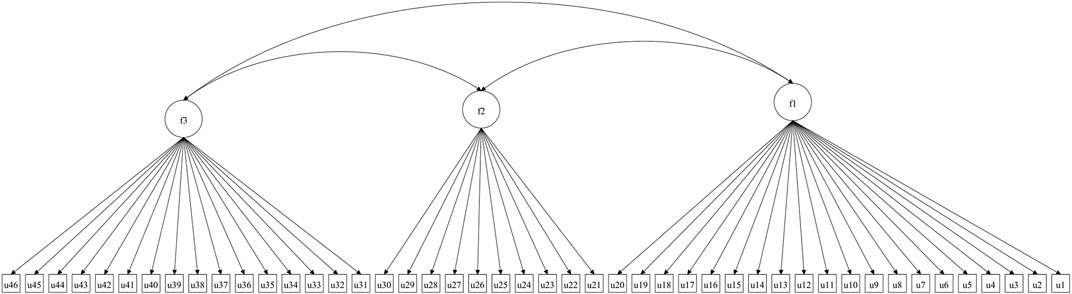
FIGURE 3. Model 2 CFA structure.
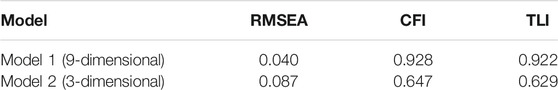
TABLE 4. Fit indices for CFA analyses.
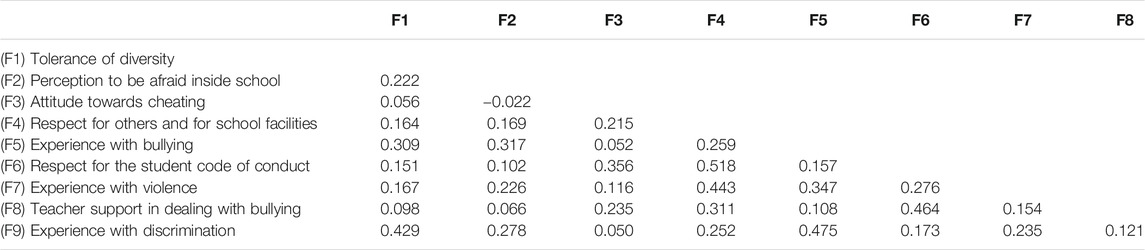
TABLE 5. Correlation between the nine latent traits.
3.4 Rasch Analysis
In line with the strategy adopted for the CFA analyses, two multidimensional Rasch models were fitted and compared. An unidimensional model was also fitted as a reference for comparisons. Table 6 shows log-likelihood (larger values are preferable), AIC and BIC (smaller values are preferable) fit statistics indicating that the 9-dimensional model has the best fit, followed by the 3-dimensional and the unidimensional model.
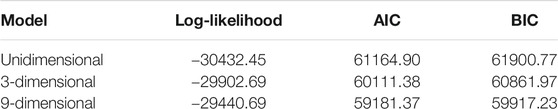
TABLE 6. Goodness of fit indices for three different Rasch models.
According to Linacre (2002) items showing infit and outfit values

TABLE 7. Infit and outfit statistics for the 9-dimensional Rasch model.
The EAP reliabilities for each of the 9 factors (F1-F9) were 0.25, 0.43, 0.79, 0.80, 0.60, 0.80, 0.71, 0.79, and 0.42, respectively. The low values for F1, F2 and F9 are in line with the fact that items composing this factors shown poor fit statistics.
3.5 Differential Item Functioning
As a way to combine both EFA and DIF analyses, given that we are interested in assessing possible differences between male’s and female’s perception on school climate, we studied the factor structure for both groups separately. Table 8 shows the highest factor loading for each item. In this table, the blue dots represent the highest factor loading for each item for the male group whereas the red dots represent the highest factor loading for each item for the female group. In general, it can be seen that the factor structure is the same for both groups, except for items regarding discrimination and tolerance of diversity (F9 and F1). Given that these items have a different factor structure for males and females it is of interest to explore if both groups have the same understanding about these questions. This goal is achieved by evaluating DIF.
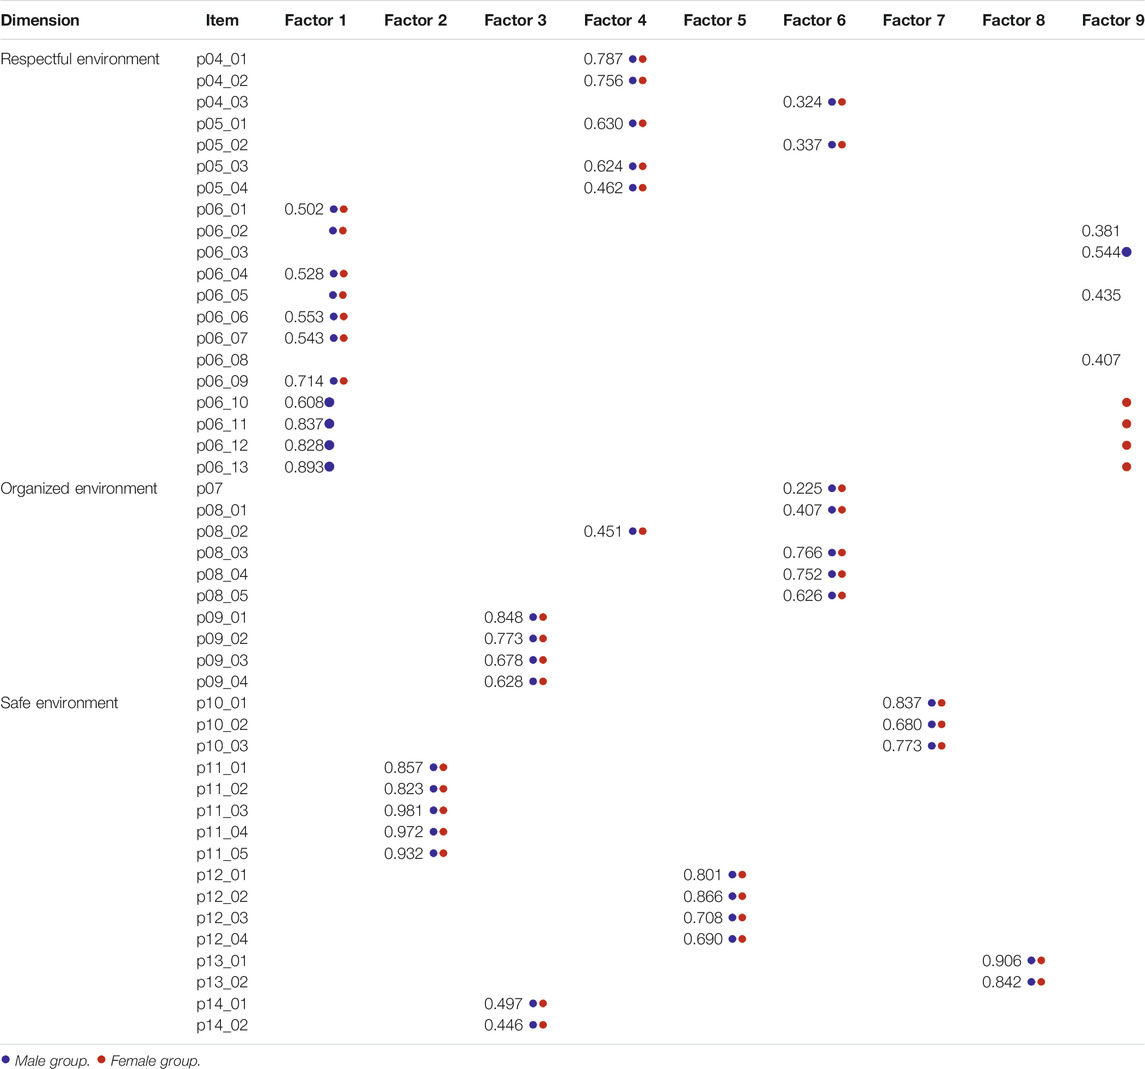
TABLE 8. Factor loadings for EFA on the students QEC questionnaire.
A DIF analysis on the items
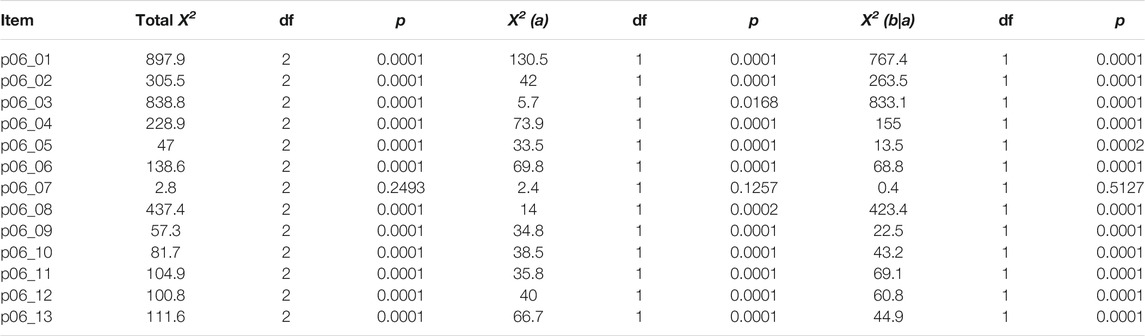
TABLE 9. The Langer-improved Wald test
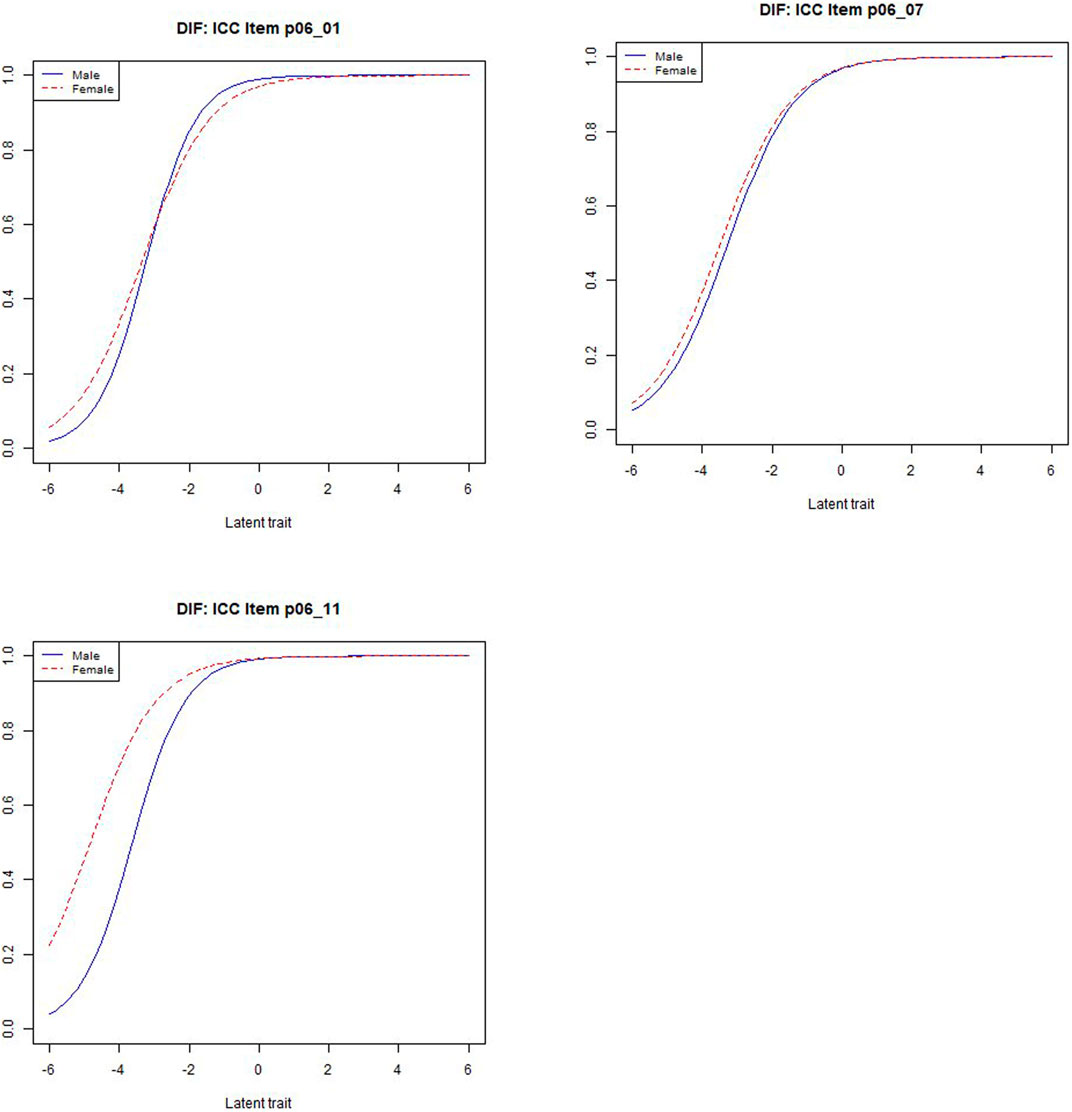
FIGURE 4. ICCs by gender for three items of the students QEC questionnaire.
4 Discussion
We have analysed the factor structure and item measurement bias (DIF) in a Chilean School Climate scale which is part of a large study including other non-cognitive indicators. We adopted an strategy that combined both empirical and theoretical evidence to select the number of factors composing the scale.
Although the found scale can appear to be highly multidimensional, our findings are not only aligned with the literature in that School Climate is widely recognized as a multidimensional factor (Wang and Degol, 2016; Grazia and Molinari, 2020), but also the derived results were shown to be useful to provide clear interpretations of each dimension which is in line with the multi-factor conceptual scheme adopted by the Agency to define the IDPS and to plan its use. Each of the found dimensions have an impact on the school climate in terms of what, how, what for and with whom the students learn to coexist and interact. Although the school climate construct can be conceptualized as composed of three main dimensions, its impact transcends other dimensions as the ones found in this study. Moreover, our findings show that the three dimensions, Respectful environment, Organized environment, and Safe environment, can not be treated separately but rather they are interrelated through the items composing the corresponding factors (i.e., items in a particular dimension are more related to items from another dimension than their own dimension; see Tables 5 and 8). This fact can be seen as a signal to re-organize these three dimensions, recognizing that more than three are needed to measure the school climate construct. In adition, the final CFA model fitted very well, confirming the multi-factor theoretical structure defined by the conceptual model.
It should be noted that other studies assessing the factorial structure of school climate scales have found highly multidimensional structures. For instance, based on students’ perception, Muñoz et al. (2018) confirmed that coexistence in school is a multidimensional phenomenon that is best explained by a group of eight interrelated dimensions. Zullig et al. (2010) reported factor analysis results confirming an eight-factor solution for a student-reported school climate instrument. Brand et al. (2003) produced a 50-item instrument that assessed 10 distinct dimensions of school climate, consisting of Disciplinary Harshness, Negative Peer Interactions, Positive Peer Interactions, Structure and Clarity of Rules and Expectations, Student Commit-ment to Achievement, Teacher Support, Instructional Innovation, Student Participation in Decision Making, Support for Cultural Pluralism, and Safety Problems. Moreover, these authors reported that the results of CFA across two different years of samples and students suggested that the 10-dimensional structure was robust.
The Rasch analyses complemented the CFA results and supported the multidimensional nature of the scale. However, the results of the item fit analyses showed that not all the items would be measuring each sub-dimension satisfactorily. Interestingly, the items showing misfit are those related to questions about discrimination. These items presented a highly disproportionate number of answers in one category (see Table 2) leading to low variability, which could be the reason of poor item fit. Because subscales may be affected by the way questions about discrimination are formulated, our findings are useful to recommend alternatives. For instance, a revised version of the QEC questionnaires could consider different response scales for these items. Collapsing the number of items in order to gain variability and obtain the needed information is another possibility.
Regarding item measurement bias, the analyses indicated the presence of DIF among male and female students in items related to the Discrimination and Tolerance of diversity dimensions. These results are in concordance with those derived from the EFA analyses performed separately for male and females. They are also aligned with previous research that have shown significant differences by gender and grade on school climate perception (Yates, 2001; Yates, 2003).
In this study we have only used the information gathered from students. This choice was mainly motivated by the fact that all the other indicators measured by the QEC questionnaire are also measured on students and, future studies are planned to include these indicators. Moreover, because the School Climate indicator is measured on the three actors (students, teachers and parents), we also plan to extend our analysis to analyze whether the factorial structure found for the School Climate indicator is invariant across actors.
Author Contributions
FC contributed to the conception, design, and analysis of data and drafted and revised the manuscript; JG contributed to critically revising the manuscript. FC and JG wrote sections of the paper. All authors contributed to manuscript revision, read and approved the submitted version.
Funding
The FC acknowledges the support by ANID (Agencia Nacional de Investigación y Desarrollo) Chile. Doctorado Nacional Fellowship 2017 - 21171096. The JG acknowledges support of Fondecyt grant 1201129. This research used the databases of the Agency of Quality of Education (ACE) as a source of information. The author thanks the ACE for access to the information. All the results of the study are the responsibility of the author and do not commit the ACE in any way.
Conflict of Interest
The authors declare that the research was conducted in the absence of any commercial or financial relationships that could be construed as a potential conflict of interest.
Footnotes
References
Agencia de Calidad de la Educación, (2017a). Informe técnico 2017. indicadores de desarrollo personal y social (idps) medidos a través de cuestionarios. Avilable at: http://archivos.agenciaeducacion.cl/Informe_tecnico_IDPS_2017.pdf. (accessed July 3, 2020).
Agencia de Calidad de la Educación, (2017b). Base de datos de la Agencia de Calidad de la Educación 2017. Santiago, Chile.
Agencia de Calidad de la Educación, (2015). Informe Técnico Simce 2015. Avilable at: http://archivos.agenciaeducacion.cl/Informe_Tecnico_SIMCE_2015_Final.pdf. (accessed July 3, 2020).
Bartlett, M. S. (1951). THE EFFECT OF STANDARDIZATION ON A χ2 APPROXIMATION IN FACTOR ANALYSIS. Biometrika 38, 337–344. doi:10.1093/biomet/38.3-4.337
Bauer, D. J. (2017). A More General Model for Testing Measurement Invariance and Differential Item Functioning. Psychol. Methods 22, 507–526. doi:10.1037/met0000077
Bentler, P. M. (1990). Comparative Fit Indexes in Structural Models. Psychol. Bull. 107, 238–246. doi:10.1037/0033-2909.107.2.238
Bentler, P. M., and Bonett, D. G. (1980). Significance Tests and Goodness of Fit in the Analysis of Covariance Structures. Psychol. Bull. 88, 588–606. doi:10.1037/0033-2909.88.3.588
Brand, S., Felner, R., Shim, M., Seitsinger, A., and Dumas, T. (2003). Middle School Improvement and Reform: Development and Validation of a School-Level Assessment of Climate, Cultural Pluralism, and School Safety. J. Educ. Psychol. 95, 570–588. doi:10.1037/0022-0663.95.3.570
Cai, L. (2012). Flexmirt: Flexible Multilevel Item Factor Analysis and Test Scoring [computer Software]. Seattle, WA: Vector Psychometric Group, LLC.
Cai, L. (2017). flexMIRT©Version 3.51: Flexible Multilevel Multidimensional Item Analysis and Test Scoring [Computer Software]. NC: Champel HillVector Pshychometric Group.
Cai, L., Thissen, D., and du Toit, S. H. C. (2011). Irtpro: Flexible, Multidimensional, Multiple Categorical Irt Modeling [computer Software]. Lincolnwood, IL: Scientific Software International.
Camilli, G. (2006). “Test Fairness,”. Educational Measurement. Editor R. Brennan (Westport, CT: American Council on Education), 4, 220–256.
Cattell, R. B. (1966). The Scree Test for the Number of Factors. Multivariate Behav. Res. 1, 245–276. doi:10.1207/s15327906mbr0102_10
Cerda, G., Pérez, C., Elipe, P., Casas, J. A., and Del Rey, R. (2019). School Coexistence and its Relationship with Academic Performance Among Primary Education Students. Revista de Psicodidáctica (English ed.) 24, 46–52. doi:10.1016/j.psicoe.2018.06.001
Cornejo, R., and Redondo, J. M. (2001). El clima escolar percibido por los alumnos de enseñanza media: Una investigación en algunos liceos de la Región Metropolitana. Ultima década 9, 11–52. doi:10.4067/s0718-22362001000200002
Cortez Muñoz, M., Zoro Sutton, B., and Aravena Castillo, F. (2019). Gestionando la contingencia más que la convivencia: El rol de los encargados de convivencia escolar en chile. Psicoperspectivas 18, 18–32.
Cortina, J. M. (1993). What Is Coefficient Alpha? an Examination of Theory and Applications. J. Appl. Psychol. 78, 98–104. doi:10.1037/0021-9010.78.1.98
Costa, P. A., Mancilla, K. C., Apellidos, F., and Figueroa, Á. (2020). Gestión de la convivencia escolar a nivel intermedio: Diseño y validación de una escala. Revista Evaluar 20, 1–19.
Cronbach, L. J. (1951). Coefficient Alpha and the Internal Structure of Tests. psychometrika 16, 297–334. doi:10.1007/bf02310555
Durlak, J. A., Weissberg, R. P., Dymnicki, A. B., Taylor, R. D., and Schellinger, K. B. (2011). The Impact of Enhancing Students' Social and Emotional Learning: a Meta-Analysis of School-Based Universal Interventions. Child. Dev. 82, 405–432. doi:10.1111/j.1467-8624.2010.01564.x
Fan, W., and Williams, C. (2018). The Mediating Role of Student Motivation in the Linking of Perceived School Climate and Achievement in reading and Mathematics. Front. Educ. 3, 50. doi:10.3389/feduc.2018.00050
Fierro-Evans, C., and Carbajal-Padilla, P. (2019). Convivencia escolar: Una revisión del concepto. Psicoperspectivas 18, 9–27.
Gálvez-Nieto, J. L., Salvo, S., Pérez-Luco, R., Hederich, C., and Trizano-Hermosilla, Í. (2017). Invarianza factorial del Cuestionario para Evaluar Clima Social del Centro Escolar en estudiantes chilenos y colombianos. Revista Latinoamericana de Psicología 49, 119–127. doi:10.1016/j.rlp.2016.09.003
Grazia, V., and Molinari, L. (2020). School Climate Multidimensionality and Measurement: a Systematic Literature Review. Res. Pap. Education, 1–27. doi:10.1080/02671522.2019.1697735
Hair, J. F., Black, W. C., Babin, B. J., and Anderson, R. E. (2013). Multivariate Data Analysis. (Pearson Education Limited).
Høigaard, R., Kovač, V. B., Øverby, N. C., and Haugen, T. (2015). Academic Self-Efficacy Mediates the Effects of School Psychological Climate on Academic Achievement. Sch. Psychol. Q. 30, 64.
Hu, L. t., and Bentler, P. M. (1999). Cutoff Criteria for Fit Indexes in Covariance Structure Analysis: Conventional Criteria versus New Alternatives. Struct. Equation Model. A Multidisciplinary J. 6, 1–55. doi:10.1080/10705519909540118
Immekus, J. C., Snyder, K. E., and Ralston, P. A. (2019). Multidimensional Item Response Theory for Factor Structure Assessment in Educational Psychology Research. Front. Educ. 4, 45. doi:10.3389/feduc.2019.00045
Joreskog, K. G. (2007). “Factor Analysis and its Extensions,” in Factor Analysis at 100: Historical Developments and Future Directions. Editors R. Cudeck, and R. C. MacCallum (Lawrence Erlbaum Associates Publishers), 47–77.
Kaiser, H. F. (1974a). An index of Factorial Simplicity. Psychometrika 39, 31–36. doi:10.1007/BF02291575
Kaiser, H. F. (1974b). An index of Factorial Simplicity. Psychometrika 39, 31–36. doi:10.1007/bf02291575
Kline, T. (2005). “Classical Test Theory: Assumptions, Equations, Limitations, and Item Analyses,” in Psychological Testing: A Practical Approach to Design and Evaluation (Thousand Oaks, California: SAGE Publications, Inc.), 91–106.
Langer, M. (2008). A Reexamination of Lord’s Wald Test for Differential Item Functioning Using Item Response Theory and Modern Error Estimation. University of North Carolina, Chapel Hill. doi:10.17615/chn0-dz45 (Unpublished doctoral dissertation).
Linacre, J. (2002). What Do Infit and Outfit, Mean-Square and Standardized Mean? Rasch Meas. Trans. 16, 878.
Lombardi, E., Traficante, D., Bettoni, R., Offredi, I., Giorgetti, M., and Vernice, M. (2019). The Impact of School Climate on Well-Being Experience and School Engagement: A Study with High-School Students. Front. Psychol. 10, 2482. doi:10.3389/fpsyg.2019.02482
López, V., Bilbao, M., Ascorra, P., Moya Diez, I., and Morales, M. (2014). School Climate Scale: Spanish Adaptation and Validation in Chilean Students. Universitas Psychologica 13, 1111–1122. doi:10.11144/javeriana.upsy13-3.ecea
Maxwell, S., Reynolds, K. J., Lee, E., Subasic, E., and Bromhead, D. (2017). The Impact of School Climate and School Identification on Academic Achievement: Multilevel Modeling with Student and Teacher Data. Front. Psychol. 8, 2069. doi:10.3389/fpsyg.2017.02069
McDonald, R. P., and Ho, M. H. (2002). Principles and Practice in Reporting Structural Equation Analyses. Psychol. Methods 7, 64–82. doi:10.1037/1082-989x.7.1.64
McEvoy, A., and Welker, R. (2000). Antisocial Behavior, Academic Failure, and School Climate. J. Emotional Behav. Disord. 8, 130–140. doi:10.1177/106342660000800301
McGrath, K. V., Leighton, E. A., Ene, M., DiStefano, C., and Monrad, D. M. (2020). Using Integrative Data Analysis to Investigate School Climate across Multiple Informants. Educ. Psychol. Meas. 80, 617–637. doi:10.1177/0013164419885999
Ministerio de Educación de Chile (2014). Otros indicadores de calidad educativa. Avilable at: https://bibliotecadigital.mineduc.cl/bitstream/handle/20.500.12365/10447/OIC.pdf?sequence=1&isAllowed=y. (accessedFebruary 24, 2021).
Muñoz, P. E., Casas, J. A., Del Rey, R., Ortega-Ruiz, R., Cerda, G., and Pérez, C. (2018). Validation and Cross-Cultural Robustness of the School-wide Climate Scale (Scs) across Spanish and Chilean Students. Stud. Educ. Eval. 56, 182–188. doi:10.1016/j.stueduc.2018.01.002
Muthén, L. K., and Muthén, B. O. (2007). Mplus User’s Guide. 7th Edn. Los Angeles, CA: Muthén & Muthén, Vol. 7.
Olsson, U., Drasgow, F., and Dorans, N. J. (1982). The Polyserial Correlation Coefficient. Psychometrika 47, 337–347. doi:10.1007/BF02294164
Prati, G., Cicognani, E., and Albanesi, C. (2017). Psychometric Properties of a Multidimensional Scale of Sense of Community in the School. Front. Psychol. 8, 1466. doi:10.3389/fpsyg.2017.01466
R Core Team (2020). R: A Language and Environment for Statistical Computing. Vienna, Austria: R Foundation for Statistical Computing.
Ramelow, D., Currie, D., and Felder-Puig, R. (2015). The Assessment of School Climate. J. Psychoeducational Assess. 33, 731–743. doi:10.1177/0734282915584852
Revelle, W. (2020). Psych: Procedures for Psychological, Psychometric, and Personality Rearch. Evanston, Illinois: Northwestern University R package version 2.0.12.
Schermelleh-Engel, K., Moosbrugger, H., and Müller, H. (2003). Evaluating the Fit of Structural Equation Models: Tests of Significance and Descriptive Goodness-Of-Fit Measures. Methods Psychol. Res. Online 8, 23–74.
Steiger, J. H. (1990). Structural Model Evaluation and Modification: An Interval Estimation Approach. Multivariate Behav. Res. 25, 173–180. doi:10.1207/s15327906mbr2502_4
Steiger, J., and Lind, J. (1980). Statistically Based Tests for the Number of Common Factors. Annual meeting of the Psychometric Society, Iowa City, IA,
Tapia-Fonllem, C., Fraijo-Sing, B., Corral-Verdugo, V., Garza-Terán, G., and Moreno-Barahona, M. (2020). School Environments and Elementary School Children's Well-Being in Northwestern Mexico. Front. Psychol. 11, 510. doi:10.3389/fpsyg.2020.00510
Thapa, A., Cohen, J., Guffey, S., and Higgins-D’Alessandro, A. (2013). A Review of School Climate Research. Rev. Educ. Res. 83, 357–385. doi:10.3102/0034654313483907
Tubbs, J. E., and Garner, M. (2008). The Impact of School Climate on School Outcomes. J. Coll. Teach. Learn. 5, 17. doi:10.19030/tlc.v5i9.1230
Tucker, L. R., and Lewis, C. (1973). A Reliability Coefficient for Maximum Likelihood Factor Analysis. Psychometrika 38, 1–10. doi:10.1007/bf02291170
Unidad de CurrículumEvaluación - Ministerio de Educación y. (2013). Fundamentos otros indicadores de calidad educativa. Avilable at: https://s3.amazonaws.com/archivos.agenciaeducacion.cl/documentos-web/Ordenacion/Fundamentos_OIC.pdf. (accessed February 24, 2021).
Wang, M.-T., and Degol, J. L. (2016). School Climate: A Review of the Construct, Measurement, and Impact on Student Outcomes. Educ. Psychol. Rev. 28, 315–352. doi:10.1007/s10648-015-9319-1
Wang, M.-T., L. Degol, J., Amemiya, J., Parr, A., and Guo, J. (2020). Classroom Climate and Children's Academic and Psychological Wellbeing: A Systematic Review and Meta-Analysis. Developmental Rev. 57, 100912. doi:10.1016/j.dr.2020.100912
Woods, C. M., Cai, L., and Wang, M. (2013). The Langer-Improved Wald Test for DIF Testing with Multiple Groups. Educ. Psychol. Meas. 73, 532–547. doi:10.1177/0013164412464875
Xia, Y., and Yang, Y. (2018). Rmsea, Cfi, and Tli in Structural Equation Modeling with Ordered Categorical Data: The story They Tell Depends on the Estimation Methods. Behav. Res. 51, 409–428. doi:10.3758/s13428-018-1055-2
Yan, Z. (2020). Developing a Short Form of the Self-Assessment Practices Scale: Psychometric Evidence. Front. Educ. 4, 153. doi:10.3389/feduc.2019.00153
Yates, S. M. (2003). Gender Differences in Perceptions of School Climate: A Longtitudinal Study of School Reform. Paper presented at Educational Research, Risks & Dilemma.
Yates, S. M. (2001). Students’ Achievement and Perceptions of School Climate during the Transition from Single Sex Education to Co-education. Int. Education J. 2, 317–328.
Keywords: differential item functioning, school climate, gender DIF, IDPS Chilean data, factor analysis
Citation: Calderón F and González J (2021) Analyses of the Factor Structure and Item Measurement Bias of a School Climate Scale in Chilean Students. Front. Educ. 6:659398. doi: 10.3389/feduc.2021.659398
Received: 27 January 2021; Accepted: 05 July 2021;
Published: 20 July 2021.
Edited by:
Zi Yan, The Education University of Hong Kong, ChinaReviewed by:
Vanessa Scherman, University of South Africa, South AfricaRossana Gomez-Campos, Catholic University of the Maule, Chile
Copyright © 2021 Calderón and González. This is an open-access article distributed under the terms of the Creative Commons Attribution License (CC BY). The use, distribution or reproduction in other forums is permitted, provided the original author(s) and the copyright owner(s) are credited and that the original publication in this journal is cited, in accordance with accepted academic practice. No use, distribution or reproduction is permitted which does not comply with these terms.
*Correspondence: Francisca Calderón, ZmxjYWxkZXJvbkBtYXQudWMuY2w=