 Jennifer Yu1*
 Xin Wei1
 Tracey E. Hall2
 Agatha Oehlkers2
 Kate Ferguson1
 Kristin H. Robinson2
 Jose Blackorby3
- 1Center for Learning and Development, SRI Education, Menlo Park, CA, United States
- 2Research and Development, CAST, Wakefield, MA, United States
- 3Learner Variability and Impact, WestEd, San Francisco, CA, United States
This cluster randomized control trial examines the effects of the Science Notebook in a Universal Design for Learning Environment (SNUDLE) on elementary school student science academic achievement and motivation outcomes. Multilevel analyses examined the impact of SNUDLE for all students and important student subgroups. Overall, students who received the SNUDLE intervention had similar motivation and academic achievement in science to their peers who did not receive the SNUDLE intervention. However, relative to students with disabilities in the comparison group, students with disabilities who used SNUDLE scored significantly higher on motivation in science and science academic achievement, with effect sizes (ES) ranging from 0.82 to 1.01. Furthermore, SNUDLE appeared to have a small but statistically significant positive impact on science academic performance among students whose home language is other than English or Spanish with an ES of 0.35. Fidelity of implementation analysis shows sufficient teacher training but fidelity of teacher and student usage of SNUDLE needs to be improved. The qualitative analysis of teacher interviews suggests that teachers perceived benefits of SNUDLE in support language acquisition and science writing skills. Both quantitative and qualitative findings suggest that SNUDLE holds promise for improving academic performance in science and confidence and motivation among some of the most vulnerable student populations.
Introduction
Research on effective science learning shows that conducting experiments and recording data take up most of the allocated time in today’s elementary school science classrooms (Fairbanks, 2013). After an experiment, the teacher may share with the class a quick explanation of the connection with a bigger science concept, or may move on to the next subject. Yet this research also points to the critical importance of building sense-making skills and connections with real-life experiences to improving science comprehension and motivation (National Research Council(NRC), 2011). Likewise, national science standards make building sense-making skills and connections an imperative (Next Generation Science Standards (NGSS), 2018). Participation in these scientific practices builds the habits of mind that drive deeper understanding and motivation toward science learning.
Over the last 10 years in the United States there has been a renewed effort to establish national science standards for teaching and learning (National Research Council, 2012). Amid calls for students to develop an understanding of science beyond rote memorization of facts and procedures, practice-based inquiry approaches have gained popularity in both the classroom and research realms. The Next Generation Science Standards (NGSS) call for a three-dimensional approach to science instruction, around the pillars of 1) science practices, 2) disciplinary core ideas, and 3) crosscutting concepts (Next Generation Science Standards (NGSS), 2018). Beyond the NGSS standards, a long line of experimental evidence in the learning sciences has shown the importance of explanation in developing well-integrated and transferable knowledge in science (ex., Chi et al., 1989; Chi and Wylie, 2014; McNamara, 2017). Yet few teachers are supported to engage their students in authentic sense-making and inquiry (Wee et al., 2007) and thus fall short of realizing the vision of students thinking and acting like scientists.
There are a variety of possible reasons why students spend little classroom time engaging in sense-making. Low teacher confidence and knowledge in science content and pedagogy are significant obstacles (Crawford and Capps, 2016). In addition, science notebooks, a key student tool in scientific inquiry, exhibit construct-irrelevant barriers that make the inquiry and sense-making process less accessible for many students. These barriers hinder students’ ability to clearly express understanding of science events and concepts. Writing skills such as spelling, fluency, recording or transcribing of data, and composing text may interfere with expression (Graham and Hebert, 2010). Additionally, there is little experimental research addressing these barriers.
SNUDLE Overview
The Science Notebook in a Universal Design for Learning Environment (SNUDLE) is a digital science notebook created to help students, particularly those with identified learning disabilities, as well as those who are at risk, struggling, and unmotivated, better realize the benefits of science notebooks used in the scientific inquiry process (Figure 1 and Figure 2). Universal Design for Learning (UDL) was chosen as the SNUDLE design framework to minimize construct-irrelevant barriers to learning and provide just-in-time supports for active science learning and effective science notebook use (Rose and Meyer, 2002; Meyer et al., 2014). The research literature indicates that science notebooks can be used to support active science learning and the development of scientific literacy (Hargrove and Nesbit, 2003; Klentschy, 2005). However, teachers typically use science notebooks primarily in a mechanical way—to record data, procedures, or definitions—and rarely to support the development of deep understanding through the active science learning process (Baxter, et al., 2001; Ruiz-Primo et al., 2004). Given these challenges, SNUDLE was designed to help teachers use evidence-based tools and strategies to provide all students with access to the general science curriculum and meet the high academic standards set forth in the Next Generation Science Standards (Thurlow and Wiley, 2004).
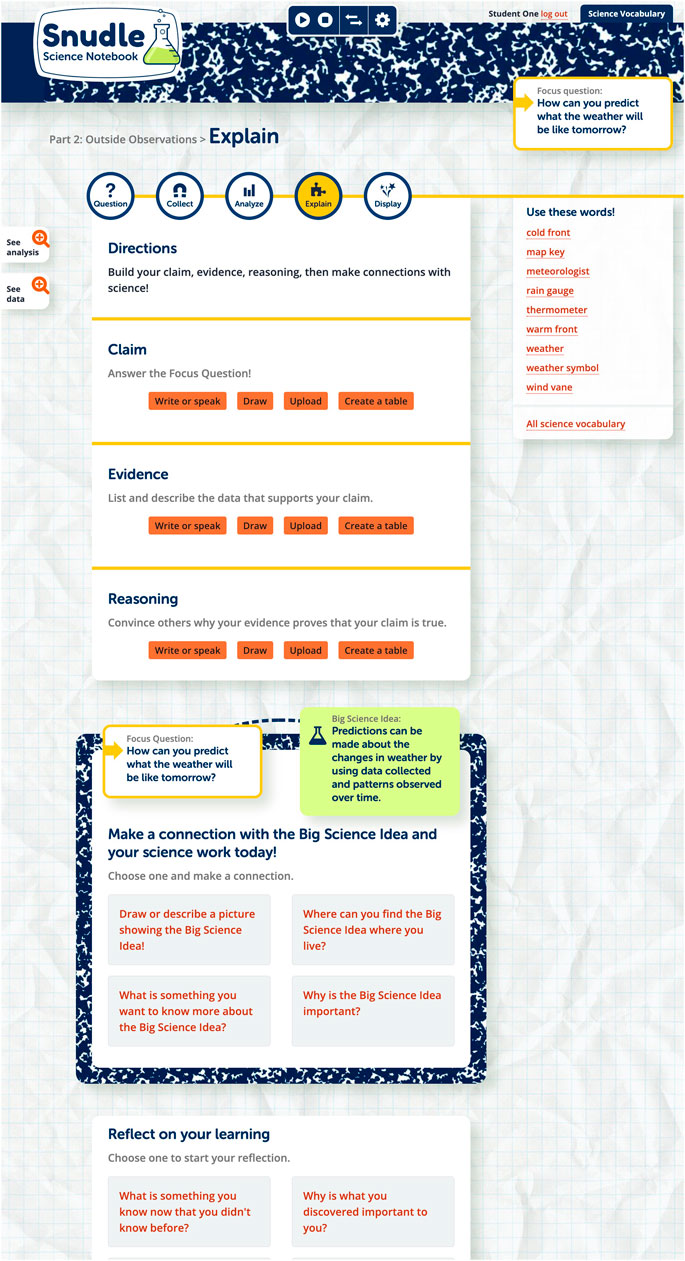
FIGURE 1. Screenshot of the “Explain” page in SNDULE in which students summarize their analysis of the data and provide their evidence and reasoning as to how the experiment they conducted answers the focus question.
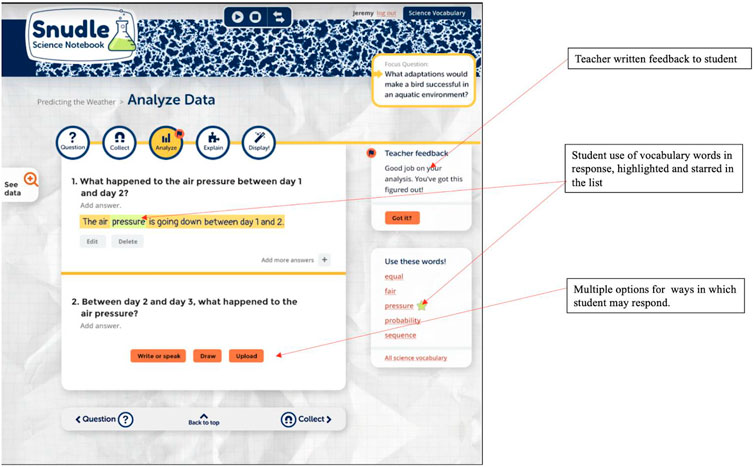
FIGURE 2. Screenshot of the Analyze page in SNUDLE in which students see the focus question and have access to their data. When responding to questions, users have several options for how to respond including writing, speaking, drawing or uploading.
Like traditional science notebooks, SNUDLE provides students a structured and supported space to collect, organize, and display observations and data in science; space to reflect and make sense of inquiry experiences; and multiple opportunities to demonstrate understanding at every stage of the investigation through text answers and data tables. However, with UDL as the design framework (CAST, 2018) and digital technology as the platform, SNUDLE differs from traditional science notebooks in several key ways.
First, SNUDLE was developed according to accessibility guidelines from the World Wide Web Consortium (W3C Web Accessibility Initiative (WAI), 2018), Section 508 of the Rehabilitation Act (29 U.S.C. 794d), and the National Center on Instructional Media (2006). Text-to-speech technology is built into the notebook interface with real-time highlighting to support simultaneous access to auditory and visual processing, as well as word-by-word English-to-preferred language translation (in this study Spanish, Vietnamese and Arabic language translations were available), keyboard-accessible actions, and a multimedia glossary to provide just-in-time support for vocabulary use and development. These features remove barriers faced by many students with learning disabilities whose literacy skills would interfere with the efficacy of materials that depend on proficiency in reading and writing. They also help support students for whom proficiency in English is a barrier, and others who would more effectively learn through use of built-in accessibility features.
Second, SNUDLE leverages contextual support to develop and reinforce effective science learning behaviors. Pedagogy is built into the interface design itself, guiding students and teachers in the process of active science learning and the effective use of science notebooks. For instance, students are prompted to think about making direct reference to their data and observations in support of their conclusions and to use relevant vocabulary from their inquiry experiences throughout their notebook entries.
Third, in addition to the student interface, SNUDLE contains a teacher interface which includes features that facilitate active science learning. For instance, teachers are prompted and supported to provide feedback on the students’ entries that may include corrective information, alternative strategies, information to clarify ideas, or encouragement to engage in the scientific process.
Research Questions
Using a mixed-methods research approach, this study sought to quantitatively and qualitatively address the impact of SNUDLE on student outcomes, and to explore how SNUDLE was used by students and teachers in the classroom. Specific research questions (RQs) include:
RQ1 (Overall Impact): Did students who used SNUDLE in fourth grade science classrooms achieve greater gains in science learning and STEM self-efficacy when compared to students who used traditional paper-based science notebooks?
RQ2 (Differential Impact): Did the impact of SNUDLE vary among students with disabilities and those whose families speak a language other than English or Spanish?
RQ3 (Implementation): Do the usage patterns indicate that SNUDLE was implemented with fidelity by students and teachers? What were the SNUDLE features most commonly used by the different subgroups of students?
RQ4 (Perception): What were teachers’ perceptions of the usefulness of SNUDLE in science learning, engagement, and self-efficacy?
Materials and Methods
Quantitative Design
A cluster randomized controlled trial was conducted within a large urban school district from August 2017 to January 2019. There were seven participating elementary schools with a total of 36 participating fourth-grade teachers across two cohorts; the first cohort (August 2017 to January 2018) included 29 teachers and the second cohort (August 2018 to January 2019) included seven teachers. Parental consent forms were distributed on the first day of school for each cohort. While all students who enrolled in the study’s full inclusion general education science classes were eligible to participate in the study, we received parental consent and student assent to participate for 683 students (372 intervention, 311 comparison) as of August 2017 for cohort 1 and 219 students (97 intervention, 122 comparison) as of August 2018 for cohort 2, for a total of 902 students (469 intervention and 433 comparison) across both cohorts. Teacher randomization was conducted after parent consent and student assent were completed. Stratifying by cohort and school, blocking schedule, years of teaching experience, and confidence level in teaching science, the 36 teachers were randomized into SNUDLE or business-as-usual (BAU) condition; 20 teachers were randomized to the SNUDLE condition (16 in cohort 1 and 4 in cohort 2) and 16 teachers were randomized to BAU comparison conditions (13 in cohort 1 and 3 in cohort 2). All teachers taught using the district’s StemScopes curriculum, which included a traditional paper science notebook or worksheets. Treatment teachers used the SNUDLE science notebook in lieu of the paper notebook, while condition treatment teachers continued use of traditional paper science notebooks/worksheets.
Qualitative Design
Structured interviews were conducted with both treatment and comparison teachers in both years of the study. A random sample of teachers were selected for interviews. In year one, 10 interviews were conducted with treatment teachers and nine with comparison teachers. At the conclusion of the intervention in year two, eight treatment teachers and five comparison condition teachers were interviewed.
SNUDLE Intervention Teacher Training
Training was conducted on two occasions by CAST staff for both cohorts. In the summer, both intervention and comparison teachers participating in the SNUDLE study received a full-day training during which they were introduced to the purpose and goals of the study and received professional development on the principles of UDL. After randomization, teachers in the intervention condition then received an additional 4 hours of training, during which time CAST staff provided them with SNUDLE materials and introduced them to the program and SNUDLE’s educational philosophy and approaches to pedagogy. During the training, intervention teachers were provided multiple opportunities to practice using both the teacher- and student-facing SNUDLE views and role-played how they would use SNUDLE in their classrooms. For instance, with student-facing SNUDLE, teachers practiced using the multiple modalities of responding, such as speech-to-text, drawing features, and typing or finger-writing responses on the tablet. On the teacher-facing SNUDLE, teachers used the dashboard to view student progress and practiced using the comments features to provide just-in-time feedback on student progress. Upon implementation in their classrooms, intervention teachers received ongoing coaching and support from CAST via weekly newsletters that provided best practice tips and tricks. They also received individualized support when requested and/or when classroom observations suggested the need for additional implementation support and technical assistance.
Intervention teachers in both cohorts implemented the intervention from September to January of the school year in which they participated (2017–18 or 2018–19), during which the SNUDLE tablets were integrated into 18 investigations across nine curriculum units. Teachers in both the intervention and comparison group were required to use the district-mandated science curriculum and adhered to the district’s pacing guide for administering each lesson in a prescribed timeline. The only difference between the SNUDLE intervention group and the BAU comparison group was the use of the SNUDLE digital science notebook rather than a paper-based notebook when completing the investigations.
Measures
Student Demographics
From the student’s school records, we obtained sociodemographic data on gender, race/ethnicity, free or reduced-price lunch status, dual language learner status, and language spoken at home. The most common languages spoken at home among participating students were English, Spanish, Vietnamese, and Arabic. Disability status was identified from administrative data indicating the student has an individualized education program (IEP).
Curriculum-Based Unit Tests (i.e., Quiz Scores)
Assessment items from STEMscopes, the school district’s curriculum, were used as academic achievement measures closely aligned with the curriculum content. The curriculum developers categorized the items by the four levels of Bloom’s Taxonomy: Understand, Apply, Analyze, and Evaluate. Because SNUDLE seeks to provide opportunities to improve higher level science thinking, the items we selected predominantly focused on Analyze and Evaluate questions. One of the nine unit tests or quizzes was dropped from analysis because a natural disaster caused school closure at the beginning of the study that interrupted teaching and quiz administration. The sum of correct responses across the remaining eight end-of-unit quizzes served as a proximal outcome measure. The standardized Cronbach coefficient alpha for the STEMscopes unit tests was 0.88.
District Common Assessment in Science
The District Common Assessment (DCA) in Science was used as a pretest measure of academic performance in science and administered to both intervention and comparison students. The school district developed the DCA as a measure of intermediate-term goals and objectives and it is administered at the end of the first and second semesters each school year. The DCA was designed to assess concepts from the Texas Essential Knowledge and Skills (TEKS), with many of its items based on the validated State of Texas Assessment of Academic Readiness (STAAR®) program (Human Resources Research Organization, 2016). DCA items that are not directly aligned with TEKS were derived from tests published by several commercial publishing companies.
Measures of Academic Progress
For a broader measure of science knowledge, we administered the Northwest Evaluation Association’s MAP test of science at the end of both Year 1 and Year 2 data collections. The MAP science test is a formative measure that covers domains of Earth, life, and physical sciences. It is a computerized adaptive assessment consisting of 50 multiple-choice items with four or five options. In the Northwest Evaluation Association’s item development, all items match the assessable sections of a set of academic content standards both in breadth of content and depth of knowledge. MAP tests have been validated to link to content standards in all 50 states and have excellent technical characteristics (Northwest Evaluation Association, 2011). Third-grade state standardized achievement scores in English Language Arts measured by the STAAR program were collected as a baseline measure of academic performance for the fourth grade participating students in this study.
Motivation for Science (MFS)
A key outcome for SNUDLE is its ability to increase not just students’ knowledge of science practices, but also their motivation to learn science. The MFS is an 18-item survey intended to measure the latter. The MFS consists of subscales for the following four constructs: self-efficacy, interest, desire for challenge, and comfort using computers. Reliability of the MFS is 0.85; for the experimental sample, it was 0.89 (Rappolt-Schlichtmann et al., 2013). The MFS was administered to all participating and consented students at pretest after teacher randomization, and again at posttest after completion of the intervention.
Implementation Measure
Implementation fidelity was measured for the two components of the SNUDLE intervention: 1) the training and ongoing coaching support provided to the teachers in the SNUDLE intervention group and 2) implementation of SNUDLE by the teacher and students for each of the 15 investigations included in the analysis. For the teacher training, implementation fidelity involved full attendance at two training sessions (total of 8 hours of training) and participation in observation and ongoing coaching from the SNUDLE development team and district-level science specialists trained in SNUDLE. To meet fidelity thresholds, teachers were expected to attend both trainings in their entirety and participate in at least one observation and coaching session with their specialist or SNUDLE researcher.
For documentation of SNUDLE implementation in the classroom, we relied on the SNUDLE software usage data collected while the teacher and students interacted with the SNUDLE online notebook during each of their science lesson’s experimental investigations. SNUDLE records user data and provides a dataset describing instances of actions such as logins, which pages and investigations students visit, when and on which pages students create content, which features of SNUDLE students use (e.g., text to speech, language translation), and when teacher users provide written feedback to student users in SNUDLE. From this dataset, we measured implementation fidelity based on the quantity or dosage of SNUDLE use, the quality or depth of use, and the frequency with which accessibility features afforded by SNUDLE were accessed by the students.
Dosage. The study data collection period covered the first semester of the district’s science curriculum for each of the two cohorts. Dosage was measured in two ways: 1) Number of investigations accessed in the classroom. Pairs or groups of students used SNUDLE together after logging into a single student’s account. Therefore, SNUDLE access during investigations was identified at the classroom rather than individual student level. To ensure that student access was intentional rather than accidental log-ins or used for purposes other than the investigation, at least 15% of students in the classroom were required to log onto SNUDLE at the same time to be identified as SNUDLE used for an investigation; 2) Teacher usage. To measure direct teacher use, we calculated the number of days the teacher logged into SNUDLE.
Quality of usage. There are three different steps students worked through on an investigation in SNUDLE: 1) collect data, 2) analyze data, and 3) explain findings. Each step in the investigation process is a separate webpage of the digital notebook. Accessing the “Analyze data” and “Explain findings” pages suggest a higher level of SNUDLE usage as these pages were developed with the purpose of engaging students’ deeper scientific thinking. To measure usage of these pages, we calculated the percentage of days in which students created or edited contents on Analyze or Explain pages out of the total number of days students created or edited content on any of three steps/pages.
Accessibility features. In addition to looking at implementation of SNUDLE via dosage and quality of usage, we also observed the backend usage data to understand what types of SNUDLE features were used by the students with and without disabilities. Specifically, we counted how often students used each of a variety of features designed to make the SNUDLE notebook more accessible. These features include things like draw tool, text-to-speech functionality, translation into three different languages, glossary functions, and sentence starters.
Qualitative Teacher Interviews
A twenty-one question interview was designed to address research question four (RQ4) to better understand teacher perceptions of student performance and use of science notebooks. The research team designed a scripted protocol and conducted the teacher interviews conducted by phone at the conclusion of the intervention period each year. Treatment and comparison teachers were asked the same questions, with references to SNUDLE or to the traditional science notebook adapted to match the condition of the interviewee. Some questions were closed-ended, with response options formatted using a Likert-like scale, while other questions solicited open-ended responses. Each interview required approximately 30–45 min to complete, and teachers and interviewers engaged in dialogue during the process. Interviews were recorded and transcribed to allow for comprehensive analysis.
Data Analysis
Quantitative Data Analysis
This study conducted descriptive analysis of baseline and outcome variables for the whole sample, students with disabilities, and students whose home language was a language other than English or Spanish.
Primary estimates of the intervention effect were derived from intent-to-treat (ITT) analyses in which all students remained in the group they were originally assigned to for analyses, regardless of attrition or movement across groups. Regardless of the level of implementation, these analyses compared all students in treatment teachers’ classrooms to their peers in comparison teachers’ classrooms. Two-level Hierarchical Linear Modeling (HLM; Raudenbush and Bryk, 2002) was performed to estimate the impact of SNUDLE after taking into account students were nested in teachers. Level 1 is the student level and level 2 is the teacher level. Dependent variables were the MAP, DCA, MFS, and total unit quiz score. Independent variables included a constant, a pretest score on the same outcome measure or STAAR (the state standardized reading test) score when pretest on the same outcome measure is not available, demographic characteristics, and treatment indicator. Treatment indicator variable is at level 2. Covariates in this study were derived from the extensive literature on predictors and correlates of students’ academic achievement (Hair et al., 2006; Zhai et al., 2011). Specifically, we included the following student-level covariates in the two-level ITT HLM because previous studies have shown that these background characteristics are related to achievement: gender, race, language spoken at home, IEP status, low-income status, and dual language learner status.
Qualitative Analysis
The research team adopted a consensus scoring structure in which we used a method of collaborative qualitative analysis involving six phases: 1) preliminary organization and planning, 2) open discussion coding, 3) development of coding labels and structures, 4) initial testing of the coding structure, 5) agreement and finalizing the coding, and 6) reviewing and identifying themes (Richards and Hemphill, 2018).
The coding team used the qualitative analysis software program MAXQDA to code and analyze teacher interview results (VERBI Software, 2019). Initially all interviews were coded for condition. Researchers then identified “effects” by themes which included: 1) motivation, 2) engagement, 3) independence, 4) collaboration, 5) confidence, 6) building understanding, and 7) teacher self efficacy/teaching practices. The third level of coding included treatment teachers’ perceptions of student use of supports and scaffolds in SNUDLE. The next coding level identified student subgroups by demographic characteristics: English Language Learners (ELLs), students who are “struggling” (defined by teachers as students who generally had difficulty in reading, math and writing, (generally in the lower quartile of the class), and students with disabilities. Additionally, the research team assigned coded segments a positive, neutral, or negative rating to evaluate where impact of the SNUDLE digital notebook was evident for treatment condition teachers.
Results
Attrition Analysis
Although randomizing teachers and their students to conditions should result in statistically equivalent groups, higher overall level of attrition and differential attrition between treatment and comparison groups may jeopardize the initial balance and impact estimate may be biased (What Works Clearinghouse, 2017). Our data analysis began with an attrition analysis. Across seven outcomes at posttest, treatment group attrition rate ranged from 1 to 16%, comparison group attrition rate ranged from 7 to 15%, and the differential attrition rate ranged from 1 to 6%. According to the WWC standards (2017), the overall and differential attrition rate is low for this study.
Descriptive Analysis
After the attrition analysis, a descriptive analysis was conducted for SNUDLE students and comparison students. Table 1 presents the student background characteristics by condition. Table 2 describes baseline and posttest scores by condition for the whole sample, students with disabilities subsample, or students whose home language was not English or Spanish subsample. Statistical significance of the difference between the SNUDLE and comparison groups at baseline was determined from HLM analysis. SNUDLE participants were not significantly different from comparison students on baseline assessment scores for the whole sample and two subsamples.
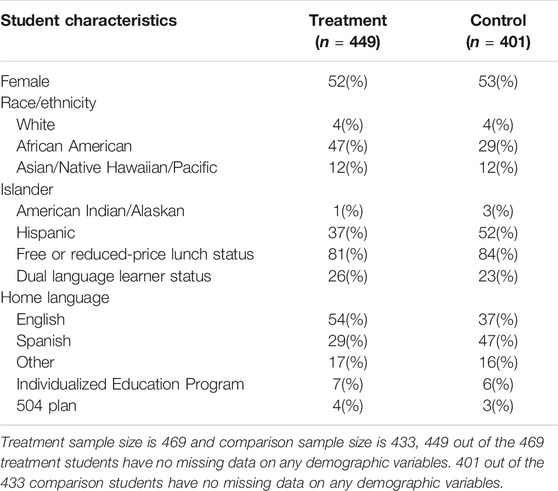
TABLE 1. Baseline demographic characteristics of students.
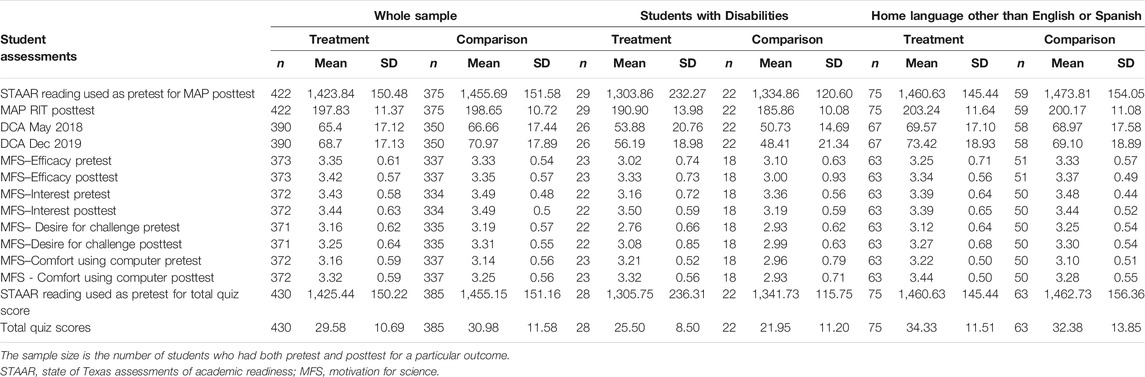
TABLE 2. Pretest and posttest scores by treatment assignment for the whole sample, students with disabilities subsample, students whose home language was not English or Spanish.
Intent-To-Treat Analysis Results (RQ1)
Primary estimates of the SNUDLE impacts were derived from the ITT analyses. Table 3 demonstrates that no significant differences were detected between SNUDLE and comparison fourth-grade students among the overall sample on any academic or motivation outcomes at the end of the 5-month intervention.
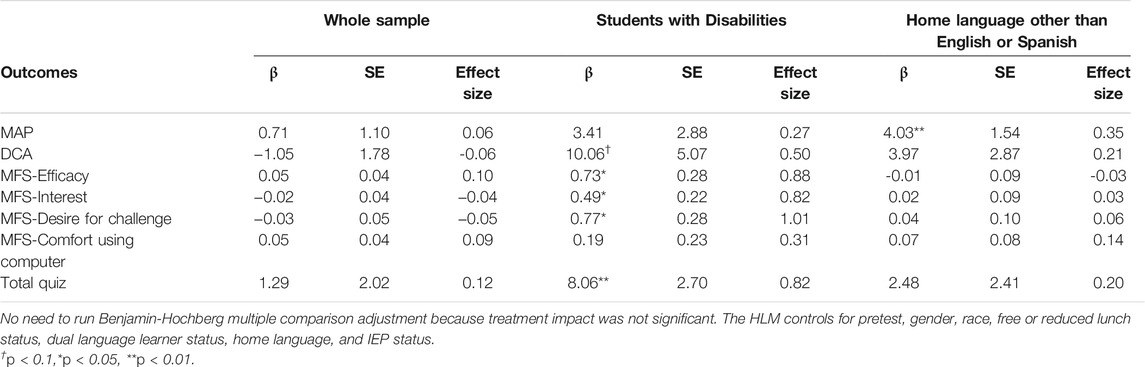
TABLE 3. Estimated treatment impact among the whole sample and among students with disabilities.
Subgroup Analysis Results (RQ2)
Our subgroup analysis showed that the effect of SNUDLE was significant and large among students with disabilities. For example, among the students with disabilities, the SNUDLE group scored significantly higher on motivation in science (Efficacy: ES = 0.88, p < 0.05; Interest: ES = 0.82, p < 0.05; Desire for challenge: ES = 1.01, p < 0.05) and science academic achievement (Total quiz score: ES = 0.82, p < 0.01). Furthermore, SNUDLE appeared to have a small but statistically significant positive impact on science academic performance among students whose home language was not English or Spanish (ES = 0.35, p < 0.01).
Fidelity of Implementation Descriptive Results (RQ3)
Our implementation analysis includes descriptive analysis of three aspects of implementation: teacher training and ongoing support, dosage and quality of usage by teacher/classroom, and student use of SNUDLE features. First, all SNUDLE teachers across two cohorts attended the two training sessions in their entirety (total of 8 h of training). Additionally, they were observed by and received post-observation coaching from district-level science specialists trained in SNUDLE or the SNUDLE research team at least one time during the research study. Therefore, there was 100% implementation fidelity as pertains to the teacher training and professional development component of the SNUDLE intervention.
Second, the SNUDLE usage data confirmed that all SNUDLE teachers implemented the intervention. As shown in Table 4, the dosage descriptive data shows that the mean number of investigations accessed on SNUDLE was 6.53 investigations, which is a little less than half of the total number of investigations SNUDLE offered. The number of days teachers accessed SNUDLE was 9.63, which suggests that teachers did not access SNUDLE for each investigation. We expected higher quality of the SNUDLE usage as presented by using SNUDLE to analyze data and explain findings instead of to collect data, as this indicates that students were more actively engaged with SNUDLE as they created or edited the content of analyze or explain pages. Students in SNUDLE classrooms on average spent 46.65% of the time on analyze or explain pages. Overall, the backend usage data suggest an insufficient level of implementation within SNUDLE classrooms.
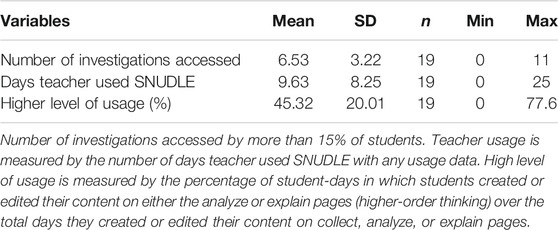
TABLE 4. Description of fidelity of implementation measures aggregated to the teacher/classroom level for cohort 1 and 2.
Third, when we examine SNUDLE features that were used by students, we found that the top five most frequently used SNUDLE features were the draw tool, sentence starters, data table, glossary, and text-to-speech (Table 5). There was no difference in SNUDLE feature usage by disability status except that students with disabilities used the draw tool functionality less often than their peers without disabilities (t = 2.22, p < 0.05). Although we expected students with disabilities might have used SNUDLE features as often as their peers without disabilities, the t-test results indicated that students with disabilities were willing to use and benefit from SNUDLE. This study did not find differences in feature usage by home language except that students whose home language was a language other than English or Spanish used the “set language” functionality more often than their peers whose home language was English (t = 2.70, p < 0.01). The “set language” function assigns the language used by the translation feature when translating from English to a target language.
TABLE 5. Description of SNUDLE features usage at the student level.
Qualitative Findings (RQ4)
During qualitative data analysis, researchers identified several frequently occurring codes in the interview dataset. These codes were broadly categorized as 1) subgroups of student users, 2) SNUDLE features, and 3) impact on student learning and performance. While teachers in the comparison condition (traditional science notebook) observed students in their classrooms responding positively to use of a science notebook to support the inquiry process, more teachers in the SNUDLE condition described their students as engaged, collaborative, and motivated by science learning. Several teachers using SNUDLE in their classroom attributed these student behaviors to specific features unique to the digital notebook environment.
Teachers in both conditions across the 2 years consistently noted positive impact from both SNUDLE and traditional science notebooks on students who struggle, including those with disabilities, in contrast to students not identified with learning challenges. Although both SNUDLE and comparison condition teachers noted the positive impact of science notebooks on this subgroup, a greater number of treatment condition teachers (16 out of 17) noted this impact, in comparison to control teachers (8 out of 14). Treatment teachers also observed that students were using sense-making skills in inquiry science: “SNUDLE guided (students) more (versus) those who struggled with the lab and concept learning without SNUDLE. They had high engagement with SNUDLE…now they can connect the lab to the questions and the intent of the lab they did.” A smaller but meaningful impact was described for students for whom English is not their primary home language. Many treatment teachers (8 out of 17) noted positive outcomes for these students, whereas fewer comparison teachers (2 out of 14) noted a positive impact. As one teacher using SNUDLE described in their interview,“ESL students are writing more, elaborating more. This is a great celebration.”
To analyze student learning performance, researchers coded for effects by recurring themes as listed in the methods section. Of the seven themed categories, three emerged most frequently in the teacher interviews: collaboration, engagement, and motivation. These student behaviors were noted during hands-on science investigations and use of science notebooks. Collaboration was characterized as student interactions with peers, engagement as student participation and on-task focus in science, and motivation as maintaining engagement and interest. While both treatment and comparison teachers observed positive impact on collaboration, engagement, and motivation, this impact was reported at a higher rate by treatment condition teachers (see Table 6).
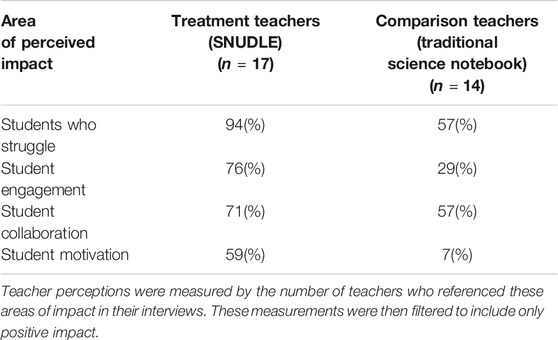
TABLE 6. Teacher perceptions of positive impact of science notebook use.
Finally, during interviews, many treatment teachers noted specific features designed to support pedagogy, usability, and accessibility within SNUDLE for their students (Table 7). While teachers did not speak to all features available in SNUDLE, teachers did identify eight specific features when speaking of impact of the tool on learners. Those features were: uploading images, drawing tool, use of tables, sentence starters, translation, speech-to-text, text-to-speech, and multimedia glossary. Teachers noted benefits to their students most frequently from the multimedia glossary, drawing tool, sentence starters, speech-to text, and text-to-speech (Table 8).
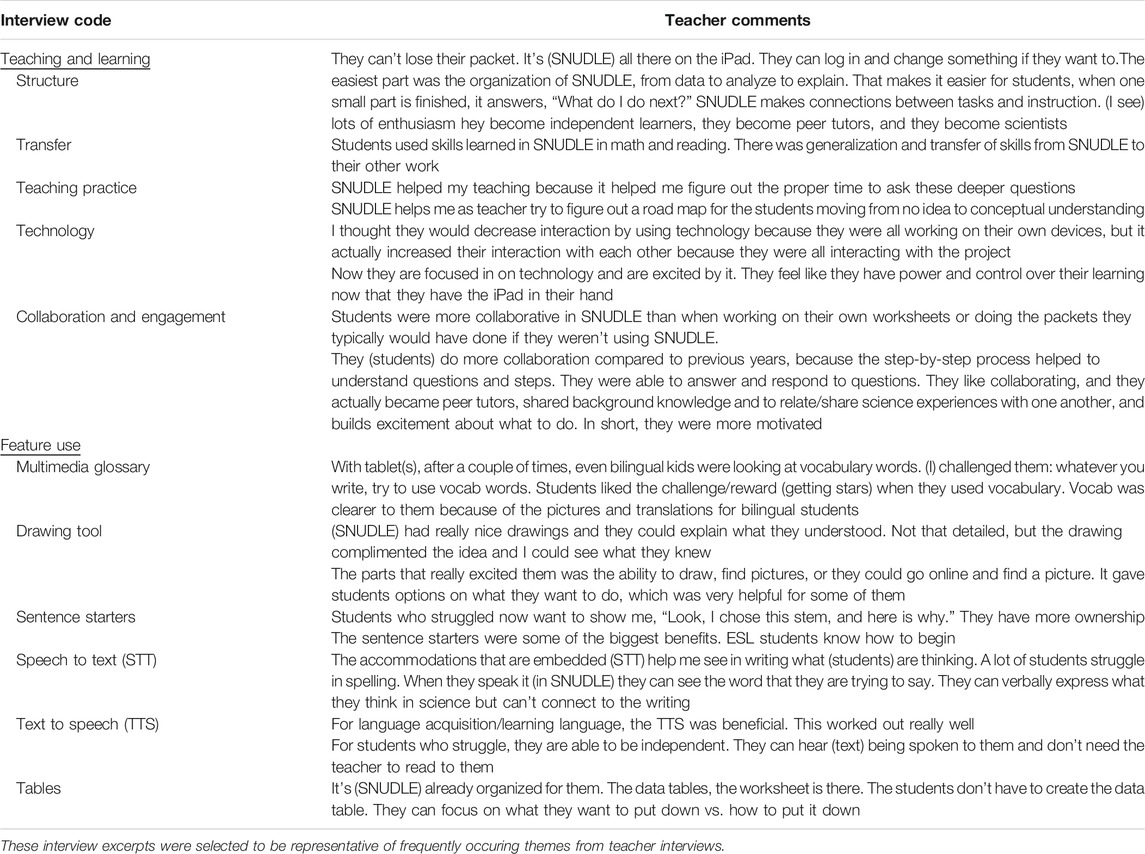
TABLE 7. Teacher Interview Comments Regarding Use of SNUDLE.
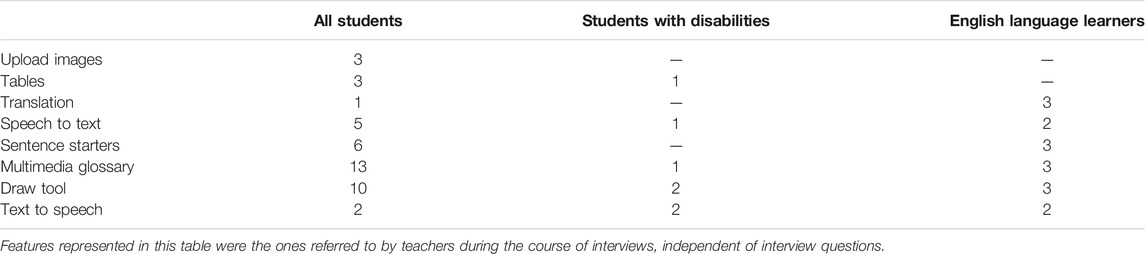
TABLE 8. Teachers reporting positive impact of SNUDLE Features on Students (n = 17).
Overall, teachers who used SNUDLE in their classrooms found the tool to be helpful in supporting their students and themselves. Factors such as structure and organization of the digital notebook were noted as helpful for many students because they enabled students to focus on the new material of the experiment, as opposed to deciding what to write or do next. Teachers also appreciated that having science notebook materials online helped students access those records and responses at any time, from anywhere. Science notebook materials were not lost in student desks or left at home. Additionally, teachers found benefits in SNUDLE providing multiple means of action and expression on all prompts and questions: “SNUDLE guides you from beginning to end. It allows variation in how students respond–drawing, typing, speech-to-text–it allowed students to respond in a variety of ways.”
Discussion
Findings indicate that SNUDLE holds promise for improving academic performance in science and confidence and motivation among some of the most vulnerable student populations. SNUDLE was created to support students, especially those with disabilities, in applying and demonstrating understanding during the scientific inquiry process. Previous research on science notebooks suggests that active science learning is particularly challenging for struggling learners who usually have low motivation for science learning (Englert et al., 1988; Graham, 1990; Swanson, 1999). Students with disabilities struggle not only with understanding science concepts, but also with all aspects of active science learning (Rappolt-Schlichtmann, et al., 2013). When compared to students with disabilities in science classes that used traditional paper-based science notebooks, students with disabilities who received the SNUDLE intervention in their science classes had significant positive outcomes in their motivation to learn science and desire for challenge, as well as their ability to demonstrate understanding of science concepts as measured by content area quizzes. Our subgroup analysis for students with disabilities showed that the effect of SNUDLE was significant when analyzing student efficacy (p < 0.05), interest (p < 0.05), desire for challenge (p < 0.05), and science academic achievement based on the total quiz scores (p < 0.01).
Additionally, SNUDLE appeared to have a small but statistically significant positive impact on science academic performance among students whose home language was not English or Spanish (ES = 0.35, p < 0.01). These students had higher academic test scores in science when compared to their counterparts in comparison classrooms. It should be noted that the academic gains in these subgroups were based on curriculum-based quizzes and district-administered assessments and did not extend to the MAP science test, a national curriculum-based assessment. Thus, it appears that the benefit of SNUDLE in encouraging scientific inquiry and science performance might be more easily captured by these two science achievement measures that were more directly aligned with the district science curriculum than with a more generalizable science assessment. These findings provide promising evidence that use of a UDL science notebook, designed to support students and their teachers during active science learning, improves science achievement and motivation outcomes for students with disabilities and students whose home language is not English or Spanish.
Furthermore, by incorporating the principles of UDL, in which a foundational tenant is recognizing and respecting variability in learning and learners (CAST, 2018), SNUDLE was designed to overcome construct-irrelevant barriers and provide contextual supports that promote active science learning for all student users (Rappolt-Schlichtmann et al., 2013). While SNUDLE was originally designed with disabilities in mind, its features can be universally leveraged to support active engagement and learning for all students, and was indeed shown to improve academic outcomes among students whose home language was neither English nor Spanish. SNUDLE levels the playing field for students with disabilities and non-Spanish-speaking ELLs.
One possible explanation for the improved academic performance among these students is that traditional paper-based science notebooks may have inhibited full understanding and expression of science learning for students below a certain level of literacy proficiency (SWD and those learning English). SNUDLE’s embedded accessibility features and scaffolded supports enabled the students to overcome these barriers and focus on the learning at hand. Qualitative data portray the extent to which teachers perceived benefits of using SNUDLE with their students who are learning English. Several teachers described seeing positive effects on learning for these students, particularly in SNUDLE’s ability to support language acquisition and science writing skills. In fact, SNUDLE usage data indicate that students whose home language was neither English nor Spanish used the Set Language (language preference) feature more often than their peers whose home language was English. SNUDLE provides flexible, interactive learning spaces and options for all students to demonstrate science understanding, including those whose home language is neither English nor Spanish. SNUDLE allows students to draw on diverse language strengths and resources and to move from a limited learning space to a flexible space in which they can express both science and language learning through multiple means, such as drawing, uploading images, text, and tables (Wilmes and Siry, 2020).
The usage data also revealed that all students, regardless of disability or home language status, used some accessibility features, with the most frequently used features being the drawing feature, sentence starter, glossary, and text-to-speech. Teacher interviews provided insights on the value these features provided to students. As one treatment condition teacher observed, “For students who struggle, the drawing is a bonus, and using the sentence stems is a lifesaver.” These features, as well as the UDL-supported Collect, Analyze, and Explain pages, may reduce the effects of barriers to science learning, which might be particularly useful for students with disabilities.
While the study found several positive outcomes for students with disabilities and students whose home language was reported as a language other than English or Spanish, with the most common “other” languages being Vietnamese and Arabic, no measurable impact was detected on the aggregate participant student population.
Limitations and Future Research
These results of the impact of SNUDLE observed among students with disabilities and those whose home language is other than English or Spanish are even more impactful when one considers that they occurred despite the fact that fidelity of implementation did not reach ideal levels for two of the three FOI measures. The lack of implementation is a possible reason for the lack of significant findings in the overall student sample, in contrast to the positive effects reported in the previous study conducted by Rappolt-Schlichtmann et al. (2013). There are several reasons why implementation was not ideal. During the first year of the study, a natural disaster occurred, which impacted the whole district and resulted in challenges to consistent implementation, especially during the first few months of the study. In addition, teachers at times had inconsistent access to the tablets, making it challenging to routinely incorporate SNUDLE into their science lessons as planned. Finally, the study represents first-time use of SNUDLE by teachers, which required them to get up to speed quickly and may not have provided sufficient exposure to achieve mastery.
While the findings from this efficacy study are promising, future studies should consider the potential of using SNUDLE under conditions where it is fully integrated and implemented with no systemic disruptions, such as natural disasters, over multiple years. Replication efforts are needed to substantiate current findings and allow a cumulative synthesis of results. Future research may address the limitations of the current work by collecting individual SNUDLE usage data (instead of the mixture of individual and small group usage data collected by the current study) over time, and clarifying the mechanism behind the impact, particularly focusing on critical features of implementation and how they are associated with student science outcomes. Ideally, future studies should use a randomized controlled trials design (for example, by randomizing teachers to different levels of teacher training and ongoing support, or by randomizing students to groups that use different combinations of SNUDLE critical features) and follow the participants over multiple years. Doing so would allow future studies to examine which implantation features impact which student outcomes and whether the impact of SNUDLE fades or intensifies over time. As mentioned by a previous study (Paek and Fulton, 2021), the impact of a digital notebook is limited by students’ ability to use the tool. Future studies should also examine how teachers can enhance student learning by helping them understand the value of each feature and how to use each feature in different science inquiry phases.
Given the identified limitations and challenges to implementation fidelity, the current data also lead to additional questions and rich opportunities for ongoing research regarding teacher supports for SNUDLE. The current SNUDLE implementation included two sessions of teacher training, updates by the research team, and coaching by onsite science specialists. Future studies may address questions such as: What impact would further coaching and supports for teachers have on student outcomes? What impact might a varied menu of training, mentoring, and ongoing coaching have on these outcomes? How could providing teachers with access to data visualizations of student behavior and performance impact teacher data-based decision making for science instruction? We intend to consider these questions in future studies and call upon the field to address these and other questions to support building students’ understanding and sense-making skills in science education at the elementary level.
Data Availability Statement
The raw data supporting the conclusion of this article will be made available by the authors, without undue reservation.
Ethics Statement
The CAST institutional review board approved this study. Researchers obtained signed consent forms from all adult study participants and signed parent/guardian consent forms and student assent forms for all children in the study.
Author Contributions
Study conception and design, JB, JY, and TH. Acquisition of data, KR, TH, JY, and KF. Analysis of Data, XW, JY, AO, TH, and JB. Interpretation of data, JY, KF, AO, TH, and XW. Drafting of manuscript, JY, XW, AO, TH, and KF. All authors contributed to the article and approved the submitted version.
Funding
This material is based upon work supported by the U.S. Department of Education’s Institute of Education Sciences under Grant R324A160008.
Conflict of Interest
The authors declare that the research was conducted in the absence of any commercial or financial relationships that could be construed as a potential conflict of interest.
Publisher’s Note
All claims expressed in this article are solely those of the authors and do not necessarily represent those of their affiliated organizations, or those of the publisher, the editors and the reviewers. Any product that may be evaluated in this article, or claim that may be made by its manufacturer, is not guaranteed or endorsed by the publisher.
References
Baxter, G. P., Bass, K. M., and Glaser, R. (2001). Notebook Writing in Three Fifth-Grade Science Classrooms. Elem. Sch. J. 102, 123–140. doi:10.1086/499696
CAST (2018). About Universal Design for Learning. Available at: http://www.cast.org/our-work/about-udl.html. (Accessed January 15, 2020).
Chi, M. T. H., Bassok, M., Lewis, M. W., Reimann, P., and Glaser, R. (1989). Self-Explanations: How Students Study and Use Examples in Learning to Solve Problems. Cogn. Sci. 13 (2), 145–182. doi:10.1207/s15516709cog1302_1
Chi, M. T. H., and Wylie, R. (2014). The ICAP Framework: Linking Cognitive Engagement to Active Learning Outcomes. Educ. Psychol. 49 (4), 219–243. doi:10.1080/00461520.2014.965823
Crawford, B., and Capps, D. (2016). What Knowledge Do Teachers Need for Engaging Children in Science Practices? Cognition, Metacognition, and Culture In STEM Education. New York: Springer.
Englert, C. S., Raphael, T. E., Fear, K. L., and Anderson, L. M. (1988). Students' Metacognitive Knowledge about How to Write Informational Texts. Learn. Disabil. Q. 11 (1), 18–46. doi:10.2307/1511035
Graham, S., and Hebert, M. (2010). Writing to Read: Evidence for How Writing Can Improve reading. New York: A report from Carnegie Corporation of.
Graham, S. (1990). The Role of Production Factors in Learning Disabled Students' Compositions. J. Educ. Psychol. 82, 781–791. doi:10.1037/0022-0663.82.4.781
Hair, E., Halle, T., Terry-Humen, E., Lavelle, B., and Calkins, J. (2006). Children's School Readiness in the ECLS-K: Predictions to Academic, Health, and Social Outcomes in First Grade. Early Child. Res. Q. 21, 431–454. doi:10.1016/j.ecresq.2006.09.005
Hargrove, T. Y., and Nesbit, C. (2003). Science Notebooks: Tools For Increasing Achievement across the Curriculum (ERIC Document Reproduction Service Number ED 482720). Columbus, OH: ERIC Clearinghouse for Science Mathematics and Environmental Education.
Human Resources Research Organization (2016). Independent Evaluation of the Validity and Reliability of STAAR Grades 3-8 Assessment Scores: Part 2. Available at: https://tea.texas.gov/sites/default/files/Independent%20Evaluation%20of%20the%20Validity%20and%20Reliability%20of%20STAAR%20Grades%203-8%20Assessments_Part2.pdf.
McNamara, D. S. (2017). Self-Explanation and Reading Strategy Training (SERT) Improves Low-Knowledge Students' Science Course Performance. Discourse Process. 54 (7), 479–492. doi:10.1080/0163853x.2015.1101328
Meyer, A., Rose, D. H., and Gordon, D. (2014). Universal Design for Learning: Theory and Practice. Wakefield, MA: CAST Professional Publishing. Available at: http://udltheorypractice.cast.org.
National Center on Instructional Media (2006). Item Writer Guidelines for Greater Accessibility. Retrieved on: http://ncamftp.wgbh.org/ncam-old-site/file_download/Item_Writer_Guidelines_for_Greater_Accessibility.pdf.
National Research Council (2012). “A Framework for K-12 Science Education: Practices, Crosscutting Concepts, and Core Ideas,” in Committee on a Conceptual Framework for New K-12 Science Education Board on Science Education, Division of Behavioral, Social Sciences and Education (Washington, D.C: The National Academies Press).
National Research Council (NRC) (2011). A Framework for K-12 Science Education: Practices, Crosscutting Concepts, and Core Ideas. Washington, DC: National Academy Press.
Next Generation Science Standards (NGSS) (2018). Disciplinary Core Idea (DCI) Arrangements of Standards. Available at: http://www.nextgenscience.org/search-standards-dci.
Northwest Evaluation Association (2011). Technical Manual for Measures of Academic Progress (MAP) and Measures of Academic Progress for Primary Grades (MPG). Portland, OR. Retrieved from: https://www.richland2.org/RichlandDistrict/media/Richland-District/AdvancED/Standard%205/5.1/5-1-NWEA-Technical-Manual-for-MAP-and-MPG.pdf.
Paek, S., and Fulton, L. (2021). Digital Science Notebooks: A Tool for Supporting Scientific Literacy at the Elementary Level. TechTrends 65, 359–370. doi:10.1007/s11528-020-00579-0
Rappolt-Schlichtmann, G., Daley, S. G., Lim, S., Lapinski, S., Robinson, K. H., and Johnson, M. (2013). Universal Design for Learning and Elementary School Science: Exploring the Efficacy, Use, and Perceptions of a Web-Based Science Notebook. J. Educ. Psychol. 105 (4), 1210–1225. doi:10.1037/a0033217
Richards, K. A. R., and Hemphill, M. A. (2018). A Practical Guide to Collaborative Qualitative Data Analysis. J. Teach. Phys. Educ. 37 (2), 225–231. Available at: https://libres.uncg.edu/ir/uncg/f/M_Hemphill_Practical_2018.pdf. doi:10.1123/jtpe.2017-0084
Rose, D. H., and Meyer, A. (2002). Teaching Every Student in the Digital Age: Universal Design for Learning. Alexandria, VA: Association for Supervision and Curriculum Development.
Ruiz‐Primo, M. A., Li, M., Ayala, C., and Shavelson, R. J. (2004). Evaluating Students' Science Notebooks as an Assessment Tool. Int. J. Sci. Educ. 26, 1477–1506. doi:10.1080/0950069042000177299
Swanson, H. L. (1999). Reading Comprehension and Working Memory in Learning-Disabled Readers: Is the Phonological Loop More Important Than the Executive System. J. Exp. Child. Psychol. 72, 1–31. doi:10.1006/jecp.1998.2477
Thurlow, M., and Wiley, H. I. (2004). Almost There in Public Reporting of Assessment Results for Students with Disabilities. (Technical report 39). University of Minnesota, National Center on Educational Outcomes.
VERBI Software (2019). MAXQDA 2020 [computer Software]. Berlin, Germany: VERBI Software. Available at: maxqda.com.
W3C Web Accessibility Initiative (WAI) (2018). W3C Accessibility Standards. Available at: https://www.w3.org/WAI/standards-guidelines/.
Wee, B., Shepardson, D., Fast, J., and Harbor, J. (2007). Teaching and Learning about Inquiry: Insights and Challenges in Professional Development. J. Sci. Teach. Educ. 18 (1), 63–89. doi:10.1007/s10972-006-9031-6
What Works Clearinghouse (WWC) (2017). Procedures and standards handbook version 4.0. Available at: https://ies.ed.gov/ncee/wwc/handbooks.
Wilmes, S. E. D., and Siry, C. (2020). Science Notebooks as Interactional Spaces in a Multilingual Classroom: Not Just Ideas on Paper. J. Res. Sci. Teach. 57 (7), 999–1027. doi:10.1002/tea.21615
Keywords: universal design for learning, science notebook, elementary education, academic outcomes, motivation for science, students with disabilities, english language learners, mixed methods study
Citation: Yu J, Wei X, Hall TE, Oehlkers A, Ferguson K, Robinson KH and Blackorby J (2021) Findings From a Two-Year Effectiveness Trial of the Science Notebook in a Universal Design for Learning Environment. Front. Educ. 6:719672. doi: 10.3389/feduc.2021.719672
Received: 02 June 2021; Accepted: 12 October 2021;
Published: 04 November 2021.
Edited by:
Antonio P. Gutierrez de Blume, Georgia Southern University, United StatesReviewed by:
Lidia Scifo, Libera Università Maria SS. Assunta, ItalyMuhammet Usak, Kazan Federal University, Russia
Copyright © 2021 Yu, Wei, Hall, Oehlkers, Ferguson, Robinson and Blackorby. This is an open-access article distributed under the terms of the Creative Commons Attribution License (CC BY). The use, distribution or reproduction in other forums is permitted, provided the original author(s) and the copyright owner(s) are credited and that the original publication in this journal is cited, in accordance with accepted academic practice. No use, distribution or reproduction is permitted which does not comply with these terms.
*Correspondence: Jennifer Yu, SmVubmlmZXIueXVAc3JpLmNvbQ==