 David Nitkin
 Douglas D. Ready1
 Alex J. Bowers
- 1Department of Education Policy and Social Analysis, Teachers College, Columbia University, New York, NY, United States
- 2Department of Organization and Leadership, Teachers College, Columbia University, New York, NY, United States
Schools are increasingly using technology to personalize instruction. Programs such as Khan Academy and Zearn produce a vast array of data on students’ behaviors and outcomes when engaged in technology-based instruction. However, these datasets rarely include equally detailed information from when students engage in non-technological learning activities. This study explores the implementation of an innovative model for adolescent mathematics instruction that includes detailed data from both technological and non-technological learning modalities. Much of the research on the implementation of technology-based personalization has focused on the effects of technology programs as isolated interventions rather than within blended models that combine instructional technology with significant changes to teacher-led instruction. Furthermore, existing studies of blended, personalized programs very rarely utilize daily programmatic data to push inside the “black box” of day-to-day interactions among students, teachers, and content. We attempt to address these gaps by using hierarchical cluster analysis, cluster trees, and clustergram heatmaps to explore and visualize data from 170,075 daily lesson assignments and assessments generated by 1,238 unique fifth through eighth grade students across five schools implementing an innovative model for blended and personalized middle school math instruction. We explore three research questions: (1) To what degree did the daily implementation of this program reflect its stated goal of personalizing instruction? (2) Did student outcomes vary based on exposure to each of the learning modalities utilized by this program? (3) Did student outcomes vary based on the academic proficiency of students entering the program? These analyses support three main findings: (a) The instructional reform succeeds in creating a highly personalized student experience, but was likely hampered in implementation by policy and logistical constraints; (b) Participation in a learning modality focused on long-term projects was associated with a lower degree of personalization but higher student outcomes than the other six learning modalities utilized by the program, particularly for some latent clusters of students; and (c) Initially higher-performing students earned higher scores on daily assessments than initially lower-performing students, despite the program’s intended goal of fostering equity in student outcomes through personalization of content to meet each student’s supposed level of readiness.
Introduction
Educators have consistently grappled with the challenge of meeting the varied academic needs of a diverse student body. This challenge is a consequence of three fundamental realities at the core of American public education: (1) the mandate that all students up to a certain age attend school; (2) the desire for all students to obtain a uniform, baseline level of academic achievement; and (3) the stark disparities and inequalities already present at the start of formal schooling (Bidwell, 1965). Schools have historically explored a variety of strategies to address cognitive diversity, including small group and personalized instruction (McDonald, 1915; Bloom, 1984; Tyack and Cuban, 1995; Keefe and Jenkins, 2000; Januszewski, 2001; Corno, 2008; VanLehn, 2011). However, modern American schools were explicitly designed to promote standardization and uniformity, not personalization (Tyack, 1991; Cuban, 1993; Tyack and Cuban, 1995). This tension between the desire to personalize instruction and the prevalence of structures that promote consistency, such as age-grade cohorts and standardized testing, has impeded the ability of schools to meet the unique learning needs of every student.
Over the last 30 years, practitioners and researchers have explored the potential of new technologies to personalize instruction. Many of these technology-based tutoring systems trace their origins to computer-assisted instructional tools that were built at Carnegie Mellon University in the 1970s and 1980s (Yazdani, 1987; Murray, 1999). These systems began with simple branching trees of instructional content, but eventually expanded to include the ability to generate new questions based on pre-set mathematical operations and general teaching strategies. More recently, intelligent tutoring systems such as Reasoning Mind, ALEKS, Cognitive Tutor, and ASSISTments have been designed to provide immediate and customized feedback to students, with the goal of replicating the experience of customized, one-on-one tutoring while avoiding the cost of procuring a human teacher. These programs have been found to produce significant student academic gains in some contexts compared to traditional instructional models (Koedinger et al., 1997; Koeclinger et al., 2000; Hardy, 2004; Hagerty and Smith, 2005; Pane et al., 2013, 2014). These tools have been discussed extensively in the learning analytics and educational data mining literature, and the underlying mathematical principles used to create them were essential in developing many of the technology-based personalization programs that are currently being used in classrooms across the country.
In some cases, technological tutoring tools have been “blended” with traditional teacher-led instruction to created hybrid instructional models (Horn and Staker, 2014; Murphy E. et al., 2014; Murphy R. et al., 2014; Brodersen and Melluzzo, 2017). In this paper, we study one such anonymous blended learning program, which we will refer to as Technology-Based Personalization Program, or TBPP. Students participating in TBPP begin each school year by taking a diagnostic mathematics assessment. The results from these assessments are used to generate individualized learning plans (“playlists”) for each student, which can span skills from 2nd through 9th grade. Upon entering class each day, each student is given a customized lesson utilizing one of seven potential instructional methods (“modalities”) followed by a short daily assessment. The results of these assessments are used to update each student’s playlist and determine the skill and modality assigned to that student for the next day. Crucially, the available modalities include a mix of teacher-led, technology-driven, and collaborative instructional formats. TBPP also reorganizes the learning environment from multiple isolated classrooms into one large space containing between four and eight adult instructors and approximately 100 students, facilitating the dynamic grouping and re-grouping of students each day based on their individual playlists. TBPP’s theory of action is to maximize student learning by customizing the difficulty of the content provided to each student. More advanced learners will be given above-grade level content, while learners with gaps in their knowledge will receive targeted remediation. Leveraging technology to provide students with their “just-right level” content will replicate the benefits of one-on-one tutoring, but at a fraction of the cost.
While blended programs like TBPP have been heavily studied, the existing research focuses disproportionately on macro effects, such as overall impact on learning over the course of a year (Means et al., 2010; Murphy E. et al., 2014; Murphy R. et al., 2014; Pane et al., 2015, 2017; Brodersen and Melluzzo, 2017; Muralidharan et al., 2019). Comparatively little research on blended learning has focused on the student-level and lesson-level mechanisms that contribute to overall student achievement, and those that do exist rely overwhelmingly on student and teacher self-reports or observations rather than students’ daily learning outcomes (Hollands, 2003; Murphy E. et al., 2014; Murphy R. et al., 2014; Pane et al., 2017). The fact that TBPP’s model captures detailed, lesson-level data on both content assignment and student learning outcomes across technology-based, collaborative, and teacher-led modalities makes it uniquely well positioned for the application of quantitative methods to explore ground-level implementation, an approach that has been utilized relatively rarely when studying blended learning programs (Krumm et al., 2018).
We specifically explore the following research questions:
(1) To what degree did the daily implementation of this program reflect its stated goal of personalizing instruction?
(2) Did student outcomes vary based on exposure to each of the learning modalities utilized by this program?
(3) Did student outcomes vary based on the academic proficiency of students entering the program?
To address our research questions, we utilize hierarchical cluster analysis and data visualization heat maps to examine the relationship between variation in students’ daily performance and variation in instructional modality, instructional content, and date within the academic year. We also compare these lesson-level data points to end-of-year outcomes on two standardized assessments. Finally, we explore whether these relationships vary by students’ initial mathematical ability. Although hierarchical cluster analysis and data visualization heatmaps have been applied effectively across a wide range of fields, this paper represents among the first applications to the daily instructional assignment and student outcome data generated by a blended learning program (Bowers, 2007, 2010; Bowers et al., 2016; Krumm et al., 2018; Bowers and Krumm, 2021). Demonstrating the efficacy of these techniques would be of great value to the field, given the rapid growth of technology-driven learning programs and the unique datasets they produce.
Literature Review
In the sections below, we discuss the research literature on personalization, the use of technology for instruction, and blended learning. Afterward, we discuss the TBPP program, which falls at the intersection among all three.
Personalization
The necessity to personalize instruction to meet pupils’ unique needs has existed for as long as education itself; Corno (2008) cites references to educational differentiation in Chinese, Hebrew, and Roman texts dating back more than two millennia. However, this need for personalization conflicts with the “one size fits all” structures of American schools, which were designed at the turn of the 20th Century to accomplish the dual goals of assimilating millions of young immigrants while preparing all students to contribute to an industrial economy (Tyack, 1991; Cuban, 1993; Tyack and Cuban, 1995). Dewey (1916) published a strong philosophical rationale for personalized learning with his landmark “Democracy in Education.” In this and other texts, Dewey argued that children should not be marched lockstep through a curriculum, but instead encouraged to nurture their own learning through self-guided exploration and discovery (Dewey, 1916). The theoretical justification for personalized learning was buttressed in 1978 when Harvard University Press published, for the first time in English, Lev Vygotsky’s framework for personalizing content according to each student’s unique “zone of proximal development” (Vygotsky’s work had been published in the Soviet Union in the 1920s and 1930s, but did not attract attention in the West until the late 1970s) Vygotsky and Cole, 1978. In this model, the ascent to knowledge can be compared to climbing a tree, with the teacher’s role as helping each student climb to the branch just a little farther than they could reach unaided (Corno, 2008). The zone of proximal development serves as the next highest tree limb—just out of the student’s independent grasp, but reachable with guided support from a teacher.
Dewey’s vision, as well as that of other educators like Maria Montessori, have been evidenced in multiple attempts to build and implement personalized schooling models over the last hundred years. One of the most prominent was the Dalton Plan, a personalized model that generated intense interest among educators and the general public during the 1920s and 1930s. The Dalton Plan did away with self-contained classes, fixed times for discrete subjects, and annual promotions and retentions of students. Instead, students were empowered to negotiate monthly contracts with their teachers outlining both their minimum, mandatory tasks and additional opportunities for self-directed enrichment. Students moved at their own pace through the curriculum and had significant latitude to choose their own content, peer collaborators, and physical workspaces. By 1932, nearly ten percent of American schools reported that they had implemented some version of the Dalton plan. However, this popularity would not prove durable; many teachers objected to the significant time required to implement individualized instruction, and parents complained that student social and academic behaviors suffered (Tyack and Tobin, 1994). When a researcher attempted in 1949 to identify schools that still utilized the Dalton Plan, she found it in use at only a single site—the original Dalton School in Manhattan (Tyack and Cuban, 1995).
Today, personalized instruction, also known as adaptive teaching or differentiation, is one of the most prominent classroom-level strategies for accelerating learning, and is backed by strong evidence of effectiveness (Bloom, 1984; Tomlinson, 2001; Connor, 2019). Corno (2008) describes adaptive teaching as the real-time assessment and differentiation which experienced teachers utilize throughout instruction. In her words, “In teaching adaptively, teachers respond to learners as they work. Teachers read student signals to diagnose needs on the fly and tap previous experience with similar learners to respond productively” (p. 161). While differentiated instruction is widely recognized as characteristic of good teaching, there is little evidence that teachers are capable of implementing it successfully at scale (Tomlinson et al., 2003; National Mathematics Advisory Panel [NMAP], 2008; Suprayogi et al., 2017; Smale-Jacobse et al., 2019). In one recent study, researchers provided teachers with extensive professional development and ongoing coaching on how to implement differentiation in their classrooms. However, three years later, they found no increase in the level of differentiation utilized by these teachers (Petrilli, 2012). Teachers themselves admit that they struggle to implement differentiation in their classrooms. In a 2008 national survey, more than eight in ten teachers said that differentiated instruction was “very” or “somewhat” difficult to implement (Farkas et al., 2008).
Given these challenges, it is not surprising that practitioners and policymakers have seized upon technology as a tool to support personalization. However, enthusiasm for technology-based personalization may be outpacing clarity on the most effective pathways for implementation. A recent EdWeek report suggested that “In the diverse and ever-changing world of educational technology, the term ‘personalized learning’ seems to be everywhere, though there is not yet a shared understanding of what it means” (Cavanagh, 2014). A consortium of prominent education philanthropies led by the Bill and Melinda Gates Foundation published a “working definition” in 2017, which named personalized learning environments as characterized by (1) Individual learner profiles, (2) Personal learning paths, (3) Competency based progression, and (4) Flexible learning environments (Pane et al., 2017). In 2010, a symposium convened by the Software and Information Industry of America (SIIA), ASCD, and Council of Chief State School Officers published an alternate list of essential elements for personalized learning, including: (a) Flexible, Anytime/Everywhere Learning; (b) Redefine Teacher Role and Expand “Teacher;” (c) Project-Based, Authentic Learning; (d) Student Driven Learning Path, and (e) Mastery/Competency-Based Progression/Pace (Wolf, 2010). Although there is significant overlap between the definitions produced by the Gates Foundation and the SIIA symposium, there are also substantive differences. For example, the SIIA definition includes a redesigned role for teachers, while the Gates Foundation definition does not explicitly address teachers’ roles. Similarly, the SIIA definition includes project-based, authentic learning as a key component of personalized learning, but the Gates Foundation definition does not. The overall impact of these differences is to keep the Gates Foundation definition relatively narrow, whereas the SIIA definition envisions a broader redesign of the school experience.
The research literature has demonstrated that personalized, technology-based tutoring programs can have significant positive effects on learning, particularly in mathematics (Koedinger et al., 1997; Koeclinger et al., 2000; Hardy, 2004; Hagerty and Smith, 2005; Barrow et al., 2007; Pane et al., 2013, 2014; Roschelle et al., 2016). Muralidharan et al. (2019) offer a list of potential channels of impact for technology-based tutoring, including “circumvent[ing] limitations in teachers’ own knowledge; delivering engaging (often game-based) interactive content that may improve student attention; delivering individually customized content for students; reducing the lag between students attempting a problem and receiving feedback; and, analyzing patterns of student errors to precisely target content to clarify specific areas of misunderstanding.”
Blended Learning
Although the terms “blended learning” and “personalized learning” are often used interchangeably, they actually represent distinct but frequently overlapping constructs; a school may be blended without being personalized, or personalized without being blended (Picciano, 2014; Brodersen and Melluzzo, 2017). For example, a school that is blended but not personalized might include students alternating between in-person and technology-based instruction, but learning the exact same content in each modality, while a school that is personalized but not blended might feature highly differentiated content delivered through non-technological mechanisms like small group tutoring. The Christensen Institute defines blended learning as “a formal education program in which a student learns: (a) at least in part through online learning, with some element of student control over time, place, path, and/or pace; (b) at least in part in a supervised brick-and-mortar location away from home; and (c) the methods along each student’s learning path within a course or subject are connected to provide an integrated learning experience” (Horn and Staker, 2014). In addition, many have used the term “competency-based learning” synonymously with both personalized learning and blended learning, although both the Gates and SIIA definitions included competency-based advancement as only one element of the broader personalization concept (Horn, 2017).
Unlike studies of technology-based tutoring programs, which are able to isolate a highly specific intervention and describe its function in great detail, the teacher-led nature of blended learning means that students’ lived experiences and outcomes can vary wildly across schools, or even across classrooms within the same school. For example, one study of blended learning in five charter school networks found a wide array of instructional software and models in use, with a mixture of positive and negative effects. It also found that schools exhibited an eagerness to continually experiment with their models, meaning that even within a single school, the vision for blended learning was likely to change over time (Murphy E. et al., 2014). More recent studies have similarly found some positive effects, but the diversity of models, contexts, and methodologies make it difficult to draw sweeping conclusions about blended learning models as a whole (Brodersen and Melluzzo, 2017). One study of a blended learning program utilizing the online program Khan Academy found that implementation varied so significantly within schools that it would be impractical to even attempt to estimate a uniform effect on student achievement (Murphy R. et al., 2014).
Not surprisingly, this inconsistency in implementation has made it difficult to isolate an effect for blended learning as a whole. Instead, the term “blended learning” seems to apply to a wide array of instructional activities, some effective and some ineffective, with the specific daily relationships among teachers, students, and content largely inside a “black box” that the existing literature rarely explores (Means et al., 2010). The most typically used methods for understanding the day-to-day implementation of blended learning programs are student and teacher surveys (Hollands, 2003; Murphy E. et al., 2014; Murphy R. et al., 2014; Pane et al., 2017). However, this information is limited by its self-report nature. In contrast, the use of technology within blended models offers an underutilized opportunity to study their implementation through examination of the daily programmatic data that they produce, which are much larger in volume than traditional education data, of a much finer grain-size, time-specific and inherently longitudinal, and naturally integrated with information on program delivery (Natriello, 2012, 2013; Krumm et al., 2018). Of course, the vast majority of blended learning programs capture daily data only on the technology-driven portion of the model, not the parallel teacher-driven portion. The lack of integrated, daily data spanning both technology-driven and teacher-led learning modalities has been an obstacle to understanding more deeply how blended learning models work, for which kinds of students, and in which contexts. This paper offers the unique contribution of having access to exactly this type of integrated, daily data.
Data and Methods
Description of the Program Under Study
This study examines the implementation of an anonymous technology-based personalization program (TBPP). TBPP can be described as both personalized and blended according to the theoretical lenses described in the previous section. From a technical perspective, TBPP has five key components. First is a “concepts map” that charts the full set of discrete mathematical skills spanning grades 2–9 (roughly corresponding to ages 7–14) and the hypothesized relationships among those skills. Second is each student’s unique “playlist,” which is generated by mapping each student’s results on a beginning-of-year diagnostic assessment against the concepts map to identify his or her zone of proximal development. Third is TBPP’s instructional content, which is sourced from a variety of curriculum developers, online learning programs, and TBPP’s own in-house curriculum department. Fourth are “exit slips,” short unique assessments that students take at the end of each day to measure mastery of that day’s instructional content. Fifth, a “learning algorithm” captures and analyzes the data from each exit slip, updates the student’s playlist, and generates that student’s assignment for the next day, including both the mathematical content and modality.
Each 35 min TBPP lesson utilizes one of seven different instructional modalities. In the Online Instruction (OI) and Online Practice (OP) modalities, students work independently on digital content that they access through the online TBPP portal. OI introduces students to new content, whereas OP provides practice opportunities with content to which students have already been introduced. The Paper Practice (PP) modality also sees students working independently using either online or traditional paper/pencil content. In the Large Group (LG) and Small Group (SG) modalities, students work in groups with one to five peers to solve mathematical problems addressing a shared skill. The Teacher Instruction (TI) modality is most similar to traditional instruction, with teachers guiding groups of 6–30 students through a shared mathematical concept. Finally, in the Long Term Projects (LTP) modality, students work with the same peer group and teacher over multiple lessons to solve a complex, real-world problem. This day-to-day consistency in both content and student group makes the LTP modality different than all other modalities, in which new groups are generated dynamically each day. The TBPP algorithm intentionally assigns each student to all seven modalities across the academic year, and at any given time a typical TBPP classroom will simultaneously feature some students learning independently using the OI, OP, or PP modality, some students working in groups using the LG or SG modality, and some students learning from teachers using the TI or LTP modality. Students experience two 35-min lessons back to back each day, usually addressing the same skill, followed by the day’s exit slip, which they have ten minutes to complete.
Because the TBPP instructional experience is so different from that of a traditional classroom, we will describe it in more detail from the perspective of a typical student, whom we will call Joseph. Joseph begins his daily TBPP experience by walking into a large, open learning space that is approximately the size of four traditional classrooms. Upon entering the learning space, Joseph retrieves his personal laptop, logs onto the TBPP portal, and checks his personal schedule for the day. Joseph was introduced to the skill of multiplying decimals yesterday, but did not demonstrate mastery on yesterday’s exit slip. As a result, the TBPP algorithm today assigns him to spend 35 min practicing decimal multiplication in a Large Group (LG) modality with four other students who also need to master this skill, then assigns him to a Paper Practice (PP) modality where he will work on the skill independently using online content from Pearson that he accesses via his computer. After seventy minutes, Joseph opens his personalized exit slip through the TBPP portal and attempts to answer five multiple choice questions on multiplying decimals. Joseph is delighted to see that he has gotten four out of the five questions correct, which TBPP interprets as indicating mastery. Joseph logs off and closes his computer, knowing that he is now ready to move on to the more complex skills, such as dividing decimals, that TBPP will present to him tomorrow. Figure 1 provides an overview of Joseph’s schedule on the typical day that we just described.

Figure 1. Sample student daily schedule.
Technology-based personalization program qualifies as both a personalized learning program and a blended learning program according to the criteria that we cited in the previous section. Crucially, both the technology-led and teacher-led portions of the program are personalized; this makes TBPP different from most blended learning programs, which typically personalize the technology-led portion of instruction while retaining the features of traditional schooling for the teacher-led portion (Horn and Staker, 2014; Murphy E. et al., 2014; Horn, 2017). This high degree of personalization across both the technology-led and teacher-led portions of the model makes TBPP a uniquely interesting case study for better understanding of personalized learning.
Data
Our data was generated by TBPP’s implementation in the 2015–2016 academic year with fifth through eighth grade students in five public K-8 schools in a mid-sized urban district in the United States (i.e., approximately aged 10–14). The vast majority of students were either black or Latino, and virtually all were eligible for free or reduced-price lunch; the demographics of these five schools were representative of their district. These five schools implemented TBPP for all of their enrolled students within fifth through eighth grade. In other words, TBPP represented the full mathematics instructional program for the full population of students in the eligible grades.
One embedded feature of the TBPP program is the ability to collect detailed daily programmatic data that links exit slips and lessons, including information on the modality, content, teacher, curricular materials, date, and time of day for each instructional event. Exit slips are in a multiple-choice format and machine-scored. The vast majority of exit slips contain five questions, but some contain four or six questions. Students must answer at least 75% of questions correctly in order to “pass” and advance in their TBPP playlist. The questions on each exit slip are drawn from a library of items written by content experts employed by the non-profit organization that produces TBPP, which claims to test the validity and reliability of these items.
Across these five schools in 2015–2016, TBPP recorded data for 247,560 instructional events and 170,075 linked exit slips from 1,238 unique students and 48 teachers. Table 1 indicates the total number of instructional events for each modality, as well as the total number of linked exit slips.
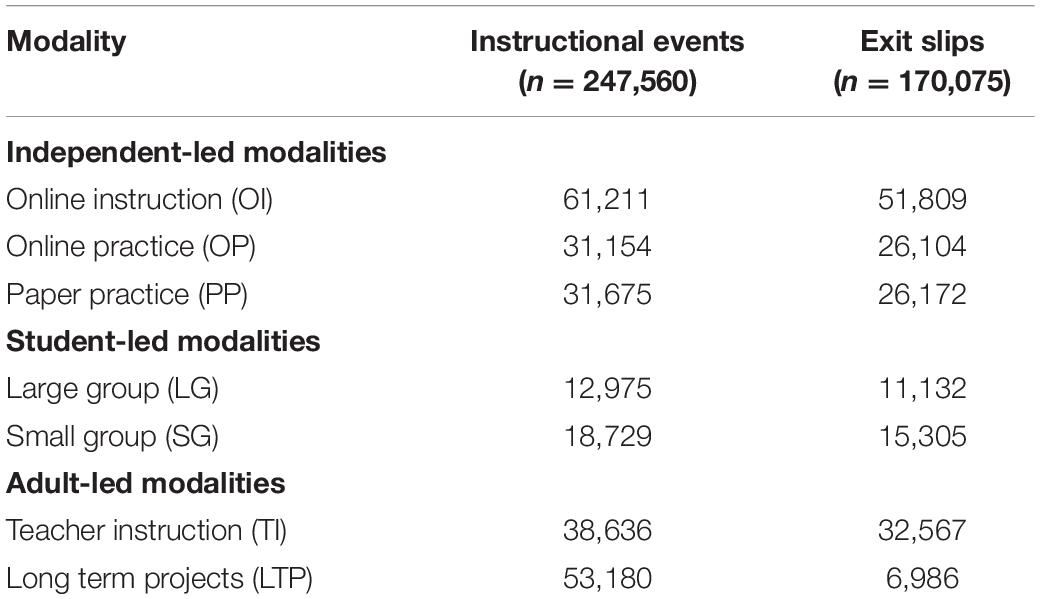
Table 1. Instructional events and exit slips per modality.
Although our data contain complete information on all independent variables, some instructional events lack data for the dependent, exit slip variable. The most prominent reason for absent exit slip data is related to the unique design of the Long Term Project (LTP) modality. Unlike most modalities, which are discrete, one-day instructional events, the LTP modality engages students in a complex, real-world task that takes multiple days to complete. Because these LTPs unfold over more than a week, TBPP only assigns an exit slip for approximately one in seven LTP lessons (usually on day two or three). Accordingly, we removed from our analytic sample the 46,194 LTP lessons not paired with exit slips, leaving a total of 201,366 instructional events and 170,075 exit slips linked to 1,238 students and 48 teachers, with 6,986 LTP lessons remaining in the dataset.
After the unmatched LTP lessons were removed, 31,291 of the remaining 201,366 instructional events lacked corresponding exit slip data. There are several reasons why an instructional event could lack a linked exit slip, including timing issues (i.e., the student ran out of time to complete the exit slip), technology issues, behavior issues, a fire drill, or a partial absence/early pickup. We tested for relationships between student-level exit slip completion and measured student characteristics, including school, grade level, gender, race/ethnicity, free- and reduced-price lunch status, limited English proficiency, special education status, and proficiency on the Fall 2015 MAP Math assessment. These analyses revealed no patterns in exit slip missingness.
Our dataset also included student-level scores on two separate standardized mathematics assessments administered during the 2015–2016 academic year. The first was the state-mandated Spring 2016 PARCC (Partnership for Assessment of Readiness for College and Careers) assessment. PARCC is criterion-based, meaning that all students are assessed using a common set of grade-level questions. We also included Fall and Spring scores on the MAP (Measures of Academic Progress) assessment, which is produced by the Northwest Evaluation Association (NWEA). In contrast to the PARCC exam, the MAP assessment utilizes a Rasch measurement model, with students measured on a continuous scale ranging from kindergarten to high school level skills. The MAP assessment is computer-adaptive, meaning that it differentiates the questions presented to each student depending on how that student performed on earlier questions. For this study, we z-scored (standardized) MAP scores within each grade at each administration.
The TBPP algorithm is designed to personalize the level of assigned content to each student’s zone of proximal development. However, the principals of the schools implementing TBPP expressed concern that, while TBPP was potentially effective at filling in gaps in students’ prior knowledge, it might not sufficiently expose low-performing students to the grade-level skills that would be covered by the state’s high-stakes standardized PARCC assessments. Accordingly, TBPP provided a dedicated test-prep period beginning several weeks prior to the PARCC exam in which the skill-level personalization component of TBPP was essentially “turned off” and all students worked exclusively on grade-level content.
Methods
Cluster Analysis
We utilized cluster analysis to identify groups of students with similar patterns of experiences across the year in both daily content assignments and outcomes on daily exit slip assessments. Cluster analysis is a descriptive data mining procedure for uncovering latent groupings within unstructured data (Romesburg, 1984; Jain et al., 1999; Alfredo et al., 2010). It has sometimes been described as a form of “quantitative phenomenology” due to its ability to display detailed and rich patterns of data within and across individual cases (Bowers et al., 2017). We chose to utilize cluster analysis because it presents several features that are well suited to our research questions. First, it is well suited to educational datasets that are highly interdependent, nested, and hierarchical, since it does not rely upon the typical assumptions associated with ordinary least squares (OLS) regression regarding multicollinearity, heteroskedasticity, and case independence, (Howell, 2002; Bowers, 2007, 2010). Since most educational data is inherently nested – for example, this study features students nested within five different schools – selecting an analytic technique that can operate upon nested, hierarchical structures is ideal. Second, it retains the granularity of the data rather than aggregating to the mean and reporting generalized trends (Bowers, 2007, 2010). This is especially valuable when studying topics with an underdeveloped research base, such as blended instructional models utilizing technology-based personalization.
There are two types of cluster analysis: supervised analysis, in which the researcher presupposes certain assumptions about the character of the groups, and unsupervised analysis, in which the nature of the groups is determined by the structure of the data itself (Eisen et al., 1998; Bowers, 2007). We chose to utilize unsupervised analysis due to the paucity of extant literature on technology-based personalization that might provide guidelines regarding the structure of the data (Wang and Woodworth, 2011; Wendt and Rice, 2013; Murphy E. et al., 2014; Pane et al., 2015).
We chose hierarchical clustering over the two most prominent alternatives, K-means clustering and self-organizing maps (Eisen and DeHoon, 2002; Jaskowiak et al., 2014). The primary disadvantage of K-means clustering is that it requires the supposition of a pre-set number of clusters prior to initiating the clustering algorithm. Since there is no reason based on the literature or theory to assume a priori a specific number of clusters, any choice would be arbitrary and could interfere with obtaining the most accurate results (Jain et al., 1999; Eisen and DeHoon, 2002). One alternative option could be to utilize principal component analysis to identify a number of clusters that represent a significant portion of data, then apply k-means clustering for the classification (Ding and He, 2004). However, there is evidence that the principal components that contain most of the variation in the data do not necessarily capture most of the cluster structure, and clustering with principal components does not necessarily improve cluster quality (Yeung and Ruzzo, 2001).
Self-organizing maps, which were invented by Teuvo Kohonen in the early 1980s, are a technique for mapping high-dimensional vectors onto a smaller dimensional space (Mangiameli et al., 1996; Eisen and DeHoon, 2002). One advantage of self-organizing maps compared to K-means clustering is that self-organizing maps do not require any prior knowledge about the structure of the data. However, while self-organizing maps are well suited to high-dimensional input spaces like data on the structure of the human brain, our data requires clustering only according to the exit slip score or content gap. Accordingly, self-organizing maps would have been a poor choice for this data, which is misaligned with the type of continuous, high-dimensional input space for which self-organizing maps are typically utilized.
Even within the family of hierarchical clustering methods, there are several linking methods and distance measures from which to select (Romesburg, 1984; Costa et al., 2002; Jaskowiak et al., 2014; Nitkin, 2018). Following the recommendations from the previous literature in this domain (Bowers, 2007, 2010; Bowers et al., 2016; Krumm et al., 2018) we used uncentered correlation as the distance metric, with average linkage as the agglomeration method. Utilizing average linkages offers several advantages over the alternative single linkage and complete linkages methods. First, it is robust to missing data (Bowers, 2007, 2010). Second, it incorporates the full range of data from each case rather than only the most similar or dissimilar measure, making it a good fit for a research question that seeks to explore the full yearlong experience for each student. Finally, average linkages is widely used within the literature, and Romesburg (1984) suggests it as the preferred hierarchical clustering method (Eisen et al., 1998; Bowers, 2007).
We first grouped students according to the similarity of the pattern of their standardized exit slip scores across the year. In addition, since exit slip scores are directly associated with each day’s assigned content, and content assignment is in turn determined by each student’s unique progression through the TBPP concepts map, we conducted a separate cluster analysis using the “content gap” of assigned lessons as the relevant set of data upon which to cluster. Because the grade-level of any given skill students encounter can be either above, on, or below their assigned (administrative) grade level, we generated a content gap measure to indicate the difference between the grade level of the instructional content for each lesson and the student’s assigned grade level. For example, lessons delivered to a sixth-grade student featuring fourth, fifth, or sixth grade content would be coded −2, −1, or 0, respectively. In sum, keeping with Krumm et al. (2018), we addressed our research questions by analyzing the data in two different ways: first, with students grouped according to similarity in the pattern of their exit slip scores, and second, according to similarity in the pattern of the content levels assigned to them by the TBPP algorithm.
Cluster Trees and Heatmaps
We utilized cluster trees and heatmaps as visual analytic techniques to explore the clusters generated using hierarchical cluster analysis. Our first data visualization technique utilized cluster trees to represent the degree of similarity across clusters, providing a physical representation of whether distinct groups of students experienced TBPP in specific, disparate ways. Cluster trees, which are sometimes also known as dendrograms, use lines to link cases and clusters of cases based on their similarity to one another (Romesburg, 1984; Eisen et al., 1998). The algorithm places cases and clusters closest to those with which they are most similar, enabling the reader to use the length of the connecting line as a proxy for the quantitative similarity of the underlying data.
Our second data visualization technique entailed a form of heatmap known as a clustergram. First pioneered in the field of bioinformatics, clustergrams represent the variables of interest with blocks of color, aiding the human eye in quickly and efficiently detecting patterns across cases (Eisen et al., 1998; van’tVeer et al., 2002; Bowers, 2007, 2010, 2021; Wilkinson and Friendly, 2009). A clustergram typically displays cases as rows and data categories as columns. For our analysis, rows represent students and columns represent modalities, lessons, days of instruction, or months of instruction. Each individual data point is represented by a color that reflects its value, with red indicating higher values and blue indicating lower values. Accordingly, the clustergram enables us to visualize the complete learning trajectory of each student longitudinally across the year. Cluster analysis and heatmap visualization were completed using RStudio 1.0.143 software using the ComplexHeatmap package (Gu et al., 2016).
The list below summarizes our analytic process, drawing heavily from Romesburg (1984) and Bowers (2007):
(1) Convert clustering variables (i.e., exit slip or content assignment) onto a standardized scale
(2) Create a resemblance matrix by calculating a distance measure between every case
(3) Combine the two most similar cases into a cluster
(4) Recalculate the resemblance matrix
(5) Iterate over steps 3 and 4 until all of the cases are clustered into one cluster, e.g., n-1 times
(6) Rearrange the order of the cases on the basis of their similarity according to the results of step 5
(7) Draw the dendrogram
(8) Draw the clustergram
(9) Interpret the clusters
The clustering algorithm begins by matching the most similar cases based on the similarity of their respective data. These two cases are then redefined as a cluster, and the resemblance matrix is recalculated with the new cluster serving as a case. This process continues iteratively, with cases grouped into larger and larger clusters, until the clustering algorithm defines all cases as belonging to a single cluster encompassing the entire population of cases. This requires n-1 iterations, with n representing the total number of student cases. The clustering process does not change the underlying data for each case, but instead reorganizes them so that similar cases are grouped together.
One important feature of clustergrams is their ability to link dichotomous outcome variables to individual cases. In the bioinformatics literature, this technique is used to explore whether groups of genes are associated with the appearance of certain tumors, facilitating the development of diagnostic methods and treatments (Eisen et al., 1998; van’tVeer et al., 2002; Gu et al., 2016). Within the field of education, variables like high school completion and ACT attempts have been used as dichotomous outcomes (Bowers, 2007, 2010). For this study, our clustergrams include three outcomes: (1) student scores on the Fall 2015 NWEA MAP math assessment; (2) student proficiency levels on the Spring 2016 PARCC math assessment, and (3) a dichotomous variable reflecting whether a student met the “typical growth” norm published by NWEA for the period between Fall 2015 and Spring 2016. These analyses enable exploration of potential relationships among various elements of the TBPP model and student outcomes, and in particular, the extent to which daily content assignment or exit slip data predict end-of-year results on the PARCC and MAP assessments. They also enable us to explore whether the results differ for clusters of students, including latent groups that may not be identifiable based on available indicators.
Results
Results by Instructional Modality
We first explored the relationship between learning modalities and student outcomes on daily exit slips (see Figure 2). This data visualization displays the mean standardized exit slip score for each student (rows) disaggregated by the seven instructional modalities utilized by TBPP (columns). Mean exit slip scores are represented by color blocks, with blue representing the bottom of the scale (cooler), red representing the top of the scale (hotter), and purple representing the population mean. The similarity or dissimilarity of the patterns of exit slip outcomes is represented on the far left of the heatmap by the hierarchical dendrogram, or cluster tree, with longer horizontal lines indicating more dissimilar patterns and shorter lines indicating more similar patterns of student data. On the far left of the heatmap, we used numbers to label each of the most apparent data clusters.
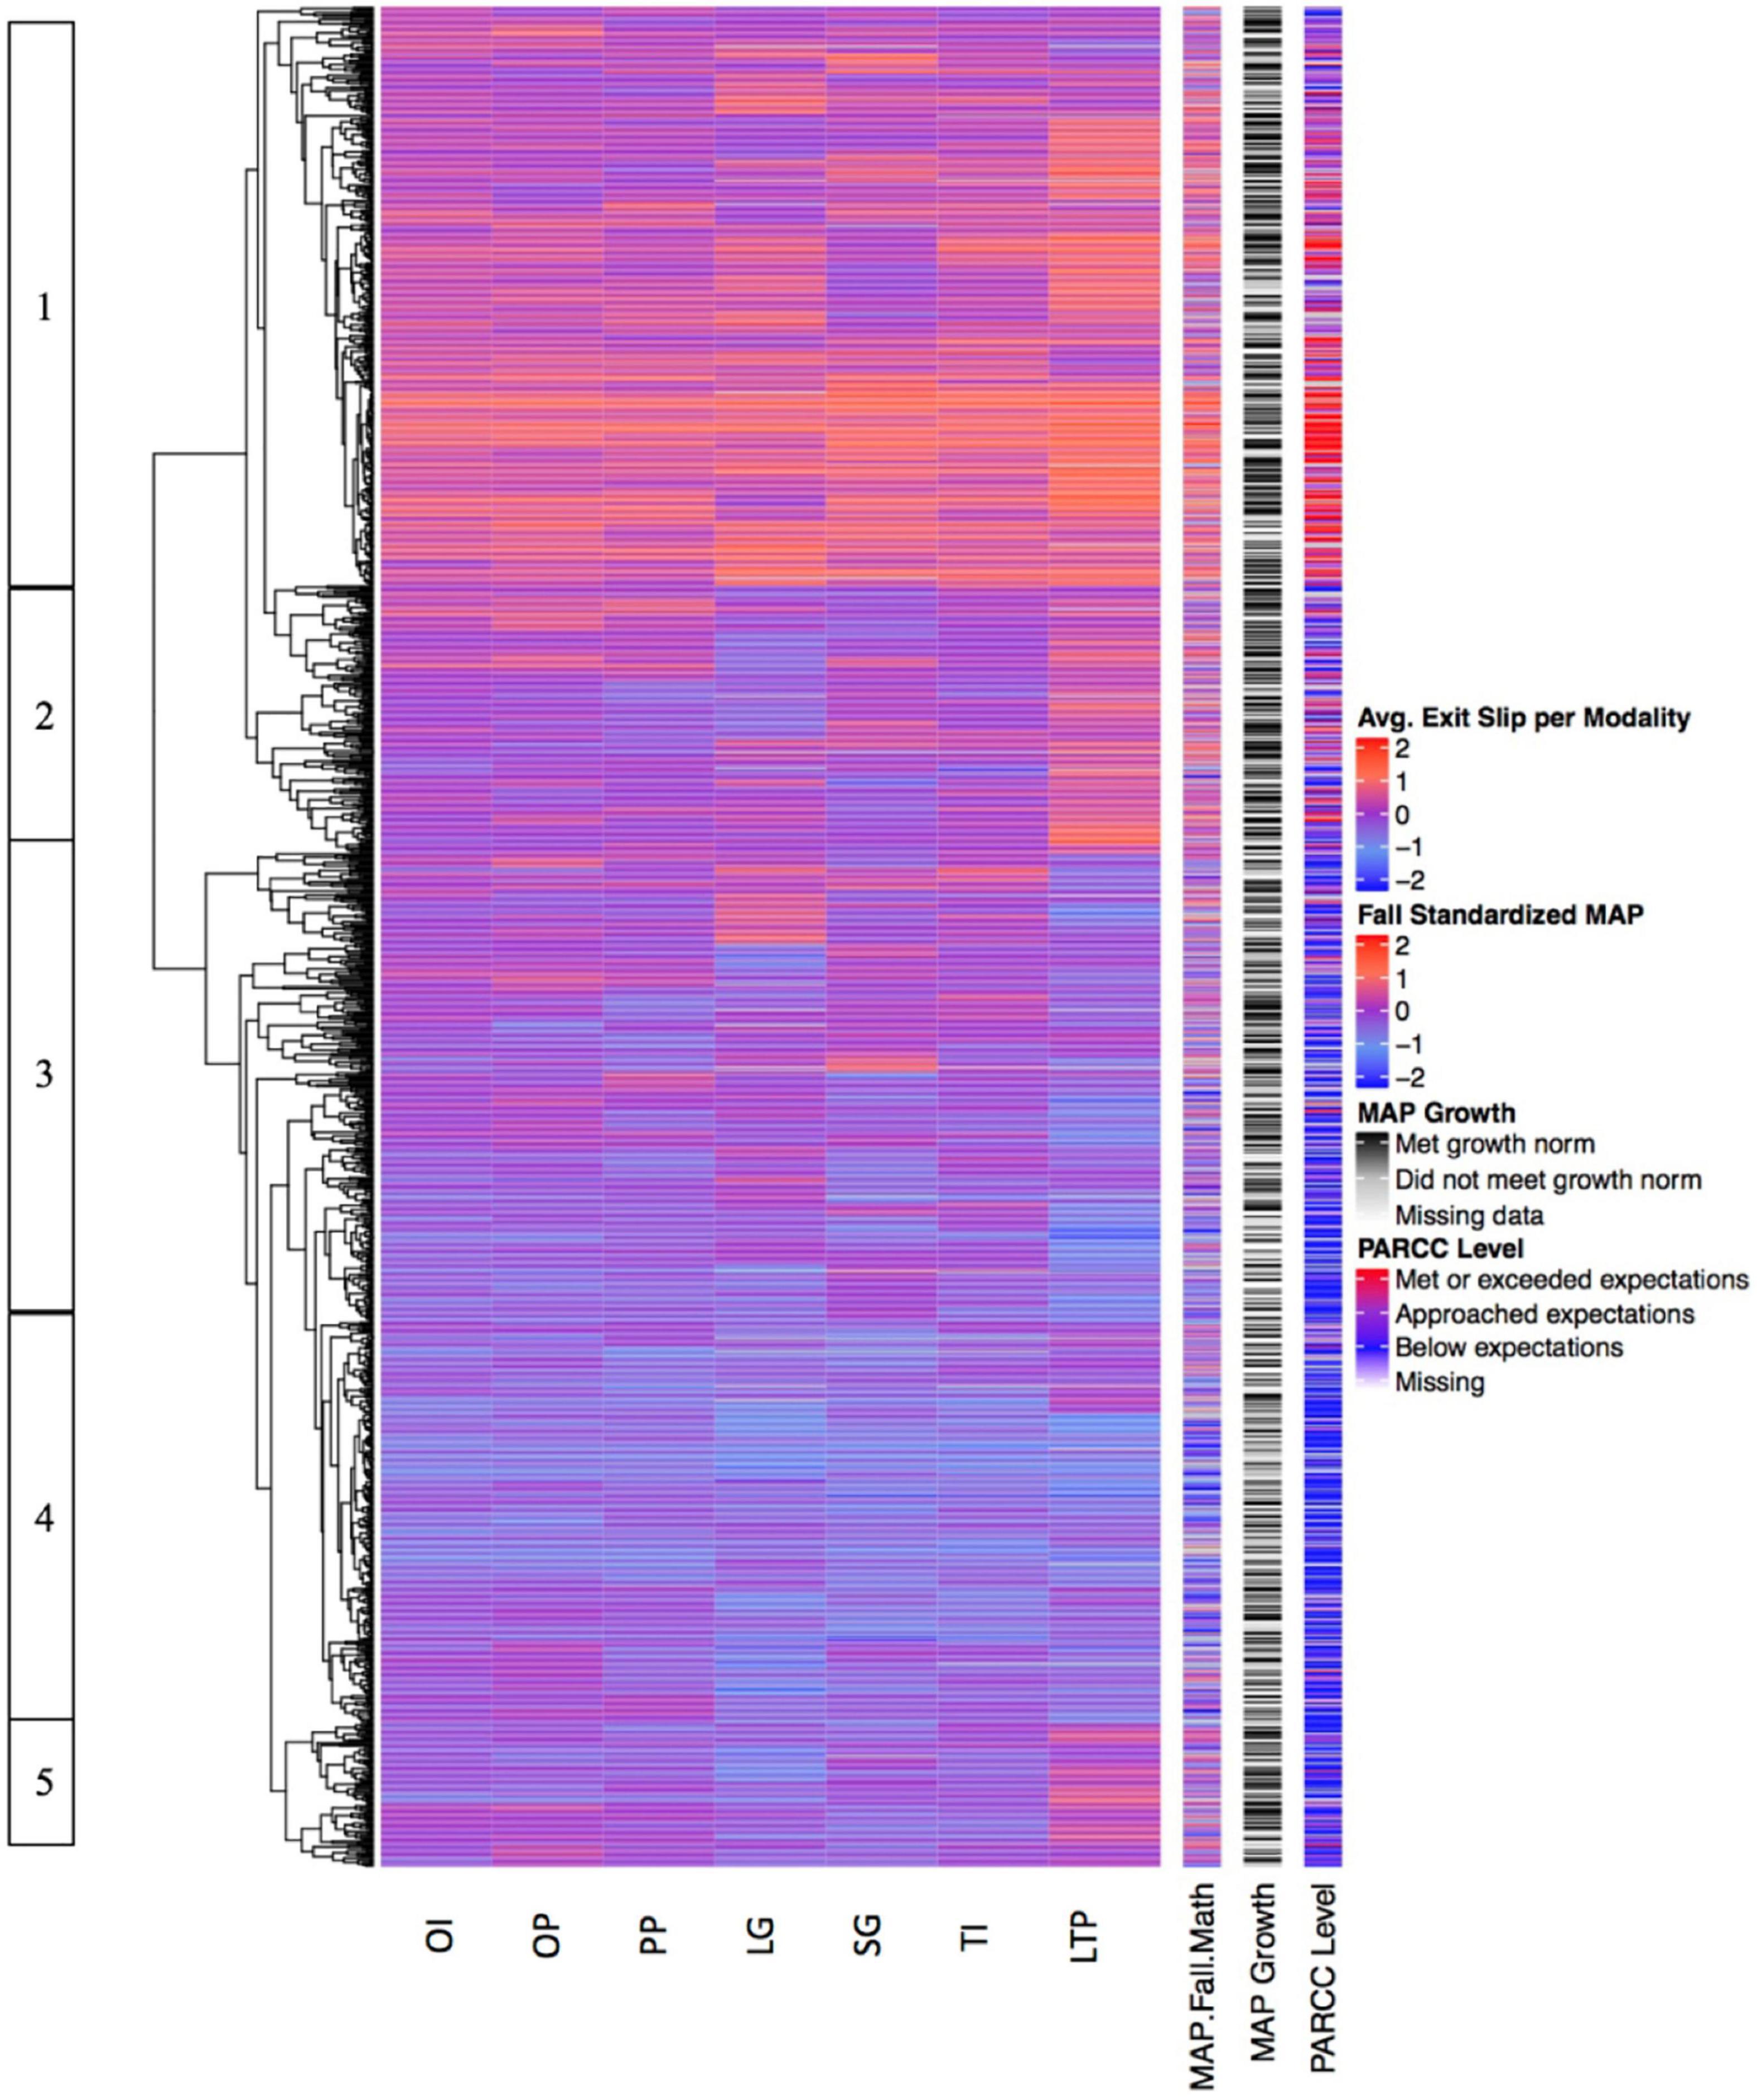
Figure 2. Standardized exit slip performance disaggregated by instructional modality.
The three annotation columns on the right of the heatmap indicate each student’s standardized score on the Fall 2015 MAP math assessment, growth from the Fall 2015 to Spring 2016 MAP math assessment, and performance on the Spring 2016 PARCC math assessment. These annotation columns enable comparison between students’ exit slip patterns and their baseline mathematical ability prior to entering TBPP, growth in mathematical skills over the course of a year of participating in TBPP, and mathematical ability after a year of participation in TBPP, respectively.
Figure 2 features two large “super-clusters” of students: one containing Clusters 1 and 2, and a second containing Clusters 3, 4, and 5. Cluster 1 contains the highest performing students. Given the heights of the cluster trees, the students that perform highest on exit slips (Cluster 1) are more similar to each other than students in any other cluster. Cluster 2 is typified by students who perform at the same high level in the long-term project (LTP) modality as students in Cluster 1, but lower in all other modalities and on PARCC. Cluster 3 features high variance and includes multiple small subclusters of students with common patterns in their exit slip performance across modalities. For example, one subcluster contains students who perform particularly well in the large group (LG) modality, while another includes students whose highest performance is in the small group (SG) modality. Cluster 4 contains the lowest performing students. Like Cluster 2, Cluster 5 also contains students who performed better on LTP than on any other modality, but students in this cluster performed lower than those in Cluster 2 on all other modalities and PARCC.
There are several important takeaways here. First is the high level of alignment among exit slip performance, Fall 2015 MAP score, and Spring 2016 PARCC level. This is evident in the general consistency of the horizontal color bands, with blue, purple and red appearing synchronized across the three measures. For example, Students in Cluster 1 score high on daily exit slips, Fall 2015 MAP, and Spring 2016 PARCC, while students in Cluster 4 have lower scores on all three measures. This consistency indicates that students who enter TBPP with stronger mathematics skills are more likely to succeed on daily exit slips and also more likely to end the year proficient in grade-level mathematics content, as assessed by PARCC. The relationship between beginning-of-year and end-of-year mathematics performance is not surprising, given the well-documented difficulty of disrupting entrenched student achievement gaps. What is surprising, however, and absolutely central to our understanding of this personalized learning model, is that these measures are also related to daily exit slip performance. TBPP is designed to match each student with daily content at his or her precise zone of proximal development, which should make all students equally likely to master that day’s exit slip, regardless of their starting level. Figure 2 may suggest that high-performing students are routinely matched with “too-easy” content and low-performing students with “too-hard” content. Alternately, it may indicate that there is some quality possessed by higher-performing students beyond simple mathematical ability, such as motivational levels or social-emotional skills, that makes them more likely to succeed on the daily exit slips.
Figure 2 also suggests close relationships between students’ performance across all modalities. In other words, students in Cluster 1 are generally successful on exit slips in all modalities, while students in Cluster 4 are generally unsuccessful in all modalities. However, there are some exceptions to this rule. For example, students in Clusters 2 and 5 appear to be more successful in the LTP modality than in other modalities, while the students in Cluster 3 appear less successful in LTP than in other modalities. We draw on existing literature to discuss potential reasons for this pattern in Section “Lower Personalization but Higher Performance in the Long-Term Project Modality” below.
The analysis in Figure 3 above is similar to that of Figure 2, except that the heatmap data represents the content gap, or mean difference between each student’s grade level and the grade level of the instructional content assigned to them within that modality rather than mean exit slip performance. This enables an examination of the pattern of content assignment for each student within each modality, as well as the relationships between content assignments and performance on Fall 2015 MAP, year-long MAP growth, and Spring 2016 PARCC.
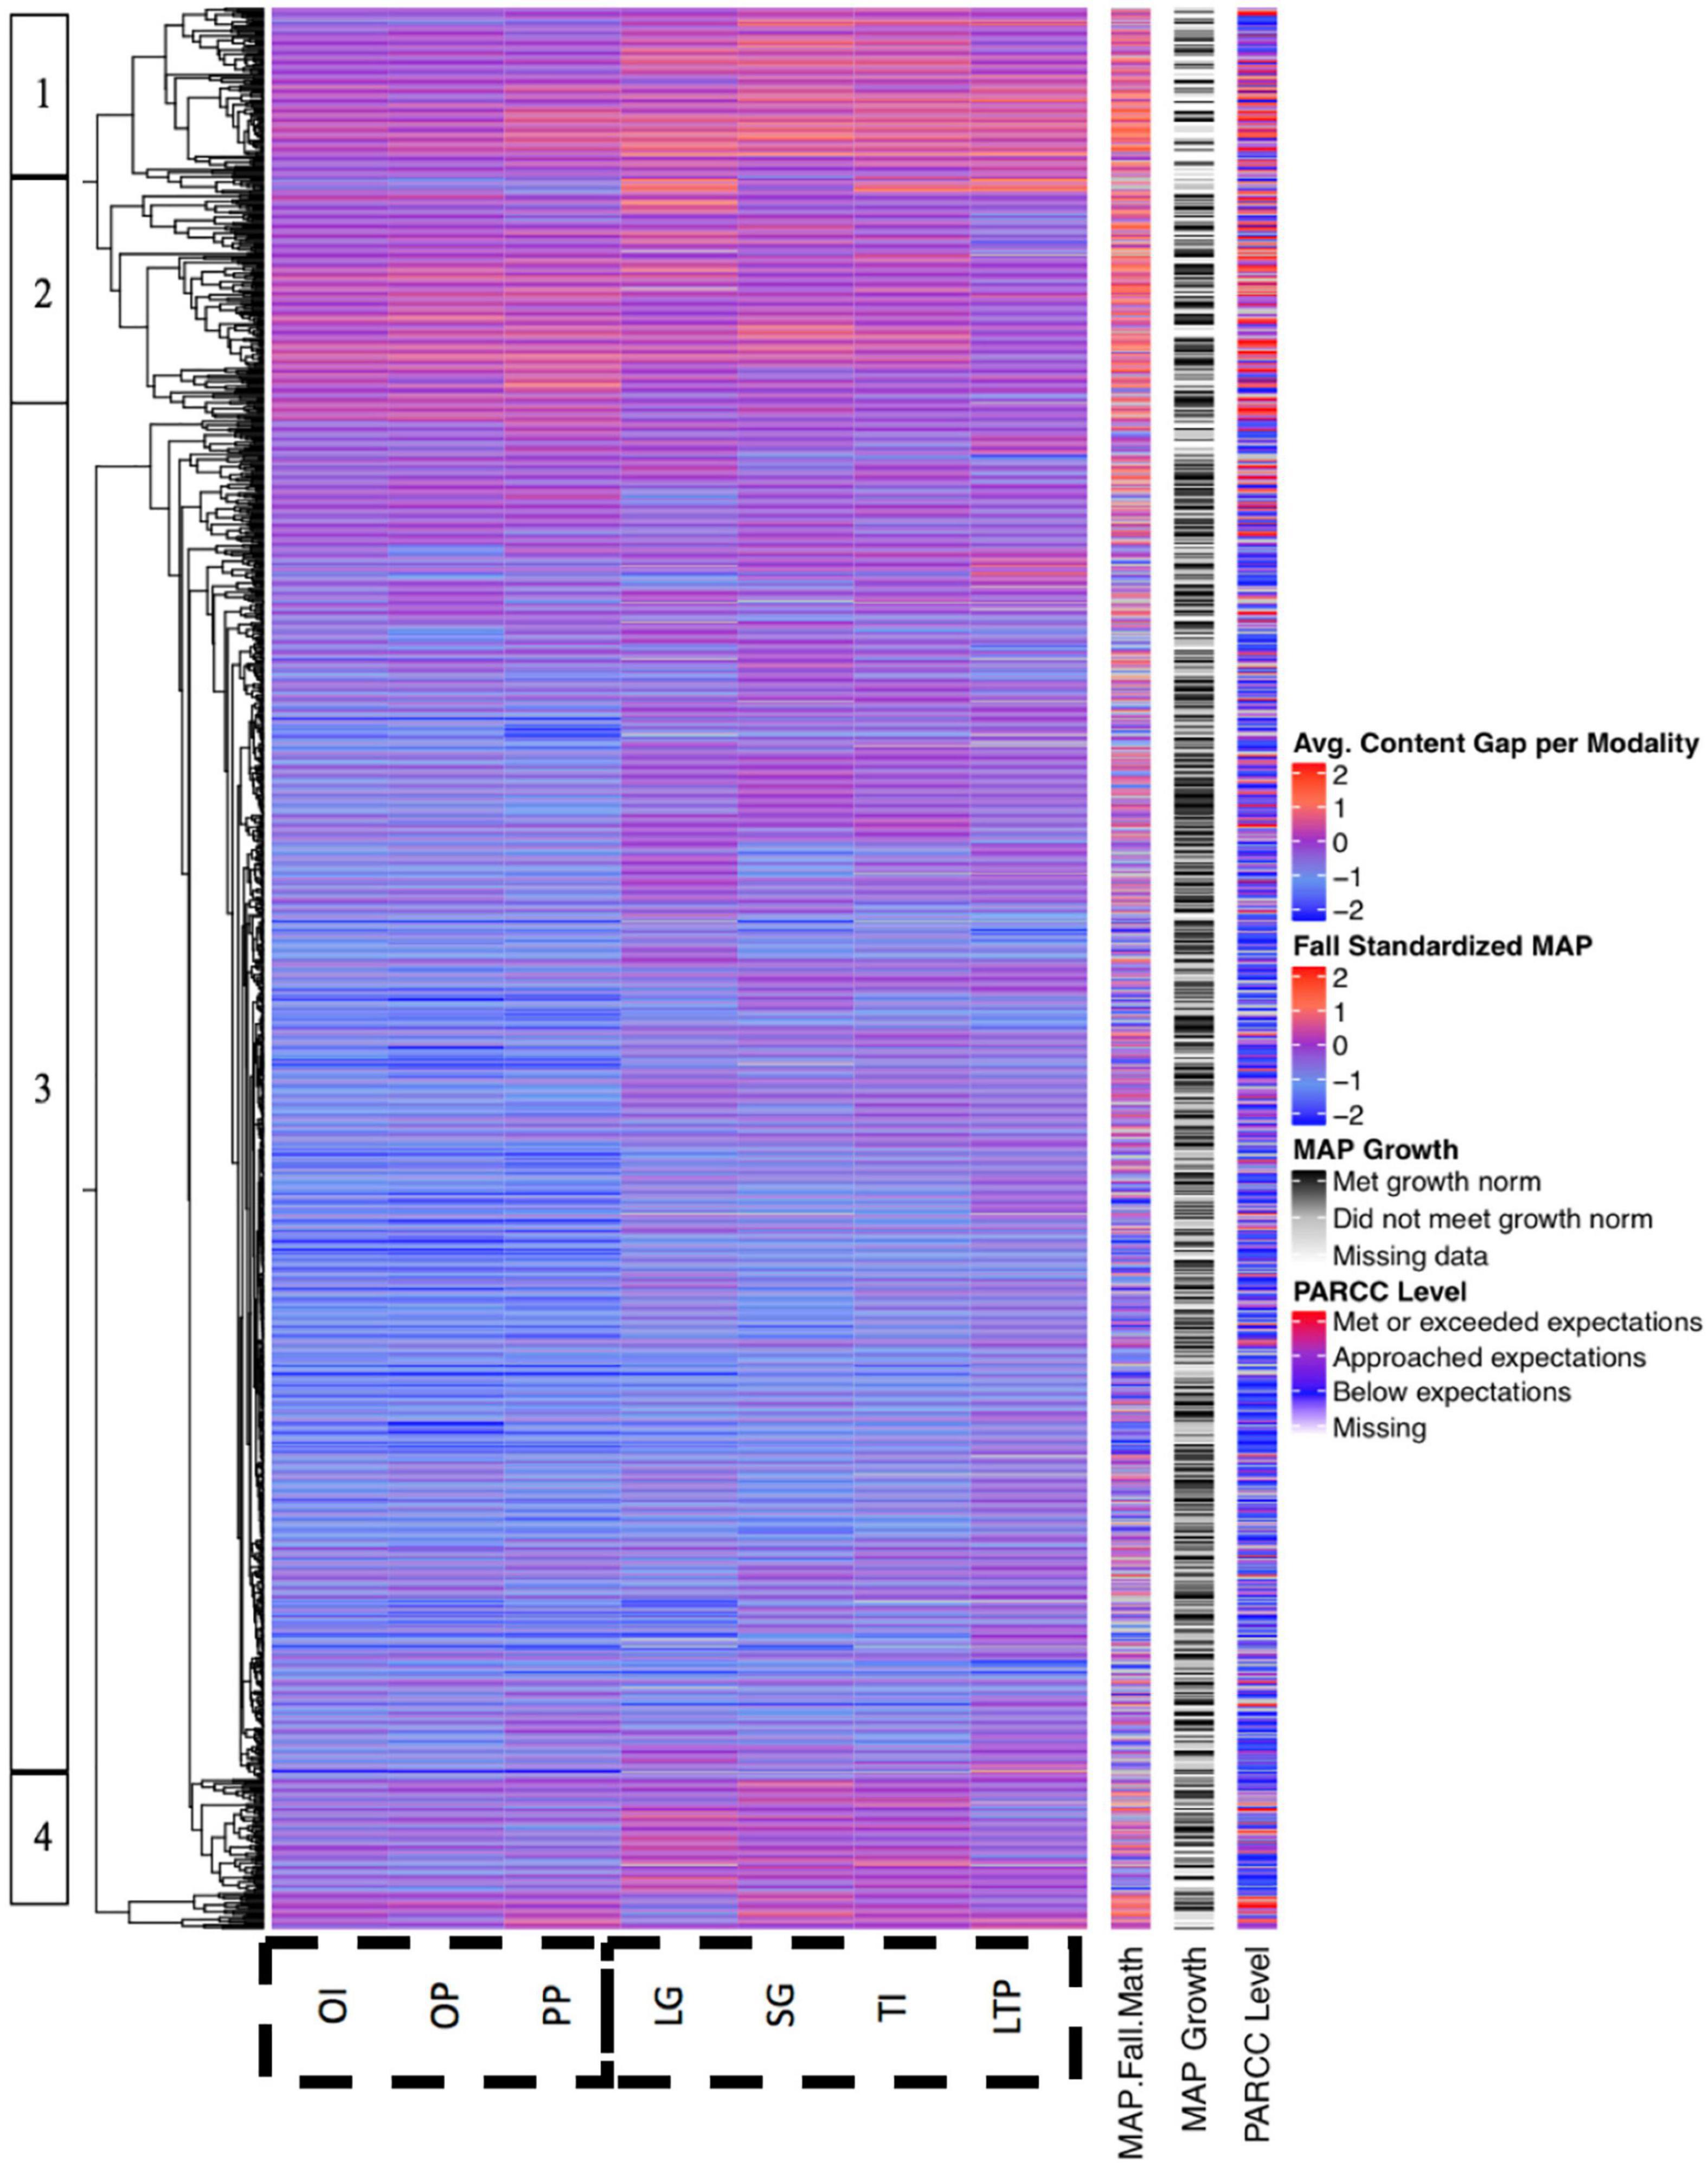
Figure 3. Content gap disaggregated by instructional modality.
Figure 3 contains four major student clusters of students. Cluster 1 is typified by students who were generally assigned above-grade-level content in all modalities; not surprisingly, they scored high on both the PARCC and MAP. Cluster 2 also contains students who scored high on PARCC and were assigned above grade-level content, with the exception of the LTP modality, where they were assigned mostly on-grade level content. Cluster 3 contains students who scored low on PARCC and received mostly below-grade level content, and Cluster 4 contains students who were assigned above-grade level content in only the LG, SG, and TI modalities.
Figure 3 indicates several interesting trends. First, the higher frequency of blue than red within the heatmap indicates that more instructional content was assigned below students’ grade levels than above their grade levels. This is unsurprising, given that student achievement levels in this high-poverty district are below national norms. However, a meaningful amount of students – perhaps 10–20% – are also consistently assigned content that is above their grade level. Even in this generally low-performing district, a meaningful minority of students appear ready for above-grade-level content. Second, the heatmap indicates a close relationship between students’ Fall 2015 MAP scores and the level of the content assigned to them. For example, students in Cluster 1 generally performed above the mean on Fall 2015 MAP and were assigned above-grade level content, which is indicated by red shading on both measures, whereas students in Cluster 3 were both more likely to perform below the mean on Fall 2015 MAP and to be assigned below-grade level content. This is in keeping with the theory of action for TBPP, which uses Fall 2015 MAP data to initially assign “just right” content to each student.
The heatmap also indicates a difference in the level of the content assigned for the three modalities in which students work independently (OI, OP, and PP) compared to those in which students work in groups (LG, SG, TI, and LTP). Specifically, students in Clusters 3 and 4, who are generally lower-performing, were assigned lower content for the independent modalities than the group modalities. This pattern may reflect the logistical challenge of generating a “right-fit” assignment for each student within group modalities. Although the TBPP algorithm can assign students in the OI, OP, and PP modalities to work on any content at any time, the TI, LTP, LG, and SG modalities all require a critical number of students be able to work on the same content simultaneously. Accordingly, TBPP’s scheduler may be forced to routinely place lower-performing students in groups focused on content that is too difficult (e.g., Cluster 3). Similarly, the fact that Cluster 2 exhibits bluer shading for the LTP modality than the other six modalities indicates that logistical constraints may have routinely force these students into groups focused on content that is below their zone of proximal development.
Longitudinal Analyses
We also generated several heatmaps to examine longitudinal patterns of student performance across the academic year. In Figure 4 below, the heatmap displays standardized exit slip scores for each student (rows) for each of 165 instructional days ranging from September 24, 2015 to June 20, 2016 (columns). As in Figure 2, standardized exit slip scores are represented by color blocks, with blue representing the bottom of the scale, red representing the top of the scale, purple representing the population mean, and gray representing missing data. The other elements of Figure 4, including the cluster trees, Fall 2015 MAP math data, MAP growth data, and Spring 2016 PARCC data are also generated and displayed in the same manner as in the previous analyses.
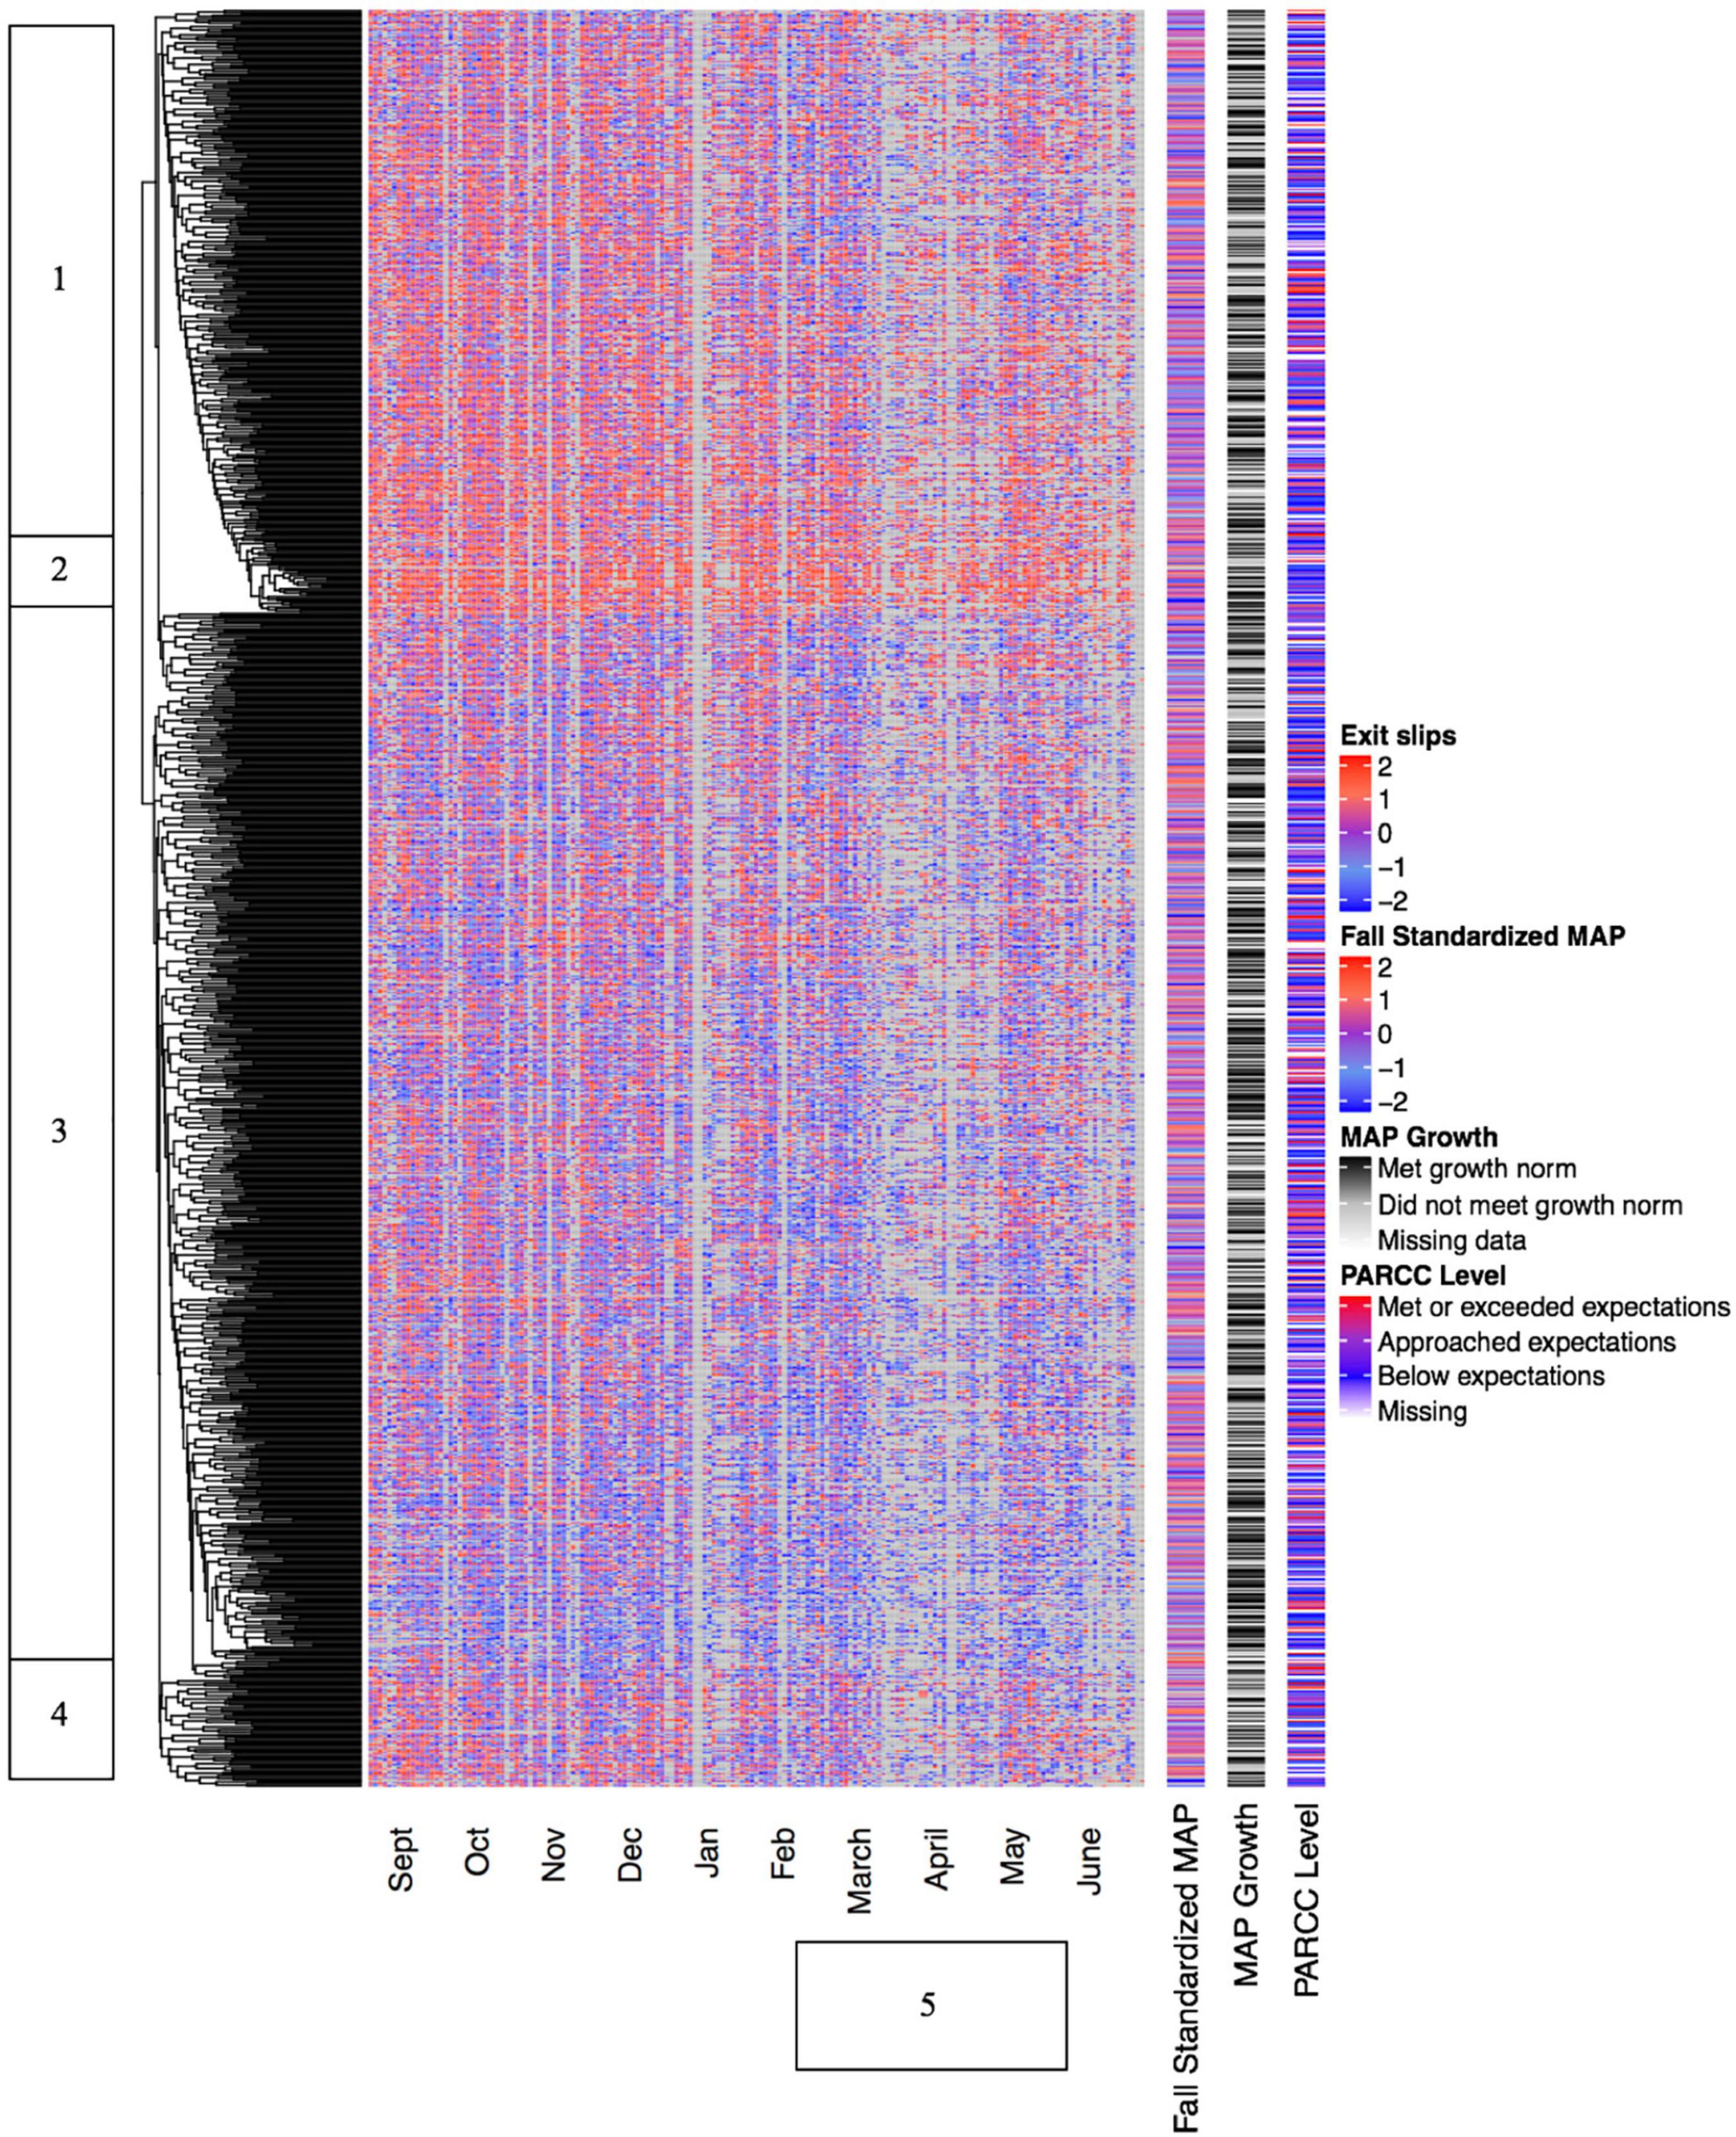
Figure 4. Standardized daily exit slip scores displayed longitudinally.
Figure 4 indicates the presence of several distinct clusters of students. Students in Cluster 1 appear to have been generally successful on exit slips at the start of the year, but to have experienced declines in performance as the year progressed. This may be related to the implementation of PARCC test prep around Day 130 of instruction, which is indicated by the vertical bar labeled “5;” in other words, these students may have been successful when matched with (appropriate) below-grade level content at the start of the year, but struggled when the launch of test prep forced them to work exclusively with grade level content. Alternately, it may reflect an increasing level of challenge as the rigor of lessons gradually increased over the course of the year, or general fatigue as the year wore on. In contrast, the students in Cluster 2 continued to experience significant success across the entire year, while the students in Cluster 3 struggled across the entire year. It is worth noting, however, that the vast majority of students appear to have experienced both high and low scores on exit slips, indicating that each individual’s performance could vary greatly from day to day. In contrast to the modality-based heatmaps in Figures 2, 3, there does not appear to be a strong relationship between year-long outcomes and the clusters of longitudinal data.
Figure 4 also contains several distinct vertical bands in which significant amounts of data appear to be missing. These bands occur throughout the year, with obvious sets of missing data during the December/January holidays and in the months of March, April, and May. This second segment may be associated with the implementation of test prep during the run-up to Spring PARCC testing. For example, teachers may have had students “take a break” from using TBPP so that they could take practice tests or otherwise ready themselves for the high-stakes PARCC exam. Missing data are also more common in June, when students were likely to be engaged in non-instructional activities such as field trips or end-of-year celebrations. It is worth noting that this pattern of missing data at specific times in the year would likely have been difficult to identify had we not used clustergram data visualization as an exploratory statistical technique. This underscores the power of visual analytics to reveal otherwise unexpected trends in large, unstructured datasets.
Figure 5 also displays data longitudinally, but uses the instructional content level of each lesson to cluster students rather than standardized exit slip scores. As described above and as in Figure 3, the content gap is calculated as the difference between the content level assigned for a daily lesson and the student’s grade level, enabling apples to apples comparisons across grade levels. In this heatmap, the color red is associated with content that is assigned above the student’s grade level, the color blue is associated with content that is assigned below the student’s grade level, and the color purple is associated with content assigned at the student’s grade level.
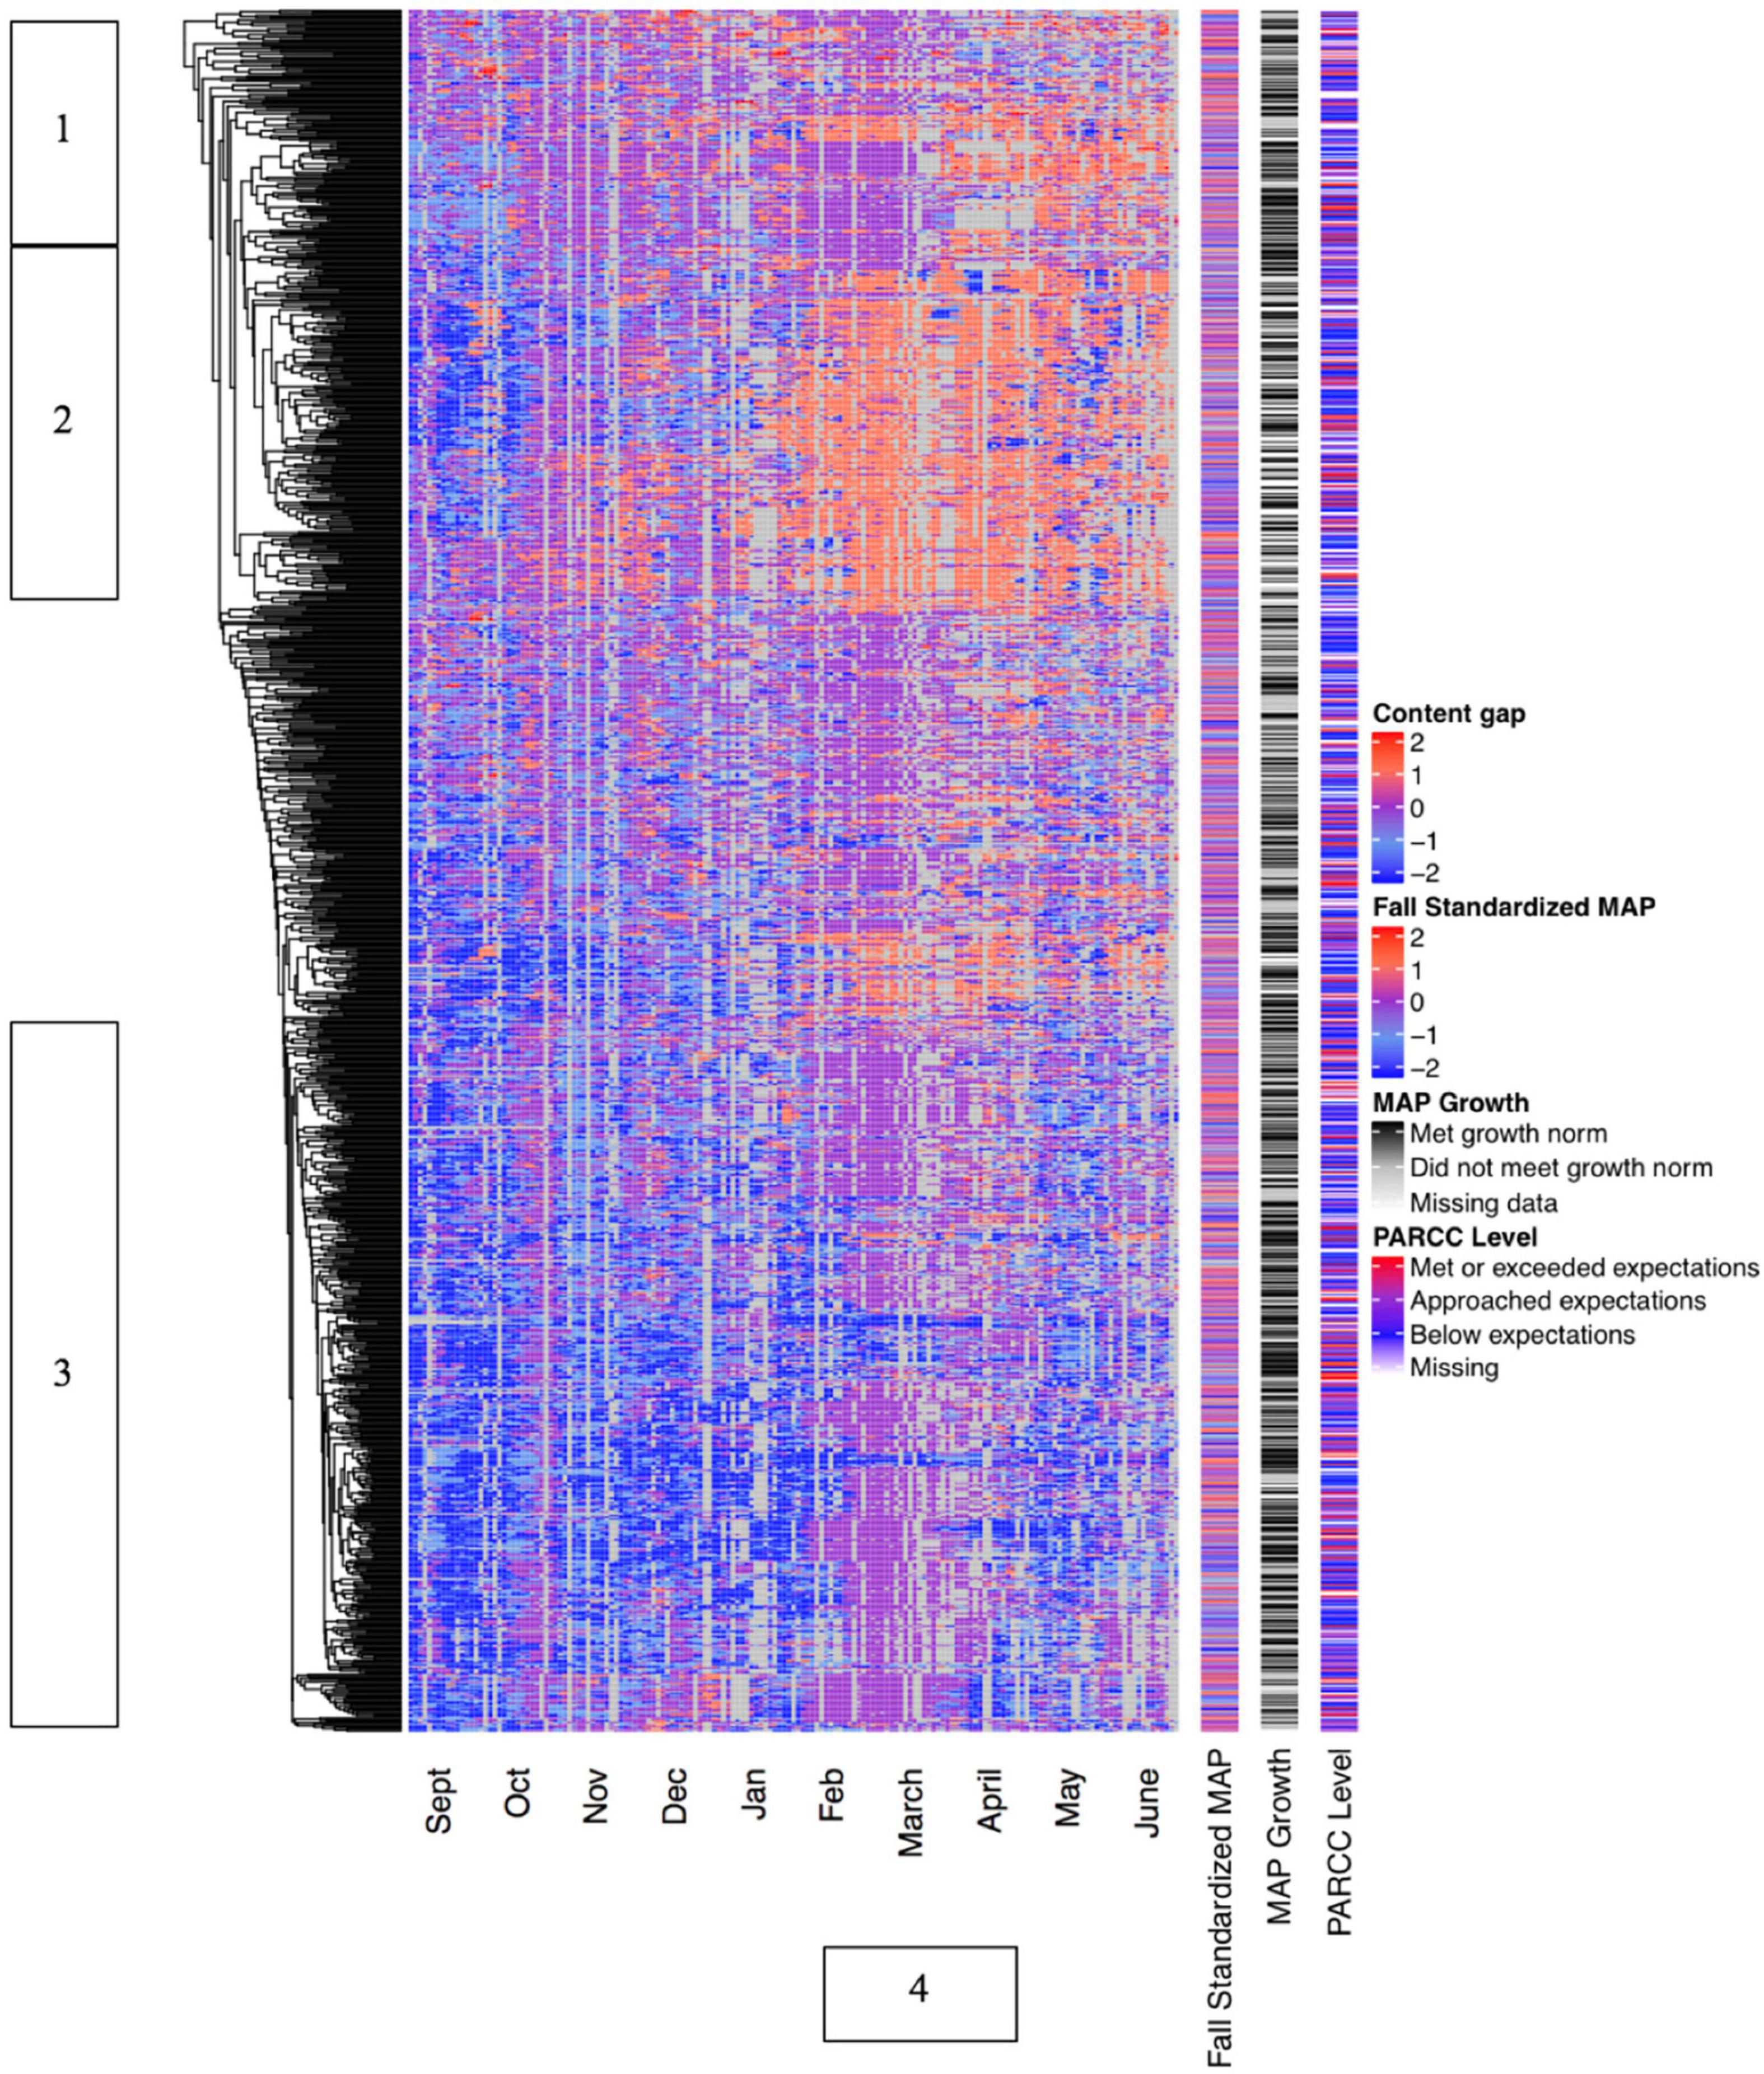
Figure 5. Content gap displayed longitudinally.
The clustergram in Figure 5 contains several distinct clusters of students. Cluster 1 represents students who spent most of the year working with on-grade level content, and for whom a sub-cluster moved to mostly above-grade level content in the final third of the year. Fittingly, the MAP growth data indicates that these students were slightly more likely to meet their annual MAP growth goals than was the student population as a whole. The students in Cluster 2 began the year working with mostly below-grade level content, but were assigned above-grade level content once test prep began in February, and for the most part continued to work with above-grade level content for the remainder of the year. In contrast, the students in Cluster 3 began the year working with below-grade level content, shifted to on-grade level content in February, then reverted to below-grade level content once PARCC testing was complete in May. The blank space between Clusters 2 and 3 represents an area of many small subclusters for which we did not detect clear patterns. Interestingly, some of the students in Cluster 3 appear to have met or exceeded expectations on the Spring 2016 PARCC assessment. This may validate TBPP’s theory of action that personalized instruction that “backfills” below-grade level skills can support students’ performance on assessments of grade-level standards.
Figure 5 also contains a very clear marker for the period when test prep began, which we have labeled as vertical Cluster 4. During this period, almost all students were assigned content that was on or above their grade level. This is evidence of how the policy constraint of high-stakes testing may have forced a modified implementation of TBPP by requiring students to engage in on- or above-grade level content even if the personalized algorithm assigned lower content during the rest of the year.
Longitudinal Analyses Grouped by Month
We also conducted a second set of longitudinal analyses with exit slip scores and content levels aggregated by month rather than displayed individually for each day (see Figures 6, 7). Aggregating the data by month improves the function of the clustering algorithm and supports the generation of clearer and more distinct clusters. This is apparent in the longer horizontal lines in the dendrograms of Figures 6, 7 compared to Figures 4, 5, indicating a greater degree of distinctiveness across clusters. It is also apparent in the tighter relationship between the heatmap data and the PARCC data in both Figures 6, 7. Aggregating the data by month also eliminates the “blotchiness” created by missing data in Figures 4, 5, making the heatmaps easier to read and more visually accessible.
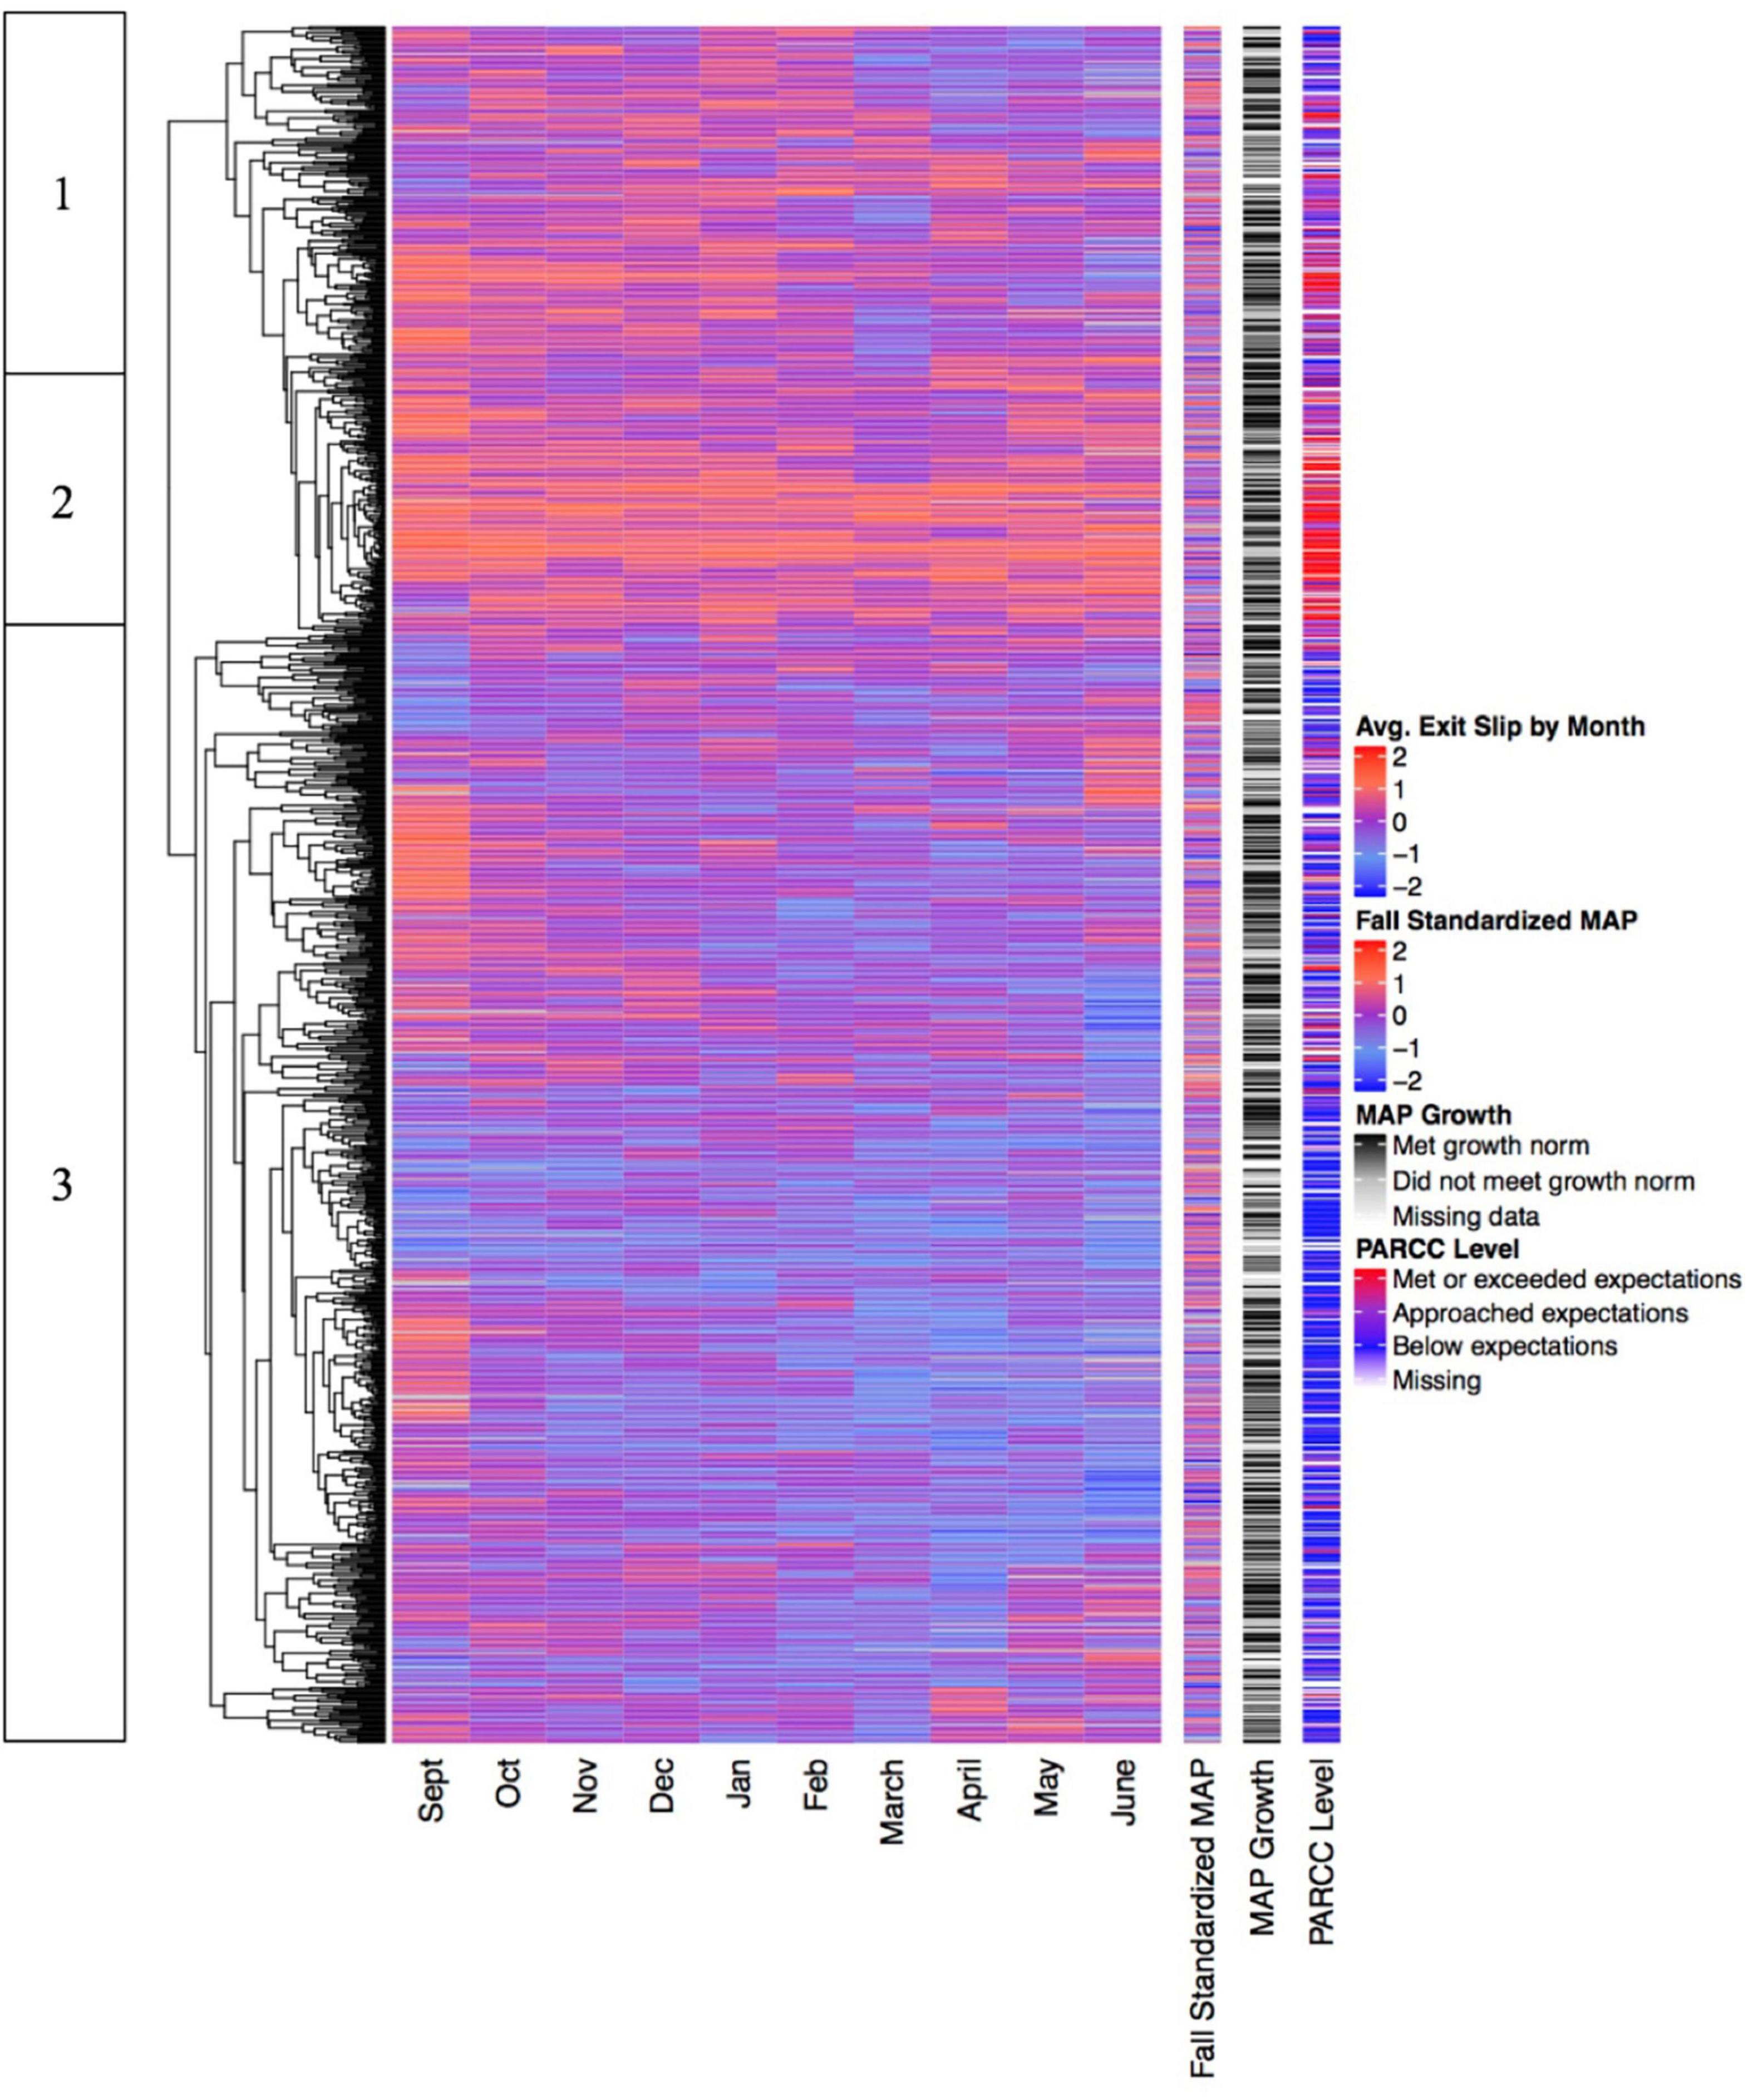
Figure 6. Standardized exit slip scores displayed longitudinally with monthly groupings.
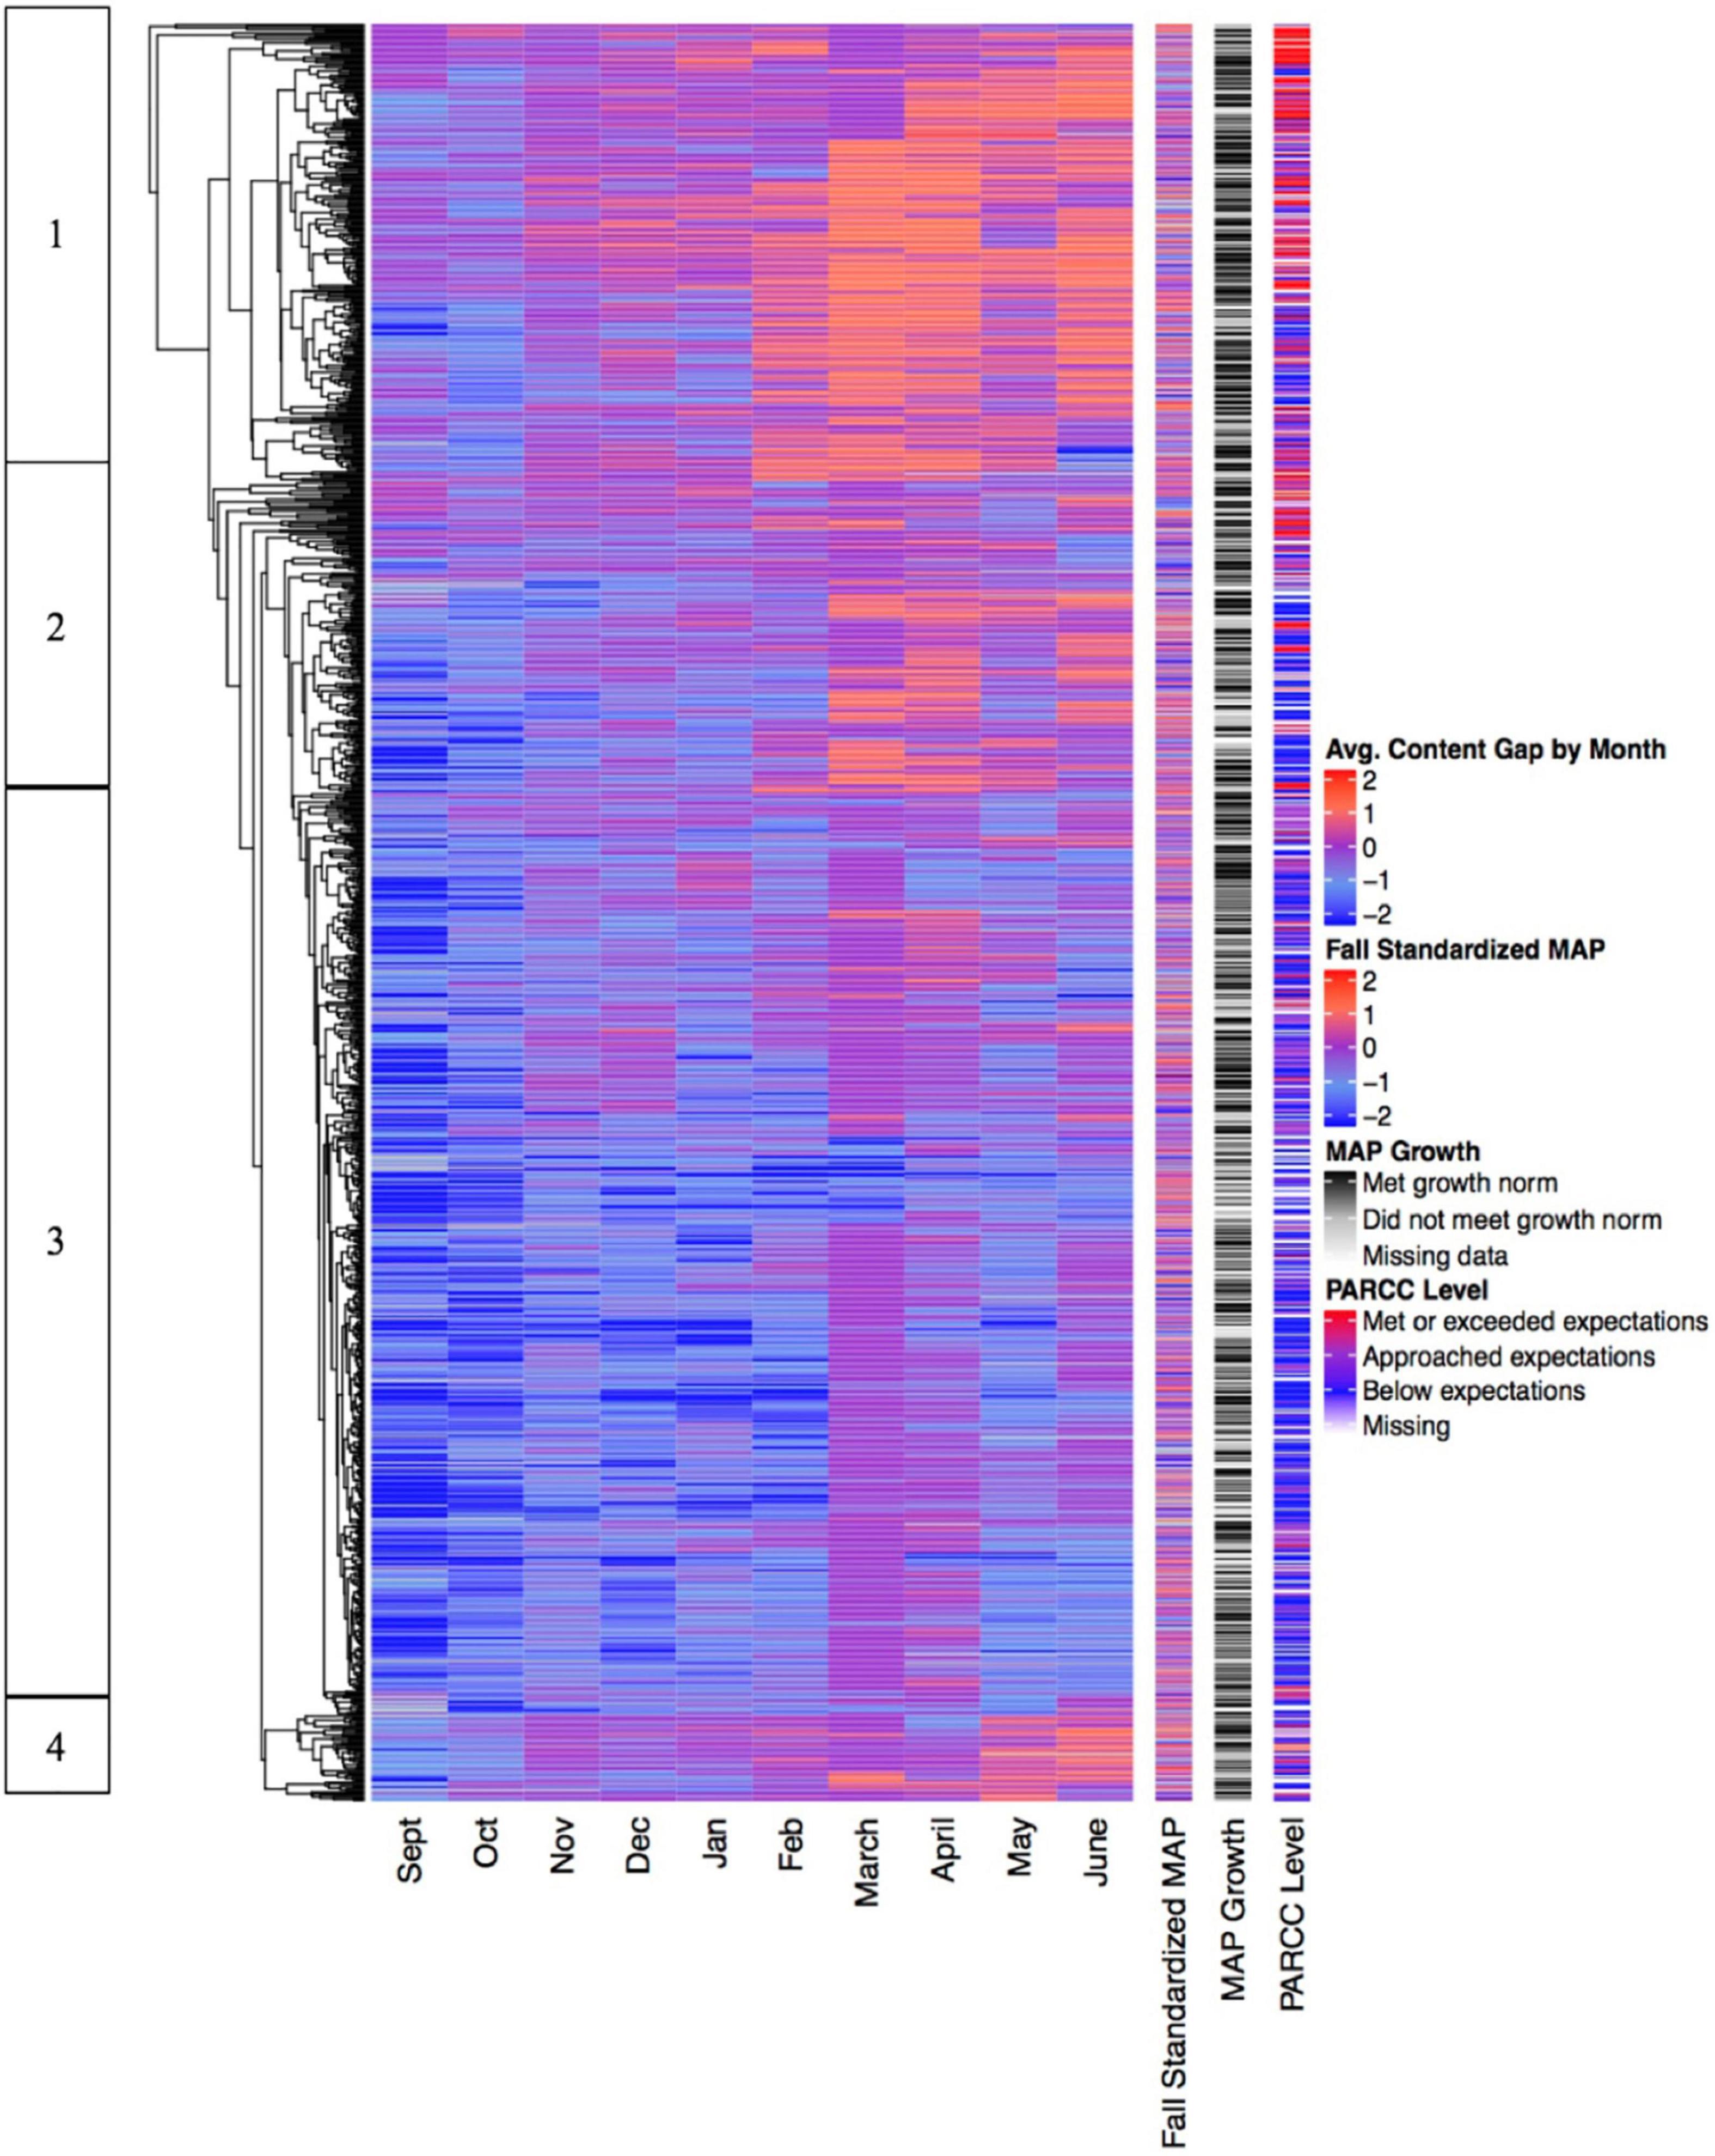
Figure 7. Content gap displayed longitudinally with monthly groupings.
The clusters of students in Figures 6, 7 are similar to those found in Figures 4, 5, but more distinctly demarcated. Students in Figure 6, Cluster 1 mostly began the year with high exit slip scores, but their performance gradually declined, perhaps in tandem with the assignment of increasingly challenging content during PARCC test prep. Students in Cluster 2 experienced the highest exit slip scores across the year, while students in Cluster 3 experienced relatively low exit slip scores in every month but September. The relationship between exit slip scores and PARCC performance in all three clusters provides a striking demonstration that different groups of students appear to have widely divergent experiences with TBPP. For the students in Cluster 2, engagement with TBPP seems associated with significant daily success, as indicated by high average exit slip performance every month. Unsurprisingly, these consistently high-performing students were also the most likely to be proficient on the end-of-year PARCC assessment. However, the students in Cluster 3 had very different experience with TBPP. They typically scored lower on exit slips and were also much less likely to pass the PARCC assessment. Their relatively low exit slip performance suggests either that TBPP routinely matched these students with content that was above their zone of proximal development, or that there was some factor other than content difficulty that made them less likely to succeed on exit slips than the students in Cluster 2.
Figure 7 also features several distinct clusters of students. Individuals in Cluster 1 began the year with content below or on grade level, but experienced rapid increases in the level of content assigned to them. Students in this cluster were most likely to pass the PARCC math assessment, and also appear most likely to achieve their MAP math growth targets. Students in Clusters 2 and 4 also experienced some longitudinal increases in the level of content assigned to them, but their content assignments did not rise as quickly or as high as the students in Cluster 1. In contrast, the students in Cluster 3 were assigned below grade-level content all year long, with the exception of March and April, where the effects of test prep on content assignment are clearly apparent, and June, when the algorithm may have previewed content for the upcoming year. Students in Cluster 3 were also much more likely to fail the PARCC math assessment than all other students. Unlike in Figures 2, 3, there is a relatively low level of relationship between Fall MAP Math scores and the other measures reflected in the heatmap. A final interesting feature in Figure 7 is the considerably lower level of content assigned to all students in September compared to the rest of the year. This suggests that the TBPP algorithm may intentionally begin the year by assigning below grade-level content to backfill missing skills or to boost students’ confidence with a new learning system. The very low level of content assigned in September is likely the root cause of the relatively high exit slip scores during that month in Figure 6.
Although our research questions focus on daily, rather than monthly, implementation, we chose to include these additional visualizations for two reasons: because applying the lens of the monthly school calendar underscores the ways that the policy constraint of state testing likely interferes with the ability of TBPP to fully personalize learner experiences (research question #1), and because they clearly illuminate the relationships between students’ initial academic proficiency and their outcomes within TBPP (research question #3).
Discussion
This study utilized relatively novel applications of hierarchical cluster analysis and heatmap data visualizations to explore the implementation of a technology-based instructional program that featured characteristics of both personalization and blended learning. We addressed three research questions: (1) To what degree did the daily implementation of this program reflect its stated goal of personalizing instruction? (2) Did student outcomes vary based on exposure to each of the learning modalities utilized by this program? (3) Did student outcomes vary based on the academic proficiency of students entering the program? Our analyses support three main findings: (a) The instructional reform succeeds in creating a highly personalized student experience, but was likely hampered in implementation by policy and logistical constraints; (b) Participation in a learning modality focused on long-term projects was associated with a lower degree of personalization but higher student outcomes than the other six learning modalities utilized by the program, particularly for some latent clusters of students; and (c) Initially higher-performing students earned higher scores on daily slip assessments than initially lower-performing students, despite the program’s intended goal of fostering equity in student outcomes through personalization of content to meet each student’s supposed level of readiness.
A Personalized Experience, With Some Limitations
The literature on instructional improvement describes the gaps that often emerge between the intentions of policymakers and the realities of classroom-level implementation (Cuban, 1986, 1990, 1993; Cohen, 1990; Tyack, 1991; Tyack and Tobin, 1994; Tyack and Cuban, 1995; Elmore, 1996, 2010; Honig and Hatch, 2004). However, these gaps have traditionally been hard to observe or measure, leading to a “logic of confidence” in which delegation and good faith replace coordination, inspection, and evaluation of the work of teaching and learning (Weick, 1976; Meyer and Rowan, 1977, 1978). This paper demonstrates how the application of data visualization techniques to the data produced by technology-based blended learning models can efficiently and effectively illuminate implementation hurdles, supporting administrators and policymakers in understanding—and resolving—gaps between avowed intention and lived reality.
Our results suggest that TBPP generally succeeds in its stated goal of personalizing the content assigned to each student. For example, within Figure 3 we see several distinct clusters of students, including one super-cluster of students who received mostly above grade-level content and a second, larger super-cluster of students who received mostly below grade-level content (both groups of students also received some on-grade level content; we offer possible explanations for this heterogeneous content assignment in Section “Policy and Logistical Constraints” below). Furthermore, we see that the level of content assigned correlates with students’ beginning-of-year mathematics ability, as indicated by the Fall MAP Math assessment. This represents a significant divergence from a traditional classroom, in which all of these students would presumably be studying the same grade-level content.
It’s particularly noteworthy that this personalization occurs not only within the technology-driven and independent modalities, such as OI, OP, and PP, but also the collaborative modalities of LG and SG and the teacher-led modalities of TI and LTP. While technology-based tutoring programs like ALEKS and Cognitive Tutor have succeeded in creating personalized online experiences for students, these data suggest that TBPP has created a learning experience that is personalized across both online and face-to-face instructional modalities.
Because the district under study has been historically low-performing and its students come from predominantly high-poverty backgrounds, it is not surprising that the majority of content was assigned below grade level. However, the cluster analysis in Figures 3, 5, 7 clearly reveals a subgroup of approximately 10–20% of students who are capable of success with above grade-level content. It is extremely noteworthy that even low-performing school districts contain meaningful numbers of young people who are capable of very high levels of math achievement if they are presented with suitably challenging content. Too often, American schools and society write off low-income, African-American and Hispanic communities as uniformly low-performing. These cluster analyses suggest that low average performance levels mask the existence of significant numbers of brilliant, high-potential students, and that these communities would benefit from personalized learning programs that allow these exemplary learners to push beyond grade-level standards.
Policy and Logistical Constraints
Our results also indicate that policy and logistical constraints may limit the ability of TBPP to fully personalize content to the degree that it aspires. This finding manifests itself most clearly in the data from March, April, and May, when students who had been assigned below-grade level content for the bulk of the year transitioned in unison to grade-level content in preparation for the high-stakes PARCC assessment. While TBPP’s intention is that students engage only with content at their unique zone of proximal development, the clear purple vertical bar in the month of March in the longitudinal heatmap in Figure 7 demonstrates that many students are pushed to work with grade-level content immediately prior to PARCC testing. The decision to focus on grade-level standards during the spring is not an inherent part of TBPP’s design; on the contrary, it was imposed unwillingly upon the non-profit that manages TBPP by school and district administrators who feared the consequences of low PARCC scores. The policy constraints posed by high-stakes standardized testing clearly inhibit the ability of TBPP to function as intended during these spring months, a finding that is in keeping with other examples in the literature (Murphy E. et al., 2014; Hyslop and Mead, 2015).
Similarly, the higher incidence of missing exit slips in Figure 4 during March, April, and May indicates intermittent implementation, perhaps due to teachers replacing TBPP instruction with practice tests, test prep workbooks, or other activities specifically designed to maximize performance on the PARCC assessment. In other words, the policy constraint posed by high-stakes testing may not only be incentivizing schools to reduce the personalization of content for part of the year, but also to partially abandon the use of TBPP altogether. This is a powerful example of coercive isomorphism (Meyer and Rowan, 1977, 1978; DiMaggio and Powell, 1983). The imposition of government-mandated assessments of student achievement, paired with the threat of sanctions or school closure in the case of low results, creates a powerful incentive for educators to abandon TBPP’s model of skill-based differentiation and instead expose all students to a common set of grade-level standards that will appear on the PARCC exam (Hyslop and Mead, 2015; Pane et al., 2015, 2017). In other words, while TBPP may succeed in its state goal of personalizing learning during most of the year, instruction seems to snap back to the status quo during the window of time when the pressures of test-based accountability are most acute.
Logistical constraints may also inhibit the ability of TBPP to fully personalize content. The heatmap of content levels within each instructional modality in Figure 3 suggests that it may be easier to match students with far-below grade level content in the OI, OP, and PP modalities than in the other four modalities. This could be attributable to the fact that the OI, OP, and PP modalities do not require any other students to be simultaneously working on the same skill. In contrast, assigning a student to LG, SG, TI, or LTP typically requires between five and fifteen other students who are also ready to be matched to the same skill. To give a practical example, if only one student needs practice with a specific 3rd grade geometry skill, it is logistically impossible for her to ever work on that skill in a TI, LTP, LG, or SG, since there will not be any peer students to work on it with her. Even with more than one hundred students in a class, it may simply be impractical to match every student with his or her ideally leveled content every day. This logistical constraint likely inhibits the ability of TBPP to offer the fully personalized experience that it aspires to create, particularly within the group-based and teacher-led modalities.
The relatively high prevalence of purple coloring for the LTP modality in Figure 3 suggests that it may be particularly difficult to match students with content in their zone of proximal development for LTP lessons. This is true for both low- and high-performing students. Students in the high-performing Cluster 2 were mostly assigned above-grade level content in the first six modalities, but their LTP assignments were more likely to be colored purple, indicating that they worked on comparatively lower-level skills within LTP lessons. Conversely, lower-performing students in Cluster 3 also exhibit a mismatch between the coloring of their content assignments for LTP lessons compared to the other six modalities, but in the opposite direction, with non- LTP lessons predominantly colored blue for “below-grade-level” while LTP lessons feature a higher prevalence of purple coloring. The LTP modality’s multi-day nature likely makes it particularly difficult to generate groups of students who all need the same above- or below-grade level skill for an extended period of study. The fact that the LTP modality is most similar to traditional forms of instruction means that it also least reflects the radical personalization at the heart of the TBPP model.
Lower Personalization but Higher Performance in the Long-Term Project Modality
We found that participation in the learning modality focused on LTP was associated with a lower degree of personalization but higher daily exit slip performance than the other six learning modalities utilized by the program. As discussed above, the unique, multi-day nature of the LTP modality likely makes it more difficult to assign students to content within their unique zone of proximal development within this modality. Despite this shortcoming, Figure 2 suggests that students scored higher on exit slips following LTP lessons than following lessons taught through any other learning modality. In particular, the students in Clusters 2 and 5 were much more successful on exit slips following LTP lessons than those associated with the other six modalities. This suggests that for approximately 10–20% of students, the LTP modality may be a uniquely effective learning modality, while for the remaining 80–90% of students it is equally as effective as other learning modalities. Increasing the amount of LTP assigned to this latent group of students could have a significant positive effect on learning, while reducing the amount of LTP assigned to other students may have little or no negative effect.
This finding stands in contrast to the popular conception of personalized learning, which imagines a student leveraging a computer or tablet to focus on their own unique “just-right” content. The LTP modality is unique in that it is the only modality in which the teacher, students, and content remain consistent for more than one consecutive day. By the time that students take their exit slip on the second or third day of the LTP, teachers will have had several days to build or strengthen relationships, informally assess students’ knowledge of the material, and adjust instruction in response. In all other modalities, teachers are assigned a new and unique group of students each day.
One might interpret this finding as suggesting that project-based learning, rather than personalization, offers the potential to improve learner success. However, we should note that the LTP modality features significantly smaller group sizes and far greater student homogeneity than a typical classroom, neither of which would be possible outside the context of the TBPP model. The intimate group size of the LTP modality is enabled by the fact that TBPP simultaneously assigns many other students to independent or collaborative learning modalities. Our results indicate that the combination of project-based learning and personalization appears more impactful than personalization alone. Furthermore, the fact that some students are disproportionately successful in LTPs while others are equally successful across all modalities suggests the possibility that educators may be able to unlock significant efficiencies by better identifying these otherwise hidden student groups and planning learning modalities accordingly.
Relationship Between Students’ Experiences and Initial Mathematics Ability
Our third major finding is that students who enter the program as already higher-performing are more successful on daily exit slips than students who enter the program with lower performance. This is apparent in Figure 2, which groups students into clear clusters based on their performance on exit slips; the students who consistently perform higher on daily exit slips are also more likely to have performed at a high level on the beginning-of-year NWEA MAP assessment, and vice versa. While this finding is to be expected in a typical instructional model, it is unexpected within TBPP, which is designed to match each student with content at his or her unique zone of proximal development; if every student is working on content that is at the exact right difficulty for him or her, then they should all be equally likely to be successful each day, regardless of their mathematical skills at the start of the year.
While it may seem tautological to demonstrate that students who entered the program as higher-performing are more likely to continue to be successful, this finding stands in stark contrast with the program’s avowed intention to promote equity by personalizing content for each student. By offering more challenging content to advanced students and lower level content to struggling students, TBPP intends to erase inequities in the rates of growth across students. We did not find this to be the case – a stark contrast with the intended goals of the program.
One potential explanation for this trend could be the combination of peer effects and homogeneous grouping. Given that the TBPP algorithm is explicitly designed to organize students into similarly leveled groups, TBPP could be understood as a form of tracking that accelerates higher-performing students while denying lower-performing students the opportunity to learn from mathematically more-capable peers (Barr and Dreeben, 1983; Wenglinsky, 2005; Lee and Ready, 2009; Philip and Olivares-Pasillas, 2016). The heatmap in Figure 2 may support this theory, since high-performing students performed particularly well on exit slips when working within the LTP modality, one of the modalities in which students have the most opportunities to interact with other students in the course of learning.
A second potential root cause could be that the significant autonomy afforded to students by TBPP increases the importance of non-cognitive factors like motivation and perseverance, which may be more commonly found among higher-performing than lower-performing students. This would be in keeping with some of the extant literature related to on-task behavior in personalized learning environments, as well as the broader literature on non-cognitive skills and “success at school” factors in general (Bowers, 2007, 2010; Duckworth et al., 2007; Baker and Gowda, 2010; Rodrigo et al., 2013; Murphy E. et al., 2014). In other words, a student who is more diligent or able to maintain focus for long periods of independent work may score higher on the Fall MAP math exam, but may also be more prepared to succeed in student-directed modalities regardless of his or her mathematical skill. Motivation or self-management skills may be correlated with initial mathematics ability, but also produce an independent effect reflecting higher-performing students’ greater ability to remain on-task and focused on mastering the mathematical content assigned to them. If true, this would have significant implications for the design of personalized programs; simply customizing instructional content to each student’s “just right” zone of proximal development would be insufficient to unlock equitable rates of student growth. Instead, programs would need to consider the broader range of skills and mindsets that enable student success.
In interpreting this finding, we should stipulate that inequality is not necessarily an unabashed evil if it is caused primarily by accelerating the growth of high-performing students. One of the key arguments in favor of personalized learning is that it allows curious, diligent, and intelligent students to race ahead and meet their full potential rather than languish bored in a class that moves too slowly for them. One could imagine a scenario in which TBPP promotes the growth of high-performing students in a way that expands inequality while having only very small negative effects on low-performing students, or even no negative effect at all. This is a classic example of the kind of value-laden trade-off that is endemic to both education and the social sciences more broadly (Carnoy and Levin, 1985; Labaree, 1997; Stone, 2002). How should we weigh the importance of individual success vs. collective achievement, autonomy vs. equality, or high-performers meeting their full potential vs. low performers not being left behind? While quantitative analyses can provide useful evidence for evaluating the magnitude and direction of these trade-offs, the solutions will always involve philosophical questions that cannot be resolved through statistical analysis alone.
Limitations and Future Work
Readers should be mindful of several important limitations when interpreting our results. The first is the significant diversity among models, contexts, and demographics of learners utilizing technology-based personalization, which may limit the applicability of these findings to other programs and conditions (Cavanagh, 2014; Horn and Staker, 2014; Murphy E. et al., 2014; Picciano, 2014; Pane et al., 2015; Brodersen and Melluzzo, 2017). In other words, what is true of TBPP may not be true of other personalized and blended models that utilize different strategies or technologies for assessing student learning, grouping students, and/or delivering instruction. They may also not be true of implementations in contexts different than this study, which focused on one urban district populated primarily by black and Latino students who qualified for free and reduced price lunch. A second threat to the external validity of these findings is that they encompass only a single district and a single year. If there were some factor that made this district unique, or some reason that the 2015–2016 academic year were different than a typical academic year, it could provide a bias that would reduce our ability to generalize these findings across other contexts. Finally, the short, multiple-choice format of exit slips means that they are more likely to evaluate procedural and didactic skills than more complex skills related to theoretical understanding or evaluation. While this represents a limitation in this study, it may also represent a limitation within the TBPP model itself, since its algorithm entirely depends upon exit slips and the NWEA MAP math assessment as proxies for learning.
This study also suggests several valuable avenues for future research. The most straightforward of these is to broaden our dataset to include data from the implementation of TBPP in other districts, or within this same district across multiple years. Expanding the study’s reach in this way might address some of the concerns related to external validity that arise when studying a single program in a single context. Similarly, it would be very useful to apply the analytical techniques from this dissertation to other blended learning programs utilizing technology-based personalization. Because the data from other programs is probably structured differently, it seems unlikely that the data could or should be pooled. However, it would be very useful to apply similar analytic techniques and research questions to data produced by alternate technology-based, personalized, and blended programs in order to explore whether the key findings from this study are also true in those contexts.
A second avenue for future research would be to complement the quantitative approaches highlighted here with qualitative approaches, including classroom observation and interviews with teachers and students. Our findings suggest that TBPP may accelerate inequality by enabling motivated or high-performing students to move ahead of their lower-performing peers. Interviews with those students could help confirm or refute those findings. Similarly, observing lower-performing students when working within modalities that provide a high degree of autonomy could illuminate whether their comparatively low performance on exit slips is attributable to off-task behavior or authentic struggles with math content.
Finally, it would be worthwhile to further explore the characteristics of some of the otherwise “hidden” groups that we found in our cluster analyses: the 10–20% of students who performed higher in the long-term project modality than other modalities and the 10–20% of students who succeeded with above grade-level content. American education was built more than a hundred years ago upon the principles of standardization and consistency. Our cluster analyses indicate the limitations in these founding values. This is particularly salient for low-income, African-American, and Hispanic communities, where low average performance levels and societal biases can obscure significant numbers of young people who are ready and eager to succeed with above grade-level content.
Policymakers and researchers are eager to explore the outcomes from blended instructional models utilizing technology-based personalization. However, they risk missing important data trends if they limit their research to end-of-year outcomes on state-mandated standardized assessments. This paper demonstrates the usefulness of also using non-regression-based statistical techniques to investigate the student- and lesson-level factors that affect learning at a daily level. Continuing this avenue of research may generate insights into not only technology-based personalization, but the phenomenon of teaching and learning more broadly.
Data Availability Statement
Per the authors’ agreement with the creators of TBPP, the data supporting the conclusions of this article cannot be released. Please contact the authors directly if you are interested in learning more about the raw data.
Ethics Statement
The studies involving human participants were reviewed and approved by Teachers College IRB. Written informed consent from the participants’ legal guardian/next of kin was not required to participate in this study in accordance with the national legislation and the institutional requirements.
Author Contributions
DN was the primary author, and should have first authorship. DR and AB have contributed equally to each other (but less than DN) and should share secondary or senior authorship. All authors contributed to the article and approved the submitted version.
Conflict of Interest
The authors declare that the research was conducted in the absence of any commercial or financial relationships that could be construed as a potential conflict of interest.
Publisher’s Note
All claims expressed in this article are solely those of the authors and do not necessarily represent those of their affiliated organizations, or those of the publisher, the editors and the reviewers. Any product that may be evaluated in this article, or claim that may be made by its manufacturer, is not guaranteed or endorsed by the publisher.
References
Alfredo, V., Félix, C., and Angela, N. (2010). “Clustering educational data,” in Handbook of Educational Data Mining, eds C. Romero, S. Ventura, M. Pechenizkiy, and R. S. J. D. Baker (Boca Raton, FL: CRC Press), 75–92.
Baker, R. S. J. D., and Gowda, S. M. (2010). “An analysis of the differences in the frequency of students’ disengagement in urban, rural, and suburban high schools,” in Proceedings of the 3rd International Conference on Educational Data Mining, (Springer), 11–20.
Barrow, L., Markman, L., and Rouse, C. (2007). Technology’s edge: the educational benefits of computer aided instruction. NBER Draft. Am. Econ. J.: Econ. Policy 1, 52–74. doi: 10.1257/pol.1.1.52
Bidwell, C. (1965). “The school as a formal organization,” in Handbook of Organizations, ed. J. G. March (Chicago: Rand McNally), 972–1018.
Bloom, B. S. (1984). The 2 sigma problem: the search for methods of group instruction as effective as One-to-One tutoring. Educ. Res. 13, 4–16. doi: 10.3102/0013189x013006004
Bowers, A. J. (2007). Grades and Data Driven Decision Making: Issues of Variance and Student Patterns. Doctoral dissertation. Available online at: https://eric.ed.gov/?id=ED538574
Bowers, A. J. (2010). Analyzing the longitudinal K-12 grading histories of entire cohorts of students: grades, data driven decision making, dropping out and hierarchical cluster analysis. Pract. Assess. Res. Eval. 15, 5–8.
Bowers, A. J. (2021). “Dashboards, data use, and decision-making – a data collaborative workshop bringing together educators and data scientists,” in Data Visualization, Dashboards, and Evidence Use in Schools: Data Collaborative Workshop Perspectives of Educators, Researchers, and Data Scientists, ed. A. J. Bowers (New York, NY: Teachers College, Columbia University), 1–36.
Bowers, A. J., Blitz, M., Modeste, M., Salisbury, J., and Halverson, R. (2017). How Leaders Agree with Teachers in Schools on Measures of Leadership Practice: A Two-Level Latent Class Analysis of the Comprehensive Assessment of Leadership for Learning. Teachers College Record, Vol. 119. New York, NY: Teachers College, Columbia University. doi: 10.1177/016146811711900408
Bowers, A. J., and Krumm, A. E. (2021). Supporting evidence-based improvement cycles through a data-intensive partnership. Inform. Learn. Sci. 112, 629–650. doi: 10.1108/ILS-09-2020-0212
Bowers, A. J., Krumm, A. E., Feng, M., and Podkul, T. (2016). Building a Data Analytics Partnership to Inform School Leadership Evidence-Based Improvement Cycles. Annual Meeting of the American Educational Research Association. Washington, DC.
Brodersen, R. M., and Melluzzo, D. (2017). Summary of Research on Online and Blended Learning Programs That Offer Differentiated Learning Options. REL 2017-228. Washington, DC: Institute of Education Sciences.
Carnoy, M., and Levin, H. (1985). Schooling and Work in the Democratic State. Redwood City, CA: Stanford University Press.
Cavanagh, S. (2014). What is ‘Personalized Learning’? Educators Seek Clarity. Education Week. Available online at: http://www.edweek.org/ew/articles/2014/10/22/09pl-overview.h34.html (accessed October 20, 2016).
Cohen, D. K. (1990). A revolution in one classroom: the case of Mrs. Oublier. Educ. Eval. Pol. Anal. 12, 311–329. doi: 10.3102/01623737012003311
Connor, C. M. (2019). Using technology and assessment to personalize instruction: preventing reading problems. Prevent. Sci. 20, 89–99. doi: 10.1007/s11121-017-0842-9
Corno, L. (2008). On teaching adaptively. Educ. Psychol. 43, 161–173. doi: 10.1080/00461520802178466
Costa, I. G., de Carvalho, F. A., and de Souto, M. C. (2002). Comparative study on proximity indices for cluster analysis of gene expression time series. J. Intell. Fuzzy Syst. 13, 133–142.
Cuban, L. (1986). Teachers and Machines: The Classroom Use of Technology Since 1920. New York, NY: Teachers College Press.
Cuban, L. (1990). Reforming again, again, and again. Educ. Res. 19, 3–13. doi: 10.3102/0013189X019001003
Cuban, L. (1993). How Teachers Taught: Constancy and Change in American Classrooms, 1890-1990, 2nd Edn. New York, NY: Teachers College Press.
Dewey, J. (1916). Democracy and Education: An Introduction to the Philosophy of Education. London: Collier-Macmillan.
DiMaggio, P. J., and Powell, W. W. (1983). The iron cage revisited: institutional isomoprphism and collective rationality in organizational fields. Am. Sociol. Rev. 48, 147–160. doi: 10.2307/2095101
Ding, C., and He, X. (2004). “K-means clustering via principal component analysis,” in Proceedings of the Twenty-First International Conference on Machine Learning, (ACM), 29. doi: 10.1016/j.jphs.2020.12.004
Duckworth, A. L., Peterson, C., Matthews, M. D., and Kelly, D. R. (2007). Grit: perseverance and passion for long-term goals. J. Pers. Soc. Psychol. 92:1087. doi: 10.1037/0022-3514.92.6.1087
Eisen, M. B., Spellman, P. T., Brown, P. O., and Botstein, D. (1998). Cluster analysis and display of genome-wide expression patterns. Proc. Natl. Acad. Sci. U.S.A. 95, 14863–14868. doi: 10.1073/pnas.95.25.14863
Elmore, R. (1996). Getting to scale with good educational practice. Harvard Educ. Rev. 66, 1–26. doi: 10.17763/haer.66.1.g73266758j348t33
Elmore, R. (2010). Leading the Instructional Core: an interview with Richard Elmore. Ontario Ministry of Education. In Conversations. Summer, Volume 11, Issue 3. Available online at: http://www.edu.gov.on.ca/eng/policyfunding/leadership/Summer2010.pdf (accessed July 24, 2017).
Farkas, S., Duffett, A., and Lovelace, T. (2008). High-Achieving Students in the Era of NCLB. Washington, DC: Thomas B. Fordham Institute, 735–738.
Gu, Z., Eils, R., and Schlesner, M. (2016). Complex heatmaps reveal patterns and correlations in multidimensional genomic data. Bioinformatics 32, 2847–2849. doi: 10.1093/bioinformatics/btw313
Hagerty, G., and Smith, S. (2005). Using the web-based interactive software ALEKS to enhance college algebra. Math. Comput. Educ. 39:189.
Hardy, M. E. (2004). Use and evaluation of the ALEKS interactive tutoring system. J. Comput. Sci. Colleges 19, 342–347.
Hollands, F. M. (2003). The Impact of Computer Use on the Individualization of Students’ Learning Experiences in Public Middle School Science Classrooms. New York, NY: Columbia University, 1–296.
Honig, M. I., and Hatch, T. C. (2004). Crafting coherence: how schools strategically manage multiple, external demands. Educ. Res. 33, 16–30. doi: 10.3102/0013189X033008016
Horn, M. B. (2017). Finding “Personalized Learning” and Other Edtech Buzzwords on the Gartner Hype Cycle. EdSurge News. New York, NY: McGraw Hill.
Horn, M. B., and Staker, H. (2014). Blended: Using Disruptive Innovation to Improve Schools. Hoboken, NJ: John Wiley & Sons.
Hyslop, A., and Mead, S. (2015). A Path to the Future: Creating Accountability for Personalized Learning. New York, NY: McGraw Hill Education.
Jain, A. K., Murty, M. N., and Flynn, P. J. (1999). Data clustering: a review. ACM Comput. Surv. (CSUR) 31, 264–323. doi: 10.1145/331499.331504
Januszewski, A. (2001). Educational Technology: The Development of a Concept. Westport, CT: Greenwood Publishing Group(Libraries Unlimited).
Jaskowiak, P. A., Campello, R. J., and Costa, I. G. (2014). On the selection of appropriate distances for gene expression data clustering. BMC Bioinform. 15(Suppl. 2):S2. doi: 10.1186/1471-2105-15-S2-S2
Keefe, J. W., and Jenkins, J. M. (2000). Personalized Instruction: Changing Classroom Practice. Larchmont, NY: Eye on Education.
Koeclinger, K. R., Corbett, A. T., and Ritter, S. (2000). Carnegie learning’s cognitive tutor™: summary research results. Cité en 126, 1–6.
Koedinger, K. R., Anderson, J. R., Hadley, W. H., and Mark, M. A. (1997). Intelligent tutoring goes to school in the big city. Int. J. Artif. Intell. Educ. 8, 30–43.
Krumm, A., Means, B., and Bienkowski, M. (2018). Learning Analytics Goes to School: A Collaborative Approach to Improving Education. Milton Park: Routledge. doi: 10.4324/9781315650722
Labaree, D. F. (1997). Public goods, private goods: the American struggle over educational goals. Am. Educ. Res. J. 34, 39–81. doi: 10.3102/00028312034001039
Lee, V. E., and Ready, D. D. (2009). U.S. High school curriculum: three phases of contemporary research and reform. Future Children 19, 135–156. doi: 10.1353/foc.0.0028
Mangiameli, P., Chen, S. K., and West, D. (1996). A comparison of SOM neural network and hierarchical clustering methods. Eur. J. Operational Res. 93, 402–417. doi: 10.1016/0377-2217(96)00038-0
McDonald, R. A. F. (1915). Adjustment of school organization to various population groups (No. 75). New York, NY: Teachers college, Columbia university.
Means, B., Toyama, Y., Murphy, R., Bakia, M., and Jones, K. (2010). Evaluation of Evidence Based Practices in Online Learning: A Meta-Analysis and Review of Online-Learning Studies. Washington, DC: U.S. Department of Education.
Meyer, J. W., and Rowan, B. (1977). Institutionalized organizations: formal structure as myth and ceremony. Am. J. Sociol. 83, 340–363. doi: 10.1086/226550
Meyer, J. W., and Rowan, B. (1978). “The structure of educational organizations,” in Environments and Organizations, ed. M. W. Meyer (San Francisco, CA: Jossey-Bass), 78–109.
Muralidharan, K., Singh, A., and Ganimian, A. J. (2019). Disrupting education? Experimental evidence on technology-aided instruction in India. Am. Econ. Rev. 109, 1426–1460. doi: 10.1257/aer.20171112
Murphy, E., Snow, E., Mislevy, J., Gallagher, L., Krumm, A., and Wei, X. (2014). Blended Learning Report. West Lake Hills, TX: Michael & Susan Dell Foundation.
Murphy, R., Gallagher, L., Krumm, A., Mislevy, J., and Hafter, A. (2014). Research on the Use of Khan Academy in Schools. Menlo Park, CA: SRI Education.
Murray, T. (1999). Authoring intelligent tutoring systems: an analysis of the state of the art. Int. J. Artif. Intell. Educ. 10, 98–129.
National Mathematics Advisory Panel [NMAP] (2008). Foundations for Success: The Final Report of the National Mathematics Advisory Panel. Washington, DC: US Department of Education.
Natriello, G. (2012). Adaptive Educational Technologies and Educational Research: Opportunities, Analyses, and Infrastructure Needs. Background Paper Prepared for the National Academy of Education. Washington, DC: National Academy of Education.
Natriello, G. (2013). Adaptive Educational Technologies: Tools for Learning and for Learning About Learning. Washington, DC: National Academy of Education.
Nitkin, D. (2018). Technology-Based Personalization: Instructional Reform in Five Public Schools. Doctoral dissertation. New York, NY: Columbia University.
Pane, J. F., Griffin, B. A., McCaffrey, D. F., and Karam, R. (2014). Effectiveness of cognitive tutor algebra I at scale. Educ. Eval. Policy Anal. 36, 127–144. doi: 10.3102/0162373713507480
Pane, J. F., Griffin, B. A., McCaffrey, D. F., Karam, R., Daugherty, R., and Phillips, A. (2013). Does an Algebra Course with Tutoring Software Improve Student Learning? Santa Monica, CA: Rand Corporation. doi: 10.7249/RB9746
Pane, J. F., Steiner, E. D., Baird, M. D., Hamilton, L. S., and Pane, J. D. (2015). Continued Progress: Promising Evidence on Personalized Learning. Santa Monica, CA: RAND Corporation. doi: 10.7249/RR1365
Pane, J. F., Steiner, E. D., Baird, M. D., Hamilton, L. S., and Pane, J. D. (2017). Informing Progress. Santa Monica, CA: Rand Corporation.
Petrilli, M. J. (2012). The Diverse Schools Dilemma: A Parent’s Guide to Socioeconomically Mixed Public Schools. Washington, DC: Thomas B. Fordham Institute.
Philip, T., and Olivares-Pasillas, M. (2016). Learning Technologies and Educational Equity: Charting Alternatives to the Troubling Pattern of Big Promises with Dismal Results. Teachers College Record, ID Number: 21616. New York, NY: Teachers College, Columbia University.
Picciano, A. G. (2014). Big data and learning analytics in blended learning environments: benefits and concerns. IJIMAI 2, 35–43. doi: 10.9781/ijimai.2014.275
Rodrigo, M. M. T., Baker, R. S. J. D., and Rossi, L. (2013). Student off-task behavior in computer-based learning in the Philippines; comparison to prior research in the USA. Teachers College Record 115:1. doi: 10.1177/016146811311501007
Romesburg, H. C. (1984). Cluster Analysis for Researchers. Belmont, CA: Lifetime Learning Publications.
Roschelle, J., Feng, M., Murphy, R. F., and Mason, C. A. (2016). Online mathematics homework increases student achievement. AERA Open 2, 7–8. doi: 10.1177/2332858416673968
Smale-Jacobse, A. E., Meijer, A., Helms-Lorenz, M., and Maulana, R. (2019). Differentiated instruction in secondary education: a systematic review of research evidence. Front. Psychol. 10:2366. doi: 10.3389/fpsyg.2019.02366
Stone, D. (2002). Policy Paradox: The Art of Political Decision Making, Revised Edition. New York, NY: WW Norton and Company.
Suprayogi, M. N., Valcke, M., and Godwin, R. (2017). Teachers and their implementation of differentiated instruction in the classroom. Teach. Teacher Educ. 67, 291–301. doi: 10.1016/j.tate.2017.06.020
Tomlinson, C. A. (2001). How to Differentiate Instruction in Mixed-Ability Classrooms. Alexandria, VA: ASCD.
Tomlinson, C. A., Brighton, C., Hertberg, H., Callahan, C. M., Moon, T. R., Brimijoin, K., et al. (2003). Differentiating instruction in response to student readiness, interest, and learning profile in academically diverse classrooms: a review of literature. J. Educ. Gifted 27, 119–145. doi: 10.1177/016235320302700203
Tyack, D. (1991). Public school reform: policy talk and institutional practice. Am. J. Educ. 100, 1–19. doi: 10.1086/444002
Tyack, D., and Cuban, L. (1995). Tinkering Toward Utopia: A Century of Public School Reform. Cambridge, MA: Harvard University Press.
Tyack, D. B., and Tobin, W. (1994). The “Grammar” of schooling: why has it been so hard to change? (in social and institutional analysis; school reform). Am. Educ. Res. J. 31(3):453–479. doi: 10.3102/00028312031003453
VanLehn, K. (2011). The relative effectiveness of human tutoring, intelligent tutoring systems, and other tutoring systems. Educ. Psychol. 46, 197–221. doi: 10.1016/j.pec.2016.10.024
van’tVeer, L. J., Dai, H., vandeVijver, M. J., He, Y. D., Hart, A. A. M., Mao, M., et al. (2002). Gene expression profiling predicts clinical outcome of breast cancer. Nature 415, 530–536. doi: 10.1038/415530a
Vygotsky, L. S., and Cole, M. (1978). Mind in Society: the Development of Higher Psychological Processes. Cambridge, MA: Harvard University Press.
Wang, H., and Woodworth, K. (2011). Evaluation of Rocketship Education’s Use of DreamBox Learning’s Online Mathematics Program. Menlo Park, CA: SRI International.
Weick, K. (1976). Educational organizations as loosely coupled systems. Administrat. Sci. Q. 21, 1–19. doi: 10.2307/2391875
Wendt, S., and Rice, J. (2013). Evaluation of ST Math in the Los Angeles Unified School District. San Francisco, CA: WestEd.
Wenglinsky, H. (2005). Using Technology Wisely: The Keys to Success in Schools. New York, NY: Teachers College Press.
Wilkinson, L., and Friendly, M. (2009). The history of the cluster heat map. Am. Stat. 63, 179–184. doi: 10.1198/tas.2009.0033
Wolf, M. A. (2010). Innovate to Educate: System [Re]design for Personalized Learning: A Report from the 2010 Symposium. Washington, DC: Software & Information Industry Association.
Yazdani, M. (1987). “Intelligent tutoring systems: an overview,” in Artificial Intelligence and Education, Vol. 1, eds R. Lawler and Yazdani, M. (Norwood, NJ: Ablex), 183–201.
Keywords: cluster analysis, data visualization, heatmaps, personalized instruction, personalized learning, blended learning, technology
Citation: Nitkin D, Ready DD and Bowers AJ (2022) Using Technology to Personalize Middle School Math Instruction: Evidence From a Blended Learning Program in Five Public Schools. Front. Educ. 7:646471. doi: 10.3389/feduc.2022.646471
Received: 27 December 2020; Accepted: 28 February 2022;
Published: 14 April 2022.
Edited by:
Christothea Herodotou, The Open University, United KingdomReviewed by:
Nashwa Ismail, Durham University, United KingdomItsar Bolo Rangka, Indraprasta PGRI University, Indonesia
Copyright © 2022 Nitkin, Ready and Bowers. This is an open-access article distributed under the terms of the Creative Commons Attribution License (CC BY). The use, distribution or reproduction in other forums is permitted, provided the original author(s) and the copyright owner(s) are credited and that the original publication in this journal is cited, in accordance with accepted academic practice. No use, distribution or reproduction is permitted which does not comply with these terms.
*Correspondence: David Nitkin, ZGF2aWRuaXRraW5AZ21haWwuY29t