 Jessica M. Namkung
 John Marc Goodrich
 Michael Hebert
 Natalie Koziol
- 1School of Education, University of Delaware, Newark, DE, United States
- 2Department of Teaching, Learning, and Culture, Texas A&M University, College Station, TX, United States
- 3School of Education, University of California, Irvine, Irvine, CA, United States
- 4Department of Special Education and Communication Disorders, University of Nebraska-Lincoln, Lincoln, NE, United States
Although many school districts made efforts to provide instruction during the COVID-19 pandemic (including in-person, remote, and blended/hybrid options the length of instruction time and delivery models have varied from district to district. This disruption in education has been projected to result in a significant learning loss, which may be particularly profound for students from disadvantaged backgrounds, leading to widening opportunity gaps. However, there is limited empirical data that can provide important contextual background for understanding the impact of the pandemic on student learning. Therefore, we conducted a national survey with a random sample of 582 elementary school teachers to understand the instructional changes that occurred, the amount of academic content instruction provided to students, and teachers perceptions of the learning supports needed and provided to students during the 2020–2021 school year. Results indicated that most teachers relied on alternative forms of instruction and experienced changes in delivery models but reported low instructional effectiveness. Compared to typical years, teachers reported significant decreases in curriculum coverage; the number of students who received needed interventions, and students who were ready to transition to the next grade level during the 2020–2021 school year. Teachers also reported greater impacts on instruction for students from disadvantaged backgrounds. Follow-up analyses using prior school achievement data corroborated the findings that higher school achievement was associated with smaller impacts on student learning and delivery of instruction.
Introduction
Many school districts were forced to temporarily close schools in spring 2020 during the COVID-19 crisis. This marked one of the largest disruptions to education in history, forcing more than 1.6 billion children out of school in the United States and affecting 95% of school-aged children worldwide (United Nations, 2020; Kaffenberger, 2021). Although many schools attempted to provide remote instruction during the spring of 2020, estimates suggest that between 7.2 and 11.6 million K-5 students also may not have received remote instruction (Goodrich et al., 2022).
In the 2020–2021 school year, school districts adapted to the pandemic by developing a variety of instructional models to reach students, including remote learning, blended/hybrid learning, and in-person learning, with some school districts implementing multiple models for various lengths of time. Despite the strong efforts of schools and teachers, these delivery models may not have provided the same quality of education compared to instruction prior to the pandemic for several reasons. Schools that returned to in-person learning faced frequent student absences and staff shortages due to the COVID related quarantines. For schools that opted to provide alternate forms of learning, many teachers, parents, and students had to make quick transitions without strong supports in place (e.g., technology support, student engagement strategies; Stanistreet et al., 2020).
To estimate the potential impact of the COVID-19 school closures on student learning (e.g., Dorn et al., 2020; Kuhfeld et al., 2020; Kaffenberger, 2021), some researchers have projected learning losses based on estimates from typical school closures, such as summer breaks. With some variability in the estimates of the summer learning loss (0.001 to 0.01 SD learning loss per day out of school), prior research indicated student achievement slows down or even declines over the summer breaks (e.g., von Hippel et al., 2018; Kuhfeld, 2019). Based on these estimates, Kuhfeld et al. (2020) projected that students who did not have access to remote instruction (3 months) in spring 2020 would begin fall 2020 with only 37% to 68% of typical learning gains in reading and mathematics, and some students may be up to one year behind in mathematics. Even students who received remote instruction in spring 2020 were projected to begin fall 2020 with 60% to 87% of their typical learning gains.
However, these numbers may underestimate the problem to some degree. The assumption is that learning losses could be similar to losses experienced during other breaks from school. However, instructional challenges related to COVID-19 are also likely to have resulted in less content coverage when school has been in session, compounding the losses. In addition, differential access to technology and remote instruction during COVID-19 school closures are projected to exacerbate the impacts of the pandemic for some populations, widening SES-based opportunity gaps. The learning losses are expected to be greatest among low-income students because students from high SES schools were estimated to receive more remote instruction than students from low SES schools (Kuhfeld et al., 2020). Even when students from low SES schools were able to access remote instruction, they were less likely to have the same high-quality remote learning or supportive environments (e.g., parental academic supervision, space with minimal distraction; Dorn et al., 2020). Dorn et al. (2020) projected that low-income students would experience 12.4 months of learning loss compared to the overall average learning loss of 6.8 months, exacerbating the existing opportunity gaps by 15% to 20%.
Some researchers have suggested that the short-term learning losses due to the pandemic may be cumulative and result in larger and permanent learning losses (e.g., Dorn et al., 2020; Kaffenberger, 2021). Dorn et al. (2020) estimated that the pandemic is likely to lead to higher high-school dropout rates (i.e., 2–9% increase to the current 5% rate) due to decreased academic engagement and achievement, and disruptions to supports that can help students stay in school (e.g., community support, youth-serving organizations), leading to long-term economic issues. Kaffenberger (2021) reported that learning loss in grade 3 would accumulate and result in students performing 1 to 1.5 years lower in grade 10. He also estimated that short-term remediation efforts (e.g., teachers covering 1/2 of grade 3 curriculum in grade 4 and reverting to the pre-pandemic curriculum and instructional levels by grade 5) would reduce the long-term learning loss to one-half of a school year. The long-term remediation efforts (e.g., identifying students’ learning levels via formative assessments, adapting teacher instructions) were estimated to fully mitigate the learning loss. That said, the pandemic is still on-going (with some school closures occurring again in early 2022 due to COVID-19 variants), and it is unlikely that schools and teachers were able to cover the same amount of content in the 2020–2021 school year as in typical years, or that they were able to provide the same levels of support to students from minoritized and disadvantaged populations that they do in typical years.
Despite these projections, the empirical data to evaluate the actual impact of the COVID-19 pandemic on student learning is limited. Engzell et al. (2021) used national assessments conducted before (January to February) and after (June) the COVID-19 lockdown in the Netherlands. They compared student progress in mathematics, reading, and spelling on the national assessments during 2020 to student progress in the three previous years. Results indicated a learning loss equivalent to 3 percentile points despite the relatively short lockdown. However, the learning loss was up to 60% greater among students from disadvantaged backgrounds (i.e., students from less-educated households), indicating the disproportionate impact of the pandemic on student learning. Similarly, achievement scores on state assessments for students in grades 4 to 8 in 17 school districts in Illinois indicated that students scored significantly lower than expected in mathematics compared to prior to the pandemic, resulting in a learning losses as large as 56% of a school year (Streich et al., 2021). Furthermore, special education status, English language learner status, and eligibility for free/reduced price lunch were associated with greater learning losses in mathematics among middle school students.
Taken together, although prior research has shown varying levels of impact of the COVID-19 pandemic on student learning, it is evident that student learning was disrupted, leading to short-term and long-term detrimental effects on student achievement and educational attainment. Prior research also suggests that this learning loss may be particularly profound for students from disadvantaged backgrounds, leading to widening opportunity gaps. However, the current literature and our understanding of the impact of the pandemic on student learning is primarily based on model-based projections and limited empirical data comparing student performance prior to and after the lockdown. Detailed empirical data that can provide important contextual background for understanding the impact of the pandemic on student learning are missing.
Therefore, the purpose of the present study was to understand the instructional changes that occurred during the 2020–2021 school year and their impact on student learning from a national sample of elementary school teachers. Additionally, we sought information from teachers regarding the amount of academic content instruction provided to students and teachers’ perceptions of the learning supports needed and provided to students across the 2020–2021 school year. Furthermore, we aimed to explore whether teacher reported changes were related to prior school achievement data.
Materials and Methods
Participants
For survey distribution, we obtained a representative random sample of K-5 educator email addresses that was proportionally reflective of the number of teachers in each grade (K-5) as well as representative of the distribution of the United States population across different geographic regions survey distribution from Market Data Retrieval (MDR). We made sure that only one teacher from each school was selected to maximize the number of schools. We calculated the total number of respondents (N = 382) needed to achieve a margin of error of ± 5.0% with a 95% confidence interval (Dillman, 2000). After excluding 289 invalid email address, we sent 9,476 teachers the invitation to complete the survey. Of those, 595 teachers provided consent, and 13 teachers who did not answer any questions were later excluded. The final sample consisted of 582 teachers, providing this survey with a ± 4.1% margin of error with a 95% confidence interval.
Stanford Education Data Archive (SEDA; Reardon et al., 2021) provides demographics (e.g., region, gender, socioeconomic status, race) and academic achievement data (e.g., mathematics, English language arts) for all tested students in grades 3–8 in public schools across the United States averaged over the 2008–2009 to 2017–2018 school years. SEDA school-level mean mathematics and English language arts achievement data were available for 490 teachers, and covariate data were available for 515 teachers who responded to our survey. Given the lower than anticipated response rate (6.14%), we compared teachers who did and did not respond to the survey to ensure the generalizability of our findings. After correcting for Type I error rate, there were some statistically significant differences by geographic region. The Mid-Atlantic and South-Central regions were significantly under-represented in survey responders, whereas the Mountain and North-Central regions were significantly over-represented among survey responders. There were no other significant differences. We also compared our sample of teachers to national teacher demographics reported by the National Center for Educational Statistics (Hussar et al., 2020). Overall, our sample approximated the national averages in terms of gender and race. However, teachers with over 20 years of teaching experience were over-represented in our samples (32.3%) compared to the national average (22.4%).
Survey Questions
We created and administered the survey using the Qualtrics electronic survey platform. The survey consisted of 59 items. The first eight questions were on demographics of teachers and students in their classrooms. Next, teachers answered questions about the instructional model(s) used by their schools. Additionally, we asked questions related to student progress and instruction in three specific academic content areas: reading, mathematics, and writing. The questions included the amount of planned curriculum teachers were able to cover, percentage of students needing extra support in each academic area, percentage of students who did not receive needed support for each academic area during the 2020–2021 school year compared to typical years prior to the COVID pandemic, and whether these changes were due to the pandemic. Teachers also rated the negative impacts the pandemic had on students overall, as well as on subpopulations of students (i.e., students from low-income backgrounds, students with IEPs, students who are English language learners). They also rated their perceived effectiveness of remote instruction. Finally, teachers answered questions about their opinions regarding the effectiveness of instruction during the pandemic.
Results
Overall, our respondents had a mean of 15.44 years of teaching experience (SD = 9.65) and a mean of 23 students in their class (SD = 9.51) at the time of the survey. The majority (80.2%) reported having less than 20% of students with IEPs in their classroom. Similarly, 79.5% of teachers reported having classrooms with less than 20% English language learners.
Descriptive Analysis
Instructional Model
Figure 1 shows the instructional models teachers reported for their schools at the start and end of the 2020–2021 school year. At the start of the school year, most schools offered either 100% remote instruction (46.7%) or in-person instruction with an option for remote instruction (30.9%). Approximately 12.1% of schools offered hybrid, and only 8.6% of schools offered 100% in-person instruction. However, approximately 60% of teachers experienced a change in their instructional model from the beginning to the end of the school year. At the end of the school year, most schools offered in-person instruction with an option for remote instruction (65.2%), followed by 100% in-person (16.5%), hybrid (13.0%), and 100% remote (2.6%) instruction. Thus, the number of schools offering 100% in-person or in-person instruction with an option for remote instruction doubled from the beginning to the end of the 2020–2021 school year.
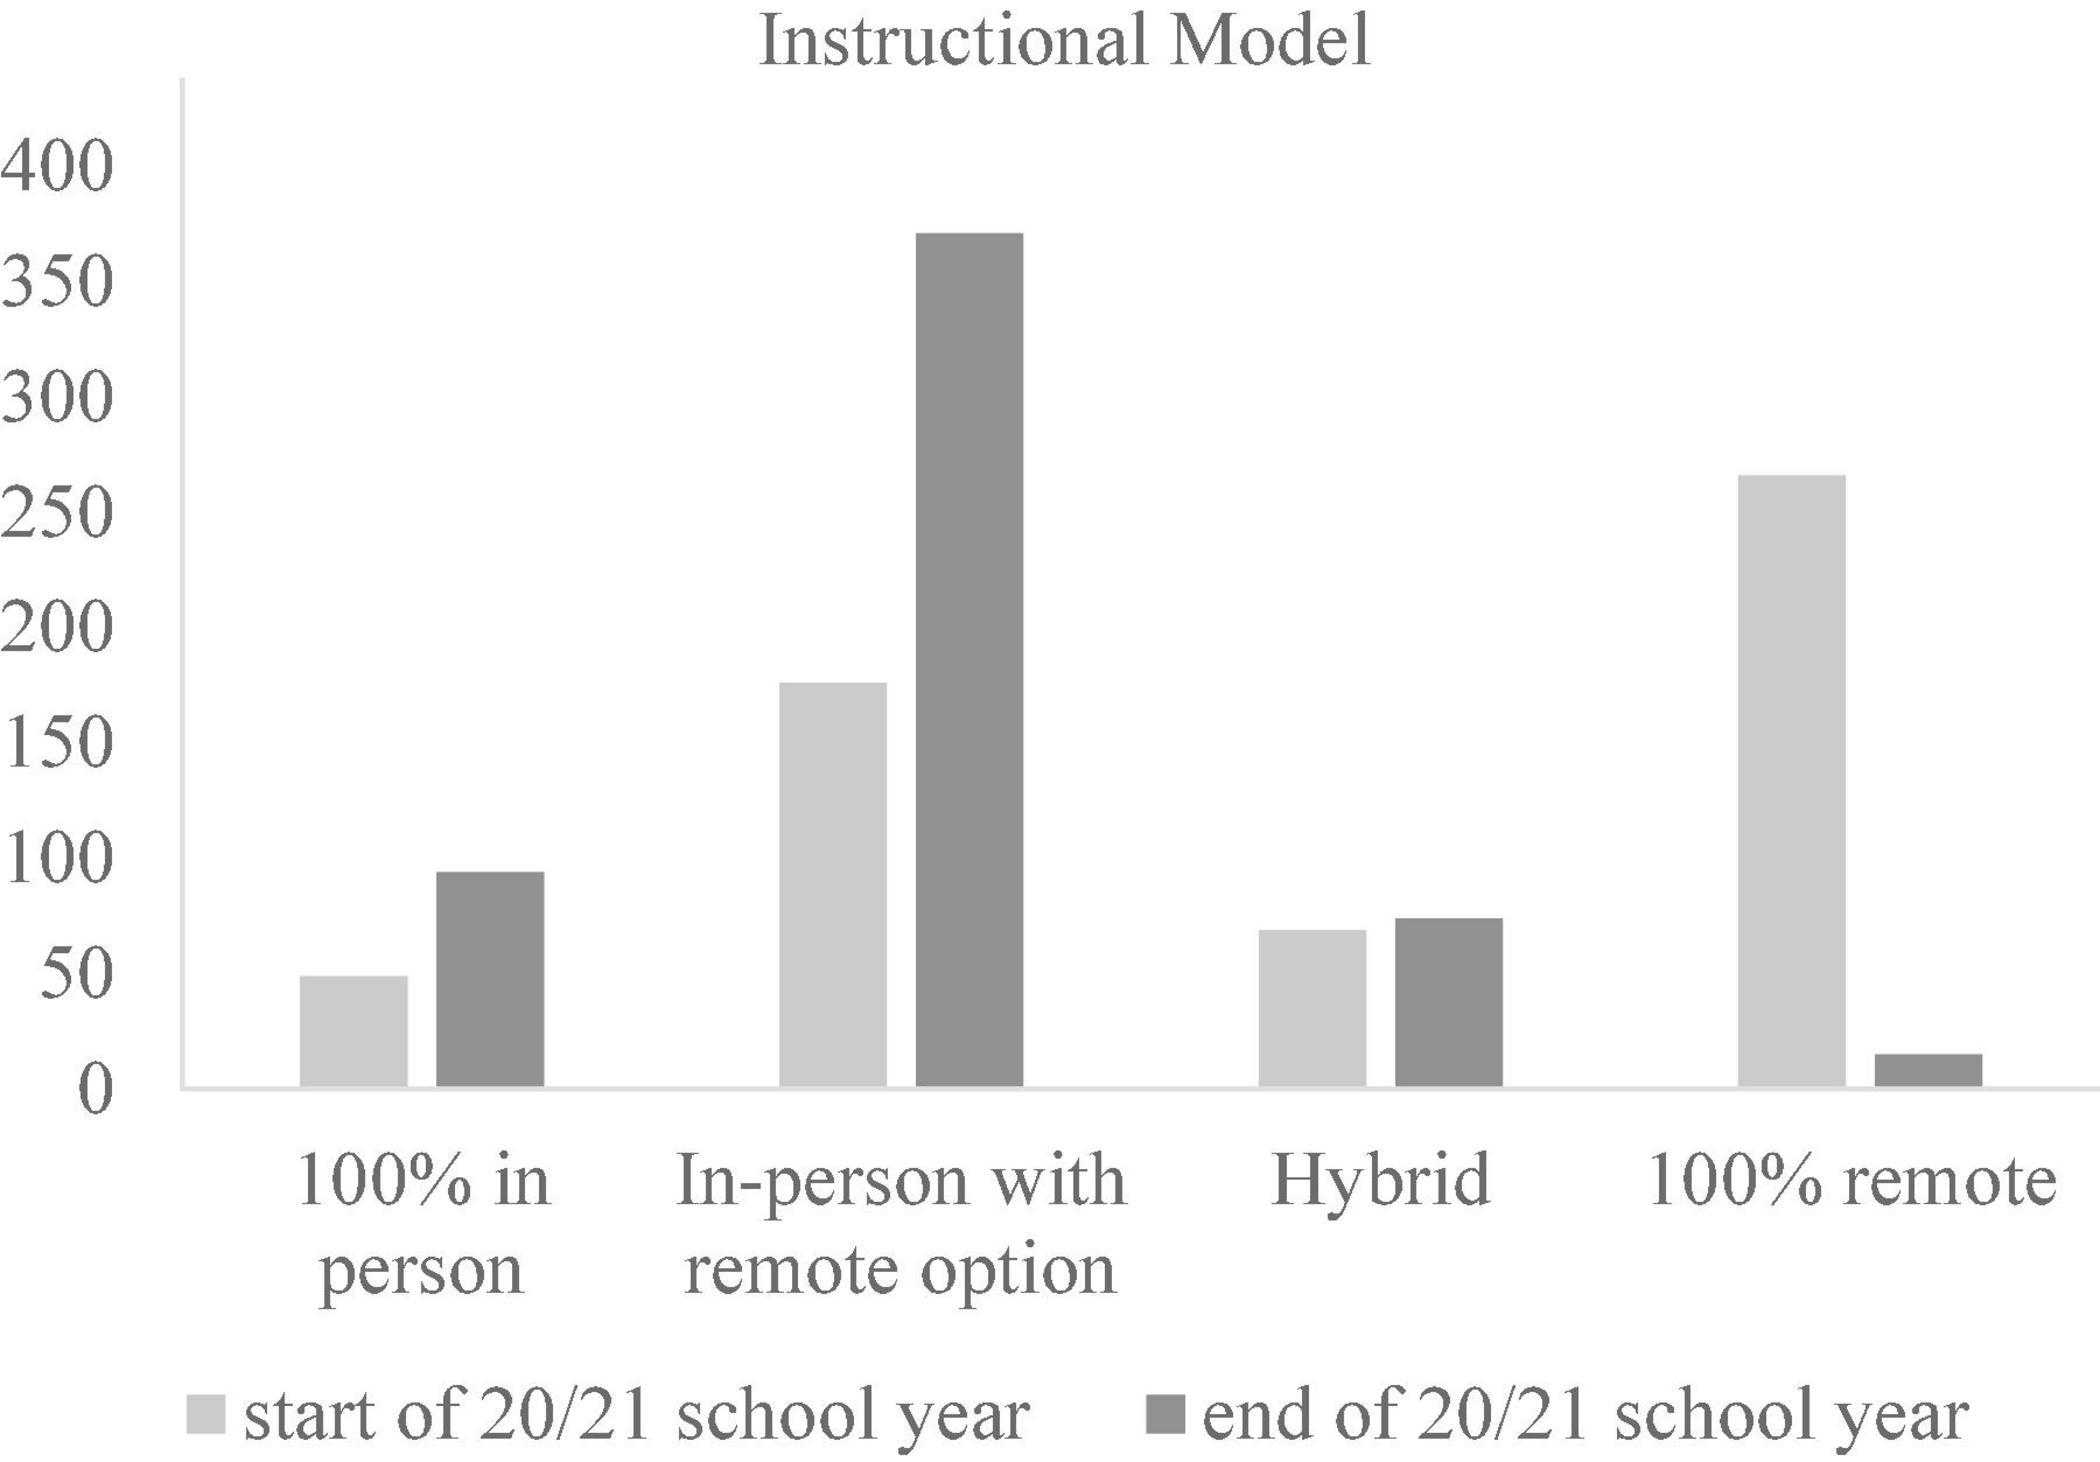
Figure 1. Teacher-reported school instructional models.
More specifically, 64.7% of teachers indicated that their instruction was 100% in person at least part of the 2020–2021 school year whereas 35.3% of teachers indicated that they never offered 100% in-person instruction. Among teachers who reported using a 100% in-person instructional model for at least part of the year, the percentage of the school year for which their school provided 100% in-person instruction varied: less than 20% of the school year (16.3%), between 21 and 40% (19.3%), between 41 and 60% of the year (15.2%), between 80 and 99% (15.8%), and 100% (19.0%).
Student Progress and Instruction in Academic Content Areas
Curriculum Coverage
Overall, teachers reported a significant decrease in the amount of planned curriculum they were able to cover in academic content areas (i.e., reading, mathematics, and writing) during the 2020–2021 school year compared to typical years. Figure 2 shows the percentage of planned curriculum teachers were able to cover in each academic area. During typical years prior to the COVID-19 pandemic, 93.3% of teachers indicated that they were able to cover more than 80% of planned curriculum in reading compared to only 43.8% of teachers during the 2020–2021 school year. In other words, more than half the teachers who responded to the survey (56.3%) were not able to cover 80% of their planned reading curriculum during the 2020–2021 school year, compared to only 6.7% of teachers during typical years. This pattern of findings was similar for mathematics. Only 53.2% of teachers reported that they were able to cover more than 80% of their planned curriculum in mathematics compared to 92.8% of teachers in typical years. For writing, about 30.9% of teachers indicated that they were able to cover more than 80% of planned curriculum during the 2020–2021 school year compared to 79.5% of teachers during typical years. Most teachers (85.4%) indicated that this change in their ability to cover the curriculum during the 2020–2021 school year was due to the pandemic. Other reasons reported by 4.8% of teachers included student absences, having a new administration team, and other natural disasters in addition to the pandemic.
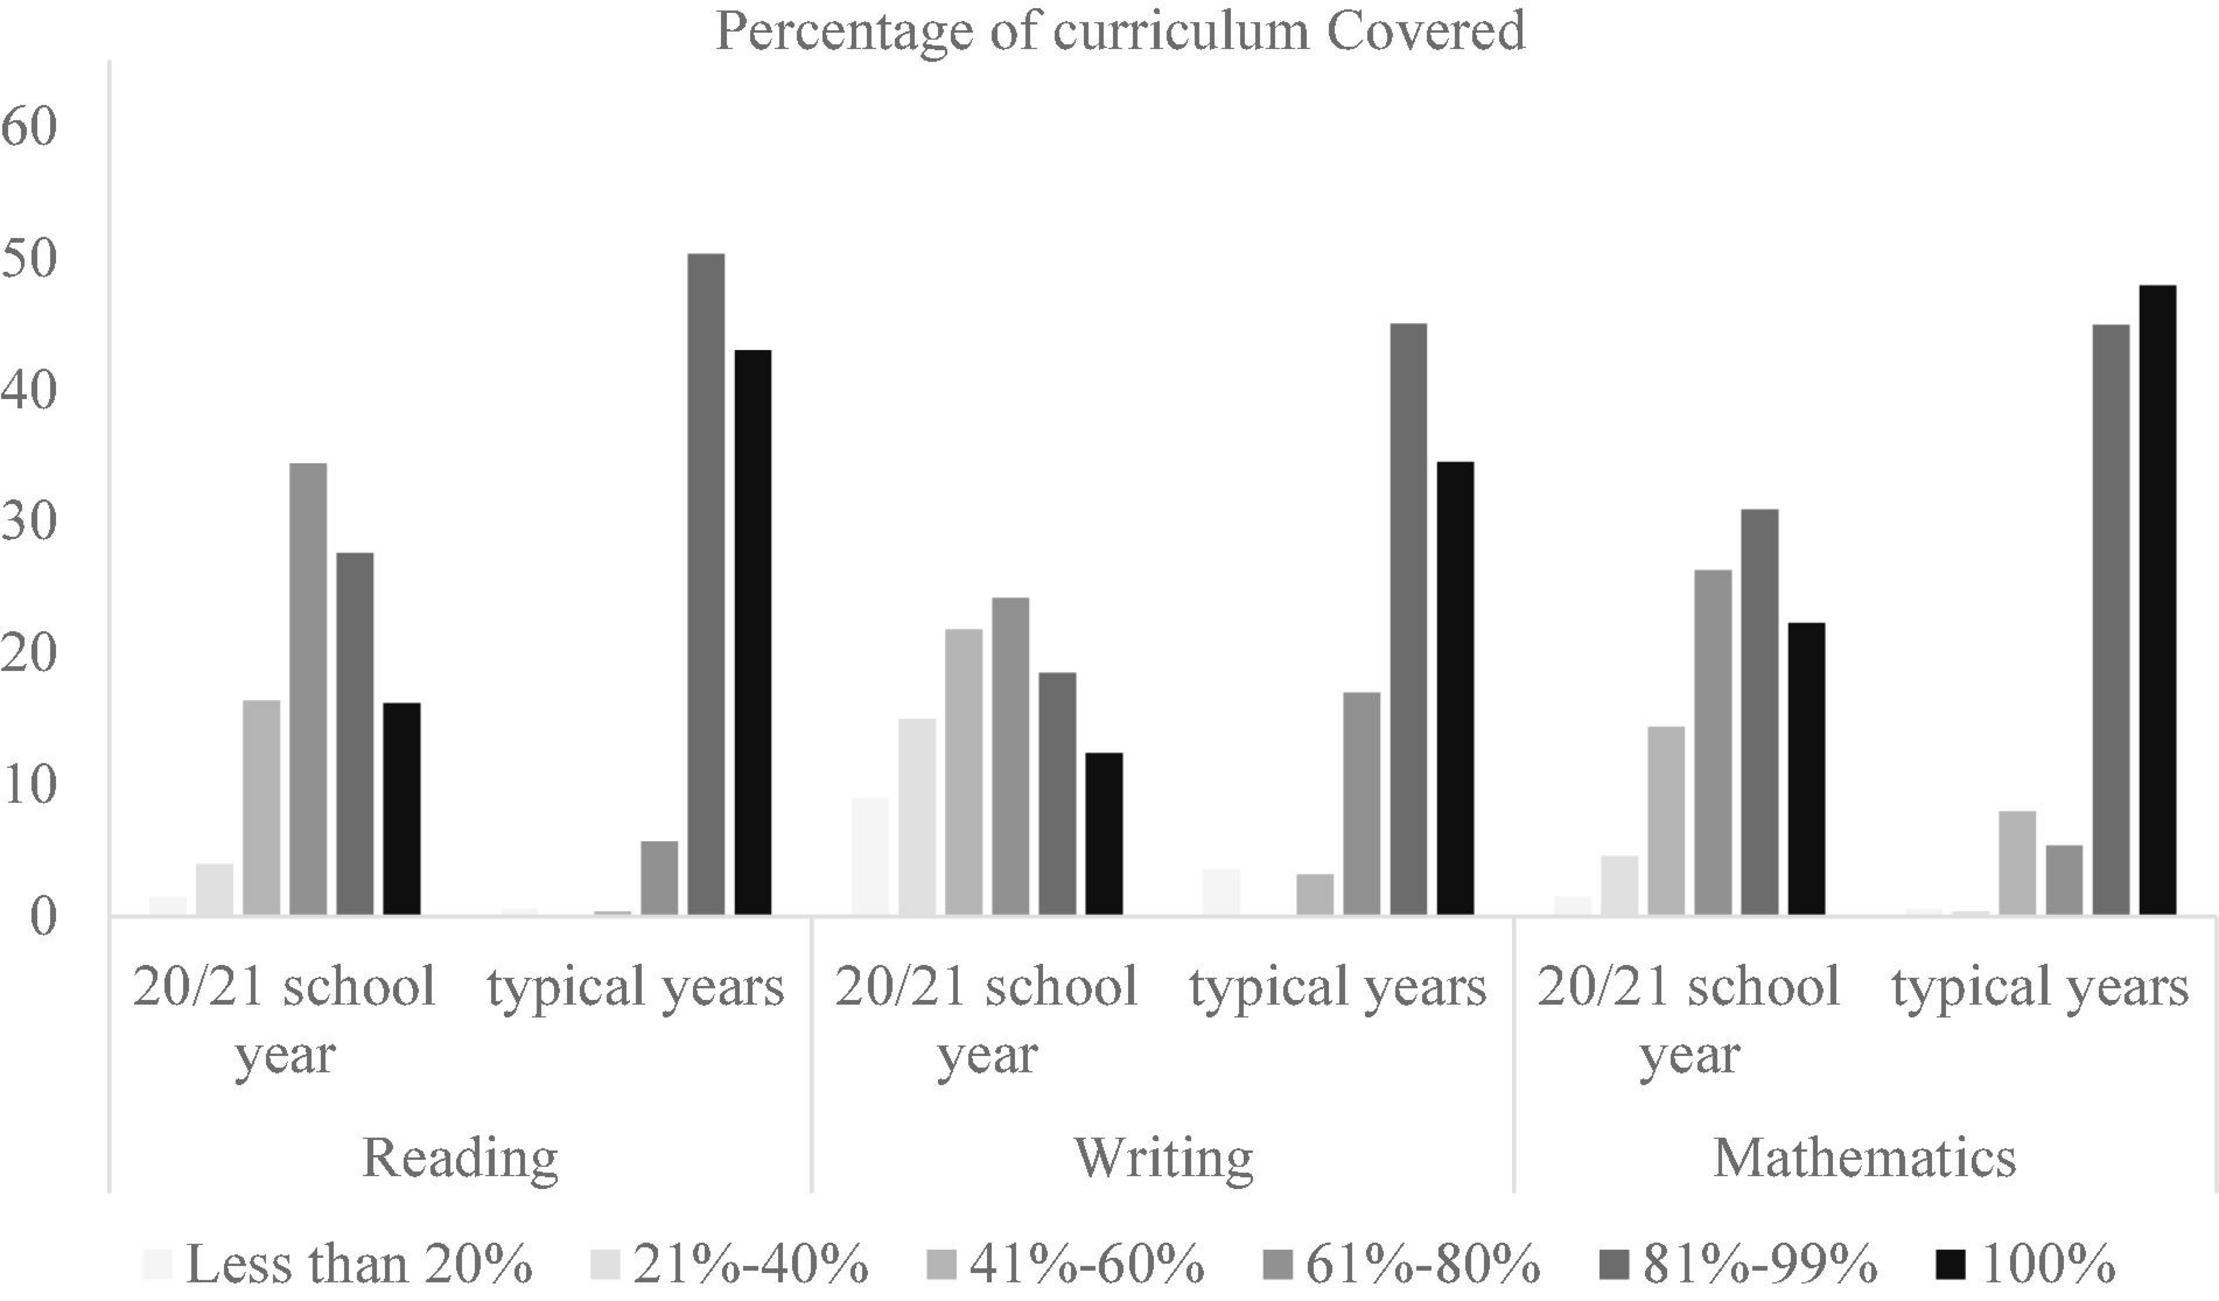
Figure 2. Percentage of curriculum covered in each academic area.
Students Needing Extra Support/Intervention
Teachers indicated that fewer students who needed extra support and/or intervention in academic content areas actually received the support during the 2020–2021 school year compared to typical years. During typical years, teachers reported students were able to receive extra support/intervention they needed in reading (74.9%), mathematics (71.2%), and writing (70.2%). However, there was a significant decrease in the percentage of teachers who indicated that students received the needed support during the 2020–2021 school year: 44.3% in reading, 49.2% in mathematics, and 41.9% in writing.
Student Readiness for Transition
Teachers reported fewer students were ready to transition to the next grade level at the end of 2020–2021 school year compared to typical years (see Figure 3). Whereas 68.9% of teachers indicated at least 80% of their students being ready to transition to the next grade in typical years, only about 31.9% of teachers reported at least 80% of their students were ready to transition to the next grade at the end of the 2020–2021 school year. About 29.4% of teachers indicated that less than 60% of their students were ready to transition to the next grade level compared to only 4.5% of teachers indicating less than 60% of their students ready to transition in typical years. The majority of teachers (65.5%) indicated that this drop in the percentage of students ready to transition to the next grade was due to the COVID-19 pandemic. A small portion of respondents (6.2%) indicated other reasons, which included a lack of student participation, lack of teacher knowledge, and lack of high-quality instruction.
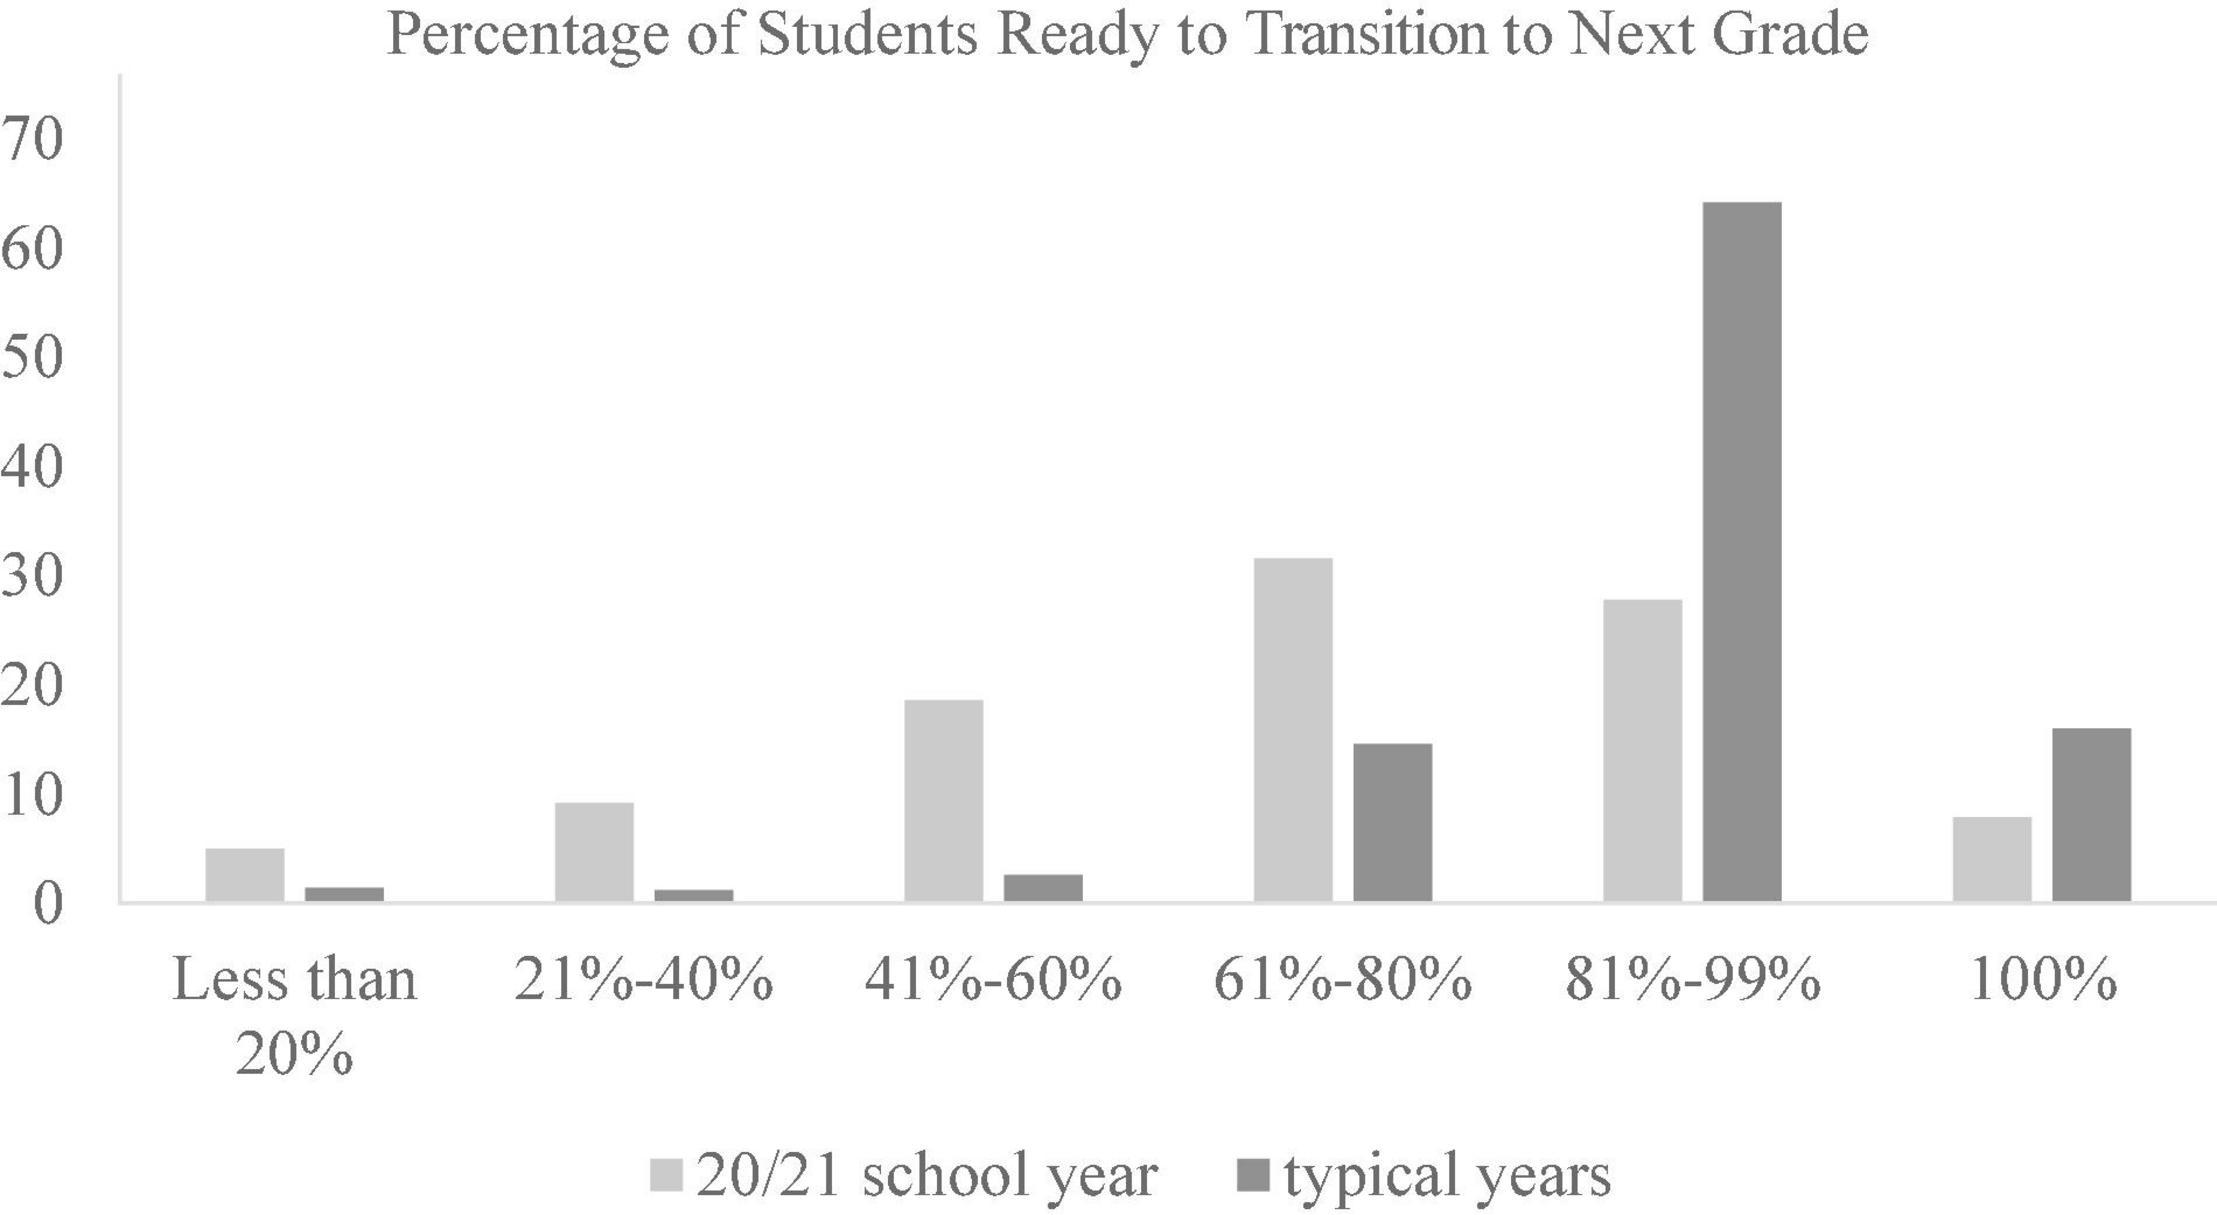
Figure 3. Percentage of students ready to transition to next grade.
Subpopulations of Students
Teachers rated the impact of the pandemic on their delivery of academic skills instruction on a 0 (no impact, delivery of academic instruction was typical) to 10 (high impact, students missed significant instructional time, delivery of instruction was very challenging, many students are behind) scale. Overall, the mean rating was 6.67 (SD = 2.64), indicating a moderate to large impact of the pandemic on teachers’ delivery of academic instruction. Teachers indicated significantly greater impacts for students from low-income backgrounds (M = 7.74, SD = 2.59) compared to those who were not from low-income backgrounds (M = 4.83, SD = 2.59), t(457) = 24.04, p < 0.001. Teachers also rated significantly greater impacts for students with IEPs (M = 7.43, SD = 2.90) compared to those without IEPs (M = 5.51, SD = 2.71), t(455) = 15.64, p < 0.001. Finally, teachers rated significantly greater impacts for English language learners (M = 7.31, SD = 2.88) compared to non-English language learners (M = 5.45, SD = 2.84), t(389) = 13.78, p < 0.001.
Overall, teachers rated that remote instruction was significantly less effective for students from disadvantaged backgrounds. Teachers rated remote instruction being more effective for students who were not from low-income backgrounds (M = 5.66, SD = 2.51) compared to students from low-income backgrounds (M = 4.13, SD = 3.02), t(432) = −10.17, p < 0.001. Teachers also rated that remote instruction was more effective for students without IEPs (M = 5.45, SD = 2.43) than it was for those with IEPs (M = 3.84, SD = 3.05), t(421) = −11.22, p < 0.001. Lastly, teachers rated that remote instruction was significantly more effective for students who were not English language learners (M = 5.45, SD = 2.53) compared to English language learners (M = 3.92, SD = 3.05), t(356) = −9.13, p < 0.001.
Inferential Analysis
Zero-Order Correlations
Our third research question focused on the relations between school achievement indexed by SEDA and various survey questions, including use of a 100% in-person instructional model, percentage of students ready to transition to the next grade level in Spring 2021, overall impact of the pandemic on academic skills instruction, and the impact of the pandemic on teachers’ ability to cover the curriculum and provide intervention for specific academic skills. There was a small correlation between school achievement and the percentage of time in which a 100% in-person instructional model was used (r = 0.19, p < 0.001), indicating higher achieving schools provided 100% in-person instruction more often than low achieving schools.
School achievement was moderately negatively correlated with overall ratings of the impact of the pandemic (r = −0.29, p < 0.001) and with teacher-reported impacts of the pandemic on the percentage of students ready to transition to the next grade level (r = −0.30, p < 0.001). This pattern of results indicated that teachers at higher achieving schools reported fewer negative effects of the pandemic, and teachers at higher achieving schools reported smaller differences in the number of students ready to transition to the next grade level between the 2020 and 2021 school year and typical years prior to the pandemic. School achievement was also correlated with teacher-reported impacts of the pandemic on specific academic content areas, but these correlations were small (rs range from −0.11 to −0.19, all ps < 0.05). There were small correlations between the percent of the year a 100% in-person instructional model was used and teacher-reported impacts of the pandemic (rs range from −0.18 to −0.22, all ps < 0.001), indicating that teachers who used more in-person instruction reported smaller impacts of the pandemic on their ability to cover the curriculum and the percentage of students who needed supplemental intervention for academic skills instruction.
Regression Analysis
To further evaluate our third research question, we examined predictors of the overall impact of the pandemic and the amount of the curriculum that was covered in reading, writing, and mathematics in the 2020–2021 school year, including SEDA school mean achievement and percentage of time in which a 100% in-person instructional model was used. Regression models predicting amount of curriculum covered in the 2020–2021 school year controlled for teacher reports of the amount of curriculum covered in typical years. Results are presented in Table 1. We note that negative correlations for overall impact indicate that more in-person instruction and higher achieving schools experienced fewer negative effects of the pandemic. Positive correlations for coverage of reading, writing, and mathematics curriculum indicate that more in-person instruction and higher achieving schools were associated with covering more of the planned curriculum for academic skills. Both school achievement and percentage of time using a 100% in-person instructional model were significantly predictive of overall impacts of the pandemic and teacher reported coverage of the reading, writing, and mathematics curriculum, even after controlling for teacher reported coverage of the curriculum in typical years. Higher school achievement and more use of a 100% in-person instructional model were associated with smaller negative impacts of the pandemic and greater coverage of academic curricula.
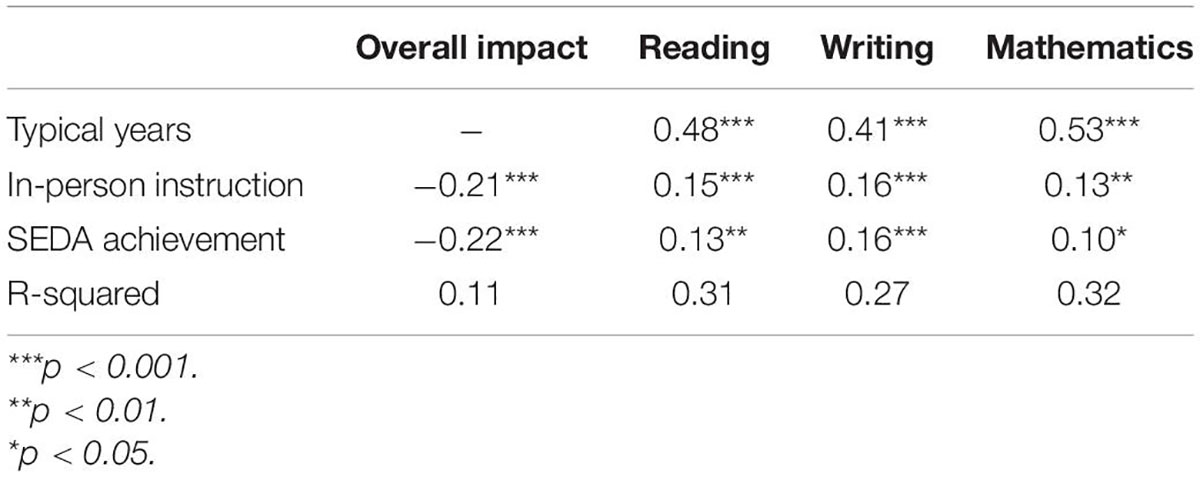
Table 1. Standardized regression coefficients predicting overall impact and coverage of curriculum.
Finally, we used logistic regression analysis to examine whether SEDA school achievement and percentage of time using a 100% in-person instructional model predicted whether there were students who needed extra intervention in reading, writing, and mathematics but did not receive it in the 2020–2021 school year, after controlling for whether there were students who needed extra intervention but did not receive it in typical years. These results are presented in Table 2. Use of a 100% in-person instructional model was only significant for mathematics, indicating that teachers who reported using more 100% in-person instruction were less likely to report having students who needed extra mathematics intervention but did not receive it; however, the magnitude of this effect was small. In contrast, higher achieving schools were significantly less likely than lower achieving schools to have students who needed additional intervention but did not receive it, even after controlling for students needing but not receiving intervention in typical years.
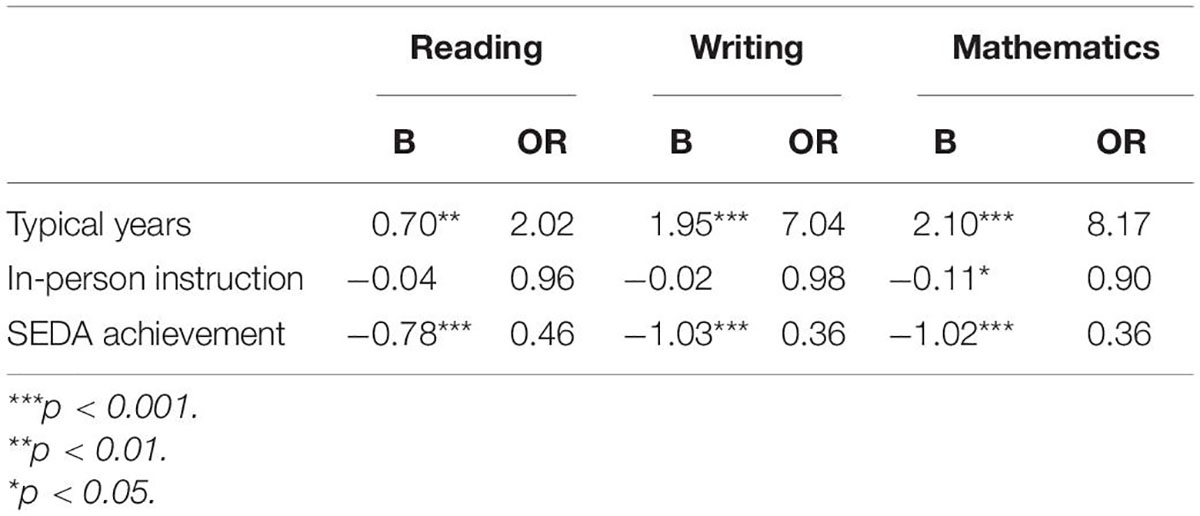
Table 2. Logistic regression models predicting whether students who needed additional supports for academic skills did not receive them.
Successes and Challenges of Instruction
For questions related to the successes and challenges of remote and in-person instruction during the 2020–2021 school year, teachers were allowed to indicate multiple items (i.e., check all that apply). Teachers indicated that having a lower teacher-student ratio would contribute to successful remote instruction (61.7%) followed by the structures and scheduling of remote instruction (52.6%), training opportunities (45%), and support personnel (e.g., paraprofessionals, 38.5%). The majority of other responses included having parental support at home and students’ access to better technology (internet access, remote instruction platform support), and having a teacher dedicated to remote instruction.
Teachers also indicated that distractions in students’ homes (71.1%), internet access/availability (61.0%), student attendance (60.8%), lack of face-to-face interactions with students (57.7%), difficulty with evaluating student work (55.7%), difficulty with monitoring student progress (48.8%), managing remote and in-person instruction simultaneously (42.6%), and difficulty with providing feedback on student work (40.7%) as challenges associated with delivering remote instruction. Other challenges included a lack of parental support/involvement, lack of student engagement, and parents or other household members completing student assignments or assessments.
Despite these challenges, teachers indicated that some positive takeaways during the 2020–2021 school year were students being more conscientious (68.6%), greater ability to provide individualized attention due to reduced class sizes or alternating days (21.6%), and more time for students to participate in academics due to reductions in extracurricular activities (21.1%). About 24.6% of teachers indicated that there were no positive takeaways from the 2020–2021 school year.
Discussion
The results of this survey provide important context about the instructional models used by schools during the 2020–2021 school year, how content coverage may compound issues related to learning losses in academic areas, and factors that may be related to the ability of schools to cover content and support students. Several studies have demonstrated that student achievement has been lower during the pandemic compared to prior to the pandemic, with estimates ranging from three percentile points in the Netherlands (Engzell et al., 2021) to more than half of a school year in the U.S. state of Illinois (Streich et al., 2021). Moreover, students’ academic motivation and participation in extracurricular activities, as perceived by their parents, decreased significantly during the COVID-19 pandemic (Zaccoletti et al., 2020).
Yet, the pandemic is not over, and with the continued struggle with the COVID variants in 2022 currently, students may be falling even further behind. The results of this survey suggest that most teachers were not able to cover at least 80% of their reading, writing, and mathematics curriculum, which was significantly lower than their reported ability to cover 80% of the curriculum in previous years. Teachers also clearly indicated that many fewer students were ready to transition to the next grade level at the end of the 2020–2021 school year. Using average reported class sizes and teacher responses for students not ready to transition to the next grade level, we estimated that 32.4% of students were not ready to transition, as compared to 13.9% in previous years (an increase of 18.5%). With 21.2 million K-5 students attending school in 2020 (National Center for Education Statistics, 2021), this means nearly 3.9 million more students (6.8 million total) were not ready to transition to the next grade, with likely disproportionate impacts on minoritized students.
Our findings also indicated that many students who needed extra support/intervention in the academic content areas did not receive needed support in the 2020–2021 school year. This is alarming because it has likely compounded learning losses already realized during school shutdowns in spring of 2020, and some schools still may not be fully covering the academic curriculum in the 2021–2022 school year. This suggests there will be long term and compounded effects if teachers continue to have difficulty implementing the full curriculum. Therefore, our findings call for immediate recovery efforts.
Kaffenberger (2021) projected that short-term (e.g., covering previous year’s curriculum before revering to the pre-pandemic curriculum) and long-term efforts (e.g., identifying students’ needs using formative assessments, adapting teacher instruction to students’ levels and needs) can reduce/remediate the learning loss. Therefore, substantial restructuring of current pre-pandemic curricula may be inevitable to minimize the compounded effects. In addition, some states have initiated alternative ways to offer additional instruction (e.g., Tennessee Tutoring Coprs). Continued efforts should be made to find alternative and innovative ways to provide additional learning opportunities to remediate the learning loss. Beyond the immediate educational needs, Fusco et al. (2021) suggested providing career support for students to better prepare them for the economic crisis and changes following the COVID-19 pandemic.
Our survey results indicated that most teachers relied on alternative forms of instruction and experienced changes during the 2020–2021 school year. Yet, the overall rating for teacher-reported effectiveness of remote instruction was low (M = 4.74). This finding suggests that continued development of high-quality online educational learning and support is also needed. Moreover, Zhu and Liu (2020) called for more quantitative and qualitative research to evaluate remote teaching and learning, and long-term sustainability. Consistent with teachers’ reports in our survey, as well as in Goodrich et al. (2022), more systematic training for school personnel is needed to improve the quality of remote instruction. Additionally, prior studies have found that family, school, and peer support increases student engagement, which in turn improves academic competence and achievement (e.g., Elias and Haynes, 2008; Estell and Perdue, 2013). As much as in-person school engagement is important to academic achievement and school completion, student engagement during remote instruction may be critical to promoting successful remote learning. Teachers who responded to our survey did note a lack of student engagement and parental support/involvement as a challenge to providing remote instruction. Such support from family, school, and peers may be especially important for students from disadvantaged backgrounds (Elias and Haynes, 2008).
Our survey results also add to the growing literature that the impacts of the COVID-19 pandemic on academic learning have disproportionately affected low-income students, minoritized students, and students with disabilities (see Dorn et al., 2020; Goodrich et al., 2022). In the current survey, teachers reported greater impacts of the pandemic on academic instruction for students with IEPs, low-income students, and English language learners. Our regression analyses corroborate these findings across schools as well, as higher school achievement was associated with smaller negative impacts on the curriculum coverage and fewer students requiring additional intervention. Our results also indicate that teachers in higher performing schools did not have to alter their instruction as much as teachers in lower performing schools. This may have played a role in the reported curriculum coverage and associated learning losses, as our results indicated that the amount of in-person instruction significantly contributed to teachers’ ability to cover the curriculum. These findings are important to consider when allocating resources for pandemic recovery efforts. Moreover, the COVID-19 induced economic damage and educational budget cuts are likely to have a greater impact on students from disadvantaged backgrounds. Recovery efforts should be considered carefully, so that they do not reinforce existing inequalities.
Our findings also add to the literature in an important way by providing teachers with an opportunity to identify other factors that may have contributed to their ability to cover the curricula and support their students. This can offer Federal and State Departments of Education with areas of opportunity for providing teachers with support, funding, or intervention resources. For example, teachers consistently reported that personnel and training resources can contribute to better implementation of instruction (including remote instruction). Solutions might include increasing the number of paraprofessionals to assist with instruction and/or providing training opportunities to teachers and paraprofessionals.
Positive Take-Aways and Potential Solutions
Approximately 75% of teachers indicated that there were also some positives that came out of the pandemic, including increases in student conscientiousness, prioritization of some academic content, and systems that resulted in more individual attention. Policymakers and administrators may want to consider thinking more flexibly about school schedules and supports for teachers and students moving forward. Alternating days for instruction for students to reduce class sizes may not be desirable or feasible in the long-term, but there may be other creative approaches to continue capitalize on the benefits of smaller student groupings, such as staggering start and end times for the school day.
Limitations
The samples of teachers who completed our surveys were generally representative of the population of teachers in the United States However, a large percentage of teachers did not respond to the surveys. Although responders and non-responders were similar in key demographic variables (e.g., SES, school setting, school type, grade level taught), it is possible that low response rate resulted in selection bias. It is also possible that the teachers may have under- or over-estimated other descriptive variables for their classrooms or were unaware of some of the school services provided by resource and special education teachers.
Implications and Conclusion
Schools in the United States have a large problem on their hands. Along with learning losses, many teachers report not covering as much of the academic curricula for students, especially in schools with lower achievement levels. This is an ongoing problem that is likely to be exacerbated, and it will likely continue to widen the opportunity gaps for minoritized students, low-income students, and students with disabilities. Policymakers, school administrators, and teachers must be cognizant of the challenges with implementing instruction consistently to adequately cover the necessary content each year, and even increase the content coverage and student support to accelerate recovery efforts. Of course, these considerations need to be weighed against public health safety, which is an important factor in deciding which educational models to implement. It will also be important for educational decision makers to consider these teacher report findings when allocating recovery resources, such as prioritizing lower achieving schools and students from disadvantaged backgrounds.
Data Availability Statement
The raw data supporting the conclusions of this article will be made available by the authors, without undue reservation.
Ethics Statement
The studies involving human participants were reviewed and approved by IRB at the University of Nebraska-Lincoln. The patients/participants provided their written informed consent to participate in this study.
Author Contributions
JN, JG, MH, and NK were equally responsible for the conduct of this research. All authors helped formulate the research questions to be included in surveys, assisted with survey distribution, data cleaning and analysis, and writing survey results for publication.
Conflict of Interest
The authors declare that the research was conducted in the absence of any commercial or financial relationships that could be construed as a potential conflict of interest.
Publisher’s Note
All claims expressed in this article are solely those of the authors and do not necessarily represent those of their affiliated organizations, or those of the publisher, the editors and the reviewers. Any product that may be evaluated in this article, or claim that may be made by its manufacturer, is not guaranteed or endorsed by the publisher.
References
Dillman, D. A. (2000). Mail and Internet Surveys: The Tailored Design Method. New York, NY: Wiley and Sons.
Dorn, E., Hancock, B., Sarakatsannis, J., and Viruleg, E. (2020). COVID-19 and Student Learning in the United States: The Hurt Could last a Lifetime. New York, NY: McKinsey & Company.
Elias, M. J., and Haynes, N. M. (2008). Social competence, social support, and academic achievement in minority, low-income, urban elementary school children. Sch. Psychol. Q. 23, 474–495. doi: 10.1037/1045-3830.23.4.474
Engzell, P., Frey, A., and Verhagen, M. (2021). Learning loss due to school closures during the COVID-19 pandemic. Proc. Natl. Acad. Sci. U.S.A. 118:e2022376118. doi: 10.1073/pnas.2022376118
Estell, D. B., and Perdue, N. H. (2013). Social support and behavioral and affective school engagement: the effects of peers, parents, and teachers. Psychol. Sch. 50, 325–337. doi: 10.1002/pits.21681
Fusco, L., Parola, A., and Sica, L. S. (2021). Life design for youth as a creativity-based intervention for transforming a challenging world. Front. Psychol. 12:662072. doi: 10.3389/fpsyg.2021.662072
Goodrich, J. M., Hebert, M., and Namkung, J. M. (2022). Impacts of the COVID-19 pandemic on elementary school teachers’ practices and perceptions across the spring and fall 2020 semesters. Front. Educ. 6:793285. doi: 10.3389/feduc.2021.793285
Hussar, B., Zhang, J., Hein, S., Wang, K., Roberts, A., Cui, J., et al. (2020). The Condition of Education 2020 (NCES2020-144). U.S. Department of Education. Washington, DC: National Center for Education Statistics.
Kaffenberger, M. (2021). Modelling the long-run learning impact of the Covid-19 learning shock: actions to (more than) mitigate loss. Int. J. Educ. Dev. 81:102326. doi: 10.1016/j.ijedudev.2020.102326
Kuhfeld, M. (2019). Suprising new evidence on summer learning loss. Phi Delta Kappan 101, 25–29. doi: 10.1177/0031721719871560
Kuhfeld, M., Soland, J., Tarasawa, B., Johnsons, A., Ruzek, E., and Liu, J. (2020). Projecting the potential impact of COVID-19 school closures on academic achievement. Educ. Res. 49, 549–565.
National Center for Education Statistics (2021). State Nonfiscal Survey of Public Elementary/Secondary Education, 1999–2000 Through 2019–20 and 2020–21 Preliminary. Available online at: https://nces.ed.gov/programs/digest/d21/tables/dt21_203.65.asp
Reardon, S. F., Ho, A. D., Shear, B. R., Fahle, E. M., Kalogrides, D., Jang, H., et al. (2021). Stanford Education Data Archive (Version 4.1). Available Online at: http://purl.stanford.edu/db586ns4974 (accessed June 15, 2022).
Stanistreet, P., Elfert, M., and Atchoarena, D. (2020). Education in the age of COVID-19: understanding the consequences. Int. Rev. Educ. 66, 627–633. doi: 10.1007/s11159-020-09880-9
Streich, F., Pan, J., Ye, C., and Xia, J. (2021). REL Report: Estimating Changes to Student Learning in Illinois Following Extended School Building Closures Due to the COVID-19 Pandemic. Columbia: Institute of Education Sciences.
United Nations (2020). Policy Brief: Education During COVID-19 and Beyond. Available Online at: doi: 10.18356/21e7d903-en (accessed June 15, 2022).
von Hippel, P. T., Workman, J., and Downey, D. B. (2018). Inequality in reading and math skills forms mainly before kindergarten: a replication, and partical correction, of “Are schools the great equalizer?” Sociol. Educ. 91, 323–357.
Zaccoletti, S., Camacho, A., Correia, N., Aguiar, C., Mason, L., Alves, R. A., et al. (2020). Parents’ perceptions of student academic motivation during the COVID-19 lockdown: a cross-country comparison. Front. Psychol. 11:592670. doi: 10.3389/fpsyg.2020.592670
Keywords: COVID-19, survey research, elementary school, academic instruction, opportunity gaps
Citation: Namkung JM, Goodrich JM, Hebert M and Koziol N (2022) Impacts of the COVID-19 Pandemic on Student Learning and Opportunity Gaps Across the 2020–2021 School Year: A National Survey of Teachers. Front. Educ. 7:921497. doi: 10.3389/feduc.2022.921497
Received: 15 April 2022; Accepted: 10 June 2022;
Published: 07 July 2022.
Edited by:
Muhammet Usak, Kazan Federal University, RussiaReviewed by:
Alfiya R. Masalimova, Kazan Federal University, RussiaAnna Parola, University of Naples Federico II, Italy
Copyright © 2022 Namkung, Goodrich, Hebert and Koziol. This is an open-access article distributed under the terms of the Creative Commons Attribution License (CC BY). The use, distribution or reproduction in other forums is permitted, provided the original author(s) and the copyright owner(s) are credited and that the original publication in this journal is cited, in accordance with accepted academic practice. No use, distribution or reproduction is permitted which does not comply with these terms.
*Correspondence: Jessica M. Namkung, am5hbWt1bmdAdWRlbC5lZHU=