 Stephanie A. Moore
 Rachel R. Ouellette2
 Elizabeth H. Connors
- 1School of Education, University of California, Riverside, Riverside, CA, United States
- 2Department of Psychiatry, School of Medicine, Yale University, New Haven, CT, United States
Introduction: School climate consistently predicts youth academic success, social–emotional well-being, and substance use, and positive school climate can buffer the negative effects of community violence exposure on youth development. Various structural school and neighborhood factors have been associated with school climate, but prior research has not examined these relations comprehensively.
Methods: We examined the relation between 18 school building and school neighborhood factors with student-reported school climate among 15,833 students in 124 public schools in a large, urban district in the United States.
Results: In this sample, attendance rate was most consistently associated with school climate (β = 0.015; p < 0.001). Teacher years of experience, mobility rate, number of students in special education, adult arrests in the school neighborhood, and service calls for shootings and dirty streets and alleys in the school neighborhood were also significantly associated with various domains of school climate.
Conclusions: These findings highlight the need for future longitudinal research on the influence of both school building and school neighborhood factors on school climate for public schools. Schools in our sample had a wide range of school climate scores despite consistently high crime rates and other structural risk factors such as low socioeconomic status throughout the city, so there are implications for researchers and education leaders to work together to identify opportunities for schools to foster positive school climate despite systemic school and/or neighborhood risk factors.
1. Introduction
There is growing emphasis in education, children’s behavioral health, public health, and public policy on promoting safe and supportive schools to optimize student well-being, resilience, and success (National Center for Safe and Supportive Schools, 2020; U.S. Department of Education, 2022a, b). Simultaneously, there is an enduring understanding of the effects of neighborhood characteristics and concentrated disadvantage on child and adolescent well-being and academic outcomes (Leventhal and Brooks-Gunn, 2000; Sampson et al., 2008) and an increasing nationwide concern about community safety and the impact of neighborhood risk, such as exposure to neighborhood violence and adverse events, on students and their school experience (e.g., Burdick-Will, 2018; Ruiz et al., 2018). Positive school climate is one protective factor that can buffer the negative effects of community violence exposure on students’ later development of trauma symptoms and academic underachievement (Ozer et al., 2010; O'Donnell et al., 2011). School climate consistently predicts numerous youth outcomes, including academic success (e.g., Kwong and Davis, 2015), social–emotional well-being (e.g., Ruus et al., 2007), and substance use (e.g., Gase et al., 2017). Various school and neighborhood factors have been associated with school climate (e.g., O'Donnell et al., 2011; Starkey et al., 2019), but prior research has not examined these relations within the same analytic models to compare strength of effects in predicting school climate in a local school system context. It remains unclear which factors are most strongly related to school climate and may be the most impactful levers for effecting change. There is a pressing need to better understand community- and school-level predictors of school climate, particularly in communities with high crime rates and other structural factors such as low socioeconomic status that confer higher risk to individuals.
Before we can begin to predict school climate, we first need to understand how to measure it. School climate is a multidimensional construct reflected in numerous theoretical frameworks and measurement tools (e.g., Thapa et al., 2013; Wang and Degol, 2016). Common school climate dimensions include: (1) Academic, including a positive and effective learning environment; (2) Community, including healthy and supportive relationships across and between students, teachers, and other school staff; (3) Safety, including both physical and social–emotional safety; and (4) Institutional Environment, including perceptions of organizational resources and environmental features of the school (Wang and Degol, 2016). Student-reported school climate focuses on students’ subjective experience of their school’s “norms, goals, values, interpersonal relationships, teaching and learning practices, and organizational structures,” as, “socially, emotionally and physically safe” (National School Climate Council, 2007, pp. 4–5). Validated measures of school climate exist (e.g., U.S. Department of Education School Climate Surveys, American Institutes of Research, 2022), however a wide array of measures are used in practice by schools and in research (Grazia and Molinari, 2021). Definitions of school climate and measured constructs vary considerably among existing tools (Thapa et al., 2013).
While school climate focuses on students’ subjective experiences at school, this differs from structural school building factors, such as student-teacher ratios, level of teacher experience, enrollment, and student mobility. Johnson et al. (2017) highlight the importance of examining both structural school-level factors (e.g., observed features of school physical and social environment) and student perceptions of school climate, as school environment changes were only associated with decreased student violence if there were corresponding changes in students’ perceptions of their school. School factors include tangible aspects of the school environment while school climate is based on students’ subjective experiences, so examining school factors as predictors of school climate enables researchers and school districts to identify objectively-measured aspects of the school environment that could be malleable to change to improve school climate. There are many facets that construct and influence a school’s physical, social, emotional, and academic environment. Different school structural factors, including class size and faculty turnover, have been associated with specific domains of school climate, including perceptions of order and discipline as well as academic motivation (Koth et al., 2008; Bradshaw et al., 2009; O'Donnell et al., 2011; Steinberg et al., 2015; Starkey et al., 2019). One study of 1,881 fifth-graders found that student mobility, student-teacher ratio, faculty turnover and principal change were significantly related to student-reported school climate (Bradshaw et al., 2009). Most studies examine predictors of overall school climate, however specific subdomains of school climate (e.g., supportive relationships; Hopson et al., 2014) are particularly strong predictors of student outcomes (e.g., positive behaviors and academic success), highlighting the importance of identifying predictors of specific school climate domains. Indeed, there are a small handful of studies examining school building and school neighborhood factors as predictors of school climate, and the results are mixed. Much still needs to be understood about the association between specific school factors with different school climate dimensions to identify the most impactful levers for change at the school and school neighborhood level towards improving different facets of school climate.
In terms of how neighborhood and community contexts surrounding schools influence perceived climate on school grounds, a long history of research demonstrates significant associations between student experiences in the neighborhood and at school, but these relations are complex and somewhat inconsistent. For example, multiple studies identify positive associations between neighborhood violence and school violence (Laub and Lauritsen, 1998; Siller et al., 2021), as well as between students’ perceived neighborhood safety and perceived school safety (Hong and Eamon, 2012). However, Limbos and Casteel (2008) found no statistically significant association between neighborhood and school crime among a sample of 95 Los Angeles middle and high schools, but identified neighborhood dilapidation as positively and significantly associated with school crime after controlling for neighborhood crime. Foster and Brooks-Gunn (2013) also identified residential instability as a significant and positive predictor of school victimization. These results highlight how multiple neighborhood factors, including crime rates, concentrated poverty, housing instability, and ineffective infrastructure can influence students’ school experiences, but that these trends vary depending on the neighborhood factor and locale.
While there is substantial research connecting neighborhood-level risk factors with negative school outcomes, such as school crime and victimization, there is limited literature connecting neighborhood factors with the positive dimensions of school climate (e.g., perceived safety). Neighborhood factors and school climate have been separately demonstrated as significant predictors of student outcomes, including academic success and social–emotional well-being (Chetty and Hendren, 2015; Wang and Degol, 2016). When entered into the same analytic models, school climate is frequently identified as a significant moderator and/or mediator of the negative association between neighborhood-level risk factors (e.g., community violence) and student outcomes, including externalizing behaviors (Gaias et al., 2019), post-traumatic stress (O'Donnell et al., 2011) social–emotional development (Starkey et al., 2019), test scores (Laurito et al., 2019), and academic achievement (Hopson and Lee, 2011; McCoy et al., 2013). However, these associations are not consistent (Hardaway et al., 2012; Coker, 2016) and differ across dimensions of school climate (Starkey et al., 2019) and levels of community violence exposure (O'Donnell et al., 2011). This calls for a more nuanced understanding about the relation between neighborhood factors and specific subdomains of school climate.
Studies have also highlighted the collective impacts of school and neighborhood factors on student outcomes. For example, Kirk (2009) found that school collective efficacy helped compensate for the absence of neighborhood collective efficacy in predicting school suspension, and youth experiencing a lack of both neighborhood and school collective efficacy were most at risk for future arrest. This emphasizes the importance of examining the effects of school building factors (i.e., inside the schoolhouse) and school neighborhood factors (i.e., surrounding the schoolhouse). This area of inquiry is supported by the more recent Systems View of School Climate which is a theoretical framework situating school climate within the broader ecological systems of the school, family, community, social and educational systems (Rudasill et al., 2018). While both school and neighborhood factors are frequently associated with school climate in the literature, these associations vary across studies, with different school and neighborhood factors identified as the most salient predictors of school climate depending on the study and subdomain of school climate that is entered into the model. These variations in study findings may be due to differences in contextual factors that influence which school and neighborhood factors are most significant in impacting students’ school experiences as well as variation in how school climate is measured across school districts. This makes it difficult to apply previous empirical findings to inform local change efforts within schools who want to create a more positive climate.
Our study presents an analytic strategy for examining local school and neighborhood data in a large, urban district with some of the highest crime rates in the nation to identify the most salient school- and neighborhood-level predictors of school climate in that context. Within this study, we: (1) analyze the factor structure of a local school climate measure; (2) examine unique associations of theoretically-selected school building and school neighborhood predictors of school climate; and (3) examine predictors of overall school climate and climate subdomains to identify similarities and differences in predictors across different aspects of school climate. This analytic approach presents a method for school systems to apply available data from their building and surrounding neighborhood to contribute to a localized understanding of what may be driving student-reported school climate.
2. Materials and methods
2.1. Data sources
This cross-sectional, multilevel study merged secondary data from four different sources indexed at the school and neighborhood level. First, student-reported school climate data were collected by Baltimore City Public Schools district in the spring of 2017 for the 2016–2017 school year as part of an annual school climate survey administered to students, parents, and staff. Use and secure transfer of these data were approved by the Baltimore City Institutional Review Board. School climate data were obtained for 124 schools (see “Sample” and Table 1 for more information on the final sample). There were no exclusion criteria; we used all available 3rd through 5th grade student-reported data. Second, neighborhood predictors were obtained in October 2019 from a public-domain database comprised of numerous data sources from 2016 that is maintained by the Baltimore Neighborhood Indicators Alliance-Jacob France Institute (BNIA-JFI). BNIA-JFI organizes neighborhood data specific to Baltimore city by Community Statistical Area boundaries (N = 55), which are based on U.S. Census tracks and are consistent over time (Baltimore Neighborhood Indicators Alliance, 2018). Neighborhood predictors from the BNIA-JFI database that were included in this study were selected based on review of the literature (e.g., Nieuwenhuis and Hooimeijer, 2016; see Supplementary File 1). Third, school-level predictors were selected based on review of the available literature (e.g., Thapa et al., 2013; Wang and Degol, 2016; see Supplementary File 1) and 2016–2017 data were obtained for each school from one of two sources, which were Great Schools (GreatSchools, 2022) and the Maryland School Report Card. GreatSchools is a U.S.-based nonprofit organization that provides information about school quality that is collected from states’ departments of education and the U.S. federal government (GreatSchools, 2022). The Maryland School Report Card depicts data collected by schools and districts as part of the state’s federally-required educational accountability system (Every Student Succeeds Act [ESSA], 2015). Data for each Baltimore City Public School included in this study were obtained by a manual search of each organization’s online user interface.
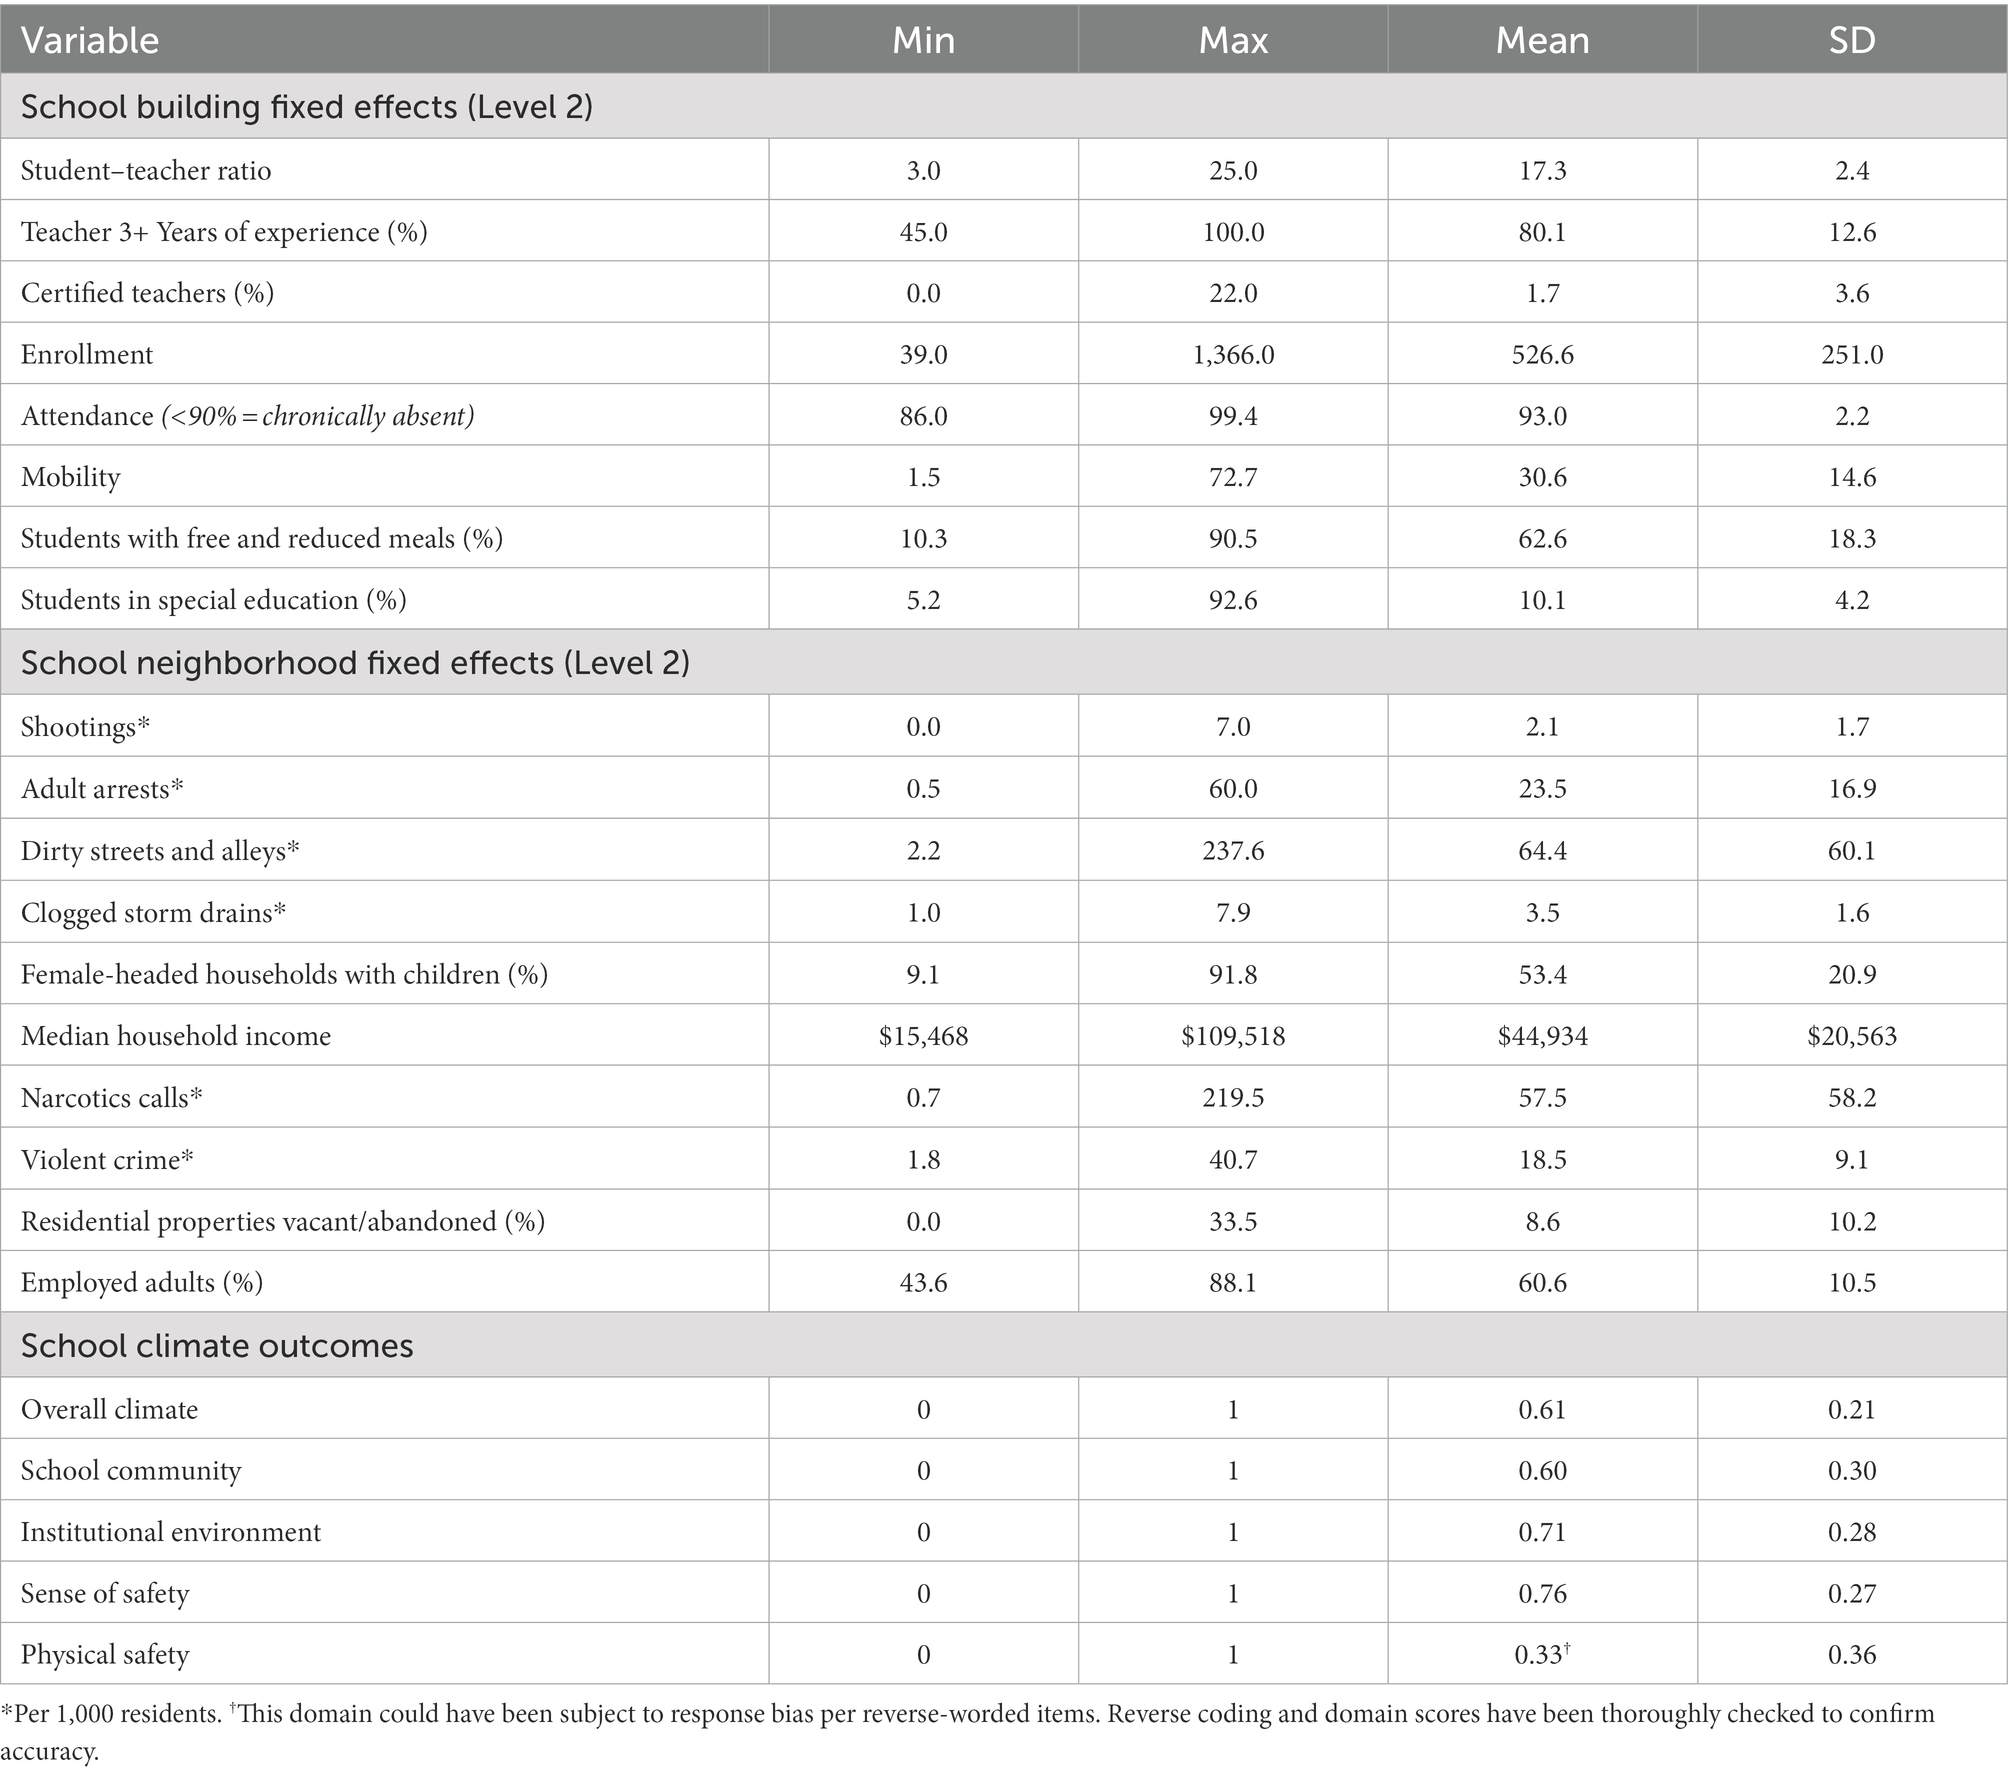
Table 1. Descriptive statistics for variables in multilevel models.
Factor analyses on the school climate measure were conducted on the school climate data alone (i.e., the first data source described above). However, the multilevel models, which were the primary analysis for our research questions, were conducted on a merged dataset including all four data sources. Data from each data source were merged based on their nested structure and cleaned using Microsoft Excel and SPSS. First, all neighborhood-level predictor data from BNIA-JFI were merged by community statistical area number. Second, the aggregate school-level predictor data from GreatSchools and the Maryland School Report Card were merged by school number. Schools were then matched to community statistical area by school address lookup on the BNIA website. Fourth, school building and school neighborhood data were merged by community statistical area number that belonged to the school address. Finally, student-level school climate survey data were merged by school number. This resulted in a fully-nested hierarchical model in which students are nested within school buildings nested within school neighborhoods. We hypothesized that both school and neighborhood factors would be associated with student-reported school climate.
2.2. Measures
2.2.1. School climate
Student-reported school climate data were from a survey with 31 school climate items (Supplementary File 1; Supplementary Table S1), scored on a dichotomous zero (Disagree) or one (Agree) scale, collected by the Baltimore City Public Schools. The internal structure of the school climate measure had not been previously validated. Therefore, the first and senior first author independently reviewed all 31 items for alignment with school climate constructs as operationalized by the ED School Climate Model domains and topics (U.S. Department of Education, 2022a). Following consensus discussions, we removed 11 items for non-relevance (e.g., grit, general satisfaction, academic performance). We then independently reviewed and coded the remaining 20 items as being either representative or not representative of individual school climate constructs (e.g., safety), also as operationalized by the ED School Climate Model domains and topics (U.S. Department of Education, 2022a). Final codes for each item were reached via consensus discussions and supported by Wang and Degol’s (2016) review of the school climate construct and its measurement. One additional item was removed for non-relevance (i.e., “my teachers can give me extra help with schoolwork when I need it”) and the remaining 19 items were coded into three school climate domains: community (n = 6), institutional environment (n = 6), and safety (n = 7).
Given our hypotheses about the internal structure of the school climate measure, we began our internal structure validation process with confirmatory factor analysis or “CFA” (Byrne, 2005). A CFA using weighted least squares with mean and variance adjustment (WLSMV) estimation (Rhemtulla et al., 2012) was conducted with the remaining 19 items loading onto our three theoretically informed domains (i.e., community, institutional environment, safety). However, the CFA yielded poor fit: Comparative Fit Index (CFI) = 0.78, Tucker Lewis Index (TLI) = 0.74, and Root Mean Square Error of Approximation (RMSEA) = 0.076 (90% Confidence Interval [CI] = 0.075, 0.078; Browne and Cudeck, 1989; Hu and Bentler, 1998). We then removed two items with standardized loadings below 0.40 prior to running a second CFA (17 items), but model fit did not improve, and the model modifications indices were theoretically incongruent. Therefore, we conducted an exploratory factor analysis (EFA) using a randomly-selected half of the data to identify potential avenues for model re-specification (Schmitt, 2011). Results of an EFA performed with 17 items for one to six domains supported adding a fourth domain, comprised of three “safety” items that were each reverse coded and measured aspects of Physical Safety (e.g., “Students fighting is a problem at this school”), and removal of two additional items (i.e., one that loaded poorly across domains and another that had poor response variability). A final CFA specifying four domains—School Community, Institutional Environment, Sense of Safety, and Physical Safety—on the 15 remaining items and using the second half of the data resulted in acceptable fit: CFI = 0.92, TLI = 0.90, RMSEA = 0.057 (CI = 0.056, 0.059). The final item loadings are included in Table 2.
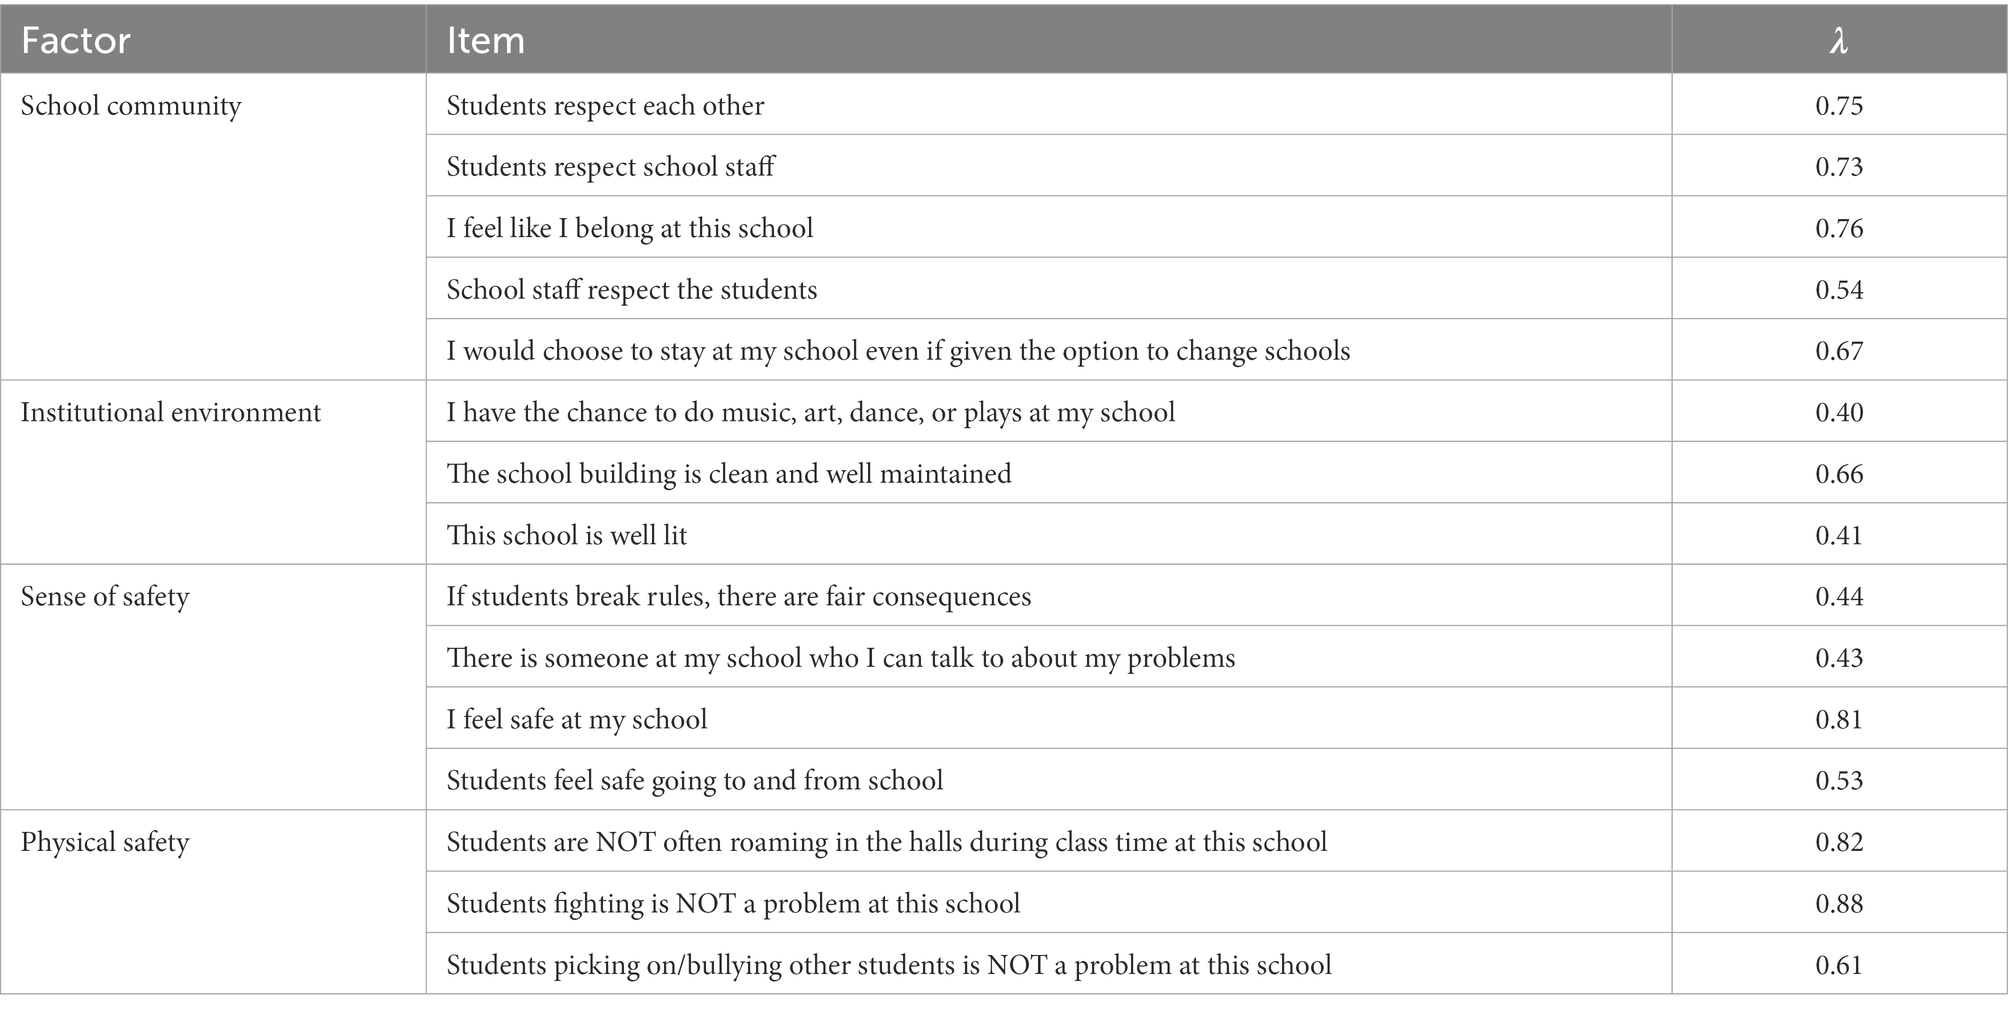
Table 2. Standardized factor loadings for the four-factor CFA model.
The factor solution of the final CFA was used to calculate mean scores for each school climate domain to be used as outcome variables in the multilevel model. The final measure included 15 items with the four domains including (1) School Community, five items referring to mutual respect among students and staff as well as sense of belonging; sample item: “I feel like I belong at this school; (2) Physical Safety, three items referring to student fights, bullying, and students roaming the halls during class time; sample item: “Students fighting is a problem at this school” (reverse scored); (3) Sense of Safety, four items referring to feeling safe at school and going to and from school, perceiving fair consequences and having someone to talk to about problems; sample item: “I feel safe at my school”; and (4) Institutional Environment, three items referring to the physical building being clean, well-lit, and students having access to the arts at school; sample item: “The school building is clean and well maintained.” Overall climate was calculated by mean scores of the 15 items.
Although the factor structure of school climate measure was established to identify distinct subdomains within the overall climate score, mean scores for all school climate domains and overall climate were significantly, and positively correlated with one another (p < 0.001). The strength of correlations were lowest for Physical Safety with the other domains and overall climate (r-values range from 0.10 with Sense of Safety to 0.52 with Overall Climate). However, these correlations are to be expected given the large sample size and that measured domains are considered to be part of the overall construct of climate.
2.2.2. School building and school neighborhood predictors
We selected school and school neighborhood predictors that were hypothesized to be relevant to school climate based on theory and our prior review of the literature (See Supplementary File). Two of the authors reviewed available secondary datasets to select fixed effects, and then identified data within the same 12 months of the time frame that school climate data were selected (e.g., 2016–2017). See Table 3 for a list of all school and neighborhood variables tested as fixed effects on school climate, including their data source and operational definition. More information about these variables can be found via each of the data sources, including Great Schools,1 Maryland School Report Card2 and Baltimore Neighborhood Indicators Alliance.3 All data were available in aggregate for either the school or community statistical area.
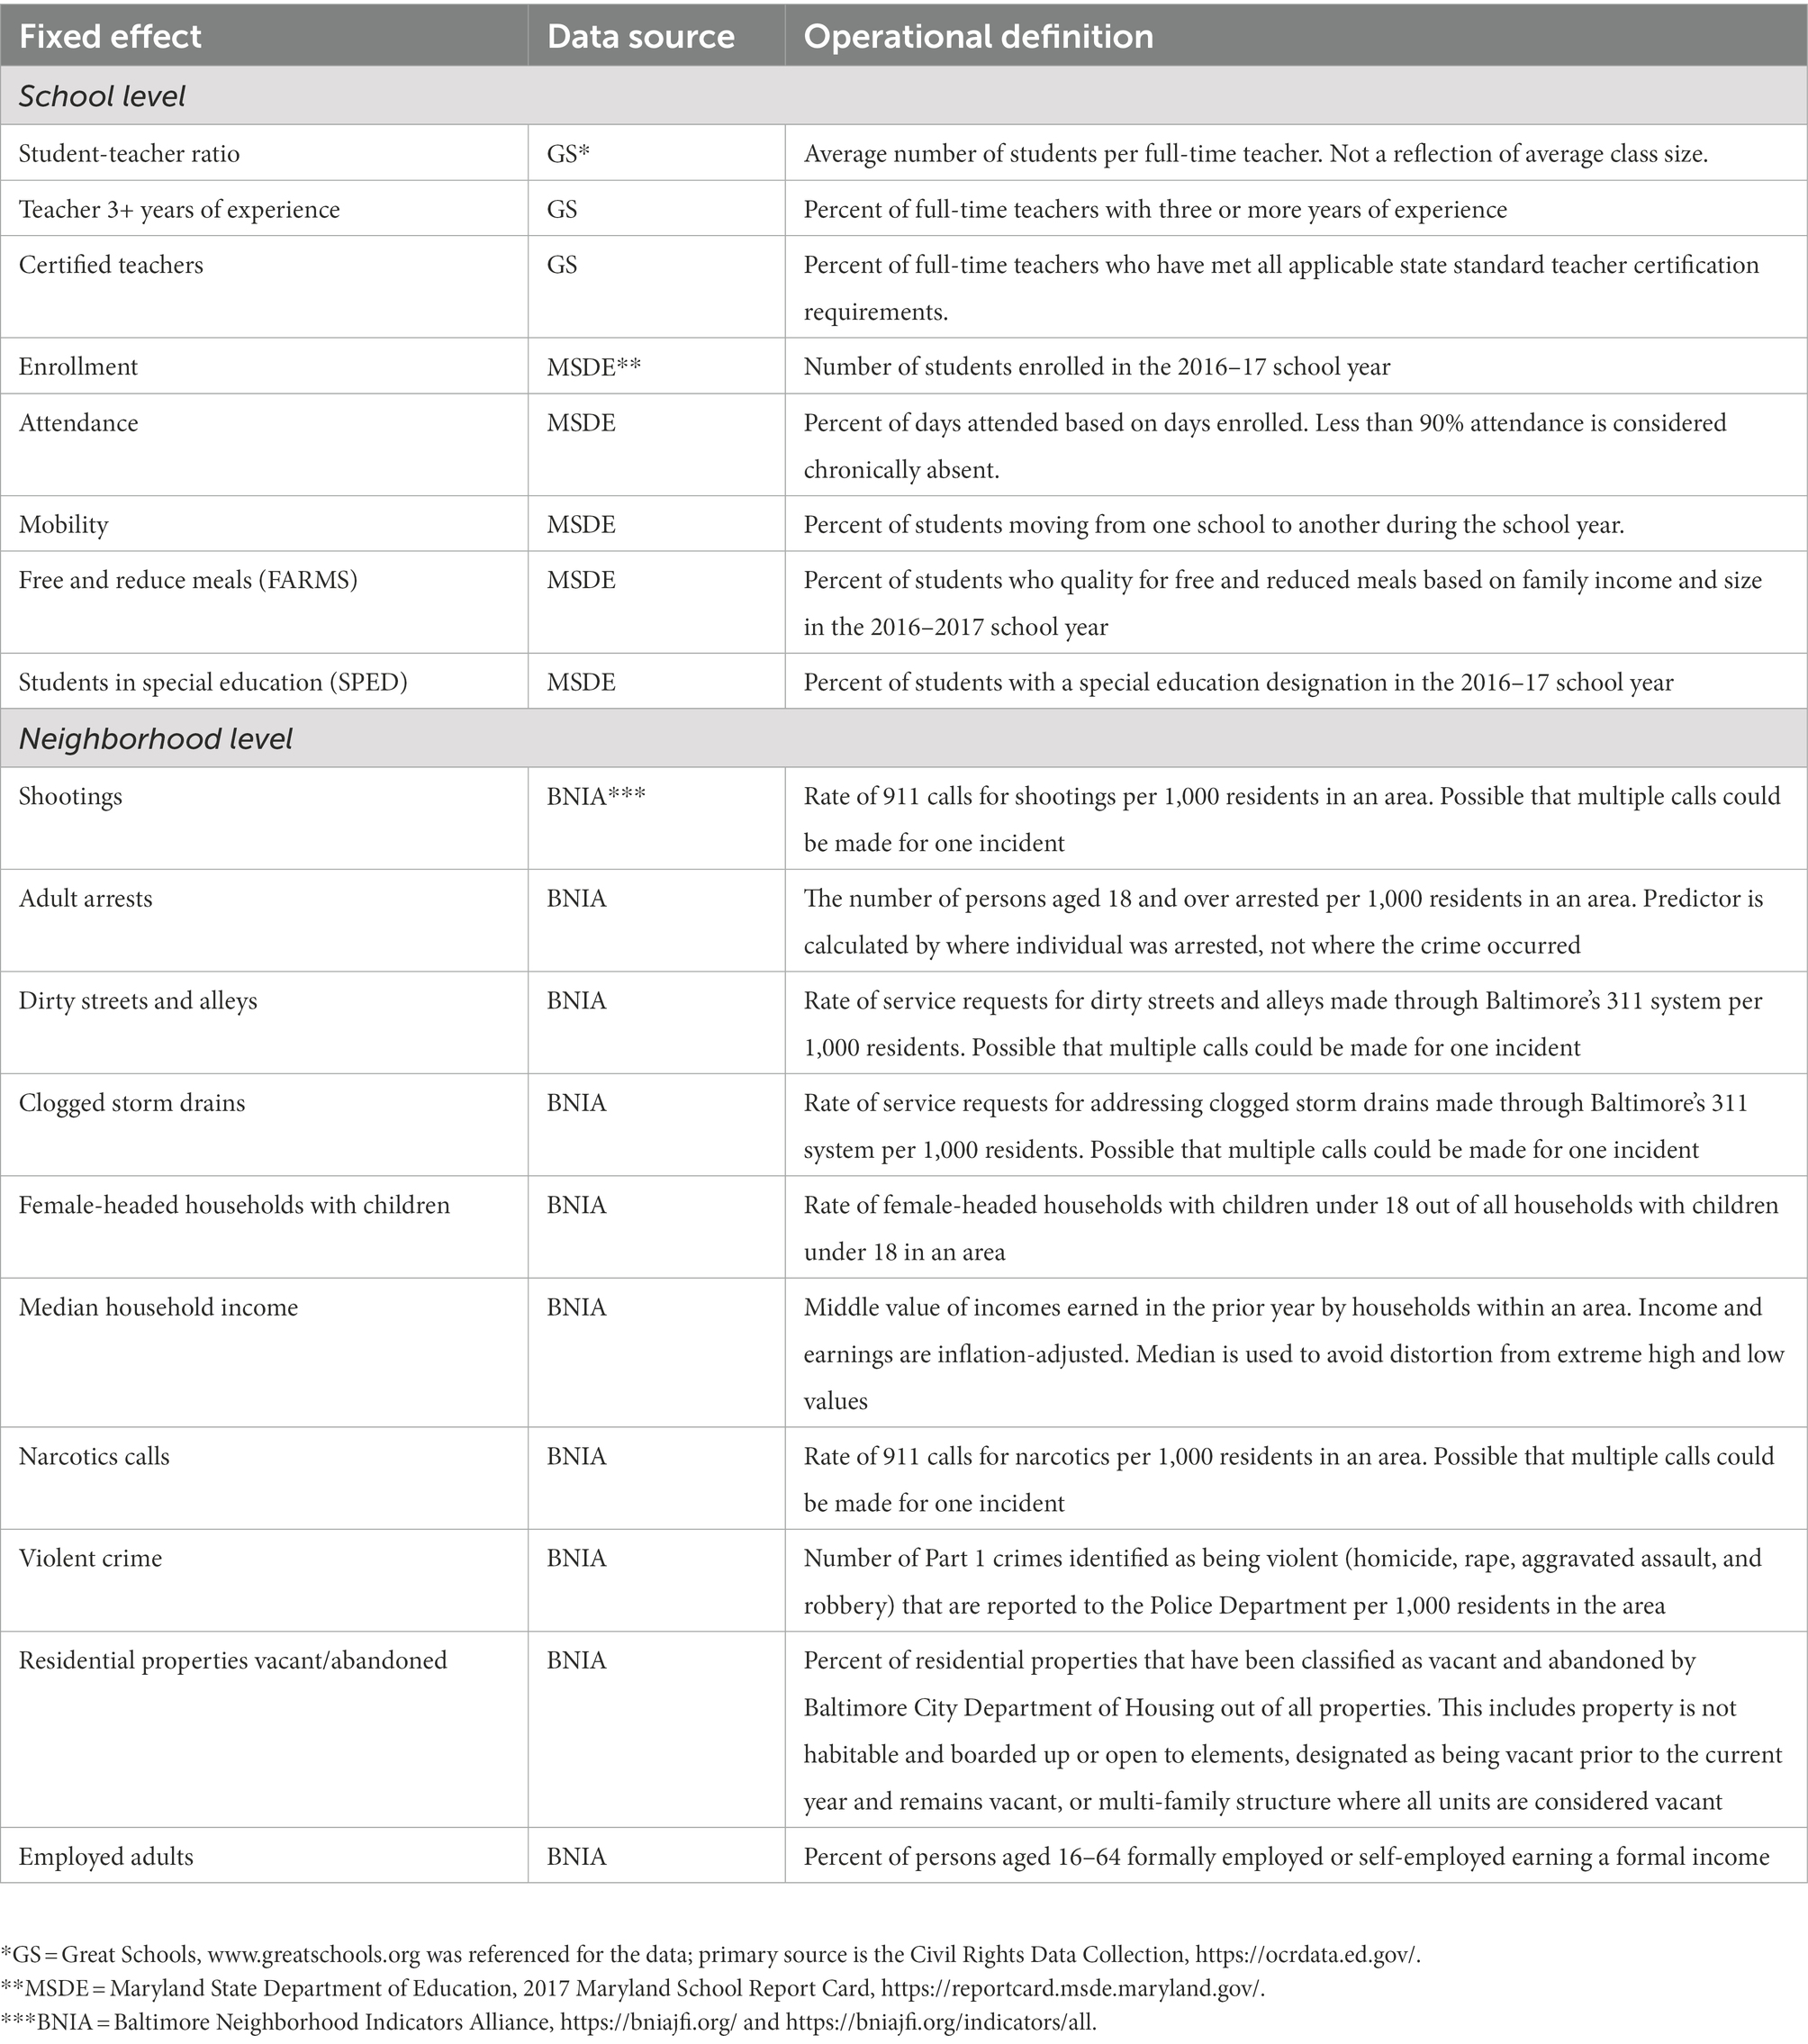
Table 3. School and neighborhood predictors tested as fixed effects on school climate.
2.3. Sample
The resulting dataset included school climate surveys from 15,833 elementary students in third through fifth grade (ages 8–11 years old; Level 1). Student-level covariates of grade (3rd grade = 5,427, 34.3%; 4th grade = 5,315, 33.6%; 5th grade = 5,091, 32.2%; Missing = 0) and sex (Male, coded as “1” = 7,819, 49.4%; Female, coded as “0” = 7,921, 50.0%; Missing = 93, 0.6%). Students were nested within 124 Baltimore City Schools (Level 2) and those schools are in 55 community statistical areas (Level 2). Most elementary schools in Baltimore serve students living in very close geographic proximity of the school building. The year these data were collected, Baltimore was the U.S.’s 26th largest city with a population estimated at 622,793 people, and one of the poorest counties in the state, with 22% of people living below the poverty line (U.S. Census Bureau, 2016). City residents identify primarily as African American (63.7%), White (28.23%), and Hispanic/Latino (4.4%). However, there is an over representation of African American (81.8%) and Hispanic/Latino (8.2%) students in the public schools. The annual rate of violent crime in Baltimore is four times the national median rate and over three times the average rate in Maryland (Baltimore City Government, 2017). An adverse childhood experiences study found that children in Baltimore City were more likely than children nationwide or in Maryland to have experienced extremely stressful or traumatic events (Baltimore City Health Department, Commissioner of Health, 2017). Descriptive statistics on additional school building and school neighborhood predictors are displayed in Table 1.
2.4. Analytic strategy
Using SPSS version 28.0, we tested five cross-sectional, multilevel models with fixed and random effects using linear mixed effects modeling to assess which Level 2 school and neighborhood predictors were associated with student-reported school climate. One model was tested for Overall Climate and four additional models were tested for each of the domains of climate within the measure (i.e., School Community, Physical Safety, Sense of Safety, Institutional Environment) to understand if predictors were uniquely related to any of the domains. The model for each climate domain was specified independently (i.e., orthogonally). Variance estimation was restricted maximum likelihood (REML) and covariance matrix was unstructured. The outcome was the grand-mean centered, student-report of school climate; Level 1 covariates were student grade and sex; Level 2 included grand-mean centered school building- and school neighborhood-level predictors. The random effect of school was tested via inclusion of the random intercept. We opted not to include random slopes due to the cross-sectional design and Level 1 fixed effects serving as control variables or covariates (Barr et al., 2013). However, we acknowledge that there are different perspectives on whether fixed effects models are indeed the gold standard over random effects models, and whether random effects should be included in all cases or only when justified by the design (Bell et al., 2019).
We entered school building and school neighborhood predictors at the same level (i.e., Level 2) after intraclass correlations (ICCs) indicated limited variability across neighborhoods when entered at Level 3 (ICC range = 0 to 1.6%). ICCs for neighborhood predictors alone at Level 2 (without school variables) explained 12% of overall school climate (p < 0.001), so neighborhood variables were regarded as important to retain in the model. Therefore, taken together, we think about the Level 2 variables as “school building and school neighborhood predictors,” both at the school level. Unconditional ICCs calculated based on intercept-only models showed school-level variation of 22.6% for Overall Climate, and slightly less variation for each domain of school climate (i.e., 14.3% for Community, 12.7% for Institution, 8.2% for Sense of Safety, and 18.2% for Physical Safety). With the full model including all Level 2 school and school neighborhood predictors, conditional ICCs revealed that variance was reduced by approximately half for Overall Climate (12.5%) and respective domains (i.e., 6.9% for Community, 5.4% for Institution, 3.4% for Sense of Safety, and 11.3% for Physical Safety). The multilevel model equation and SPSS code are provided in the Supplementary File to promote reproducibility.
3. Results
Data were inspected for normality of distributions among all predictor (i.e., fixed effects) and outcome variables. Overall, there were low levels of variable-level missingness on the school climate survey and predictor variables, with the percentage of missing data across variables ranging from 0 to 10%, and the largest percentage of missingness for school-building variables. School climate scores were normally distributed and ranged from 0 to 1 (M = 0.561; SD = 0.21 for Overall Climate, see Table 1 for all domains), with an average of 127 responses per school. Individual school climate domains evidenced slight negative (i.e., Community, Institutional Environment, Sense of Safety) or positive skew (i.e., Physical Safety) that was within acceptable limits (skew < |1|; see M and SD in Table 1). The response range for school climate items did not indicate ceiling or floor effects (average percentage agreement ranged from 27 to 85%) indicative of potential response bias. However, we are unable to account for potential selection bias of surveys completed by students. We examined Pearson correlations for all predictor variables; all variables were significantly related (p < 0.05), which is to be expected due to the large sample size, and in the expected direction (e.g., teachers with 3+ years of experience and certified teachers r = 0.76; FARMS and mobility r = 0.73; attendance and mobility r = −0.62). Correlation values ranged from absolute values of r = 0.004 (students in special education and violent crime; students in special education and arrests) to r = 0.86 (rate of narcotics calls and arrests), which were approximately normally distributed around a median of absolute value r = −0.266. The strength of the correlations had an absolute value of r = 0.32 on average. Table 1 includes descriptive statistics for all model predictors and outcomes. In addition to information in “Sample” about the community demographics, including high rates of violent crime and trauma exposure as compared to the United States national average in this large, urban school system, school building and school neighborhood characteristics in Table 1 also provide important context for this study. Notably, school size varied widely (range = 39–1,366), and although schools on average had 80% of teachers with 3+ years of experience, the mean percentage of certified teachers by school was 1.7%. As this is a high poverty area where students and families experience complex socioeconomic challenges, mean mobility rate was 31% (up to 73% by school) and most students qualified for free and reduced meals (63% on average and up to 91% by school). Table 4 includes outcomes for all multilevel models.
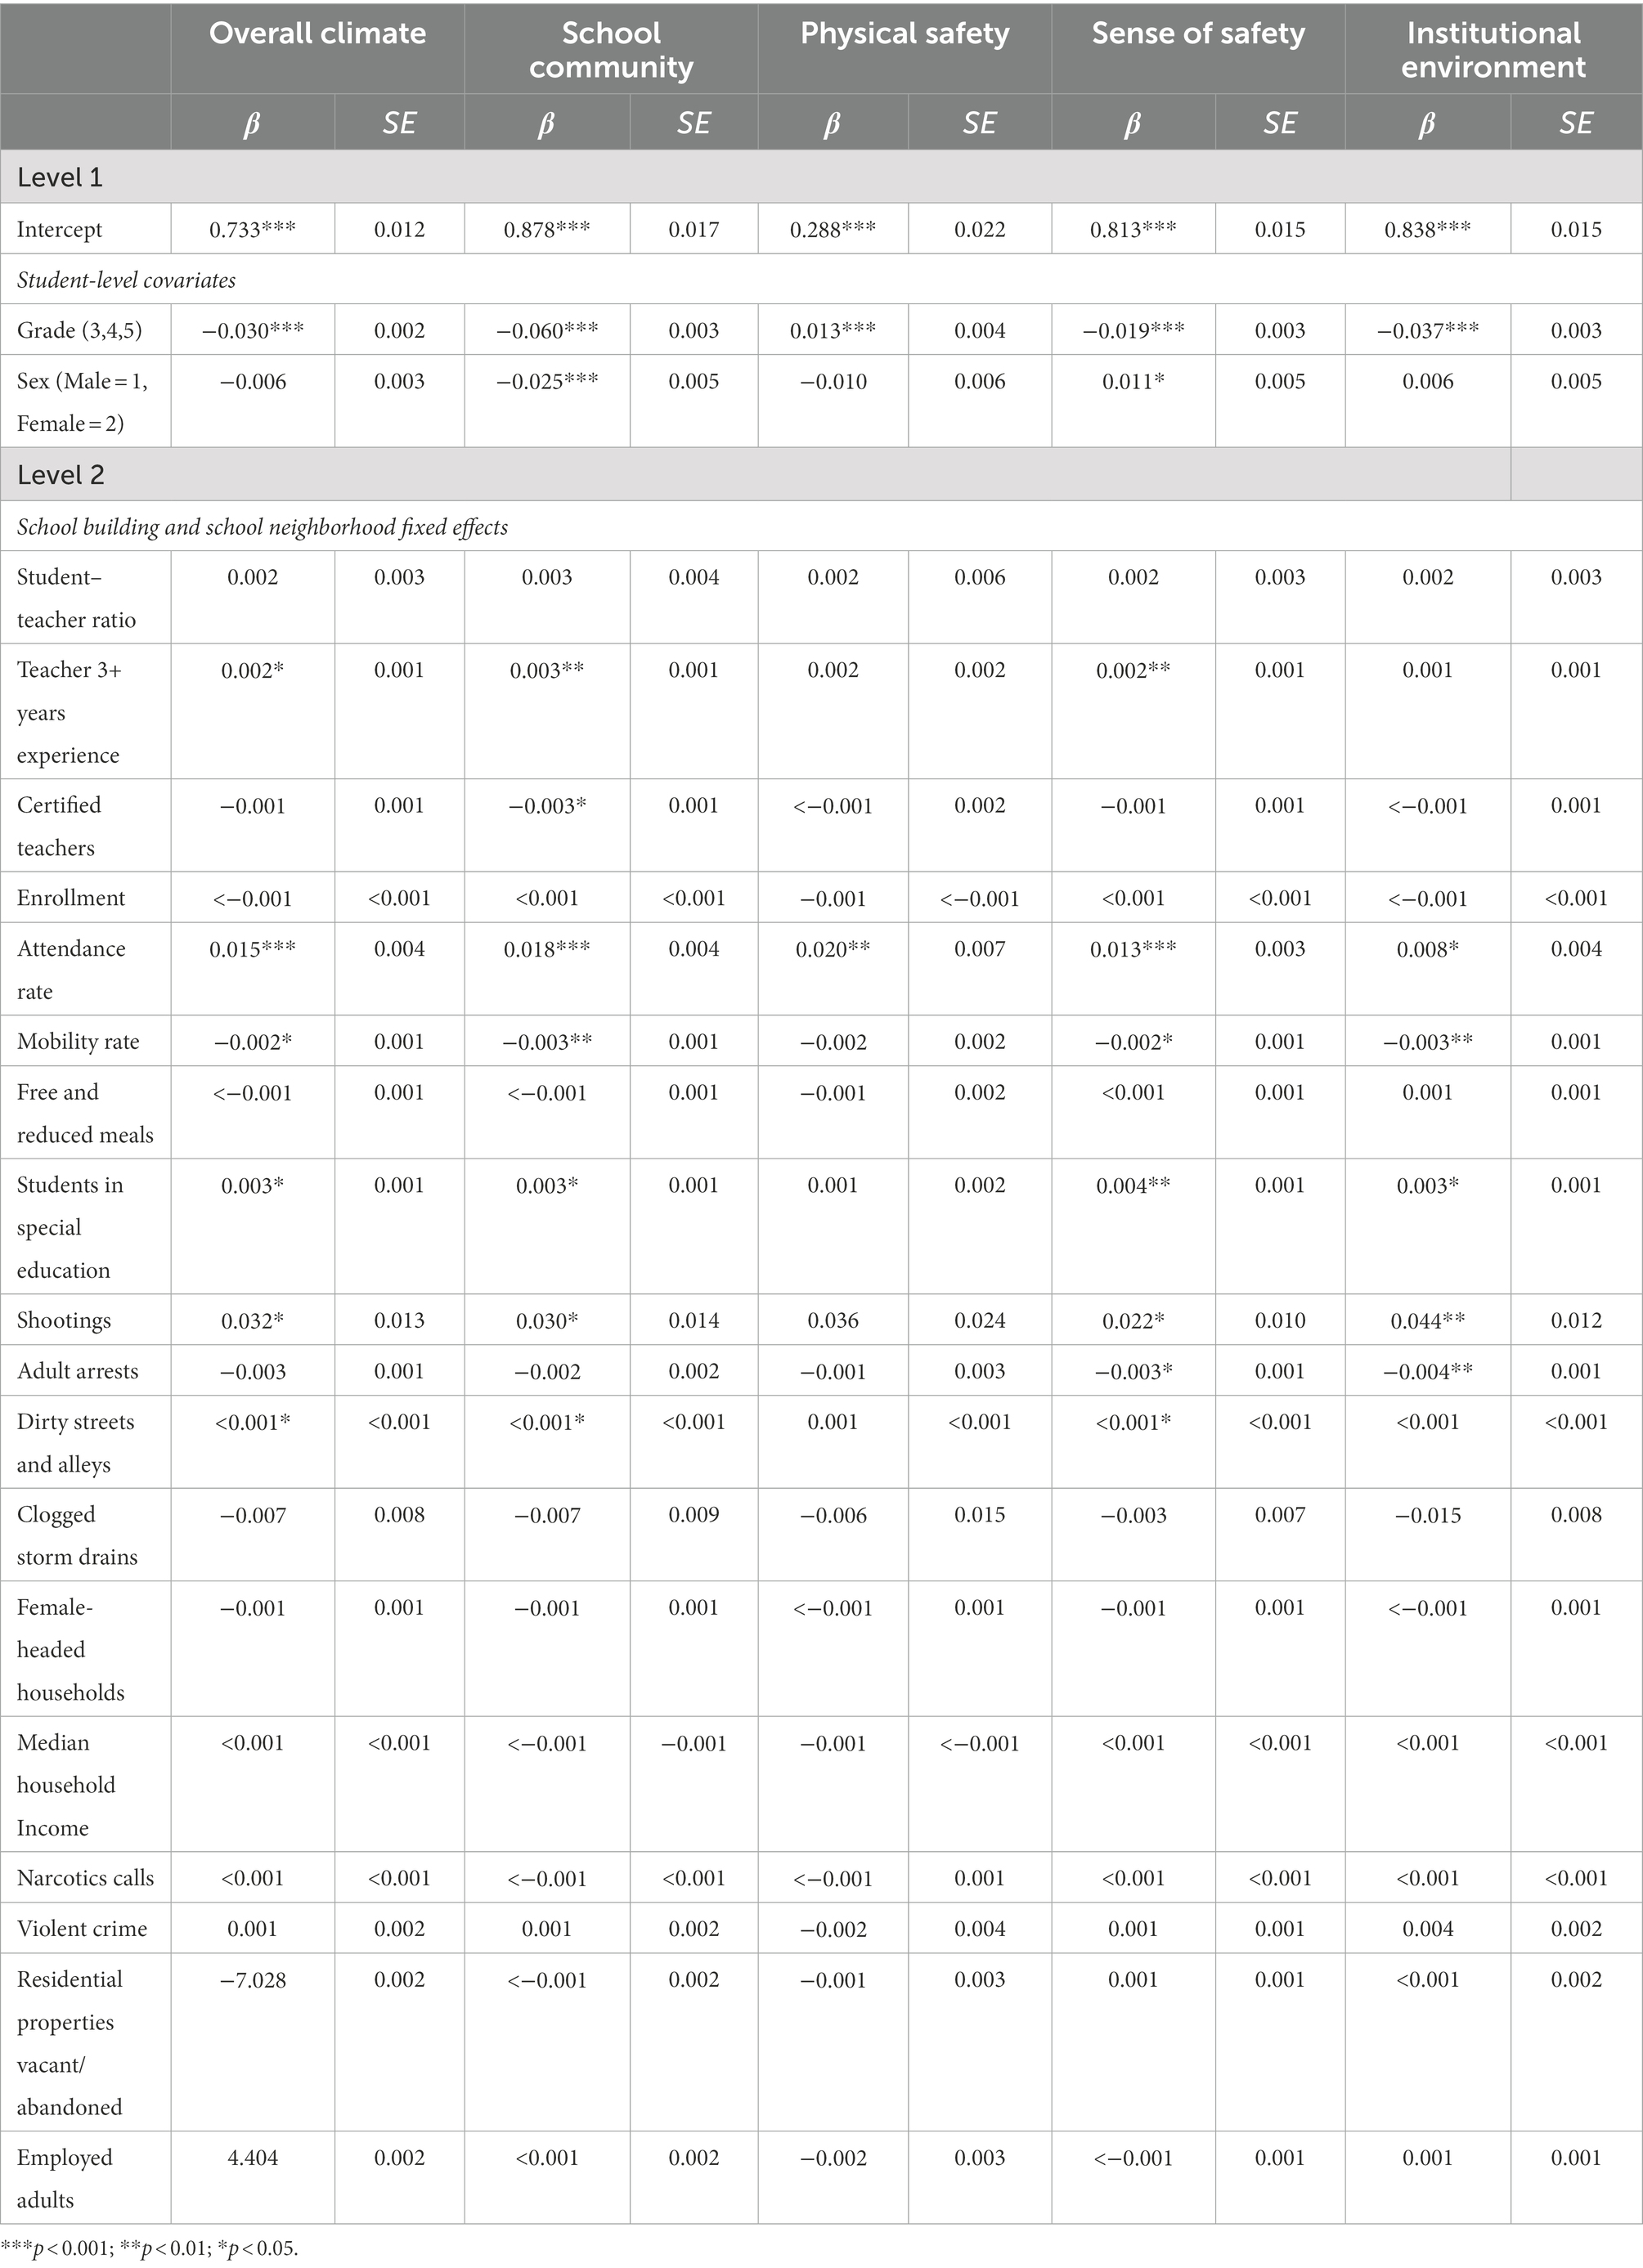
Table 4. Multilevel models predicting student-reported school climate.
Among the Level 1 covariates, grade was significantly associated with Overall Climate and all four subdomains (p < 0.001), such that higher grades (e.g., 5th grade or students approximately 10 years old) reported lower climate than students 1 or 2 years younger. The Physical Safety domain was the only exception in that the direction of the relation was positive. Student sex was significantly related to School Community (p < 0.001) and Sense of Safety (p < 0.05), with positive School Community more frequently reported by male-identifying students and positive Sense of Safety more frequently reported by female-identifying students. When controlling for Level 1 covariates, there were multiple school building and school neighborhood variables that explained a statistically significant amount of variation in Overall Climate and its domains (see Table 4). The five statistically significant predictors of Overall Climate and three of four school climate domains were attendance rate (B ranging between 0.008 to 0.020), mobility rate (B = −0.003 to −0.002), students in special education (B = 0.001 to 0.004), number of shooting calls for service (B = 0.022 to 0.044), and rate of calls for dirty streets and alleys (B = <0.001 to 0.001). Attendance rate was the only statistically significant predictor of School Climate (B = 0.015, t = 3.75, p < 0.001), and all four domains, such that higher school-level attendance rate predicted more positive student reports of climate. There were five statistically significant school-level predictors of School Community, including teacher years of experience (B = 0.003), certified teachers (B = −0.003), attendance (B = 0.018), mobility (B = −0.003), students in special education (B = 0.003); and two statistically significant community-level predictors, including shootings (B = 0.030), dirty streets and alleys (B < 0.001). Sense of Safety (SoS) and Institutional Environment (IE) showed similar patterns, with attendance rate (SoS B = 0.013; IE B = 0.008), mobility rate (SoS B = −0.002; IE B = −0.003), students in special education (SoS B = 0.004; IE B = 0.003), shootings (SoS B = 0.022; IE B = 0.044), adult arrest rate (SoS B = −0.003; IE B = −0.004), and dirty streets and alleys (SoS B < 0.001) serving as statistically significant predictors. The only statistically significant predictor of Physical Safety was attendance rate (B = 0.020, t = 2.77, p < 0.01). Note that mobility was measured at the school level but could be conceptualized as a school neighborhood predictor due to its tie to family economics that occurs in the broader school neighborhood context.
4. Discussion
School climate and neighborhood characteristics significantly predict students’ academic, social–emotional, and behavioral outcomes (Chetty and Hendren, 2015; Wang and Degol, 2016). Moreover, school climate may buffer the influence of neighborhood-level risk factors on student outcomes (Ozer et al., 2010; O'Donnell et al., 2011), particularly in school communities where students and families face socioeconomic stressors and high rates of exposure to community violence (McCoy et al., 2013; Ruiz et al., 2018). As such, understanding how school building and school neighborhood characteristics relate to student perceptions of school climate may signal directions in future research and practice to promote positive school climate to foster student academic achievement and well-being. This study examined the relation between structural factors at school building and school neighborhood levels with student perceptions of school climate (i.e., Overall Climate, School Community, Institutional Environment, Sense of Safety, Physical Safety) in a large, urban school district. We used multilevel modeling so school building and school neighborhood fixed effects were entered in the models as predictors of school climate, although we interpret the significant results as associations because the data were cross-sectional, not longitudinal. Overall, we found that various structural school building and school neighborhood factors were associated with student-perceived school climate in this sample.
Our results relate to two central theories in understanding the influence of neighborhood and school factors on students’ school experiences. One is Social Disorganization Theory, which posits that neighborhood structural characteristics (e.g., poverty, residential instability) break down social ties and neighborhood organization which in turn results in undesired individual outcomes and behaviors (e.g., crime, delinquency); (Shaw and McKay, 1942). There is an historical assumption in the literature that indicators of community “disorder” or lack of safety unquestionably have a negative effect on school safety and climate (McCoy et al., 2013). However, empirical evidence highlights the potential for positive school climate to interrupt the negative association between detrimental neighborhood factors and students’ academic and wellness outcomes (e.g., Gaias et al., 2019). This is consistent with our results, which show variation in school climate across schools despite limited variation in neighborhood risk factors, highlighting that some schools can create positive school climate despite a high level of instability in the surrounding neighborhood. This aligns with Social Control Theory, which focuses on the quality of social bonds that can decrease the likelihood of deviant behavior when exposed to external risk factors (Hirschi and Gottfredson, 1993). As applied to school climate, this suggests that students’ attachment, involvement and commitment to the school community and its moral code may protect against potential neighborhood-level risks.
Of the structural school factors examined, student attendance rate and mobility were each associated with School Climate, including Overall Climate and the subdomains of School Community, Physical Safety, Sense of Safety, and Institutional Environment. Our results parallel prior research, such that higher attendance rates and lower mobility rates were associated with more positive student perceptions of school climate (e.g., Bradshaw et al., 2009; Van Eck et al., 2017). Applying Social Disorganization Theory, high rates of student absenteeism and student mobility in the school community may indicate to students that their school environments are unstable or unsupportive (Bradshaw et al., 2009; Plank et al., 2009), which may challenge their feelings of connection with their school—contributing to less positive perceptions of their school’s climate (Lindstrom Johnson et al., 2016). For example, Green et al. (2019) found lower odds of school connectedness for students with high residential mobility among a sample of 5,620 public elementary school students in Los Angeles County. This is critical given the importance of healthy relationships and school connectedness in promoting positive school climate (CDC, 2009). Attendance and mobility rates may also reflect family socioeconomic conditions, including housing instability, lack of transportation, or irregular work schedules that contribute to student absences (Durham and Connolly, 2017). Alternatively, drawing on the importance of quality social bonds in Social Control Theory, schools’ efforts to support student attendance, for example through building relationships with families or focusing on and celebrating improvement (as opposed to punitive measures), can have positive impacts on their school’s climate (Durham and Connolly, 2017). Thus, it may be that schools in this study with higher attendance rates were actively engaged in similar efforts to support student attendance, thereby contributing to students’ more positive perceptions of climate. However, additional research is needed to understand the directionality of the relations between attendance, mobility, and climate. For example, it may be that students regular and consistent attendance during the academic year fosters positive school climates. Conversely, students may be more likely to attend school when they perceive the climate positively (Van Eck et al., 2017). However, as our sample is elementary age, attendance and mobility are most likely occurring within the context of a family system and the relationship between the family and the school as much as the student-school relationship or engagement. Of note, in our sample, mobility and attendance were moderately correlated in the expected direction (r = −0.62), indicating that mobility could be a proxy for housing instability and other types of family instability which could also predict attendance rates. Logically, attendance problems and/or mobility may contribute to students having more difficulty feeling connected to the school community itself.
In addition to school attendance and mobility, the other two school factors significantly associated with school climate (though less consistently significant across school climate domains as compared to attendance and mobility) was teacher years of experience and students in special education. Teacher years of experience was positively related to School Community, Sense of Safety, and Overall Climate, such that students attending schools with a greater percentage of full-time teachers with three or more years of experience were more likely to report a more positive climate in these domains. Previous research supports the connection between teacher experience and student perceptions of school climate (La Salle et al., 2015), such that teacher years of experience may correlate with other structural school factors that have been significantly associated with school climate, such as punitive and exclusionary referrals and classroom management practices (Thapa et al., 2013). Higher percentages of new teachers may also be an indicator of high teacher turnover, which can contribute to a sense of educational and relational instability for students (Ingersoll, 1999). Number of students enrolled in special education was also positively related to Overall Climate and to School Community, Sense of Safety, and Institutional Environment. It is plausible that schools with more staff, resources, and/or supports to serve students who require special education may have other related institutional supports that promote positive school climate. These results may also have been impacted by correlations across predictors, as several of the other statistically significant predictors of school climate (i.e., student mobility and attendance rates as well as teacher education) have also been associated with increased special education enrollment in previous studies (e.g., Talbott et al., 2011).
Student-teacher ratio, number of students enrolled, and percent of students who qualify for free and reduced priced meals were not observed to be related to student perceptions of school climate in this study. Percent of full-time teachers who were certified teachers was negatively related to School Community, but not related to other domains of climate. There are mixed findings in the literature regarding the association between these factors and school climate or student outcomes, warranting additional research with additional samples (Bradshaw et al., 2009; DeAngelis and Presley, 2011; Thapa et al., 2013), while also highlighting the need for localized examination of school climate predictors using analytic models similar to the approach used in this paper.
Considering relations between school neighborhood factors and student-perceptions of school climate, some school neighborhood factors (i.e., shootings, adult arrest rate, dirty streets and alleys) were associated with Overall Climate and various subdomains of school climate, except Physical Safety. For example, more shooting reports were associated in the unexpected direction with higher student perceptions of Institutional Environment at their school (i.e., building cleanliness and lighting, access to extracurriculars), students’ Sense of Safety (i.e., feeling safe at school) and perceptions of the School Community (i.e., mutual respect, school belonging), as well as Overall Climate. Reports of dirty streets and alleys was also associated with higher student perceptions of Institutional Environment and Sense of Safety. The strength of these associations are small, so perhaps are most appropriately interpreted as signals in this large dataset that various neighborhood safety and environmental factors are related to school climate and worthy of future study and replication. One possible explanation for this is that many of the neighborhood factors are resident-reported. Notably, the rate of adult arrests, which is an objective measure (not resident reported) was associated in the expected direction with lower student perceptions of Institutional Environment and Sense of Safety. Studies conducted in the United States and abroad suggest that social cohesion and perceptions of police effectiveness positively influence crime reporting in neighborhoods (Goudriaan et al., 2005). Other research indicates that collective efficacy of a neighborhood and residents’ sense of connectedness are related to concerns about neighborhood safety in high-crime neighborhoods (Pitner et al., 2012). Thus, the positive association between school neighborhood crime and environmental sanitation reports with school climate might signal the strengths of neighborhood cohesion and sense of community to report neighborhood concerns that may influence the broader school-community context and students’ positive perceptions of school climate. Of note, during this time in Baltimore City, there was a 24/7 non-emergency community number enabling residents to report community concerns to be addressed by city officials. Thus, resident-reported neighborhood factors may vary in their associations with school climate depending on the system and structure for those instances to be reported. Of course, these associations found in our sample do not necessarily generalize to other school communities or districts given the variability of community and school characteristics, and warrant replication in other school-community contexts.
4.1. Implications for school systems and leaders
School climate data are often available to school and district leaders and teams if school climate surveys are conducted. However, there are limitations in terms of how school climate data can be interpreted and used. School systems and leaders may want to clarify the purpose of school climate data for their quality improvement efforts, and whether they consider school climate as a predictor of student outcomes, mediator of school or neighborhood factors on student outcomes, or outcome of its own. School climate is argued to be both an important outcome, for example, as a non-academic indicator of school quality (U.S. Department of Education, 2022a; Temkin et al., 2021), and as critical predictor of students’ academic achievement and well-being (Wang and Degol, 2016). Schools may build school climate into quality improvement initiatives or as a process or outcome evaluation variable of other implementation efforts, but because school climate is such a complex construct, schools might want to study and/or target specific aspects of climate at a time. There is a growing compendium of tools and technical assistance based on case studies supporting schools and school leaders in disadvantaged and stressed neighborhoods to retain staff and support positive student development and success (e.g., WestEd, 2022).
Also, given the potential protective effects of school climate for students and school communities, and bolus of research on resilient students, families, and school communities despite contextual adversities and resource constraints, it is important to avoid deficit-based assumptions that school climate is necessarily determined by the structural characteristics of the school and surrounding community. Schools in our sample had a wide range of school climate scores despite consistently high school neighborhood crime rates and other structural risk factors such as low socioeconomic status throughout the city. A more nuanced understanding of the influence of various community and school characteristics on school climate opens the door to opportunities for school climate reform and promoting students’ feelings of safety and belonging at school. There are numerous field examples of highly-resilient schools and districts displaying positive school culture and climate despite substantial community safety concerns, particularly in urban, low-income districts (e.g., Fryer and Dobbie, 2011). Our results indicate that student attendance is significantly associated with school climate in Baltimore schools. Therefore, efforts to improve attendance may improve school climate, such as the field example of how this was done using a Community Schools Model in Baltimore City (Durham and Connolly, 2017).
We hope for continued research on the associations between neighborhood factors, school factors, and school climate, which may help identify levers for change to build resilient schools in under-resourced and highly stressed communities. We also encourage school systems and leaders to think about their school climate data not just as a reflection on their school, but an important indicator of student sense of connection and well-being which can also be influenced by family socioeconomic factors and neighborhood risk and protective factors.
4.2. Limitations and future directions
The results of this study are interpreted within the context of notable limitations. Principally, despite the importance of school climate in supporting student learning outcomes, there is not currently a universally-accepted definition of school climate (Wang and Degol, 2016). There is great variability in how the multidimensional school climate construct is defined and subsequently operationalized in measures administered to students and staff (Wang and Degol, 2016). For this study, we undertook a theoretically-driven, iterative approach to validate the internal structure of a local school climate survey. We identified a measurement model, comprised of four school climate domains, with acceptable fit that excluded several non-theoretically relevant or poorly-loading survey items; this underscores the need to continue to improve measurement of school climate in research and practice via theoretically-aligned, reliable, and valid measures (Ryberg et al., 2020; Grazia and Molinari, 2021; Temkin et al., 2021). Our process of construct validation prior to examining associations of interest is a notable strength of this research. However, the associations we observed between school and neighborhood factors with Overall Climate and the domains of School Community, Institutional Environment, Sense of Safety, and Physical Safety may not generalize to other school districts and contexts in which school climate has been defined and operationalized differently.
Second, guided by our review of the literature, we included many fixed effects in our multilevel models as potentially related to school climate. Examination of a correlation matrix signaled potential multicollinearity among some variables included as fixed effects (i.e., largest r = 0.83). However, parameter estimates in 2-level multilevel models are not biased by multicollinearity, multicollinearity may impact standard errors of these estimates which could impact statistical significance among predictors with shared variance (Shieh and Fouladi, 2003). We also acknowledge that several predictors were similarly predictive across overall climate and respective domains. This is to be expected as the domains are distinct yet correlated with one another and part of the same construct of overall climate. We selected predictors based on theory and previous research instead of quantitatively. This was done in part because we had access to a very large number of possible predictors in these secondary datasets and wanted to be sure to select based on what theory and extant literature suggested as likely related to school climate. In line with this goal, we opted not to use actuarial methods to select predictors nor to test additional models with a subset of fixed effects. We retained non-significant fixed effects in the model which are displayed in Table 4 to promote transparency for future studies that may consider these factors. Our analyses are not intended to assess generalizable causality of school factors on climate, but rather to signal factors that local school systems might want to examine as potential quality improvement targets. Future research may consider testing a more parsimonious model or pursuing data reduction to include fewer fixed effects, and comparing model results using information criterion statistics.
Third, although several school and neighborhood factors were statistically significantly associated with school climate (overall scores and subdomains), the magnitude of effects was small and model intercepts were comparably large. This suggests that there are student- and school-level factors associated with school climate that are not represented in our model based on our available data sources. For example, this study examined primarily structural school and neighborhood factors, given their priority in school and district assessments of school climate and student outcomes (Gottfredson et al., 2005; Rudasill et al., 2018; Laurito et al., 2019). However, theory and prior research (e.g., Social Control Theory; (Hirschi and Gottfredson, 1993) highlight the importance of relational factors, including strong bonds between students and their school, in promoting positive climate. The school characteristics (i.e., student mobility and attendance, teacher years of experience) that were most strongly associated with school climate in the current study have the potential to contribute to or prohibit the development of consistent relationships between peers and between students and teachers. However, the associations we observed may be limited in their generalizability to schools and districts with different characteristics and student populations (e.g., secondary schools). For example, whereas the schools serving elementary students in our sample, on average, employed many teachers with more than 3 years of experience, schools also tended to have a low percentage of certified teachers (see Table 1). The association between mobility and attendance, student connectedness and relationships, and school climate should be examined longitudinally to better understand these associations. Moreover, La Salle et al. (2015) underscore the importance of individual (e.g., race/ethnicity, resources) and family (e.g., socioeconomic status, values) cultural factors that are important for understanding school climate and its relation with student outcomes. It will be important for future work to replicate and extend our findings by including relational, personal, and contextual characteristics and with additional districts that vary in size, urbanicity, geographic region, and staff characteristics.
Finally, given the cross-sectional nature of this study, we are unable to determine the directionality of the relations observed between structural school factors and school climate. Although we positioned school climate as the ‘outcome’ variable and the school and neighborhood factors as ‘predictors’, longitudinal investigations of the influence of school and neighborhood factors on school climate are needed. Longitudinal designs with multiple timepoints and larger sample sizes can also enable examination of interactions between neighborhood and school factors in predicting school climate. Through this work, school and community stakeholders can better understand what predicts positive school climate in their local context, and extend this work to examine how school climate may buffer against school and neighborhood risk factors.
Previous research highlights mixed findings regarding the association of neighborhood and school factors with school climate and student outcomes. This may be due in part to differences in how these constructs are measured as well as geographic differences. School districts also use a wide array of school climate measures (e.g., Grazia and Molinari, 2021), limiting the ability to examine for collective trends across school districts. Schools also frequently have limited data support, prohibiting them from thoroughly exploring their school climate data. This highlights the importance of school district-research partnerships to analyze and interpret school climate data. Increasing access to universal school climate measures that can be collected across school districts would also enable expanded learning across geographic areas. The current study illustrates one method that school districts can use, likely with the assistance of academic research partners or in some cases their internal data team, to understand school climate data. Through increased use of universal school climate measures, the field can also begin to examine for trends across school districts, geographic areas, states, and countries as we expand our knowledge of how to promote positive and effective school climates.
Data availability statement
The datasets generated and analyzed for this study are a combination of school district data used for quality improvement and public-domain data. The publicly available data can be obtained from Great Schools (www.greatschools.org), Maryland School Report Card (https://reportcard.msde.maryland.gov/), and Baltimore Neighborhood Indicators Alliance (https://bniajfi.org/ and https://bniajfi.org/indicators/all). Access to the data files used for this study may be granted by the authors upon reasonable request.
Author contributions
SM developed the research questions and analytic approach with EC, conducted the school climate survey factor analysis, identified school building, and school neighborhood variables to add to the model based on literature review, requested, cleaned, and merged secondary data to build the dataset, reviewed and supported writing of all sections, and wrote the discussion. SM is the primary author and co-led the project. RO wrote the introduction, reproduced multilevel models, and checked them for accuracy, created tables, reviewed, and provided feedback on all written sections. EC developed the research questions and analytic approach with SM, identified school building and school neighborhood variables to add to the model based on literature review conducted the multilevel models, reviewed, and supported writing of all sections, and wrote the discussion. EC is the senior author and co-led the project with SM. All authors discussed the results and contributed to the final manuscript.
Funding
Support for this research comes from the National Institute of Mental Health (K08MH116119 and T32MH109436).
Acknowledgments
We are indebted to the expertise of Christian Connell (Pennsylvania State University) and Veronika Shabanova (Yale University) for their statistical consultation on multilevel modeling. We also greatly appreciate the efforts of James Padden and Nancy Lever who aided our efforts obtaining the school climate data. This research would not have been possible without the support of the Baltimore Neighborhood Indicators Alliance who assisted with data transfer, interpretation and cleaning of public domain data. Finally, we would like to acknowledge Nicolina Fusco and Sophia Selino for their support with references, citations and data entry, as well as the Yale Psychiatry Department Division of Prevention and Community Research School-Based Research and Evaluation writing group for their feedback on early drafts of this manuscript.
Conflict of interest
The authors declare that the research was conducted in the absence of any commercial or financial relationships that could be construed as a potential conflict of interest.
Publisher’s note
All claims expressed in this article are solely those of the authors and do not necessarily represent those of their affiliated organizations, or those of the publisher, the editors and the reviewers. Any product that may be evaluated in this article, or claim that may be made by its manufacturer, is not guaranteed or endorsed by the publisher.
Supplementary material
The Supplementary material for this article can be found online at: https://www.frontiersin.org/articles/10.3389/feduc.2022.931474/full#supplementary-material.
Footnotes
2. ^https://reportcard.msde.maryland.gov/
3. ^https://bniajfi.org/ and https://bniajfi.org/indicators/all
References
Aldridge, J. M., and McChesney, K. (2018). The relationships between school climate and adolescent mental health and wellbeing: a systematic literature review. Int. J. Educ. Res. 88, 121–145. doi: 10.1016/j.ijer.2018.01.012
American Institutes of Research. (2022). ED School Climate Surveys (EDSCLS). National Center on Safe and Supportive Learning Environments. Virginia: American Institutes of Research
Baltimore City Government (2017). Crime statistics 2017. Available at: https://www.baltimorecountymd.gov/departments/police/crimestats/crime2017yearend.html (Accessed June 1,2023).
Baltimore City Health Department, Commissioner of Health. (2017). White Paper: State of Health in Baltimore. City of Baltimore: Baltimore City Health Department, Commissioner of Health
Baltimore Neighborhood Indicators Alliance (2018). Community Profiles. Baltimore: Baltimore Neighborhood Indicators Alliance.
Barr, D. J., Levy, R., Scheepers, C., and Tily, H. J. (2013). Random effects structure for confirmatory hypothesis testing: keep it maximal. J. Mem. Lang. 68, 255–278. doi: 10.1016/j.jml.2012.11.001
Bell, A., Fairbrother, M., and Jones, K. (2019). Fixed and random effects models: making an informed choice. Qual. Quant. 53, 1051–1074. doi: 10.1007/s11135-018-0802-x
Bowen, G. L., Bowen, N. K., and Richman, J. M. (2000). School size and middle school students' perceptions of the school environment. Child. Sch. 22, 69–82. doi: 10.1093/cs/22.2.69
Bradshaw, C. P., Mitchell, M. M., and Leaf, P. J. (2009). Examining the effects of Schoolwide positive behavioral interventions and supports on student outcomes: results from a randomized controlled effectiveness trial in elementary schools. J. Posit. Behav. Interv. 12, 133–148. doi: 10.1177/1098300709334798
Browne, M. W., and Cudeck, R. (1989). Single sample cross-validation indices for covariance structures. Multivar. Behav. Res. 24, 445–455. doi: 10.1207/s15327906mbr2404_4
Burdick-Will, J. (2018). Neighborhood violence, peer effects, and academic achievement in Chicago. Sociol. Educ. 91, 205–223. doi: 10.1177/0038040718779063,
Byrne, B. M. (2005). Factor analytic models: viewing the structure of an assessment instrument from three perspectives. J. Pers. Assess. 85, 17–32. doi: 10.1207/s15327752jpa8501_02
Chetty, R., and Hendren, N. (2015). The impacts of neighborhoods on intergenerational mobility: Childhood exposure effects and county-level estimates Harvard University and NBER, 1–144.
Coker, C. M. Neighborhood and school influences on academic achievement and educational attainment (2016). College of Science and Health Theses and Dissertations.
DeAngelis, K. J., and Presley, J. B. (2011). Teacher qualifications and school climate: examining their interrelationship for school improvement. Leadersh. Policy Sch. 10, 84–120. doi: 10.1080/15700761003660642
Durham, R. E., and Connolly, F. (2017). Strategies for student attendance and school climate in Baltimore’s community schools. ERIC 42
Foster, H., and Brooks-Gunn, J. (2013). Neighborhood, family and individual influences on school physical victimization. J. Youth Adolesc. 42, 1596–1610. doi: 10.1007/s10964-012-9890-4
Fryer, R., and Dobbie, W. (2011). Are high-quality schools enough to increase achievement among the poor? Evidence from the Harlem Children’s zone. Am. Econ. J. Appl. Econ. 3, 158–187. doi: 10.1257/app.3.3.158
Gaias, L. M., Lindstrom Johnson, S., White, R. M., Pettigrew, J., and Dumka, L. (2019). Positive school climate as a moderator of violence exposure for Colombian adolescents. Am. J. Commun. Psychol. 63, 17–31. doi: 10.1002/ajcp.12300
Gase, L. N., Gomez, L. M., Kuo, T., Glenn, B. A., Inkelas, M., and Ponce, N. A. (2017). Relationships among student, staff, and administrative measures of school climate and student health and academic outcomes. J. Sch. Health 87, 319–328. doi: 10.1111/josh.12501
Gottfredson, G. D., Gottfredson, D. C., Payne, A. A., and Gottfredson, N. C. (2005). School climate predictors of school disorder: results from a National Study of delinquency prevention in schools. J. Res. Crime Delinq. 42, 412–444. doi: 10.1177/0022427804271931
Goudriaan, H., Wittebrood, K., and Nieuwbeerta, P. (2005). Neighbourhood characteristics and reporting crime: effects of social cohesion, confidence in police effectiveness and socio-economic Disadvantage1. Br. J. Criminol. 46, 719–742. doi: 10.1093/bjc/azi096
Grazia, V., and Molinari, L. (2021). School climate multidimensionality and measurement: a systematic literature review. Res. Pap. Educ. 36, 561–587. doi: 10.1080/02671522.2019.1697735
GreatSchools. (2022). Find a great school for your child. Available at: https://www.greatschools.org/
Green, G., DeFosset, A., and Kuo, T. (2019). Residential mobility among elementary school students in Los Angeles County and early school experiences: opportunities for early intervention to prevent absenteeism and academic failure. Front. Psychol. 10:2176. doi: 10.3389/fpsyg.2019.02176
Hardaway, C. R., McLoyd, V. C., and Wood, D. (2012). Exposure to violence and socioemotional adjustment in low-income youth: an examination of protective factors. Am. J. Community Psychol. 49, 112–126. doi: 10.1007/s10464-011-9440-3
Hirschi, T., and Gottfredson, M. (1993). Commentary: testing the general theory of crime. J. Res. Crime Delinq. 30, 47–54. doi: 10.1177/0022427893030001004
Hong, J. S., and Eamon, M. K. (2012). Students’ perceptions of unsafe schools: an ecological systems analysis. J. Child Fam. Stud. 21, 428–438. doi: 10.1007/s10826-011-9494-8
Hopson, L. M., and Lee, E. (2011). Mitigating the effect of family poverty on academic and behavioral outcomes: the role of school climate in middle and high school. Child Youth Serv. Rev. 33, 2221–2229. doi: 10.1016/j.childyouth.2011.07.006
Hopson, L. M., Schiller, K. S., and Lawson, H. A. (2014). Exploring linkages between school climate, behavioral norms, social supports, and academic success. Soc. Work. Res. 38, 197–209. doi: 10.1093/swr/svu017
Hu, L.-T., and Bentler, P. M. (1998). Fit indices in covariance structure modeling: sensitivity to underparameterized model misspecification. Psychol. Methods 3, 424–453. doi: 10.1037/1082-989X.3.4.424
Ingersoll, R. M. (1999). The problem of underqualified teachers in American secondary schools. Educ. Res. 28, 26–37. doi: 10.3102/0013189X028002026
Johnson, L., Sarah Waasdorp, T. E., Cash, A. H., Debnam, K. J., Milam, A. J., and Bradshaw, C. P. (2017). Assessing the association between observed school disorganization and school violence: implications for school climate interventions. Psychol. Viol. 7, 181–191. doi: 10.1037/vio0000045
Kirk, D. S. (2009). Unraveling the contextual effects on student suspension and juvenile arrest: the independent and interdependent influences of school, neighborhood, and family social controls. Criminology 47, 479–520. doi: 10.1111/j.1745-9125.2009.00147.x
Koth, C., Bradshaw, C., and Leaf, P. (2008). A multilevel study of predictors of student perceptions of school climate: the effect of classroom-level factors. J. Educ. Psychol. 100, 96–104. doi: 10.1037/0022-0663.100.1.96
Kwong, D., and Davis, J. R. (2015). School climate for academic success: a multilevel analysis of school climate and student outcomes. J. Res. Educ. 25, 68–81.
La Salle, T. P., Meyers, J., Varjas, K., and Roach, A. (2015). A cultural-ecological model of school climate. Int. J. School Educ. Psychol. 3, 157–166. doi: 10.1080/21683603.2015.1047550
Laub, J. H., and Lauritsen, J. L. (1998). The interdependence of school violence with neighborhood and family conditions. doi: 10.1017/9780511840913.005,
Laurito, A., Lacoe, J., Schwartz, A. E., Sharkey, P., and Ellen, I. G. (2019). School climate and the impact of neighborhood crime on test scores. Russell Sage Found. J. Soc. Sci. 5, 141–166. doi: 10.7758/rsf.2019.5.2.08
Lenzi, M., Vieno, A., Perkins, D. D., Santinello, M., Elgar, F. J., Morgan, A., et al. (2012). Family affluence, school and neighborhood contexts and adolescents’ civic engagement: a cross-national study. Am. J. Community Psychol. 50, 197–210. doi: 10.1007/s10464-012-9489-7
Leventhal, T., and Brooks-Gunn, J. (2000). The neighborhoods they live in: the effects of neighborhood residence on child and adolescent outcomes. Psychol. Bull. 126, 309–337. doi: 10.1037/0033-2909.126.2.309
Limbos, M. A. P., and Casteel, C. (2008). Schools and neighborhoods: organizational and environmental factors associated with crime in secondary schools. J. Sch. Health 78, 539–544. doi: 10.1111/j.1746-1561.2008.00341.x
Lindstrom Johnson, S., Pas, E., and Bradshaw, C. P. (2016). Understanding the association between school climate and future orientation. J. Youth Adolesc. 45, 1575–1586. doi: 10.1007/s10964-015-0321-1
McCoy, D. C., Roy, A. L., and Sirkman, G. M. (2013). Neighborhood crime and school climate as predictors of elementary school academic quality: a cross-lagged panel analysis. Am. J. Community Psychol. 52, 128–140. doi: 10.1007/s10464-013-9583-5
National Center for Safe and Supportive Schools (2020). Available at: https://www.ncs3.org/about
National School Climate Council (2007). The school climate challenge: Narrowing the gap between school climate research and school climate policy, practice guidelines and teacher education policy. Available at: https://schoolclimate.org/wp-content/uploads/2021/05/school-climate-challenge-web.pdf (Accessed January 6, 2023).http://www.ecs.org/school-climate
Nieuwenhuis, J., and Hooimeijer, P. (2016). The association between neighbourhoods and educational achievement, a systematic review and meta-analysis. J. Housing Built Environ. 31, 321–347. doi: 10.1007/s10901-015-9460-7
O'Donnell, D. A., Roberts, W. C., and Schwab-Stone, M. E. (2011). Community violence exposure and post-traumatic stress reactions among Gambian youth: the moderating role of positive school climate. Soc. Psychiatry Psychiatr. Epidemiol. 46, 59–67. doi: 10.1007/s00127-009-0162-x
Ozer, E. J., Ritterman, M. L., and Wanis, M. G. (2010). Participatory action research (PAR) in middle school: opportunities, constraints, and key processes. Am. J. Community Psychol. 46, 152–166. doi: 10.1007/s10464-010-9335-8
Pitner, R. O., Yu, M., and Brown, E. (2012). Making neighborhoods safer: examining predictors of residents’ concerns about neighborhood safety. J. Environ. Psychol. 32, 43–49. doi: 10.1016/j.jenvp.2011.09.003
Plank, S., Bradshaw, C., and Young, H. (2009). An application of “broken-windows” and related theories to the study of disorder, fear, and collective efficacy in schools. Am. J. Educ. 115, 227–247. doi: 10.1086/595669
Rhemtulla, M., Brosseau-Liard, P. É., and Savalei, V. (2012). When can categorical variables be treated as continuous? A comparison of robust continuous and categorical SEM estimation methods under suboptimal conditions. Psychol. Methods 17, 354–373. doi: 10.1037/a0029315
Rudasill, K. M., Snyder, K. E., Levinson, H., and Adelson, L. J. (2018). Systems view of school climate: a theoretical framework for research. Educ. Psychol. Rev. 30, 35–60. doi: 10.1007/s10648-017-9401-y
Ruiz, L. D., McMahon, S. D., and Jason, L. A. (2018). The role of neighborhood context and school climate in school-level academic achievement. Am. J. Community Psychol. 61, 296–309. doi: 10.1002/ajcp.12234
Ruus, V.-R., Veisson, M., Leino, M., Ots, L., Pallas, L., Sarv, E.-S., et al. (2007). Students' well-being, coping, academic success, and school climate. Soc. Behav. Personal. Int. J. 35, 919–936. doi: 10.2224/sbp.2007.35.7.919
Ryberg, R., Her, S., Temkin, D., Madill, R., Kelley, C., Thompson, J., et al. (2020). Measuring school climate: validating the education department school climate survey in a sample of urban middle and high school students. AERA Open 6:233285842094802. doi: 10.1177/2332858420948024
Sampson, R. J., Sharkey, P., and Raudenbush, S. W. (2008). Durable effects of concentrated disadvantage on verbal ability among African-American children. Proc. Natl. Acad. Sci. U. S. A. 105, 845–852. doi: 10.1073/pnas.0710189104
Schmitt, T. A. (2011). Current methodological considerations in exploratory and confirmatory factor analysis. J. Psychoeduc. Assess. 29, 304–321. doi: 10.1177/0734282911406653
Shaw, C. R., and McKay, H. D. (1942). Juvenile Delinquency and Urban Areas. Chicago, IL, US: University of Chicago Press.
Shieh, Y. Y., and Fouladi, R. T. (2003). The effect of multicollinearity on multilevel modeling parameter estimates and standard errors. Educ. Psychol. Meas. 63, 951–985. doi: 10.1177/0013164403258402
Siller, L., Edwards, K., and Banyard, V. (2021). School and community correlates of interpersonal violence among high school students. Psychol. Viol. 11, 244–252. doi: 10.1037/vio0000373
Starkey, L., Aber, J. L., and Crossman, A. (2019). Risk or resource: does school climate moderate the influence of community violence on children’s social-emotional development in the Democratic Republic of Congo? Dev. Sci. 22:e12845. doi: 10.1111/desc.12845
Steinberg, M. P., Allensworth, E., and Johnson, D. W. (2015). What Conditions Jeopardize and Support Safety in Urban Schools? The Influence of Community Characteristics, School Composition and School Organizational Practices on Student and Teacher Reports of Safety in Chicago. Los Angeles: UCLA: The Civil Rights Project / Proyecto Derechos Civiles.
Talbott, E., Fleming, J., Karabatsos, G., and Dobria, L. (2011). Making sense of minority student identification in special education: School context matters. Int. J. Special Educ. 26, 150–170. doi: 10.4324/9781003156857-19
Temkin, D., Thompson, J. A., Gabriel, A., Fulks, E., Sun, S., and Rodriguez, Y. (2021). Toward better ways of measuring school climate. Phi Delta Kappan 102, 52–57. doi: 10.1177/00317217211013939
Thapa, A., Cohen, J., Guffey, S., and Higgins-D’Alessandro, A. (2013). A review of school climate research. Rev. Educ. Res. 83, 357–385. doi: 10.3102/0034654313483907
U.S. Census Bureau (2016). American community survey 1-year estimates subject tables. Available at: https://data.census.gov/cedsci/table?q=baltimorecitypoverty2016
U.S. Department of Education (2022a). National Center of safe supportive learning environments. Available at: https://safesupportivelearning.ed.gov/about
U.S. Department of Education (2022b). Every student succeeds act (ESSA). A new education law. Available at: https://www.ed.gov/essa?src=rn
Van Eck, K., Johnson, S. R., Bettencourt, A., and Johnson, S. L. (2017). How school climate relates to chronic absence: a multi–level latent profile analysis. J. Sch. Psychol. 61, 89–102. doi: 10.1016/j.jsp.2016.10.001
Wang, M.-T., and Degol, J. L. (2016). School climate: a review of the construct, measurement, and impact on student outcomes. Educ. Psychol. Rev. 28, 315–352. doi: 10.1007/s10648-015-9319-1
WestEd. (2022). Ensure equity and drive system change. Available at: https://csti.wested.org/
Keywords: school climate, school attendance, student mobility, neighborhood safety, socioeconomic factors in education
Citation: Moore SA, Ouellette RR and Connors EH (2023) Structural school characteristics and neighborhood risk factors: Associations with student-reported school climate in a large, urban public school district in the United States. Front. Educ. 7:931474. doi: 10.3389/feduc.2022.931474
Edited by:
Parisa Parsafar, Eunice Kennedy Shriver National Institute of Child Health and Human Development (NIH), United StatesReviewed by:
Joshua Levy, Dartmouth Hitchcock Medical Center, United StatesEdward M. Sosu, University of Strathclyde, United Kingdom
Copyright © 2023 Moore, Ouellette and Connors. This is an open-access article distributed under the terms of the Creative Commons Attribution License (CC BY). The use, distribution or reproduction in other forums is permitted, provided the original author(s) and the copyright owner(s) are credited and that the original publication in this journal is cited, in accordance with accepted academic practice. No use, distribution or reproduction is permitted which does not comply with these terms.
*Correspondence: Elizabeth H. Connors, ✉ ZWxpemFiZXRoLmNvbm5vcnNAeWFsZS5lZHU=