 Diana M. Fisher1*
 Systems Thinking Association2
- 1Department of Systems Science, Portland State University, Portland, OR, United States
- 2K-12 Working Group, Çeşme, İzmir, Türkiye
Infusing systems thinking activities in pre-college education (grades K-12) means updating precollege education so it includes a study of many systemic behavior patterns that are ubiquitous in the real world. Systems thinking tools include those using both paper and pencil and the computer and enhance learning in the classroom making it more student-centered, more active, and allowing students to analyze problems that have been heretofore beyond the scope of K-12 classrooms. Students in primary school have used behavior over time graphs to demonstrate dynamics described in story books, like the Lorax, and created stock-flow diagrams to describe what was needed to make a garden flourish. Middle school students have created larger stock-flow diagrams to study how composting helps to reduce pollution and have created small simulations to study population dynamics and the spread of epidemics. High school students have created/used numerous computer models to study systemic problems in mathematics, physical science, physics, biology, environmental science, global studies, and history. Some high schools developed modeling courses allowing students to create System Dynamics computer models to study problems of their choice, write technical papers explaining their models, and present their models and model results to an audience. This paper contains explanations of some of the systems thinking lessons that have been used with precollege students, some for just 5–6 years (especially the primary and middle school examples), others (especially the mathematics and system dynamics model courses for high school students) for decades.
…the realities of the real world cannot be understood only by qualitative descriptions.
Vaclav Smil
1. Introduction
Many of the systemic problems that plague us globally are part of complex systems (Sterman, 2000). We know that systems comprise elements that interact purposefully, for example a football team or a simple lawn sprinkler system. Complex systems, however, contain additional characteristics. Two of the additional characteristics most pertinent to this discussion include non-linear dependencies between some elements of the system and include material and/or information delays within interconnections, which can lead to unintended consequences when regulators try to interfere with the system (Sterman, 2000). Non-linear dependencies mean that the effect of an action is not always proportional to its cause (or causes), for example, amount of time spent studying and one’s grade on an exam. There is a minimum amount of studying needed to effect some positive outcome on an assessment, but there is also a maximum amount of studying time beyond which the “law of diminishing returns” comes into play. More study time does not always produce better exam grades.
Information delays occur between the time information is received, say by a manager, and the time the manager acts on the information. A significant information delay occurred when global climate change predictions started appearing in the 1970’s but were largely ignored until recently. Examples of complex systems include global climate change, natural resource depletion, the spread of epidemics, supply chain dynamics, homeostasis in the human body, the emergence of inflation, to name a few. The previous siloed educational approaches are inadequate for understanding complex systems. “Today’s students, the citizens and leaders of the new millennium NEED tools to organize, understand, act on, and add to, the exploding body of human knowledge in an increasingly interconnected world” (Jakobsson, 1999, p. 1). Various educational leaders have had the foresight over the past decade to begin to embed within educational standards some skills necessary to look at problems holistically and as systems (U.S. Partnership for Education for Sustainable Development, 2009; National Research Council, 2012; NGSS Lead States, 2013; National Council for the Social Studies, 2014). Yet, little has been done to address how to educate students to better understand complex systems. Again, our previous tools, albeit powerful, are insufficient to allow pre-college students to analyze complex systems.
“Complex systems analysis changes what the equations are written about, shifting them from properties of things to properties of dependencies or relationships and collective behavior. Calculus and statistics do not have the tools to describe what we want to study. … We have to develop an entirely new set of concepts that enable us to think about the behavior of the system. … Really, most importantly, it changes the nature of the questions that we ask about the behavior of the system. It changes how we think.” (Bar-Yam, 2015)
To be able to address complex systems students need to become systems thinkers (Integrate, 2022). Arnold and Wade (2015, p. 675) define systems thinking as “a set of synergistic analytic skills used to improve the capability of identifying and understanding systems, predicting their behaviors, and devising modifications to them in order to produce desired effects. These skills work together as a system.” This definition most closely captures the mindset that the authors and our educational collaborators (teachers, administrators, and educational consultants affiliated with the System Dynamics Society1) have used to guide the K-12 systems thinking approach used for 6–20 years in various precollege classrooms and presented in this article.
To further define the components of systems thinking Stave and Hopper (2007) conducted a literature review to determine what constituted systems thinking (ST) and provided a description of the seven concepts that fall within systems thinking. Those concepts are:
a. Recognizing interconnections: Students must be able to recognize a system (elements, interconnection, purpose).
b. Identifying feedback: Students should be able to identify closed loop cause-effect (feedback) relationships and identify their type.
c. Understanding dynamic behavior: Students should understand the structure of (and feedback in) the system determines its behavior and recognize the effect of delays on system behavior.
d. Differentiating types of flows and variables: Students should be able to differentiate variables in systems (accumulations, flows).
e. Using conceptual models: Students should be able to explain the behavior of a system by using feedback, the structure of the model (if available) and the graphical output of the model.
f. Creating simulation models: Some educators believe students should be able to create quantitative models using appropriate mathematics and modeling software. (Note: Our ST group believes ALL high school students should be able to build at least small computer simulations). Students should be able to “use qualitative and quantitative data in models and should be able to validate the behavior of a model against some standard.”
g. Testing policies: Students should be able to test potential policies to alter model behavior and look for leverage points.
A sequence of systems thinking concepts that are developmentally appropriate can start the process of educating students from kindergarten through grade 12 to build their systems thinking capacity. An overview of skills per grade level (kindergarten, primary, middle, high school) is provided in the section (below) dealing with instructional activities.
Frontiers in Education article type B: Conceptual Analysis.
2. Method
2.1. Using systems thinking
Systems thinking is a method of analysis that guides students to look at systemic problems holistically. But as a method of analysis it must be used regularly throughout a course or students will not recognize its value. Moreover, systems thinking supports more multidisciplinary lessons, which is important because “… in today’s world more and more knowledge is spilling over the boundaries of the compartments we have constructed…” (Jakobsson, 1999, p. 1). For example, trying to maintain a sustainable fishery involves not only fishermen but also environmental scientists, those who process and sell the fish and those who buy the fish. This problem involves understanding economics, mathematics, science, business, and psychology. It has been found that interdisciplinary studies promote gains in cognitive ability, critical thinking, and ability to better deal with ambiguity, and has increased appreciation for ethical and bias issues among students (SERC, 2021).
Richmond (2010), the late educator and world-class systems thinker and modeler, indicated there were three processes that are fundamental to the systems thinking process: thinking, learning, and communicating. In the thinking part he identified two major activities, constructing mental models,2 then simulating them to see if any conclusions could be drawn based on the mental models. In the learning part the student is trying to reconcile their mental model with the simulation output. If the two do not agree then either the mental model is incorrect or the simulation is improperly constructed. In either case learning occurs as the student tries to align their mental model with the computer simulation. So the student is using the computer as a way to validate their mental model. Finally, Richmond says students need to communicate what they learned in this process. This requires giving and receiving feedback about the student’s mental model.
Students creating computer models as part of a systems thinking curriculum continuum is key. Jay Forrester (2009), the father of System Dynamics, recommended that students ultimately need to build simulation models to test their mental models as a way to help them be more precise in analyzing the behavior of systemic problems and be consistent in their discussion about how potential policies might change the system. Our sequence of ST concept development is grounded in Forrester’s recommendation. One of the authors taught multiple (non-honors) second year algebra students every year, for 10 years in an inner-city high school then another 10 years in a suburban high school, to build and analyze small System Dynamics (SD) models as a regular part of the algebra curriculum (Fisher, 2017).3
2.2. The tools of systems thinking analysis
The list below itemizes and briefly explains the tools K-12 educators in the pre-college division of the System Dynamics Society, the Systems Thinking Association in Türkiye and other educational partners use to infuse systems thinking and System Dynamics modeling activities into K-12 education. For clarification, System Dynamics uses computer simulation to test mental models. We see it as the final stage of systems thinking analysis. Not all educators who use systems thinking tools believe computer simulation is needed (and certainly below grade 6 computer simulation is not generally used as part of system thinking lessons). But our approach is predicated on preparing students, by grade 6, to become familiar enough with stock-flow diagrams so they can then begin to use computer simulation (starting in middle school) as a tool to validate system behavior and test potential policies to mitigate undesirable system behavior.
The following partial list of systems thinking tools4 have been developed by several sources.5
2.2.1. Behavior over time graphs (BOTGs)
The dynamics of an important systemic variable is captured in a (continuous) graph that has time on the horizontal axis and a range of the variable values marked on the vertical axis.
2.2.2. Feedback loops
(Closed cause-effect loops.) Feedback loops control the behavior of the system. Reinforcing (+) feedback acts to increase the change in the system over time. Balancing (−) feedback acts to dampen the change in the system over time.
2.2.3. Stock-flow maps
Stock-flow diagrams allow students to capture the structure of their mental models. See Figure 1.
– A stock (a rectangle) represents a variable that accumulates (population, money, pollution, …)
– A flow (pipe with a ball in the center and a least one arrowhead) represents those variables that increase or decrease the value of the stock over time.
– A converter (an independent circle) usually holds the value of a constant or a simple arithmetic combination of two components.
– A connector designates a dependency of one component on another.

Figure 1. The SD modeling icons used in the Stella modeling software.
2.2.4. Stock-flow simulations
Stock-flow simulations are fully operational stock-flow diagrams that have values or simple formulas placed in each icon, can be executed on a computer and show the behavior of the model variables over time via graphs or tables.
2.3. Teachers as gatekeepers
Students pick up systems thinking concepts relatively quickly, even the building of stock-flow simulations. While this is exactly what we want to happen it can place some teachers in uncomfortable positions. Obviously teacher professional development involving strategies for teaching ST analysis will be necessary. Training in the use of BOTGs, the Ladder of Inference, the Iceberg, link polarity, and feedback loops is offered by the Waters Center for Systems Thinking (2000).6 Training in the use of Connection Circles, creating stock-flow diagrams, link polarity, feedback loops, and creating System Dynamics simulations is offered by CC Modeling Systems.7 Additional teacher materials can be found at The Creative Learning Exchange.8 There is a relatively steep learning curve to prepare teachers to incorporate lessons that allow students to create original stock-flow models (simulations) as teachers will need to know enough to be able to debug student models when the models do not work properly. Having teachers use guided model-building student lessons can help teachers transition to this final stage. Only one or two teachers in a school system may be willing to reach this final model-building stage with students. These teachers will be extremely valuable to the school as they can help other teachers create their own ST/SD lessons and help administrators use ST/SD to enhance school leadership. Bear in mind that as students become proficient with ST/SD they become valuable allies in a partnership with teachers and administrators (acting as assistants when teachers are trying to use SD modeling with computers for the first time in class, or experimenting with new modeling features, or given special modeling tasks like setting up models to track student populations in each grade over time etc.) for those adults comfortable working as co-learners with students. It is an exciting (and humbling) experience!
While training is needed for teachers to implement ST and SD with students, for SD lessons software is also necessary.
2.4. The systems model-building software
There is a free, web-based, stock-flow (SD) modeling software that will work on laptops, tablets, and Chromebooks. The software is called Stella Online.9 It restricts models to at most 3 stocks and at most 20 icons. This restriction is sufficient for almost all guided model-building lessons that would be appropriate for a middle or high school class. To have students build original models would require a site license of the commercial version of a model-building software.
What we will describe in the next section of the paper is a small sample of K-12 activities designed to build ST skills in students starting in primary school and maturing through middle, and high school.
3. Instructional activities
Pre-college experience (that focuses on progressing to System Dynamics modeling for students) accumulated so far suggests a progression of systems thinking concepts through the grade levels and is outlined in the following table (See Table 1). The lessons presented are only a small sample of what our educational ST/SD group has used in the K-12 classroom. Note: there are other approaches to using ST not discussed here.
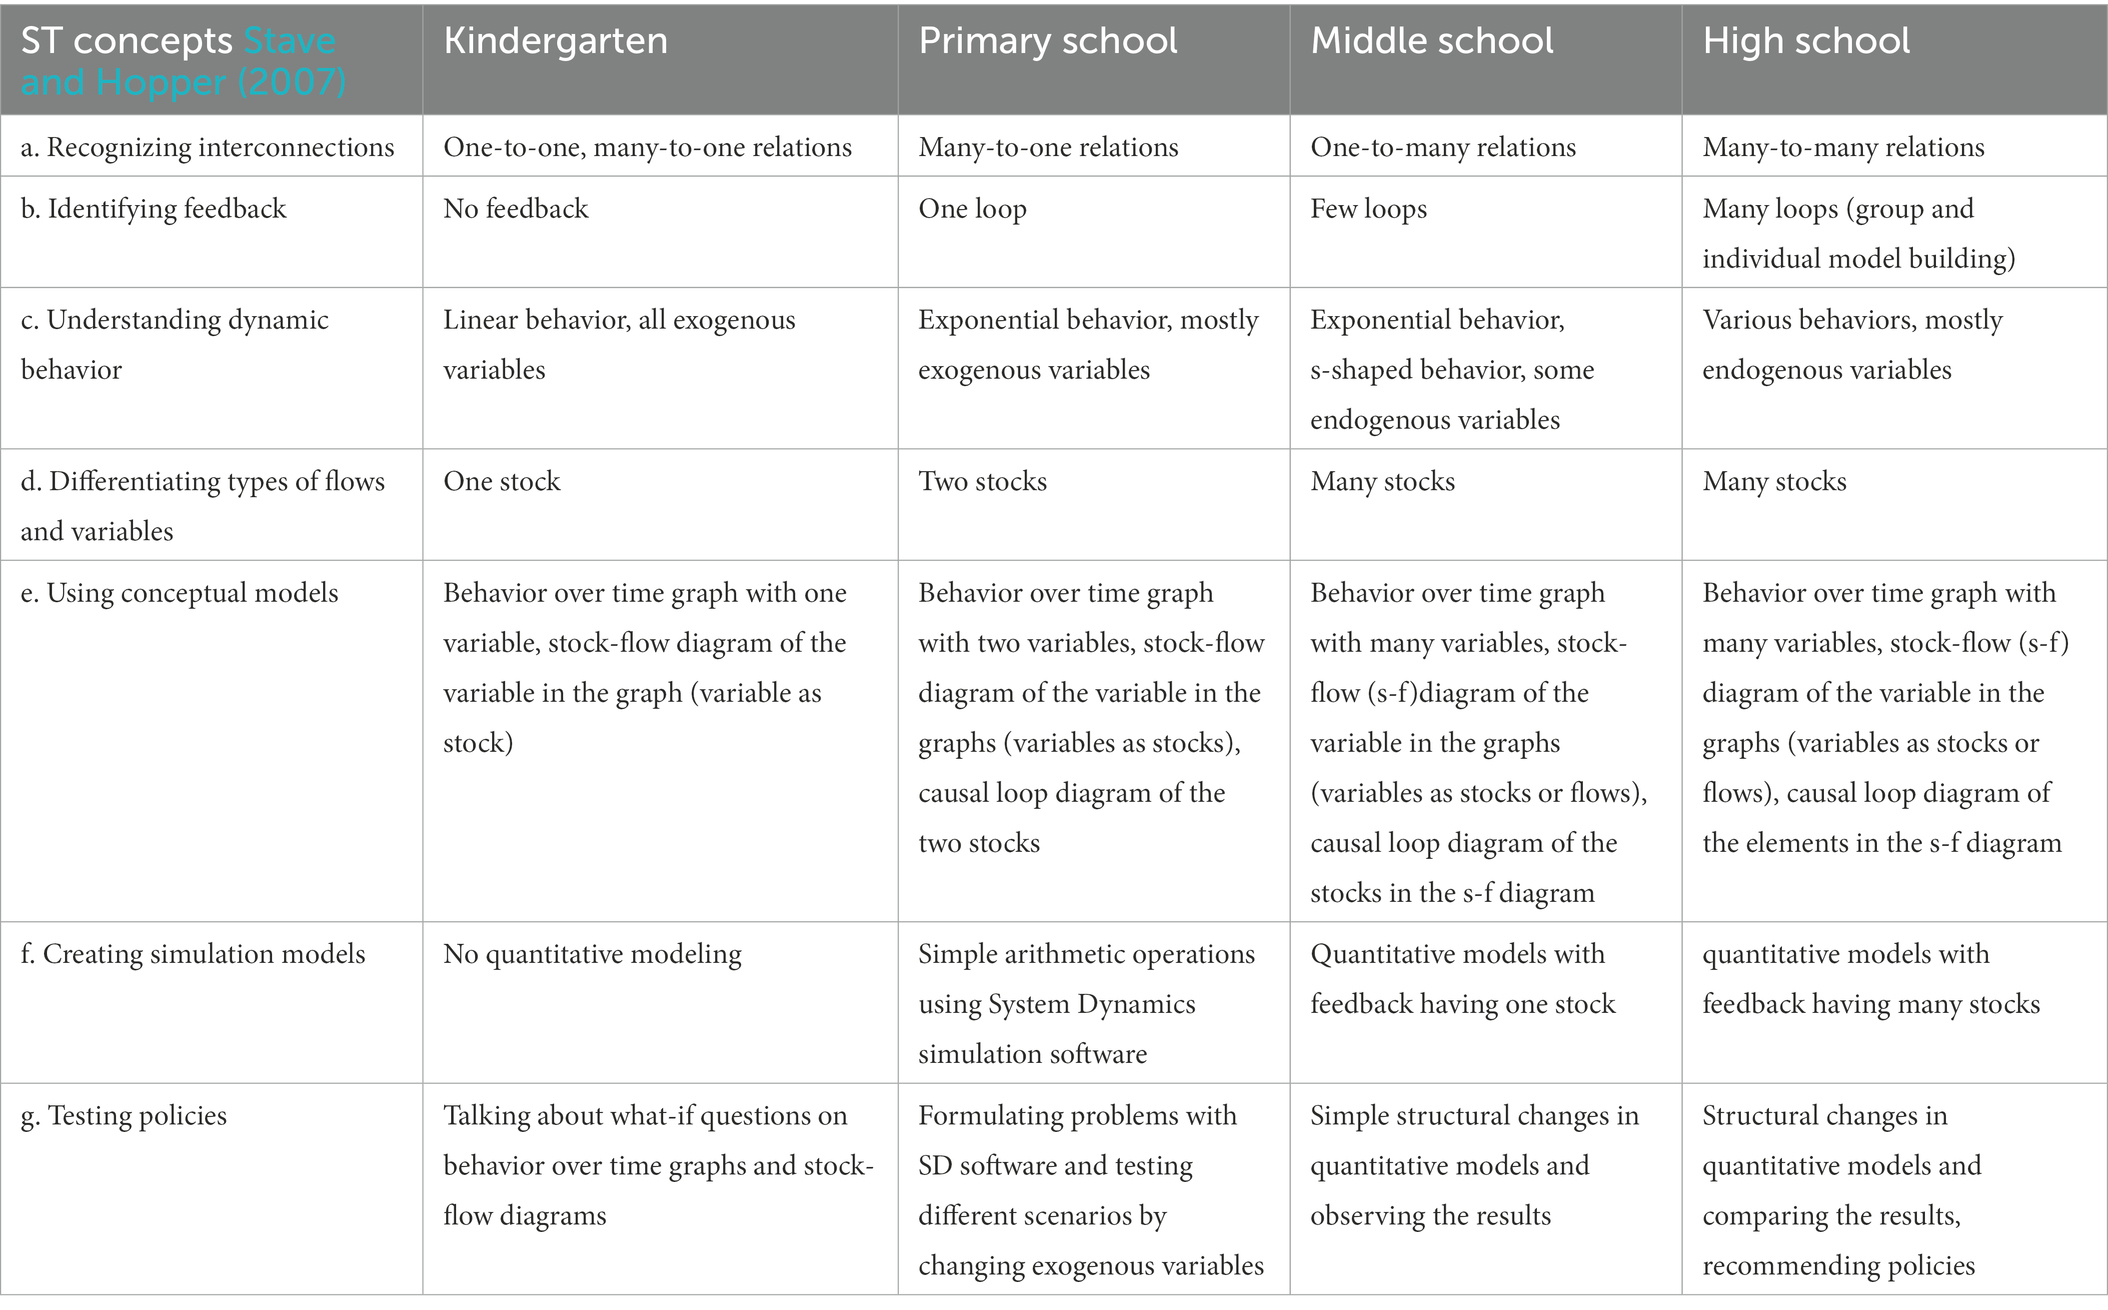
Table 1. Simple scope and sequence of ST/SD concepts for K-12.
3.1. Primary school
Two possible methods for designing lessons with the ST approach are:
• trying to find topics that are compatible with ST
• trying to find ways to infuse ST into the concepts within the curriculum.
We, in Türkiye, found the latter approach more promising and comfortable for the primary school level.10
The following ST activities have been successfully used at the primary school level.
3.1.1. Attendance graph
Arguably, the very first activity in primary school, hence in the educational life of a student may be attendance graphs. An attendance graph is a basic Behavior Over Time Graph (BOTG) having days of the week on the horizontal axis and number of students who attended on specific days on the vertical axis.
Throughout the week, a different student marked the number of students in attendance on a specific day. The teacher talked to the students to help them find the point on the graph to mark. At the end of the week, after marking the last day’s attendance all marked points were connected.11 See Figure 2. This gave the teacher an opportunity to ask questions like, on which day was the attendance highest/lowest, how you know that information from the graph, and why did the line go down or up?
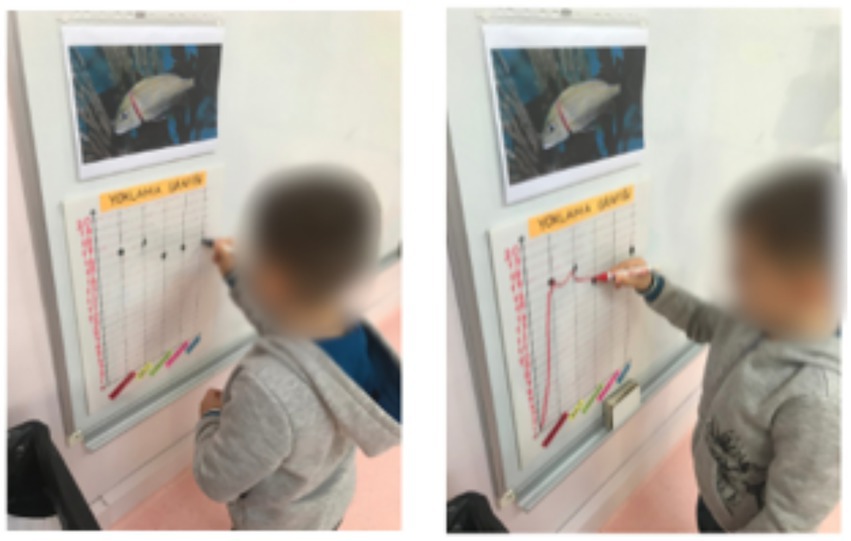
Figure 2. A kindergarten student marking a dot on an attendance graph then connecting the dots, creating a BOTG.
3.1.2. Storybooks
Another widely used activity was analyzing stories using the ST approach. Any story that has a sequence of events can be analyzed with BOTGs and stock-flow diagrams. The first step was the most important one as it determined the subsequent steps:
• What was changing through the story? The answer to this question, at least for primary school students, was designated as a stock. It did not need to be measurable but it should have been quantifiable, i.e., happiness of a blue whale who is friends with a penguin, the amount of food collected by mice for the winter, things collected by Frederick the mouse, the distance traveled by the tortoise and the hare in their race, the number of scales and number friends of a Rainbow Fish, the will of the Little Prince to return to his planet B 612, the decisiveness of Hamlet to kill his uncle, etc.
• Once the change in the story (variable) was identified, the sequencing of events over time (drawings or writing, depending on the grade level) showing the change was discussed and recorded.
• Then a BOTG was prepared having events/time on the horizontal axis (representing the time sequence) and the vertical axis represented in ordinal (low, medium, high) or numeric scale. The variable graph was drawn individually, by groups or by the whole class with teacher’s facilitation. While drawing the graph, a rich environment occurred for discussing the behavior of the variable selected.
• Finally, the teacher and students discussed the causes of the change. For investigating the causes of change, stock-flow diagrams were used. The simplest thing to do was to make the variable in the BOTG the stock in the stock-flow diagram. Once the stock was identified, its inflows and outflows were easily designated. Then the teacher asked, “what are the causes of the inflows/outflows? That is, from the BOTG, what caused the increase or decrease in the graph at a specific point on the graph? The stock-flow diagram was completed by going through all the points (events) of the BOTG.
3.1.3. Problem modeling (with one stock)
For students in grade four, after developing comfort in using SD modeling software to build small model diagrams, the following problem was used with Turkish students. We presented students with a problem based on real values from Istanbul’s dam occupancy statistics, constructed like a puzzle (dotted lines show a possible separation line for a jig-saw puzzle). See Figure 3. Students were grouped and each model part was given to a group. The student mission was first to figure out the values of parameters (circles) shown with question marks, then student groups worked together to reconstruct the paper model and prepared a BOTG to predict if the water in the dam would be sufficient for the Istanbul population and if not, when the dams would be emptied. A similar problem could be used using local numeric values that are appropriate for your region.
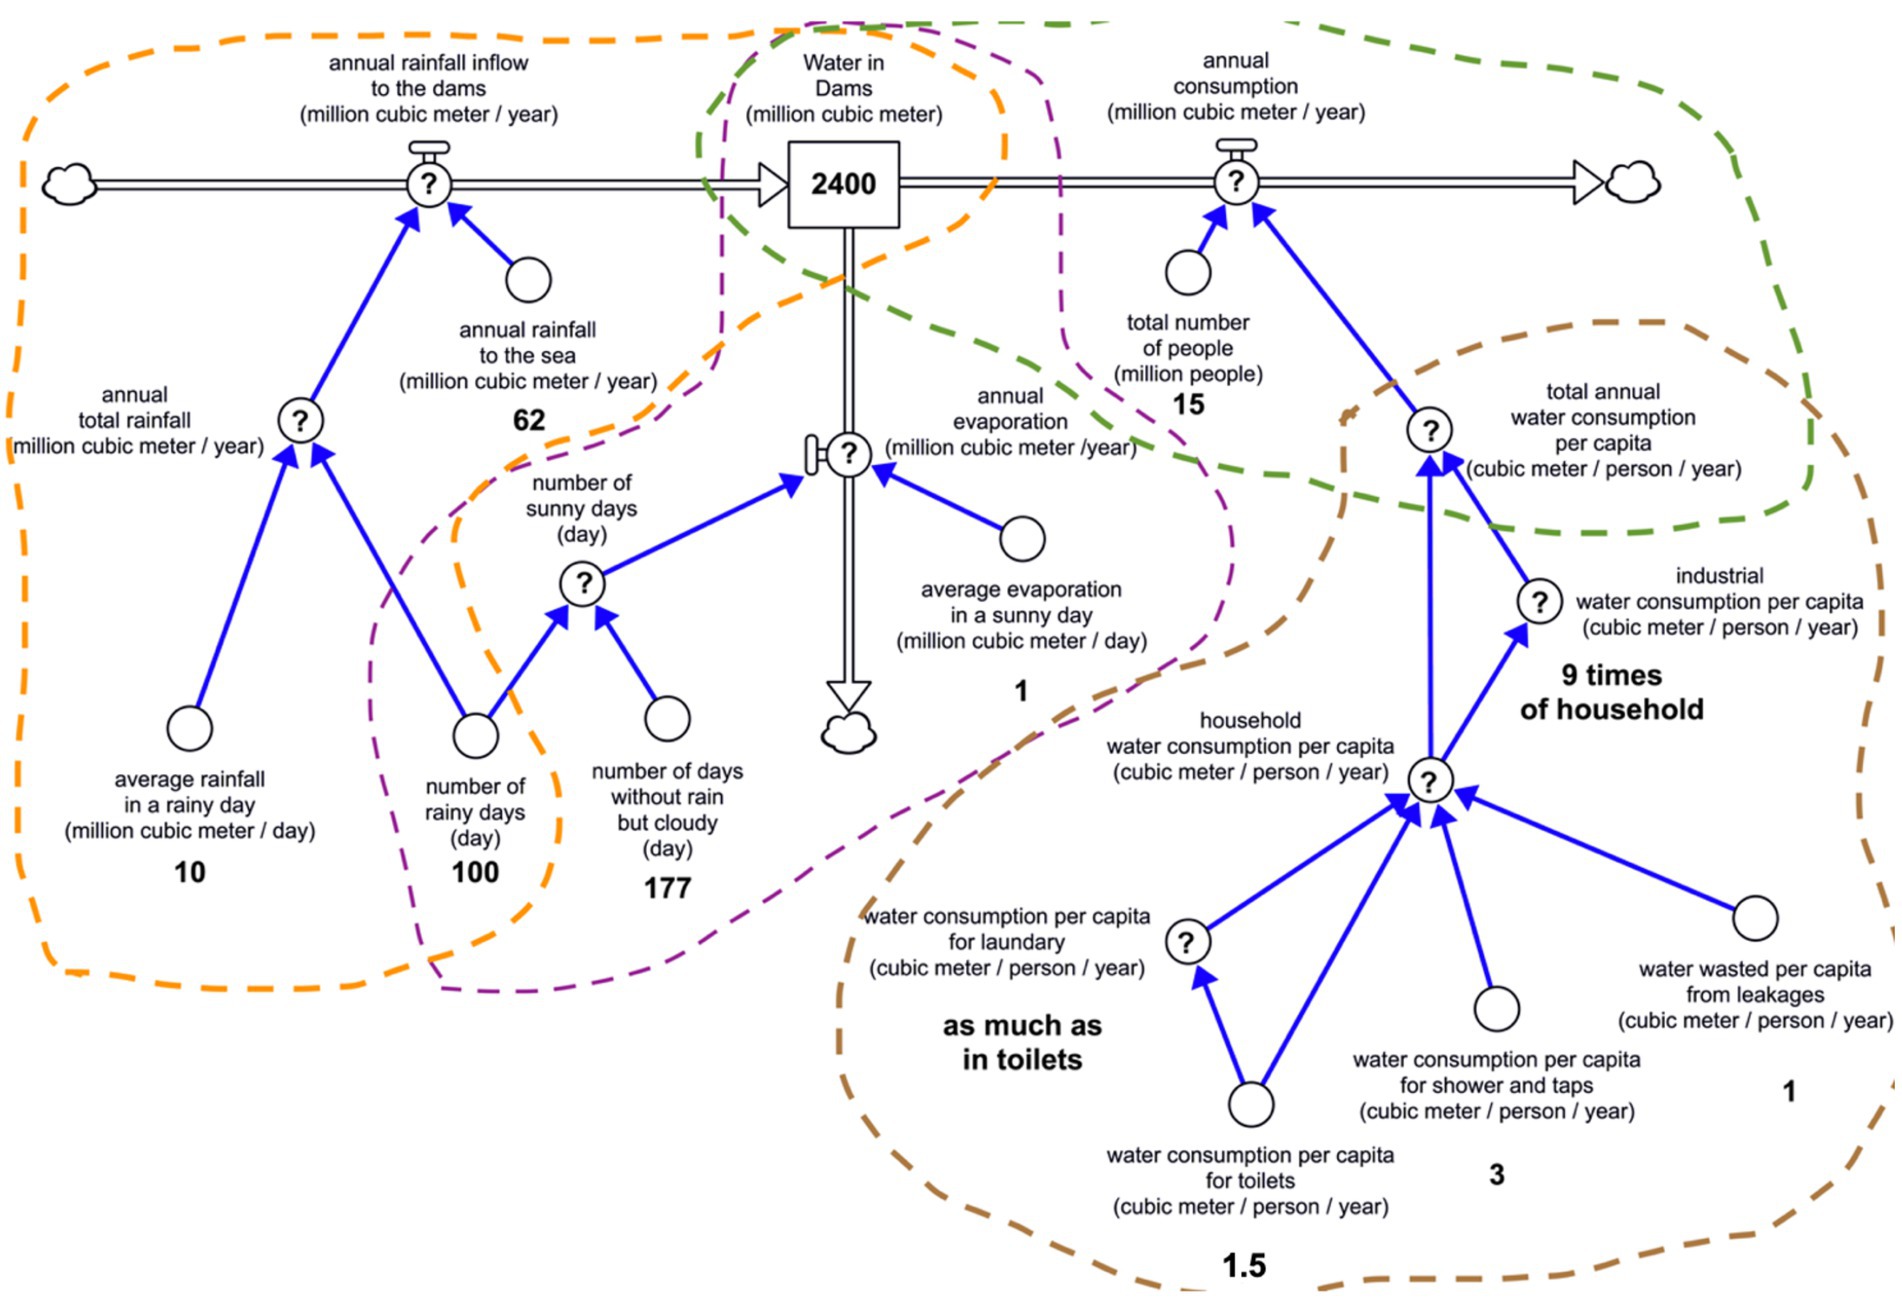
Figure 3. Jigsaw problem students complete and then reassemble.
3.2. Middle school
Middle school, as the name implies, is in the middle of the continuum between simple conceptual models and complex numeric models.12 These years were used to develop student skills in constructing causal loops and understanding numeric relations (formulas) causing basic behaviors like exponential growth/decay, goal seeking behavior and finally oscillating behavior. This continuum is valid if all the students in the class had been through ST implemented lessons in primary school. If students did not have ST lessons in primary school then an accelerated version of introductory ST activities should be implemented in the first year of middle school.
The following ST activities have been successfully applied at the middle school level.
3.2.1. Environmental education with systems thinking and the world climate game
A more comprehensive adaptation of the systems approach with ST tools can be used within the environmental education curriculum. As a result of the global climate crises environmental education is a very popular and important subject and (sadly) becoming more important every day. The following exercise, containing a series of activities grouped in 3 parts, enriched with ST tools, was used to allow students to study this crisis. See Figure 4.
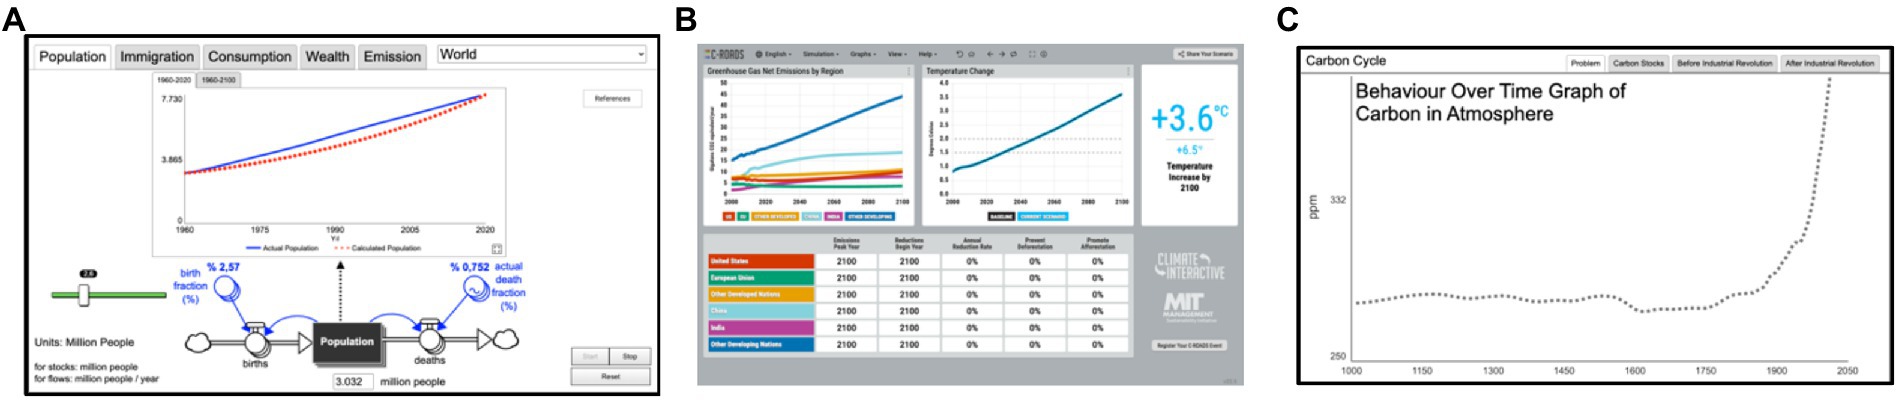
Figure 4. Computer interfaces and simulations used throughout the exercise: Population (one of five) Interface (A), Climate Interactive World Climate simulation game (B), Carbon Cycle (one of four) BOTG (C).
The first part of the exercise included activities, developed progressively, to help students understand the structure of the system that produces wealth, and hence, emissions. First, a simple population model was introduced with options for selecting an individual country population or the global population. After adding immigration and emigration flows to the population structure, an economic stock-flow structure that creates wealth was discussed (See Figure 5B) using questions like: How are key terms like production and production per capita (wealth) defined? What are other effects of these flows? Are they inevitable? The graph, accompanied by graphs of various countries, was used to show that, although there seems to be a correlation between wealth and emissions, this is not the case for many countries so it is possible to increase wealth without increasing emissions (See Figure 5A). The stock-flow map was used as a supplementary representation for introducing stock-flow concepts to students as the middle school students did not have prior knowledge about systems thinking (the stock-flow map is a good reinforcement even if students have had previous exposure to ST). For the same reason, larger feedback loops were not discussed (at this point) because we think that building a solid understanding of stock-flow structures is an important first step.
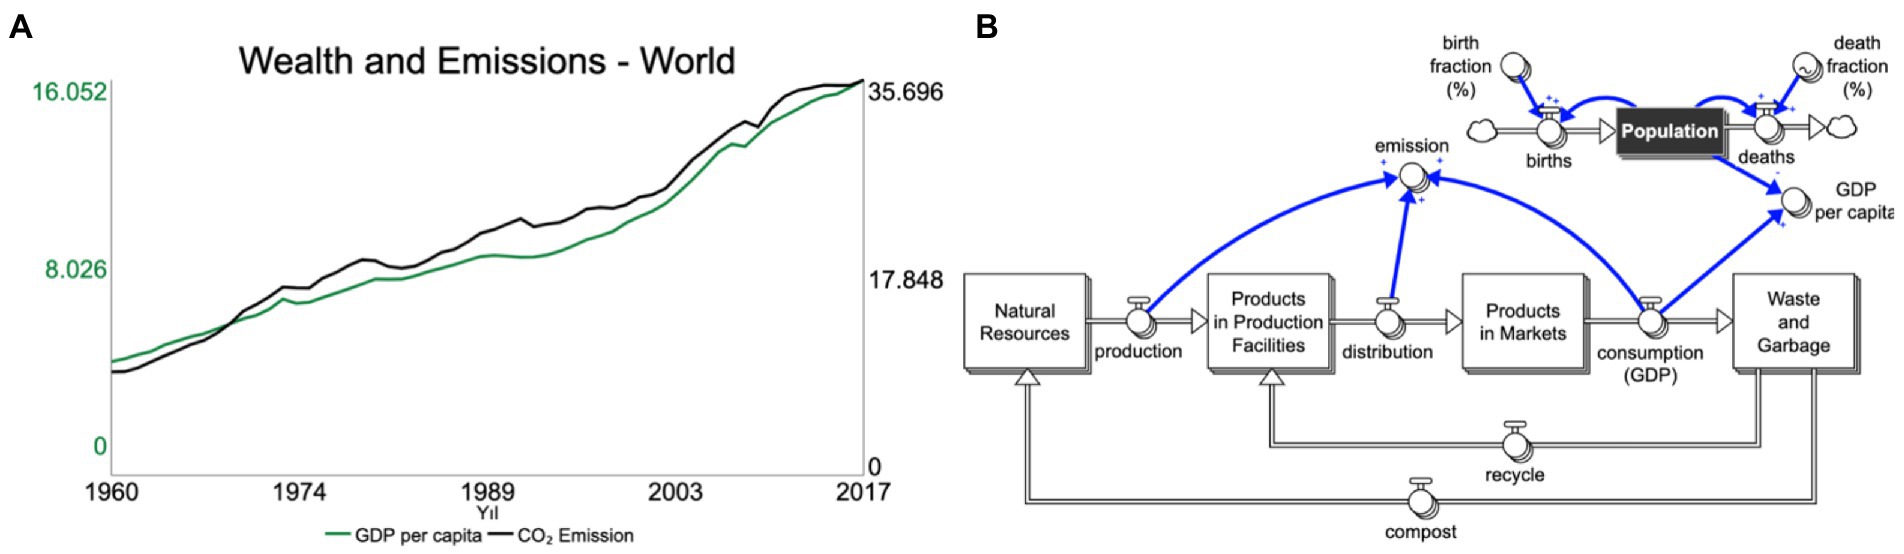
Figure 5. BOTG (A) and stock-flow map (B) from the last part of the first phase of the exercise shown in Figure 4 (before using the World Climate simulation game).
The aim of the first part was to prepare students, both cognitively and psychologically, for the second part, the World Climate Game, that is, C-ROADS13 (an interactive United Nations role-playing simulation with exercises involving climate change negotiations). See Figure 4B.
The third part of the exercise used the enthusiasm created in the World Climate Game. After witnessing the dilemmas that countries faced, our students became much more eager to learn more about the mechanics of climate change. So, this was a good time to discuss topics like the carbon cycle and the greenhouse effect. As an activity, stocks were given to the students and the teacher asked them to complete the map by drawing the flows. Later, this map was used to show the impact points of the solutions students researched and proposed as they discussed the impact of global climate change. See Figures 4C, 6.
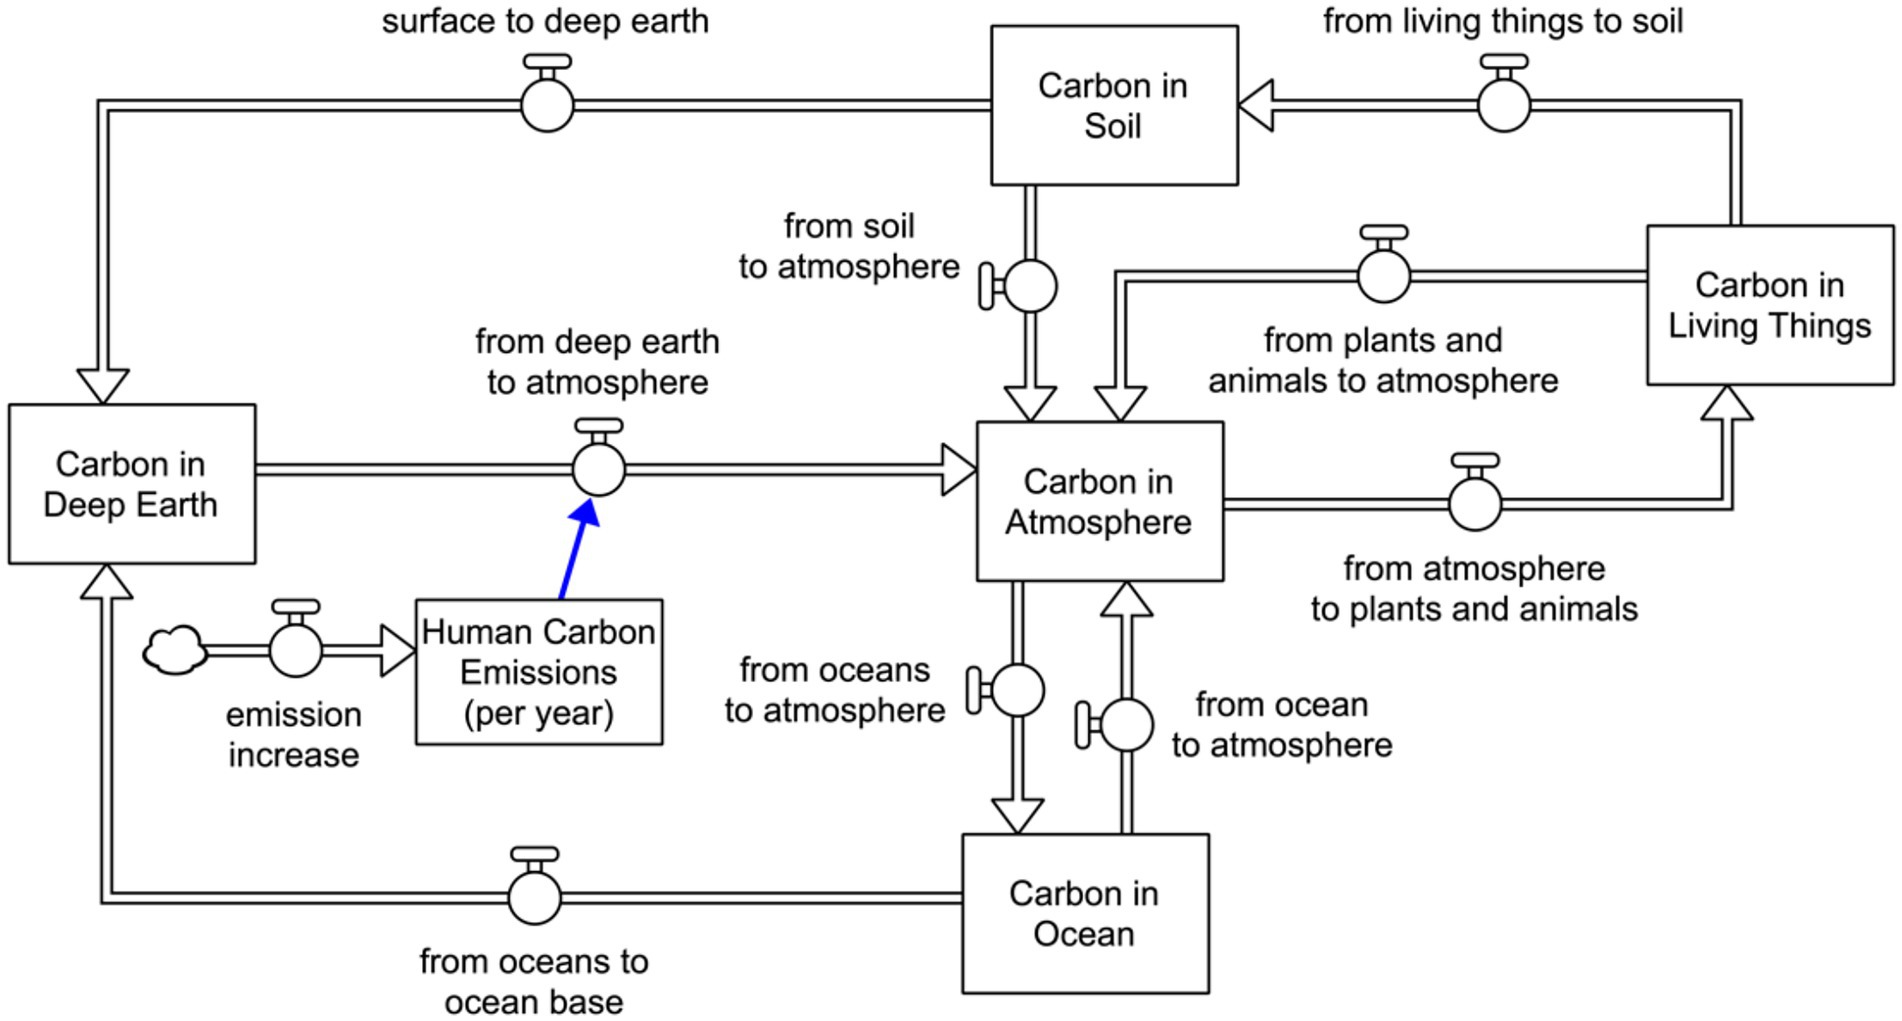
Figure 6. The Stock-Flow map of the basic stocks of the carbon cycle.
3.2.2. Physics: From one dimensional motion to energy transformations
Classical (Newtonian) mechanics was modeled with a stock-flow diagram that helped students understand the theory of mechanics holistically by visualizing the relationship of the concepts. The model was constructed throughout the middle school grades, step by step, and gave students a chance to build more understanding of the current year’s concepts by adding to the previous year’s understanding (building the diagram over several years). See Figure 7.
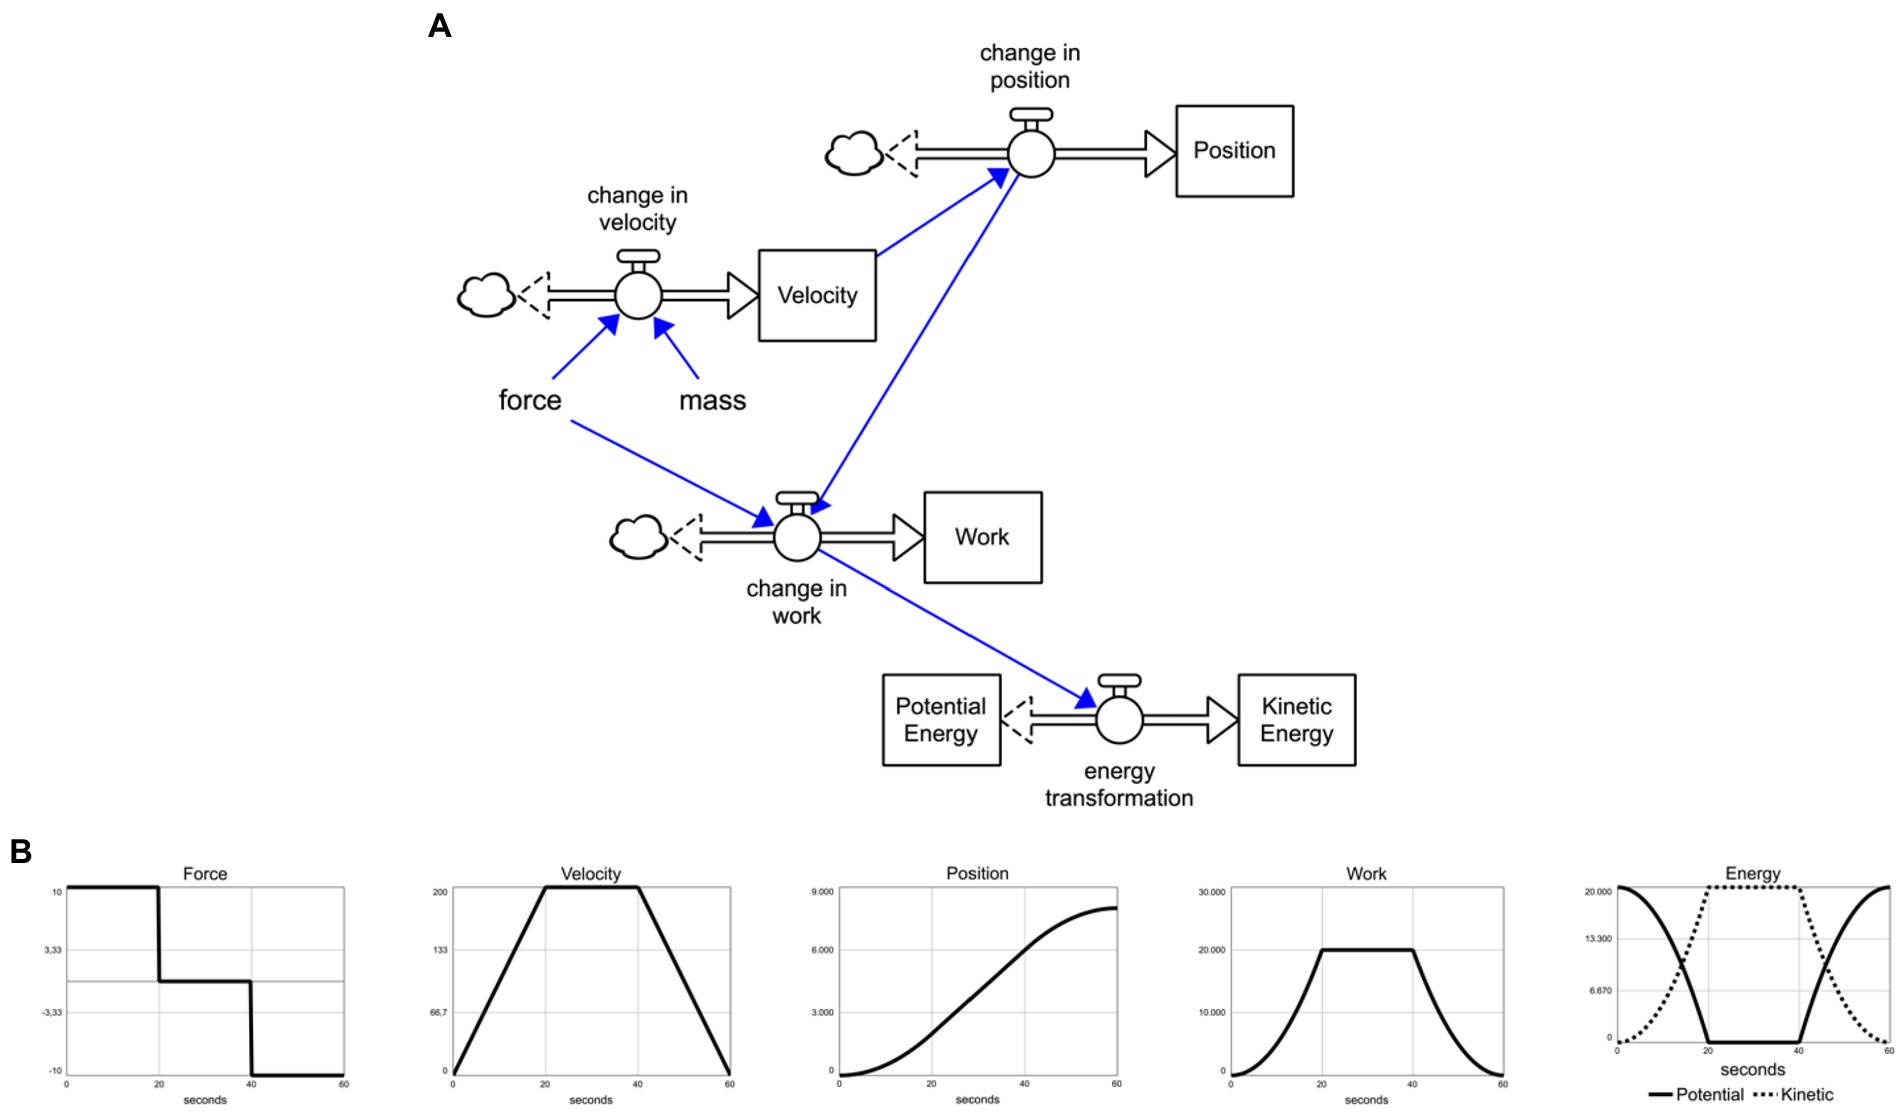
Figure 7. A stock-flow model (A) of important concepts involved in classical mechanics, including several behaviors (B) produced by the model.
The first model included only one stock and one flow, “Position” and “change in position.” By limiting both variables to be only positive numbers, “Position” became “Distance” and “change in position” became “speed” and the model became compatible with the 6th grade science curriculum. For subsequent grades, related stocks and flows were introduced gradually to complete the big picture of classical mechanics where only “force” and “mass” were exogenous and all other parts of the system were connected in various ways to produce the observed behaviors (shown in the graphs of Figure 7).
For example, results of a change in force on various stocks in the system was visualized in BOTGs: A constant force in the direction of the motion increased velocity linearly which increased position in a quadratic pattern as change in position was bigger for each consecutive time step. This change in force and position caused a change in work, that is, work was done. A change in work is a change in energy so energy was transformed from potential energy (stock) to kinetic energy (stock). So, the kinetic energy of the object where a force in the direction of the motion was applied, increased.
The model was a representation of one-dimensional motion with related concepts. Once internalized, the model was extended to two-dimensions (required for high school) easily and smoothly by adding position and velocity stocks for the new dimension (vertical and horizontal dimensions). The model was expanded by adding a couple of links from position, velocity and mass to make “force” endogenous (e.g., gravitational force, friction force).
3.3. High school
The focus of the high school ST activities presented were based on students building and analyzing stock-flow (SD) models.14 Although ST activities are well positioned to support multidisciplinary lessons most high schools still teach most subjects separately. Consequently, the following ST activities are broken into their discrete discipline areas.
3.3.1. Mathematics
When students studied algebra systems modeling was a productive instructional strategy. Having students build simple stock-flow representations of functions (linear, quadratic, exponential, convergent, logistic, and sinusoidal) allowed them an alternative way to study the typical problems in most mathematics textbooks that involved change over time. See Figure 8. This format was especially well received by students not comfortable with closed-form equations.
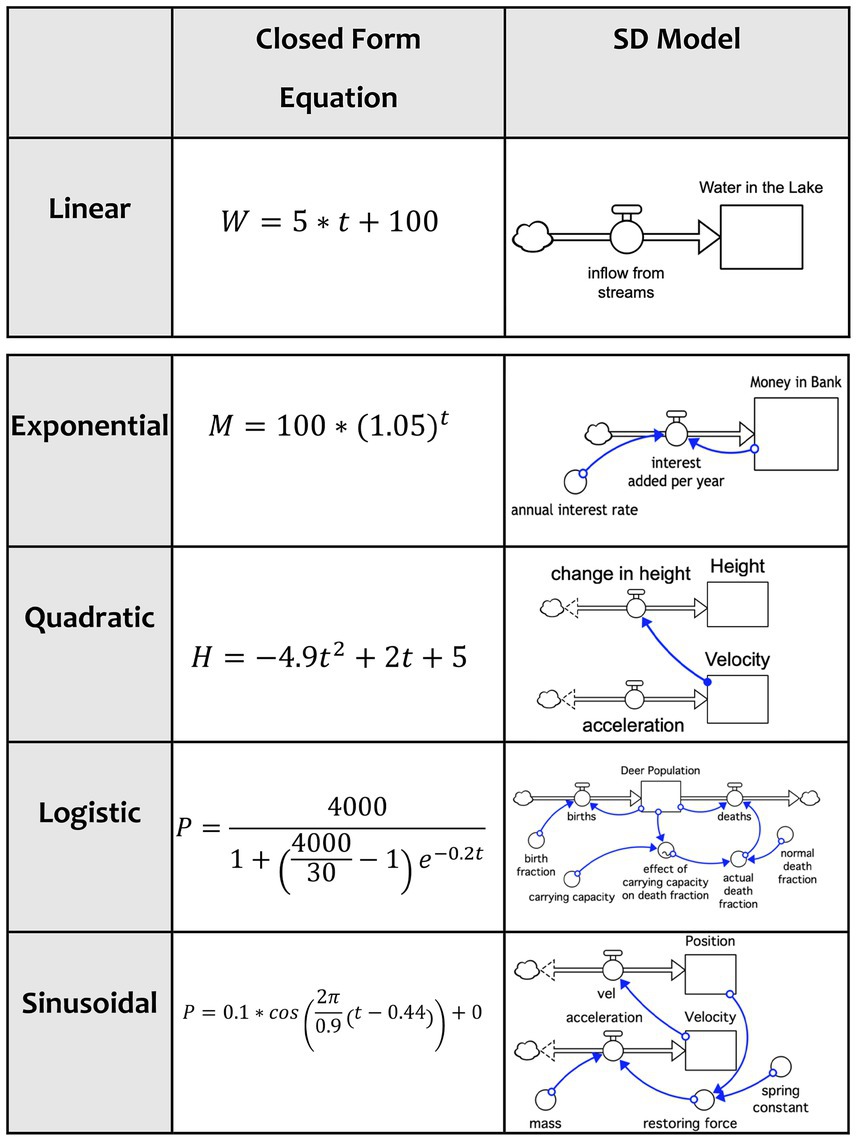
Figure 8. Equivalent closed-form mathematical function equations and stock-flow representation.
Once students became comfortable with stock-flow structures for individual functions they started to combine those stock-flow structures to study problems that were not typically studied in algebra (how therapeutic drugs work in the human body, global population and food production interaction, natural resource depletion, and predator–prey interactions). Students actually saw the internal structure of the system producing the behavior and determined how to modify the structure to consider alternative policies to improve system behavior. The study of feedback was introduced in these mathematics classes, not a typical topic for algebra.
Moreover, this System Dynamics modeling enhancement of algebra classes gave students an exposure to some core concepts in calculus [they compared stock (integral) graphs with flow (first derivative) graphs and interpreted the meaning of maximums and minimums in each of these graphs].
In calculus class students translated differential equations to stock-flow models, modified the models, and translated the new models back to create new differential equations. This had the effect of making differential equations more meaningful for students.
3.3.2. Biology
High school biology teacher, Jon Darkow, created over 50 system dynamics simulations to bring computational thinking, feedback loop, tipping point, linear and non-linear behavior analysis into his biology classes. All of his simulations, including some lessons, are available for free on his website.15 His simulations include topics on cellular metabolism, photosynthesis, enzymes, osmosis and diffusion, among others. His goal is to teach scientific practices through the use of System Dynamics simulations.
3.3.3. Environmental science
Students built SD models to study human population dynamics, non-renewable and renewable (see Figure 9) resource utilization, economic influences, etc. In these lessons students were asked to build the model, anticipate model behavior, explain discrepancies between anticipated model behavior and actual model output, analyze feedback, then test policies on the model to determine leverage points.
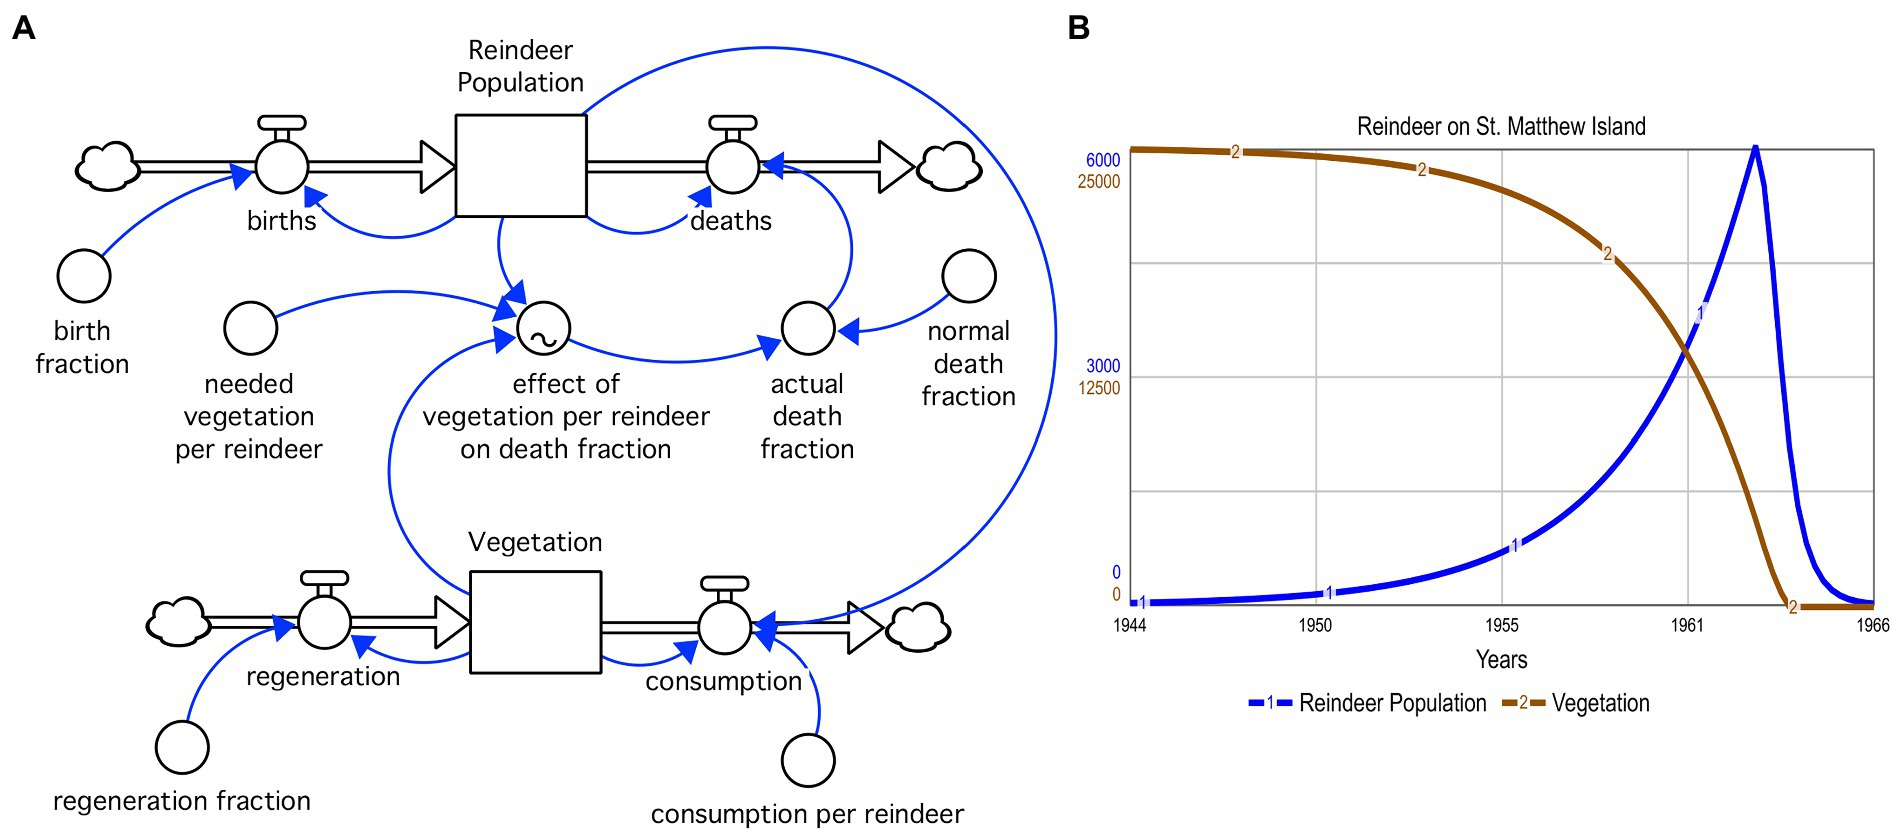
Figure 9. A guided student-built reindeer population and natural resource consumption model (A) and model output (B).
There is a new 2022 book, “What Now? A Call to Action: Environmental Systems Lessons for Upcoming Generations,” written by Alan Ticotsky, that contains numerous ST sustainability lessons16 for middle and high school students. It includes chapters on land, air, water, and additional topic sections on transportation, electrical energy, and recycling and provides numerous web resources. Mr. Ticotsky is also a co-author of another outstanding 2007 systems thinking book entitled “The Shape of Change including Stocks and Flows” from the Creative Learning Exchange.
3.3.4. Anatomy and physiology
SD was used by students studying human physiology. They built models to study the dynamics of administering therapeutic drugs via intravenous drip, shots, or pills to a patient. Some medical problems were then presented as part of each lesson and students used the models to test possible ways to deal with the problems that arose.
Homeostasis is fundamental to understanding how the human body works. Four ST lessons were used to reinforce student understanding of body temperature, calcium and glucose-insulin homeostasis, and the homeostatic response to decrease in oxygen in red blood cells. For each of these lessons students were given a description of the process, determined which variables in each description should constitute stocks, were then provided a (teacher) pre-developed stock-flow diagram of each homeostatic process and asked to sketch in the appropriate feedbacks in the system, identifying whether the feedbacks were reinforcing (+) or balancing (−) and why. The final activity for the glucose-insulin homeostatic study involved students interacting with a SD model and manipulating components in the model to produce behavior that would indicate type 1 or type 2 diabetes.
3.3.5. Physics
There were numerous SD models students built to better understand physics concepts. The most basic ones were to capture the relationship between position, velocity, and acceleration when tossing an object upward or at an angle, or dropping it from some height. Students built SD models and analyzed feedback (where appropriate) for problems involving car breaking distance, impulse and momentum of an object, kinetic and potential energy transitions, planetary orbits, radioactive decay sequences, charging and discharging a capacitor, temperature of a cooling object, and simple harmonic oscillators.
3.3.6. English literature
A very innovative English literature teacher, Joy (1996), created a SD model to enhance student discussion of the novel Lord of the Flies. His model had two stocks, one for the Innocence of the boys and the other for their Savagery. Students identified parts of the text of the book to support that innocence was lost and that savagery increased over time. But students disagreed whether innocence, once lost, was permanent. Students started to create their own stock-flow models to reflect their mental models. This classroom experience captured the positive unintended consequence (students building their own models to support their arguments, without prompting) of providing students with the tools that helped them think more deeply about systems.
3.3.7. Family studies
In a high school Family Studies course students used a SD simulation called “Modeling Your Future,” designed by two high school teachers. Students decided whether or when to attend college (and how many years of college to complete), whether or when to buy a car (and how much to pay), whether or when to buy a house (and how much to pay), when or whether to get married, how many children to have, etc. Their working income was based upon their level of education. The simulation kept track of their choices and simulated, over time, how much money they could expect to earn over their lifetime. One student said to another, “I do not want to wait to buy a car or a house and I will not go to college.” Another student answered, “How can you make that decision? Cannot you see how little money you will have to live on. It’s not fair to your children.” Experiences like this helped students become more aware of the long-term ramifications of decisions made at critical points in their lives.
3.3.8. System dynamics modeling course
Some of the most impactful and stimulating ST/SD work done by students occurred in several public and private high school SD modeling courses.
The previous English literature teacher, Tim Joy, also taught a high school SD modeling course. The students looked at problems within the Pacific Northwestern US. One year they focused on watersheds, forests and rivers in regions they knew. They played the SD simulation Fish Banks, about commercial fishing. At some point students started building models to capture what they were seeing. They wanted “a chance to see the corner of the world we inhabit as a place to learn about how to live well” (Joy, 2008, personal correspondence). His course did not have a set curriculum but Mr. Joy was a teacher who could bring real-world problems into the classroom for students to explore.
Another teacher taught a more structured high school system dynamics modeling course at two different public schools for over two decades. At one school a second year SD model course was offered for at least 5 years. (At both schools there were multiple sections of the year 1 SD modeling course.) The courses contained packets of modeling scenarios in which students built and analyzed models over a sequence of months, anticipating model behavior, identifying feedback, explaining model behavior and applying the modeling scenario to another problem with similar dynamics. There were no tests and there was no homework. Students could talk freely with each other as they worked on the packets and students progressed through the packets as quickly as they wanted. Then in the last 10 weeks of the class students each chose a partner to work with, chose 2 systemic problems to research for a week, decided on one of the two researched topics to pursue, created a working stock-flow model, wrote a technical paper explaining their model structure and feedback and why it behaved as it did, and presented their model to an audience or constructed a poster to display their model and results. For the teacher this was a life-altering experience. The students continued to produce models and papers beyond her expectations. The students were engaged and especially excited to study problems they were interested in. Comments by students over the two decades were very positive. For example, “I really enjoyed this class and thought everything was really important. This class was not what I expected, it was much better. I was really challenged by the material. I enjoyed this class a lot.” It is possible to see examples of high school student model diagrams, technical papers and videos.17 One example is shown in Figure 10.
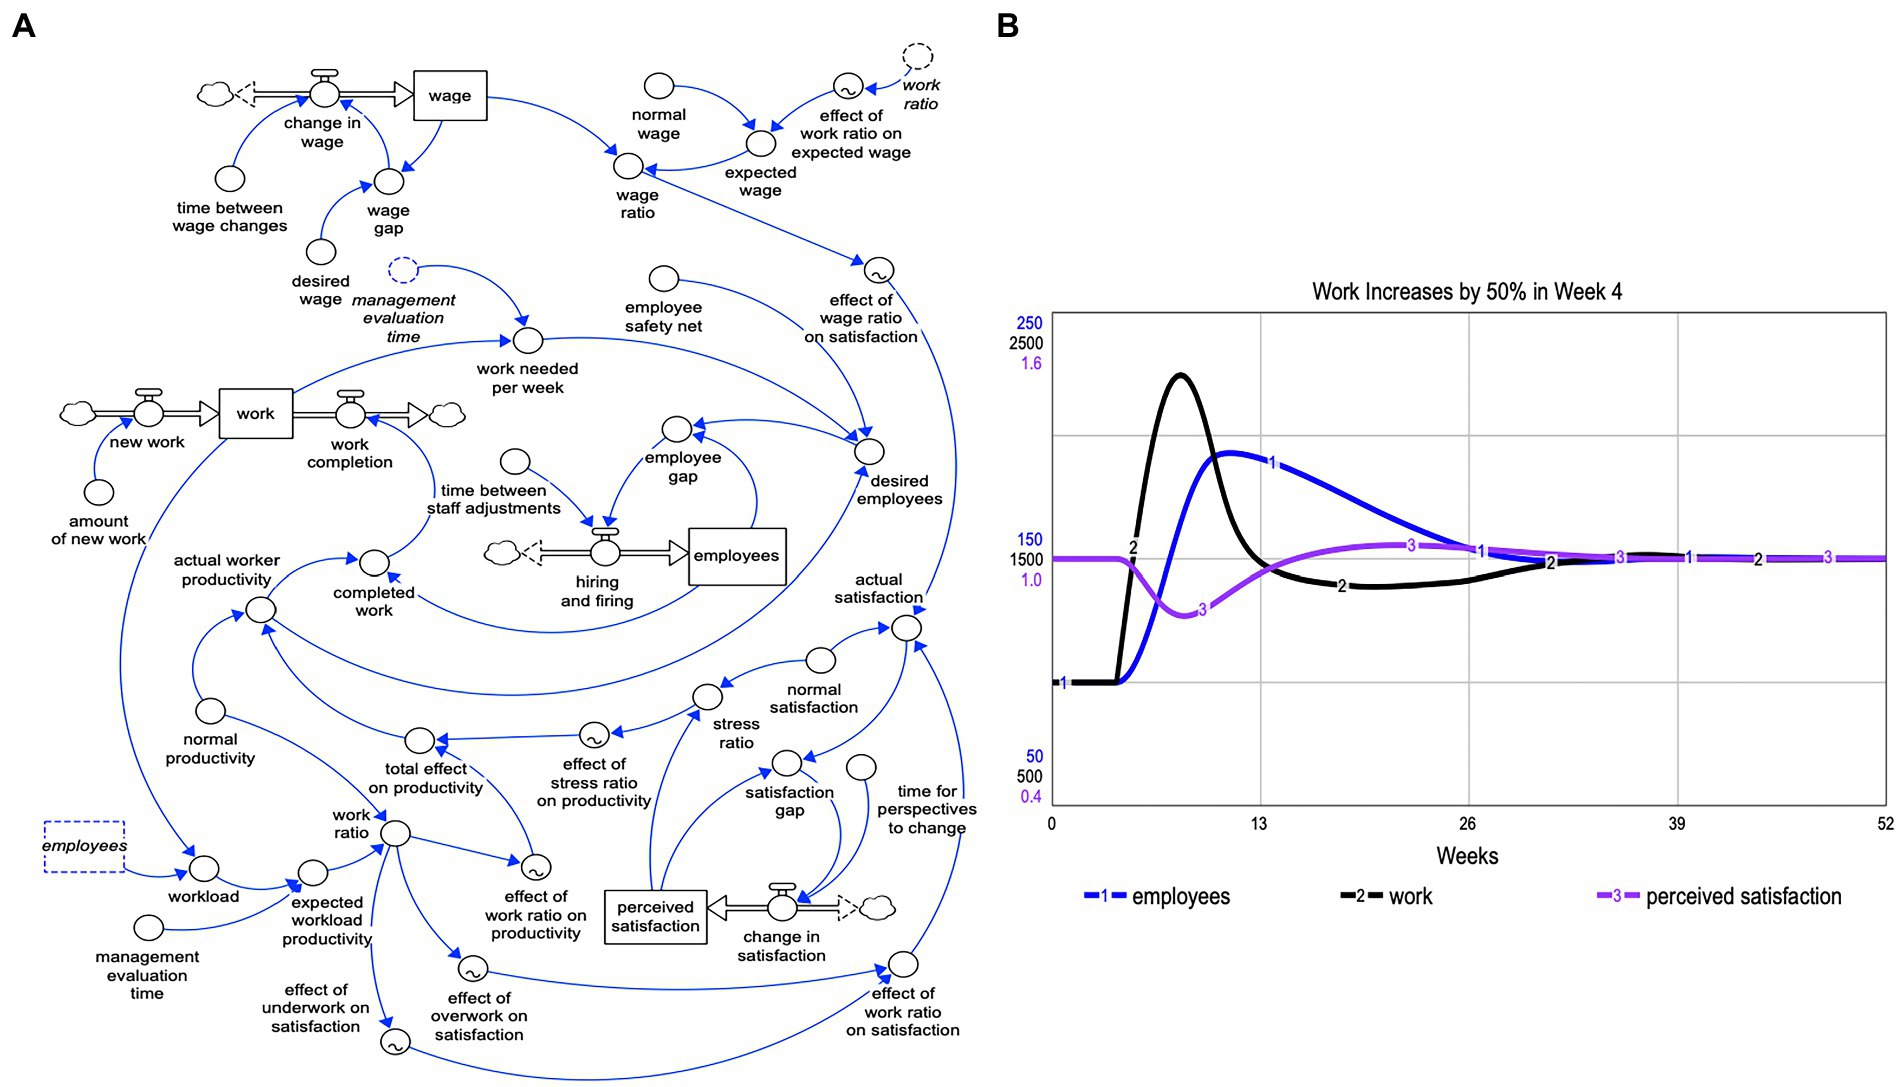
Figure 10. 12th grade student-created original model of workforce pressure (A) and model behavior when work is increased by 50% in the 4th week of the simulation (B).
In order to recognize the students’ original models and give parents and friends an opportunity to see what high school students could achieve, yearly ST/SD student exhibitions were/are held in Portland, Oregon (SymFest), and Worcester, Massachusetts (DynamiQueST). Attendees included university professors, parents, teachers, and other students. Students explained their ST/SD creations (causal loop diagrams and SD models) in a manner similar to a science fair.
3.3.9. Administration
School administrators have used ST/SD to analyze student attendance, personnel needs, budget dynamics, and leadership strategies. One big topic for administrative use of ST/SD was to try to modify the school environment so it was focused on supporting students and their experience in school and not focused on teachers, that is, administrators wanted to create a learning environment that was sensitive to the culture students came from. Some administrators used stock-flow maps for this discussion with teachers, parents, and other administrators.
4. Discussion
Feedback analysis is not a new instructional strategy. Teaching from a feedback perspective has been incorporated into some K-12 classes for a long time, especially in social studies and literature courses. The study of the causes of revolutions, discussing factors leading to increased poverty rates, brainstorming strategies to convince people in a democratic country that raising taxes to provide more social services could be good for the economy all require holistic thinking which was usually taught by lecture and/or discussion. Recognizing the influence of cultural norms on the development of topics for a novel or development of a plot highlight causal factors and feedback underpinnings that are part of a writers toolbox.
The difference now is that we have another powerful window through which to analyze these (and many more) dynamic topics. We can now surface the collective mental model of a class studying the causes of a revolution by having students develop a stock-flow diagram of the concepts they feel were essential in the movement toward revolution. The entire discussion can become more concrete (Potash, 1994; Barrientos, 2007). If desired, the stock-flow diagram could be quantified and the model tested to see which revolutionary elements exerted the most influence. Even if the quantification is not used to produce model graphs that result in historical accuracy they could be used to focus the discussion on relevant information that students could bring forth from their classroom readings, as was the case with Tim Joy’s students when they constructed their stock-flow model for Lord of the Flies (Joy, 1996). With a free, web-based stock-flow modeling software we can now bring a more structured representation of mental models to conversations in the classroom that have been without such tools in the past.
Moreover, incorporating the ST tools mentioned in this paper, starting as early as Kindergarten, can build a shift in student thinking that strengthens recognizing and analyzing dynamic, multidisciplined scenarios. This increased interaction with dynamic systems year after year can produce students who are comfortable analyzing what they see in the world around them (Lannon-Kim, 1991). They can see a dynamic pattern, graph it, create a stock-flow diagram to capture what they believe causes the dynamic, quantify their stock-flow diagram to test whether their mental model is accurate, and test policies on the stock-flow model to see how to change the behavior of the dynamic pattern. The ability to complete this analytical process is powerful in allowing students to modify their mental models, aligning them more closely with facts Forrester (2009, p. 14) says:
“A two-way street runs between mental models and computer models. Mental models contribute much of the input for computer models. Creating a computer model requires that the mental models be clarified, unified, and extended. From the computer simulations come new insights about behavior that give new meaning to mental models. Mental models will continue to be the basis for most decisions, but those mental models can be made more relevant and more useful by interacting with computer models.”
Not all teachers will want to have their students create computer simulations to study a dynamic problem. But just having students build (independently or as a team/class) a stock-flow diagram to help everyone visualize the structure of the problem can be extremely useful. Stock-flow diagrams are like plumbing diagrams that act as blueprints for the problem. They can help students make decisions about what variables are most important, that will be designated as stocks, whose value we want to (potentially) track over time. Then each stock with have one or more associated flows, variables that cause the stock to change value over time (even if we are not considering the values at this time). Then each flow is controlled by other elements, many of which are interconnected. Feedback loops can emerge, deepening the discussion.
On the other hand, it is our contention, that ALL high school students should build small stock-flow models as part of algebra, pre-calculus, and calculus classes and many students should build small models in environmental science, physiology, biology, and physics classes. We also strongly suggest that teachers who become comfortable with stock-flow modeling assist teachers in other disciplines: global studies, health, and economics build stock-flow simulations (for teachers in those disciplines who would be interested) to enhance the discussion of topics containing dynamic problems.
We have found an unintended consequence of using ST lessons with our students is they are much more capable of using the ST tools and applying the ST concepts over time than we expected. Students in the System Dynamics modeling courses produced models and papers that SymFest18 judges (university professors) rated more as undergraduate university work than high school work. Students regularly surpassed our expectations.
While there are more empirical studies on using systems thinking in pre-college education (Vattam et al., 2011; Lammi and Becker, 2013; Gero and Zach, 2014) within the past decade there are few (Verhoeff et al., 2018; Green et al., 2021) that address the value of stock-flow diagrams and simulation with pre-college students. Why? There are three reasons worth mentioning. The first is that traditional assessment questions/strategies are not appropriate for assessing stock-flow systems thinking. As Bar-Yam mentions in the introduction to this paper neither calculus nor statistics provide the tools we need to assess what we ST educators have found is the deeper learning that occurs when students actively participate in creating their understanding of dynamic behavior by building stock-flow diagrams and building SD models. The types of assessment questions to capture ST/SD learning must be different. And those questions do not currently exist. But a group of us are working to remedy this deficit. We currently have 235 ST questions that have been collected from various educators at multiple K-12 levels. We are in the process of aligning each question with one or more systems thinking concept in Stave and Hopper’s list and working on inter-rater reliability (Fisher and Göktepe, 2021). Then we will work to validate the questions. These questions will be made available for free to all educators and researchers who might find them useful.
Secondly, many of the pre-college educators who pioneered the use of the tools mentioned in the methods section of this paper were full-time teachers/educators who were also busy writing the curriculum needed to bring ST into their classes. At the time these early ST/SD infused lessons were happening (late 1980’s early 1990’s) ST/SD use in precollege classrooms was not on the radar of most researchers. So there was not much effort to try to do the research experiments necessary to collect and analyze the data. More research has occurred within the last decade (Verhoeff et al., 2018; Green et al., 2021). Green et al. conducted research to determine whether the use of systems thinking (without modeling) tools, System Dynamics simulation, or both would enhance students’ practical understanding of two sustainability issues. Understanding was assessed via a quiz on each topic at the end of a single 50-min online, unsupervised instructional session. The conclusion was that System Dynamics simulation, alone, showed a significant improvement in student understanding. Verhoeff et al. have done a literature review of more recent empirical studies on systems thinking and found that the definition of systems thinking is quite different in each study. The authors recommend that learners should focus on applying a ST concept when studying a complex system and should work to see the system holistically. They recommend a qualitative approach to student development of ST skills because SD (ST with the addition of teachers and students creating simulation models) takes a lot of effort for both students and teachers.
Finally, it took some time for computer technology to become widely available in K-12 schools (in the U.S.), for a free, web-based version of the preferred SD modeling software to be developed (Stella Online was created in 2017), for lessons to become available for teachers (see footnotes 7–10), and for some online ST/SD training to become available for teachers.19
This paper contains sample ST lessons that have been used from primary school through grade 12 for many years. Our experience demonstrates that there are ST tools that will work at each grade level. Although a continuum of ST concept development from kindergarten through grade 12 (see Table 1) is ideal, it is not required. A teacher could start at any grade level and use those ST tools that seem appropriate for particular dynamic problems studied in their curriculum. Teachers could build their ST skill along with the students. However, the most sustainable solution to infusing ST concepts in K-12 instruction would be to make ST analysis part of university teacher preparation courses. Such efforts are being made in Türkiye.
4.1. What is needed
We will never be able to convince the educational decision makers to elevate the importance of this ST/SD approach unless we can support our claims with statistical analysis of student learning. So we need researchers to team with those teachers who are using ST/SD tools in the classroom to perform the needed research studies to validate our experiences. To do that, researchers need to develop or have at their disposal assessment tools specifically designed to capture the deeper, systemic understanding that we have found blossoming in our students. There are assessment experts who specialize in this type of analysis (Cheng et al., 2010). They need to be part of these research teams.
Moreover, we need a systemic approach to transform our educational system to include the study of dynamic systems. We need:
• more educational materials and courses (especially online) for in-service teachers to take to become proficient with the core systems thinking concepts (and tools),
• teacher training programs to include systems thinking concepts as an integral part of teacher preparation. As part of that preparation we need to help teachers become more comfortable:
o including multidisciplinary concepts in their problem sets,
o working with students in learning environments where the teacher does not know all the answers but knows how to support students to find needed information for the stock-flow diagrams or SD models they might want to create,
• to include more systems thinking concepts in all appropriate educational learning standards,
• to educate parents,
• universities to place a high value on recruiting students who have systems thinking in their precollege education backgrounds.
5. Conclusion
Systems thinking and system dynamics modeling are powerful analytical approaches that aid professionals in managing systems in the world. The study of complex systems and dynamic behavior is too important to be omitted from precollege education. We have more than two decades of experience showing that precollege students, using the tools of systems thinking can learn to identify systems, identify and analyze those features that make systems complex, and describe, using feedback analysis, why a model produces the behavior it displays. Precollege students can determine policies and test them using computer simulations, some of which they can create.
Precollege students, as future informed citizens, should be able to analyze the systems around them. It is time to bring our precollege education system into the 21st century and provide all students access to understanding the dynamics of systems. It is our responsibility to give our students the power to construct their future – so they have hope.
Ethics statement
Ethical review and approval was not required for the study involving human participants in accordance with the local legislation and institutional requirements. Written informed consent to participate in this study was not required from the participants in accordance with the national legislation and the institutional requirements.
Author contributions
DF wrote all sections of the paper except the primary school and middle school instructional activities and Table 1 information. The primary school and middle school instructional activities and Table 1 information were written by the Systems Thinking Association of Türkiye.
Acknowledgments
The Systems Thinking Association of Turkey includes: Asuman A. Atay, Asuman Çataltepe, Ayşe Coşkun, Ayşe Yıldız, Burcu Çay, Burcu Güngör Cabbar, Burçak Temel, Duygu Bulunmaz, Ece Ünsal, Elif Demir Kanat, Elif Ünver, Emine Özgül, Emine Pekkarakaş, Emre Göktepe, Emsal Yalçın, Esma Belgrat, Ezgi Atmaca, Fatma Çınar, Fatma Yılmaz, Feride Ceylan Coza, Filiz Güler, Gaye Ceyhan, Gökşen Akyol Kızılkaya, Gönül Ölgen, Görkem Girgin, Gülnaz Çağlayan, Halil Gürkan, Hasret Macit, Hasret Nuhoğlu, Havva Tuğçe Saygılı, Hülya Sel, İpek Deveci Kocakoç, Kübra Güven, Melis Gözegir, Meltem Ceylan Alibeyoğlu, Memnune Pamuk, Münevver Özlem Angı, Necmi Akpınar, Nihal Güneş Demir, Nilay Yılmaz, Onur Bakıcı, Özgül Nayiş, Özgün Kurt, Özlem Orçun, Özler Doğan, Reyhan Özmen, Saadet Etli, Seda Yaralı, Seha Şahin, Sena Yıldız Değirmenci, Sevinç Yılmaz, Sevtap Karadayı, Şebnem Demir, Şebnem Feriver Gezer, Uğraş Demir, Ülkem Yararbaş, Ümmügülsüm Yardım, Yeşim Alam, Yeşim Temürçi, Yusuf Çağlayan, Zeynep Akçay Karasazoğlu, and Zeynep Işılay Başkahya.
Conflict of interest
The author declares that the research was conducted in the absence of any commercial or financial relationships that could be construed as a potential conflict of interest.
Publisher’s note
All claims expressed in this article are solely those of the authors and do not necessarily represent those of their affiliated organizations, or those of the publisher, the editors and the reviewers. Any product that may be evaluated in this article, or claim that may be made by its manufacturer, is not guaranteed or endorsed by the publisher.
Footnotes
1. ^The System Dynamics Society is an international, non-profit, group of professionals who want to feature System Dynamics in all parts of the education system, leading to public understanding of systemic problems and demand for better policy-making throughout society.
2. ^A mental model is the internal thought process we construct to describe how we think something works.
3. ^In the U.S. all high school students are required to complete second year algebra to be able to graduate.
4. ^Note: The ST tools that include the Ladder of Inference, Iceberg, Connection Circles, and Link Polarity do not have examples presented in this paper so are not explained here.
5. ^Development of tools: BOTGs, educators in the K-12 community; Ladder of Inference, Chris Argyris (organizational psychologist); Iceberg, Innovation Associates; Connection Circles, Rob Quaden and Alan Ticotsky; Link polarity, stock-flow maps, stock-flow simulation, Jay Forrester; feedback, historically part of social sciences as far back as 1800’s.
9. ^Stella Online is produced by isee systems, inc. and can be found at https://exchange.iseesystems.com/ Other SD modeling software packages are Vensim, Insight Maker, Splash Exchange, and Sage Modeler, but Stella is used by a significant majority of K-12 educators.
10. ^Examples from private primary schools in Ankara, Denizli, Istanbul, and Izmir, Türkiye.
11. ^A note about connecting the marked points: It is mathematically incorrect to connect the dots with a smooth curve. A smooth curve means answers (attendance values) are accurate at any part of the curve, and that is not the case since attendance can only hold whole number of students (it is not a continuous variable). A solution would be to connect the dots with a dashed curve used to suggest a pattern of behavior of the dots but this was avoided taking into consideration the immature motor skills of the students (but teachers should be aware of this situation).
12. ^Examples from private middle schools in Denizli, Istanbul, and Izmir, Türkiye.
13. ^https://c-roads.climateinteractive.org/scenario.html?v=22.5.0
14. ^Examples from public and private high schools in Oregon, Arizona, Ohio, and Massachusetts, United States.
15. ^https://sites.google.com/site/biologydarkow/
16. ^http://www.clexchange.org/nowwhat/
17. ^https://ccmodelingsystems.com/portfolio-type/student-projects/
18. ^The celebration of student SD modeling work (similar to a science fair).
19. ^https://ccmodelingsystems.com/online-courses/ (2014); https://www.egitimdesistemdusuncesix.org/ (2016, in Turkish until summer 2023); https://waterscenterst.org/what-we-offer?tab=self-guided-learning (2010).
References
Arnold, R. D., and Wade, J. P. (2015). A definition of systems thinking: a systems approach. Proc. Comput. Sci. 44, 669–678. doi: 10.1016/j.procs.2015.03.050
Barrientos, M. M. C. (2007). Evaluating System Dynamics as a Tool for Teaching History. Master’s thesis. Bergen: The University of Bergen).
Bar-Yam, Yaneer. (2015). “Complex systems science: where does it come from and where is it going to?” Conference on Complex Systems. Tempe, AZ.
Cheng, B. H., Ructtinger, L., Fujii, R., and Mislevy, R. (2010). Assessing Systems Thinking and Complexity in Science (Large-Scale Assessment Technical Report 7). Menlo Park, CA: SRI International.
Fisher, D. M., and Göktepe, E. (2021). Creating assessment questions for systems thinking concepts. Proceedings from the International System Dynamics Conference. Chicago, IL.
Forrester, J. (2009). Learning through system dynamics as preparation for the 21st century. Paper presented at the K-12 Systems Thinking and Dynamic Modeling Conference, Wellesley, MA.
Gero, A., and Zach, E. (2014). High school programme in electro-optics: a case study on interdisciplinary learning and systems thinking. Int. J. Eng. Educ. 30, 1190–1199.
Green, C., Molloy, O., and Duggan, J. (2021). An empirical study of the impact of systems thinking and simulation on sustainability education. Sustainability 14:394. doi: 10.3390/su14010394
Integrate (2022). Teach systems thinking. Science education resource center. Available at: https://serc.carleton.edu/integrate/teaching_materials/systems.html#:~:text=Systemthinkingisanimportant,fromasystemsDbasedapproach (Accessed October 20, 2022).
Jakobsson, E., Working Group 1 (1999). “Complex systems: Why and What” in Planning Document for a National Initiative on Complex Systems in K-16 Education (New England Complex Systems Institute).
Joy, T. (1996). Crime and astonishment. Paper Presented at the International System Dynamics Conference, Cambridge, MA.
Joy, T. (2008). Cultural SD. Email response toSy0xMlNEQHN5c2RuLmNsZXhjaGFuZ2Uub3Jnquestion about how to get across the lessons of SD without extensive modeling training.
National Council for the Social Studies (2014). The College, Career, and Civic Life (C3) Framework for Social Studies State Standards: Guidance for Enhancing the Rigor of K-12 Civics, Economics, Geography, and History. Silver Spring, MD: National Council for the Social Studies.
National Research Council (2012) Education for Life and Work: Developing Transferable Knowledge and Skills in the 21st Century. Washington, DC: The National Academies Press.
NGSS Lead States (2013). Next Generation Science Standards: For States, By States. Washington, DC: The National Academies Press.
Potash, J. P. (1994). Systems thinking, dynamic modeling, and teaching history in the classroom. Hist. Methods 27, 25–39. doi: 10.1080/01615440.1994.10594221
Richmond, B. (2010). “The thinking in systems thinking – eight critical skills” in Tracing Connections: Voices of Systems Thinkers. eds. J. Richmond, L. Stuntz, K. Richmond, and J. Egner (Lebanon, NH: ISEE systems).
SERC (2021). Why teach with an interdisciplinary approach? Science Education Resource Center. Available at: https://serc.carleton.edu/econ/interdisciplinary/why.html
Stave, K. A., and Hopper, M. (2007). What constitutes systems thinking? A proposed taxonomy. Paper presented at the 25th International System Dynamics Conference, Boston, MA.
Sterman, J. D. (2000). Business Dynamics: Systems Thinking and Modeling for a Complex World. Irwin McGraw-Hill, Boston, MA.
U.S. Partnership for Education for Sustainable Development (2009). National education for sustainability K-12 students learning standards, Version 3. Available at: http://s3.amazonaws.com/usp_site_uploads/resources/152/USP_EFS_standards_V3_11_10.pdf
Vattam, S. S., Goel, A. K., Rugaber, S., Hmelo-Silver, C. E., Jordan, R., Gray, S., et al. (2011). Understanding complex natural systems by articulating structure-behavior-function models. J. Educ. Technol. Soc. 14, 66–81.
Verhoeff, R. P., Knippels, M. C. P., Gilissen, M. G., and Boersma, K. T. (2018). The theoretical nature of systems thinking. Perspectives on systems thinking in biology education. Front. Educ. 3:40. doi: 10.3389/feduc.2018.00040
Waters Center for Systems Thinking (2000). Waters Center for Systems Thinking. Available at: https://waterscenterst.org/ (Accessed October 20, 2022).
Keywords: systems thinking, precollege, system dynamics modeling, deeper learning, critical thinking, real-world applications, student-centered, multidisciplinary
Citation: Fisher DM and the Systems Thinking Association (2023) Systems thinking activities used in K-12 for up to two decades. Front. Educ. 8:1059733. doi: 10.3389/feduc.2023.1059733
Edited by:
Margaret Sauceda Curwen, Chapman University, United StatesReviewed by:
Phil Taylor, University of Nottingham, United KingdomPinaki Chakraborty, Netaji Subhas University of Technology, India
Copyright © 2023 Fisher and the Systems Thinking Association. This is an open-access article distributed under the terms of the Creative Commons Attribution License (CC BY). The use, distribution or reproduction in other forums is permitted, provided the original author(s) and the copyright owner(s) are credited and that the original publication in this journal is cited, in accordance with accepted academic practice. No use, distribution or reproduction is permitted which does not comply with these terms.
*Correspondence: Diana M. Fisher, ✉ ZmlzaGVyZEBwZHguZWR1