Abstract
Ecuador is a unique case study, where strict evaluation and accreditation processes have been recently established (i.e., early-2010s) mainly based on the experience of their peers and that of developed countries. Interestingly, the development of quality assurance indicators for research output received special attention. The current study systematically explored the research output of the Ecuadorian higher education institutions (HEIs) after only one decade of being subjected to multiple rigorous evaluation and accreditation processes. Peer-reviewed documents in the Scopus Database from 2006 to 2021 were statistically analyzed in terms of the number of documents produced (i.e., books, book chapters, journals, and conference proceedings), citations, H-index, quartiles, and impact factors (i.e., SRJ, SNIP, and Cite Score), at both country and single-university levels. The influence of the multiple evaluation processes and external factors (e.g., relaxation of regulations, COVID) on the research output trends were comprehensively and chronologically discussed. Accordingly, a statistical answer to the following research questions was attempted: where is the Ecuadorian research output currently standing after these evaluation and accreditation measures? Furthermore, where is it heading? This investigation would assist in creating and adjusting policies targeting sustainable research in HEIs in Ecuador and other countries in similar early research development.
Introduction
Throughout their early stages of development (11–12th century), European universities were institutions primarily dedicated to cultivating and transmitting knowledge (De Ridder-Symoens and Rüegg, 2003). The leading contributions to science were mainly performed by natural philosophers (Gingerich, 1993). The concept of research-oriented universities was recently established in the Prussian region in the 19th century, where knowledge generation (i.e., scholarly research) was required in addition to its dissemination. The success of this model quickly spread to Europe and the rest of the world (Atkinson and Blanpied, 2008). Interestingly, the regulation of universities by the governments is also a recent contemporary endeavor. For instance, after more than 300 years of independence from federal regulations (i.e., counting from the founding of Harvard College in 1,636), universities and colleges in the United States of America underwent a rigorous regulation process in the late 1940s (Dunham, 2009).
Higher education institutions (i.e., HEIs: universities, and colleges) are among the most rigorously and strictly regulated bodies worldwide (Hartle, 1998). Depending on the country, universities would be regulated by state/local governments (i.e., decentralization) or central government authority (e.g., components of national systems regulated by a national ministry of education) (Atkinson and Blanpied, 2008; Jones, 2014). In fact, numerous higher education institutions worldwide were created and organized by the law and even transformed by political incentives (i.e., a top-down approach; Saarinen and Ala-Vähälä, 2008; Bernasconi and Celis, 2017). Thus, they are subjected to applicable, statutory, and common law (Dunham, 2009). Almost every component of higher education administration (e.g., transparency in registration processes, curriculum/course credits, student financial aid, financial support for teaching, improvements of infrastructure, the confidentiality of records, crime reporting, graduation rates, etc.) is strictly monitored and regulated (Langhauser, 2002; Fielden and LaRocque, 2008). Remarkably, research is no exception.
In the 21st century, HEIs and governments in developing countries are still facing drawbacks in policy reforms and regulations intended to bring their systems more in line with the good practices of their counterparts in developed nations (Saint et al., 2003; Agarwal, 2006; Kapur and Crowley, 2008). Accreditation and regulation processes have been recently adopted in developing countries for research quality assurance and regional/international recognition of their programs and systems, where international bodies and national governments have played a key role (Fielden and LaRocque, 2008). However, there is also high heterogeneity in the structure and scale of accreditation and regulation processes, thus, leading to varying levels of enforcement. For instance, in some developing nations, all higher education providers (i.e., colleges, universities, and institutes) and their respective administrative processes are covered by national agencies. In contrast, only universities, private providers, faculty (e.g., academic credentials), or even specific professions are regulated in other countries (Middlehurst and Campbell, 2004; Sidhu, 2006). Briefly, by 2006, several countries in the middle east and north African regions (i.e., Morocco, Saudi Arabia, Algeria, Egypt, the UAE, Lebanon, Oman, and Yemen) followed Jordan in its pioneering initiative to create a national accreditation body for higher HEIs (Lezberg, 2003). In Latin America, the Brazilian government required Universities in 1996 to employ full-time at least one-third of their faculty holding advanced degrees as part of their quality assurance program (Sidhu, 2006). Other developing countries have applied strict enforcement for their accreditation and regulation processes. For instance, in 1998, the Ministry of Education in El Salvador closed 11 universities that did not meet the standards of the accreditation system established in 1995 (Harrington, 2001). Similarly, during the 90s and early 2000s, several HEIs were closed in Chile due to non-compliance with the minimum required standards required by the accreditation agency (Espinoza and González, 2013). Those strict measures targeted the proliferation of universities with low educational standards during the 90s. There have been considerable efforts in the late 90s and early 2000s to normalize good educational practices in the HEIs through accreditation and regulation in developing countries. Interestingly, Ecuador is a unique case study where these processes have been recently adopted (i.e., in the 2010s) based on the experience of their peers and that of developed countries (Bernasconi and Celis, 2017). Notably, the development of quality assurance indicators for research output received special attention from the Ecuadorian government.
A critical indicator of current accreditation university models is the publication of academic papers in high-impact journals (Cossani et al., 2022). Academic publications are considered an objective indicator, for instance, to evaluate the quality of an HEIs output, for the recruitment of academics, access to research funds, and even to achieve a doctorate degree (Millones-Gómez et al., 2021). Although in Latin-American are criticisms concerning pushing publication and classifying academic work in global rankings (Gonzales and Núñez, 2014; Johnson, 2017), Ecuador has joined the perspective of valuing the scientific contribution according to whether it is published or high-impact journals. Accreditation is also a critical factor, although it is external to the universities, which helps regulate the scientific production efforts of the HEIs. However, no studies have analyzed the scientific production that may be associated with the accreditation of Ecuadorian universities. The current study aimed to analyze the impact of the multiple accreditation and evaluation processes conducted since 2009 (i.e., the first interventive evaluation of HEIs in Ecuadorian history) on the research output of Ecuadorian HEIs. Peer-reviewed documents in the Scopus Database from 2006 to 2021 were statistically analyzed in terms of the number of documents produced (i.e., books, book chapters, journals, and conference proceedings), citations, H-index, quartiles, and impact factors (i.e., SRJ, SNIP, and CiteScore), at both country and single university levels. Results from this investigation would assist in creating and adjusting policies targeting sustainable research in HEIs in Ecuador and other countries in similar early research development. Finally, a detailed statistical review of the current Ecuadorian research output and future perspectives are presented.
Development of accreditation processes and quality assurance indicators for research output in Ecuador
Based on the multicriteria decision method (MDM) applied during the Ecuadorian evaluation models (CACES, 2019), the historical weight of research standards was as follows (Table 1).
TABLE 1
| Evaluation process | Year | Research standards weight (%) | Remarks |
| CONEA | 2009 | 15 | Generation of constitutional mandate 14 |
| CEAACES | 2012 | 15 | Closure of 14 universities in category E |
| CEAACES | 2013 | 20 | Categorization of HEIs |
| CEAACES | 2015 | 21 | Re-categorization of HEIs |
| CACES (formerly CEAACES) | 2019 | n.a. | Accreditation of HEIs |
The historical weight (%) of research on the evaluation models.
n.a, not applicable.
On the first historical interventive evaluation of HEIs: the 2009 CONEA report
By 2008, a new constitution was enacted in Ecuador. Also, by this year, 72 universities were operating in Ecuador. While 25 universities were founded between 1,826 and 1,989, 47 were established between 1990 and 2006, and 34 of the latter were private institutions (Tafur Avilés, 2016). In 2009, the Ecuadorian National Council for the Evaluation and Accreditation of High Education (CONEA) submitted the Institutional Performance Evaluation of Ecuadorian Universities and Polytechnic Schools report to the National Assembly, commonly known as Constitutional Mandate 14 (Table 1; CONEA, 2009). This report included a comprehensive summary of the status of Ecuadorian universities (i.e., including statistical analysis) in the following sections: (1) academia, (2) students and learning environment, (3) research, (4) management, and (5) graduate schools. It became the Ecuadorian government’s first historical interventive evaluation of higher education institutions. This report classified the Ecuadorian universities into five categories (A, B, C, D, and E) as a function of their performance under specific evaluation indicators and recommended further screening of the universities in category E.
The 2012 CEAACES evaluation process and the closure of 14 universities
In 2010, the last higher education organic law (LOES) was approved. As a result, The National Secretariat for Higher Education, Science, Technology, and Innovation (SENESCYT), The Higher Education Council (CES), and The Council for Evaluation, Accreditation, and Quality Assurance of Higher Education (CEAACES) were created. The CEAACES (i.e., created in 2011) developed an evaluation model based on the: (a) learning environment and (b) learning results. The former parameter included four criteria: academia, research and curriculum, pedagogic support, and management and institutional policy, while the former parameter comprised an evaluation exam for end-of-high school students. As a result of this evaluation model and the preliminary recommendation of the CONEA report, 14 universities in category E were permanently closed in 2012 (Table 1).
2013: evaluation model for face-to-face and semi-face-to-face careers of universities and polytechnic schools in Ecuador
This model was designed for internal (self-evaluation) and external (CEACEES) evaluation. The criteria selected for this evaluation model were: pertinence, curricular plan, institutional environment, students, and academia. The latter included academic production (C3) as the research sub-criterium (CEAAEES, 2013). The academic production comprises the generation of scientific articles in journals indexed in regional and international databases and books by professors. This production must be linked to the classes taught by professors and their faculty.
Indicator C.3.1: scientific production (quantitative standard)
Comprised articles or scientific works of professors from the evaluated faculty and published in Scimago, Scopus, or ISI WOS databases. Publications dated 3 years before the evaluation will be considered, and the affiliation must be included in the published work. The absolute weight of this indicator on the process was 9%.
The indicator was calculated by the SJR index of the journal where each article was published.
Indicator C.3.2: regional research (quantitative standard)
It comprised the number of the professors’ articles of the evaluated faculty, which were presented at academic events or published in technical or scientific journals 3 years before the evaluation. Works published in the Latindex database or presented at national/international conferences will be considered. The absolute weight of this indicator on the process was 2%.
The indicator was calculated as the weighted average of these two types of research articles.
IR: Regional research.
NAPL: Number of articles published in the Latindex database.
NAE: Number of articles comprising scientific structure presented in national/international conferences.
NPP: Average number of Professors in the University per year, during the 3 years before the year of the evaluation process.
Indicator C.3.3: peer-reviewed books
It included the publication of peer-reviewed books published by the professors of the specific faculty during the 3 years before the evaluation. The ISBN of this type of publication must be reported. Manuals, course notes, compilations, or books not following a peer-reviewed process will not be considered. The absolute weight of this indicator on the process was 6%.
LP: Peer-reviewed books.
NPB: Number of peer-reviewed books published by professors during the 3 years before evaluation.
NPP: Average number of professors during the 3 years before evaluation.
The threshold tables showing detailed data on the performance of Ecuadorian Universities on these three indicators can be found elsewhere (CEAAEES, 2013).
2015: the institutional evaluation model of universities and polytechnic schools
This model was based on six evaluation criteria: organization, academia, links with society, resources and infrastructure, students, and research. The indicators for research were qualitative or quantitative (i.e., formulated based on a mathematical expression). The standards had five levels: satisfactory, moderately satisfactory, and deficient. The research criterium was evaluated under two sub-criteria: institutionalization (indicators 1.4.1.1 and 1.4.1.2) and results (indicators 1.4.2.1, 1.4.2.2, 1.4.2.3), as follows (CEAACES, 2015).
Indicator 1.4.1.1: research planning (qualitative standard)
The HEI has a research plan linked to institutional strategic planning.
Indicator 1.4.1.2: resource management for research (qualitative standard)
The institution has clear policies, regulations, and procedures for resource management and research financing, which are applied and are also widely known by its researchers.
Indicator 1.4.2.1: scientific production (quantitative standard)
The professors publish in indexed journals in such a way that the value obtained in the indicator is at least 1. This minimum meant that a full-time professor had published one article in 3 years in journals with SJR = 0.
Where:
IPC: Scientific production.
SJRi: SJR index of the journal where the article has been published.
NSJR: Number of articles published in journals indexed in ISI WOS or Scimago database.
NTD: Total number of professors and researchers in the HEI.
Indicator 1.4.2.2: regional production (quantitative standard)
The HEI should have produced a minimum average of six articles for every professor during the last 3 years.
Where:
IR: Regional research.
NAR: Number of articles published in journals indexed in regional databases.
NTD: Total number of professors and researchers in the HEI.
Indicator 1.4.2.3: peer-reviewed books and book chapters (quantitative standard)
The institution should have produced an average of 0.5 books per professor during the last 3 years.
where:
LCL: Peer-reviewed books and book chapters.
NLP: Number of books published by professors and researchers of the HEI.
NCLP: Number of book chapters published by professors and researchers of the HEI.
NTD: Total number of professors and researchers in the HEI.
2019: the external evaluation model of universities and polytechnic schools
The Higher Education Quality Assurance Council (CACES), formerly CEAACES, developed this evaluation model through a participative workshop comprising 600 members of Ecuadorian Universities and Polytechnic Schools between October 2018 and April 2019. This model was based on three pillars: teaching, links with society, and research. For the research pillar, the standards target the planning and execution of academic and scientific production, and the results are reflected in the publication of books, articles in indexed journals, and other relevant works of relevance (CACES, 2019). Remarkably, the accreditation of universities was the aim of this evaluation process and not their categorization. As a result, there was no weight (%) on the standards since they were all considered fundamental for the process (Table 1). Compliance with the standards covered the following five levels: satisfactory compliance, approximate compliance, partial compliance, insufficient compliance, and non-compliance. A total of four qualitative or quantitative standards were included in this process, as follows:
Standard 8: Planning of research processes (qualitative standard). The HEI has approved and ongoing procedures for research development and the selection, allocation of resources, monitoring, evaluation, and publication of programs/projects results of scientific, technological research, or artistic creation, always seeking the participation of the student body.
Standard 9: Execution of research processes (qualitative standard). The HEI selects research programs or projects of scientific, technological, or artistic creation through arbitration procedures preferably framed in the research lines of academic domains, executes, and monitors the resources obtained from internal and external funds, recognizing the achievements of the teaching staff and student body, under the regulations of the higher education system, within the framework of ethical principles.
Standard 10: Academic and Scientific production (quantitative standard). The HEI produces results of scientific research, technological or artistic creation, internally and externally peer-reviewed, meeting basic requirements for publication, exhibition, or registration, and are linked to their lines of research or projects of artistic creation.
Where:
LCL: Peer-reviewed books and book chapters.
L: Total number of books published between 2017 and 2018.
CL: Total number of book chapters published between 2017 and 2018.
TP: Total number of Professors during the evaluation period.
Standard 11: Publication of articles in indexed journals (quantitative standard). The professors in the HEI publish articles in journals indexed in databases.
Where:
TPPA: rate of article publication per capita.
TA: Total number of articles published in indexed databases during 2017–2018.
TP: Total number of Professors during the evaluation period.
TAQ1: Total number of articles published in Scopus/WOS Q1 during 2017–2018.
TAQ2: Total number of articles published in Scopus/WOS Q2 during 2017–2018.
TAQ3: Total number of articles published in Scopus/WOS Q3 during 2017–2018.
TAQ4: Total number of articles published in Scopus/WOS Q4 during 2017–2018.
TAPP: Total number of articles originating from research projects during 2017–2018.
i: Impact Factor of journals according to their quartile on Scopus/WOS.
p: Profect Factor based on articles generated in research projects funded by national/international bodies.
General trends in the research indicators
The research and publication were critical parameters considered during all Ecuadorian government’s higher education evaluations (Table 1). The complexity of calculating the quantitative standards (i.e., formulas) increased with time, indicating the growing learning curve and experience of the CACES (formerly CEAACES). Remarkably, there was a clear distinction between the production of books, book chapters, articles published in conferences (conference proceedings, as considered in the 2013 process) or regional databases (Latindex), and articles published in Scopus/WOS. However, the latter indicator received special attention from the CACES (formerly CEAACES). Although the SJR index was considered for the 2013 and 2015 processes while the quartile was considered for the 2019 process, both approaches and their weight in the indicators denoted their importance in the evaluation processes as quality assurance indicators. Consequently, the current study focused on the output research in the Scopus database. In addition to the SJR index and quartiles, the SNIP and CiteScore indexes, citations, and the number of documents were also considered to portray a broader picture of research development in Ecuadorian academia.
Materials and methods
Database of peer-reviewed literature
Scopus was selected as the database of peer-reviewed literature. The date for raw data extraction (i.e., CSV format) was January the 28th, 2022. The parameters selected for raw data extraction were documents (i.e., books, book chapters, scientific journals, and conference proceedings), citations, H-index, quartiles, and impact factors (i.e., SRJ, SNIP, and CiteScore). This export process was performed from 2006 to the data extraction date (01/28/2022), resulting in 16 years. Only Ecuadorian universities having research output were selected for the current study, regardless of the type of documents and field of knowledge. Therefore, these parameters were extracted for every University and every year considered in the selected time frame.
Data reduction and statistics
The analysis of the data was performed at both country and single-university levels. Briefly, at the country level, the analysis of the number of documents and citations per year in the selected time frame was performed through linear and non-linear fittings (i.e., exponential growth, allometric functions). Statistical parameters (i.e., linear slope, time constant-t, residual sum of squares, Pearson’s r, coefficient of determination-COD, reduced Chi-square, and adjusted R-square) were extracted and comprehensively analyzed to assess the growing trends in the research output, as well as the influence of external factors. Due to the high heterogeneity of the data, the total number of documents, citations, H-index, quartiles, and impact factors (i.e., as recorded on 01/28/2022) were also investigated by box plots, where the mean, 25–75th percentiles, median, mean, 1.5 interquartile range-IQR, and outliers were extracted and assisted in the analysis of data dispersion. Likewise, box plot analyses were also used at the single-university level due to high data heterogeneity. In addition, the data visualization was performed through grouped bar charts and stacked bar charts ordered by the magnitude of the selected parameter. As a result, the order of the universities listed in these grouped/stack bar charts was highly varied. Finally, multivariate data analysis was performed through Principal Component Analysis (PCA) and K-means cluster analysis. Based on the large number of interrelated variables extracted from Scopus for every University for 15 years, PCA was used for dimensionality reduction (i.e., to obtain considerably lower-dimensional data) while preserving the variance of the projected data. Therefore, the eigenvectors and principal components were extracted. Likewise, K-means cluster analysis was used to partition the extracted data into K clusters of similar observations. The characteristics and center of each cluster were extracted to find trends in the research output of Ecuadorian academics.
Results
Statistical evolution of the research output of assay Ecuadorian universities
Ecuador currently has 62 universities duly registered and authorized by the CES (i.e., 34 public and 28 private universities) (CES, 2022). However, only 44 universities showed research output in the Scopus database, where 26 of those were public while the other 18 were private. The absence of 18 universities in the Scopus database (i.e., 8 public and 10 private universities) represents ∼29% of the total number of Ecuadorian universities.
The production of documents (i.e., books, book chapters, scientific journals, and conference proceedings) of the 45 universities showing literature in the Scopus database linearly increased from 2006 to 2012 at a rate (m: slope) of 43.8 documents per year, i.e., 188 to 475 documents, respectively (Figure 1, Left). The evaluations of 2009 and 2012 (i.e., the latter resulting in the closure of 14 universities) occurred during this linear growth. Remarkably, from 2012 to 2018, the production of documents grew exponentially following a time constant (t) of 2.22, i.e., 475 to 5,137 documents, respectively. This exponential growth may be attributed to the impact of the closure of 14 universities (i.e., during the 2012 evaluation) and the increasingly rigorous 2013 and 2015 evaluations of the universities that remained open. Nevertheless, from 2018 to 2021, the document production rate decreased, following a pseudo-stationary phase. The change in the profiles of this curve (i.e., linear-exponential growth-pseudo stationary phase) may be to the influence of external factors on the production of documents in Ecuadorian universities. As mentioned in the previous section, the 2019 evaluation targeted the accreditation of universities rather than their categorization. That methodology may have somewhat relaxed the effort of publishing in Scopus. It may also explain why the exponential growth curve did not accurately fit the number of documents in 2018 (Figure 1, Left), thus, indicating the start of a pseudo-stationary phase. Interestingly, the decrease in the number of documents in 2021 might be attributed to a scenario that disrupted academic activities worldwide, the COVID pandemic. Recent analysis has concluded that universities and research centers with a more mature research culture (i.e., sustainable research production and practices) have been able to (productively) survive this stressful global scenario (Stanko et al., 2022). Furthermore, this decrease in the production of documents in 2021 would evidence the early stages of research development of the Ecuadorian academia and their fragility toward this pandemic event.
FIGURE 1
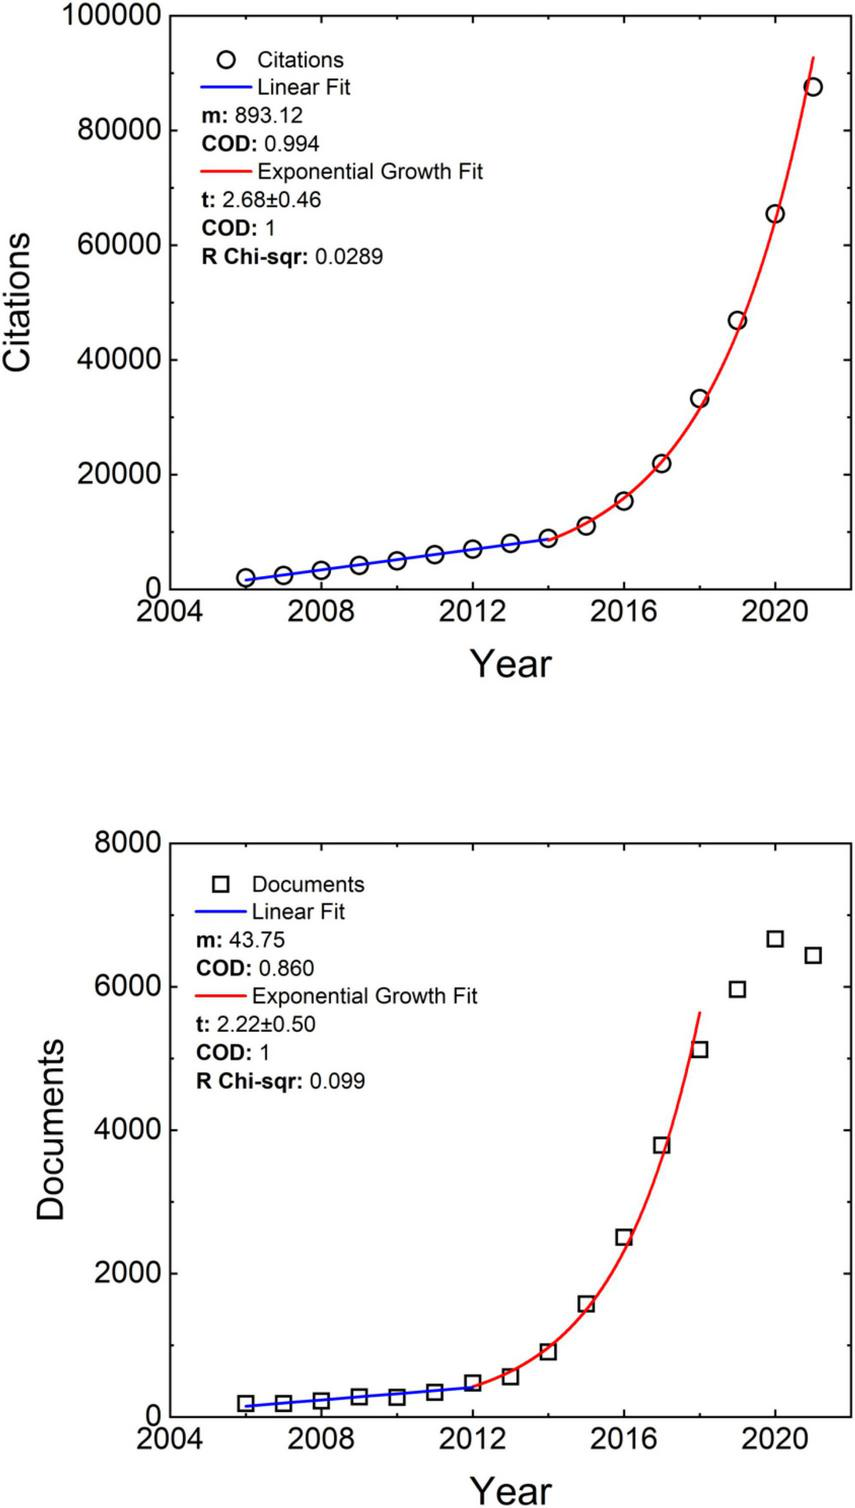
Number of documents published (Left) and citations recorded per year (Right) for all the Ecuadorian Universities.
To further confirm the above hypothesis, the production of documents by each University was compared over the years 2018 (i.e., the start of the stationary phase), 2019, 2020, and 2021. An increasing number of universities were found to decrease their number of publications per year. Specifically, 2, 9, 14, and 26 universities (i.e., out of the 44 universities analyzed) decreased their production of documents in the years 2018, 2019, 2020, and 2021, respectively, compared to the previous years. This clear trend indicates the fragility of the Ecuadorian academia toward research under the influence of external factors, e.g., relaxation of regulations or COVID. Interestingly, this decrease in research production was more evident in public than in private universities. Eighteen of the 26 universities that decreased production in 2021 (i.e., compared to 2020) were public. This result suggests the higher impact of high-stress external events (e.g., COVID) on the research output of Ecuadorian public universities.
The citations profile evolution also showed a linear regime from 2006 to 2014, following a rate of 893.1 citations per year, i.e., 1,987 to 8,889 citations, respectively (Figure 1, Right). Nevertheless, this profile grew exponentially from 2014 to 2021 at a time constant (t) of 2.68 (i.e., from 8,889 to 87,734 citations, respectively). No clear pseudo-stationary phase was observed. Interestingly, there was a shift of 2 years in the change of linear-exponential functions between documents and citation profiles, i.e., 2012 vs. 2014, respectively. This lag phenomenon has been documented (Wang, 2013). Specifically, previous bibliometric studies have observed that it takes months or years for a paper to be cited or even establish itself as a top paper, where a critical factor is the field of study. Likewise, the same hypothesis could explain the lack of a stationary phase in the citations profile, which would be potentially evidenced in the following couple of years. Remarkably, the exponential growth curve did not accurately fit the citations of 2021, suggesting the beginning of a pseudo-stationary phase. Similar to the above analysis, the number of citations by each University was compared over the years 2019 to 2021. Only one University in 2019, one in 2020, and two in 2021 decreased their citations compared to the previous years (i.e., corresponding to 2.2, 2.2, and 4.4% of the 45 universities analyzed). This decrease is considerably lower than that observed for documents produced. As mentioned above, a potential reduction of citations and a stationary phase may potentially be observed in the upcoming years.
Current accumulated production of documents and citations for each university
The quantitative indicators of 2013, 2015, and 2019 evaluations to produce articles in indexed journals and peer-reviewed books (2013.C.3.1, 2013.C.3.3, 2015.1.4.2.1, 2015.1.4.2.3, 2019.10, and 2019.11) considered the number of professors and researchers in the University as the formula denominator. It highly favored the production of documents. As a result, the total number of documents and citations per University as of January the 28th, 2022, ranged from 35 to 3,353 and from 57 to 64,817, respectively (Figure 2). High heterogeneity in the production of documents and citations was observed for both profiles. Although five private and five public universities were among the top 10 in documents production, only three private universities were in the top 10 in citations. This result is a macro indicator of the higher visibility and reception of the research output of public universities. A statistical analysis following averages and standard deviations could not be performed because of the high dispersion in the data. However, results from box plot analysis indicated a mean of 789 documents and 7,323 citations and a median of 480 documents and 2,833 citations (i.e., 25–75%: 194 to 1,075 documents and 672 to 7,585 citations, respectively). Few outliers (i.e., 3 and 5) were located above the 1.5 IQR range in both cases, indicating those universities with outstanding research output. The high dispersion in the observed data (Figure 2) has been previously documented in the research output of Latin American countries and even within the universities of these countries (Gomez-Rosselli and Rosselli, 2021). Compared to other developing countries in the Latin American region and even developing countries in Europe (Kozak et al., 2015), the research output of Ecuadorian universities is still poor. However, it must be considered that the actual pull for scientific and academic literary production in Ecuador could only be statistically tracked down to 2012 (i.e., corresponding to the second historic evaluation process) (Figure 1, Left), as opposed to other countries with a headstart of decades in terms of research production (Kozak et al., 2015; Gomez-Rosselli and Rosselli, 2021).
FIGURE 2
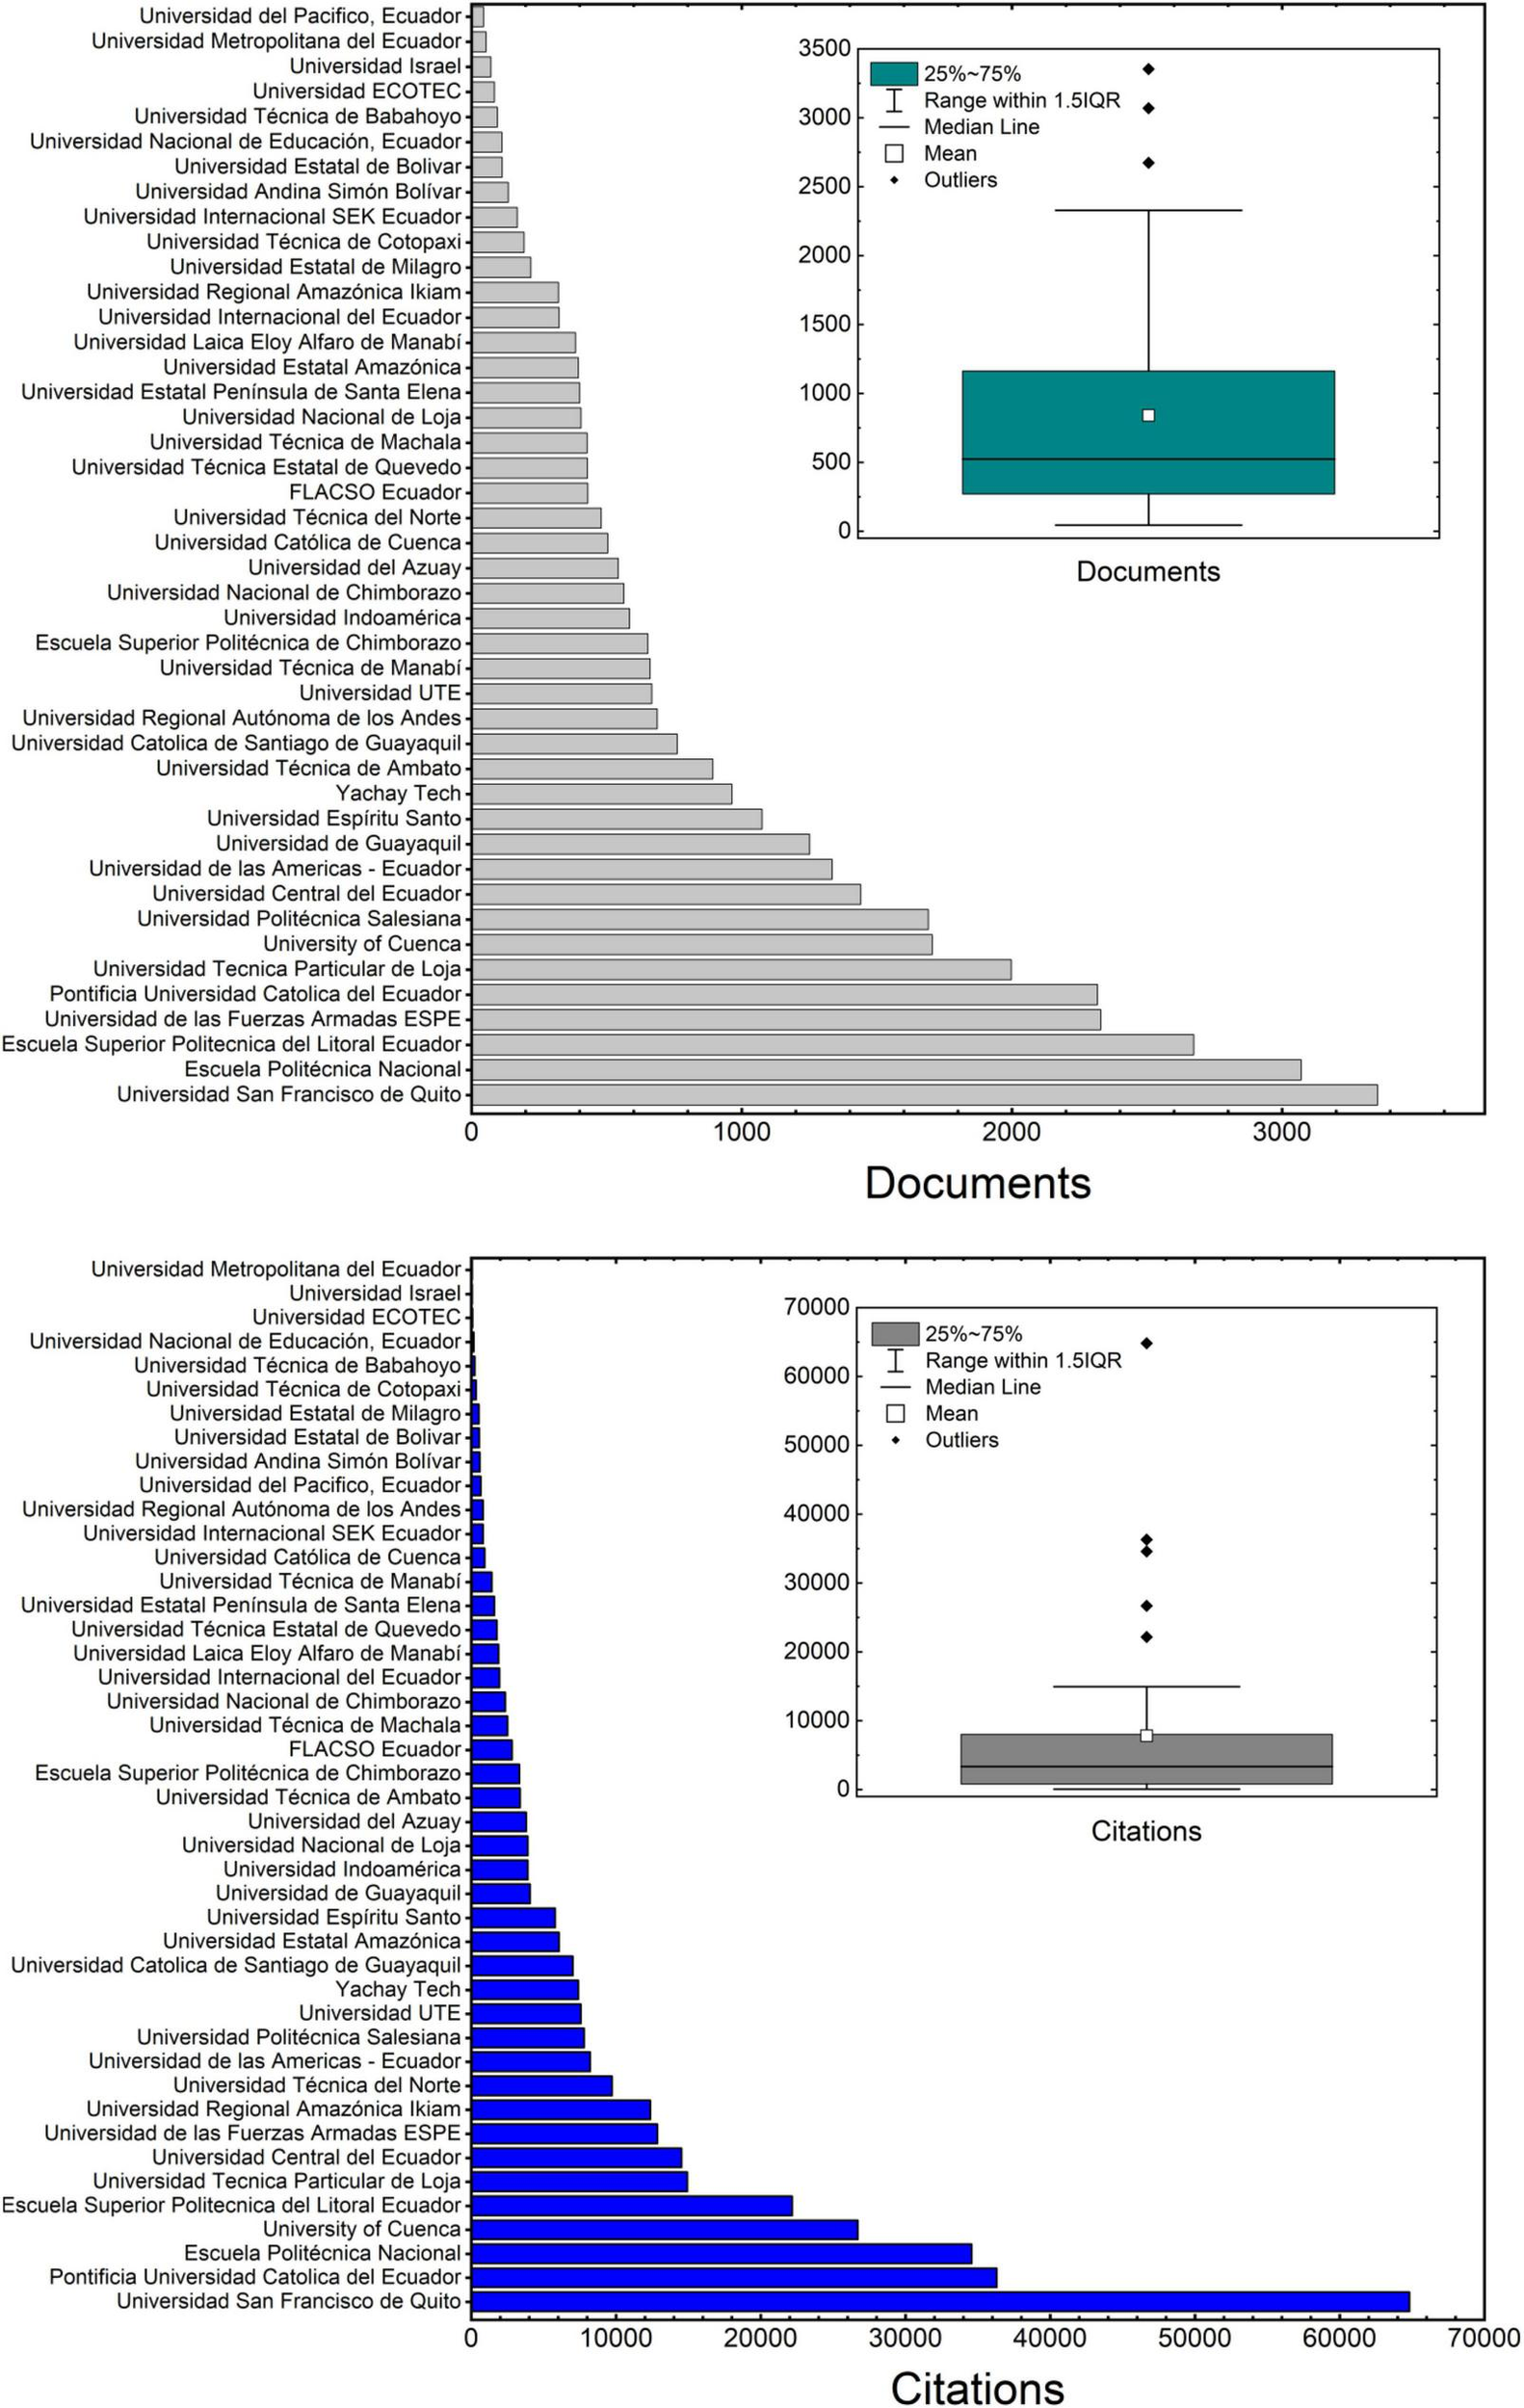
The total number of documents (Left) and citations (Right) per university and their statistical distribution as of 01/28/2022.
Impact factor, quartiles, and H-index as a measurement of research output quality
Documents with impact factor
Despite extensive and thorough analysis and the controversy surrounding the measurement of the quality of a document, the concept of journal impact factor (IF) is still widely used and highly regarded (Bordons et al., 2002). Correlations between the impact factor of journals and citations, number of papers, H-index, reads, or field of knowledge (i.e., visibility of a manuscript) have also been documented (Bordons et al., 2002; Lehmann et al., 2006). Modern academia, funding bodies, and rankings emphasize the impact factor of the literary production of scholars (Frey and Osterloh, 2011; Gruber, 2014). However, not all the documents in the Scopus database have an IF (e.g., certain conference proceedings, books, or book chapters).
The quantitative indicators 2013.C.3.1 and 2015.1.4.2.1 (both termed Scientific Production) were based on the SJR index (i.e., the higher the SJR, the higher the grade of the indicator). These two indicators exerted additional pressure on scholars and universities to publish in journals with this index. As a result, Ecuadorian universities have prioritized the generation of documents with an IF (Figure 3, Left). The statistical distribution showed the lowest data dispersion in the current investigation, as indicated by the proximity of the mean, median, and maximum (i.e., 75.7, 77.6, and 95.5%, respectively). Also, the 25 to 75% range corresponded to 71.6 to 85.4% of documents with IF, denoting the homogeneity of this parameter. Four private and six public universities were in the top ten in generating documents with an impact factor. Remarkably, only two universities in the top ten in document production (section 4.1) were also in the top ten in generating documents with an impact factor.
FIGURE 3
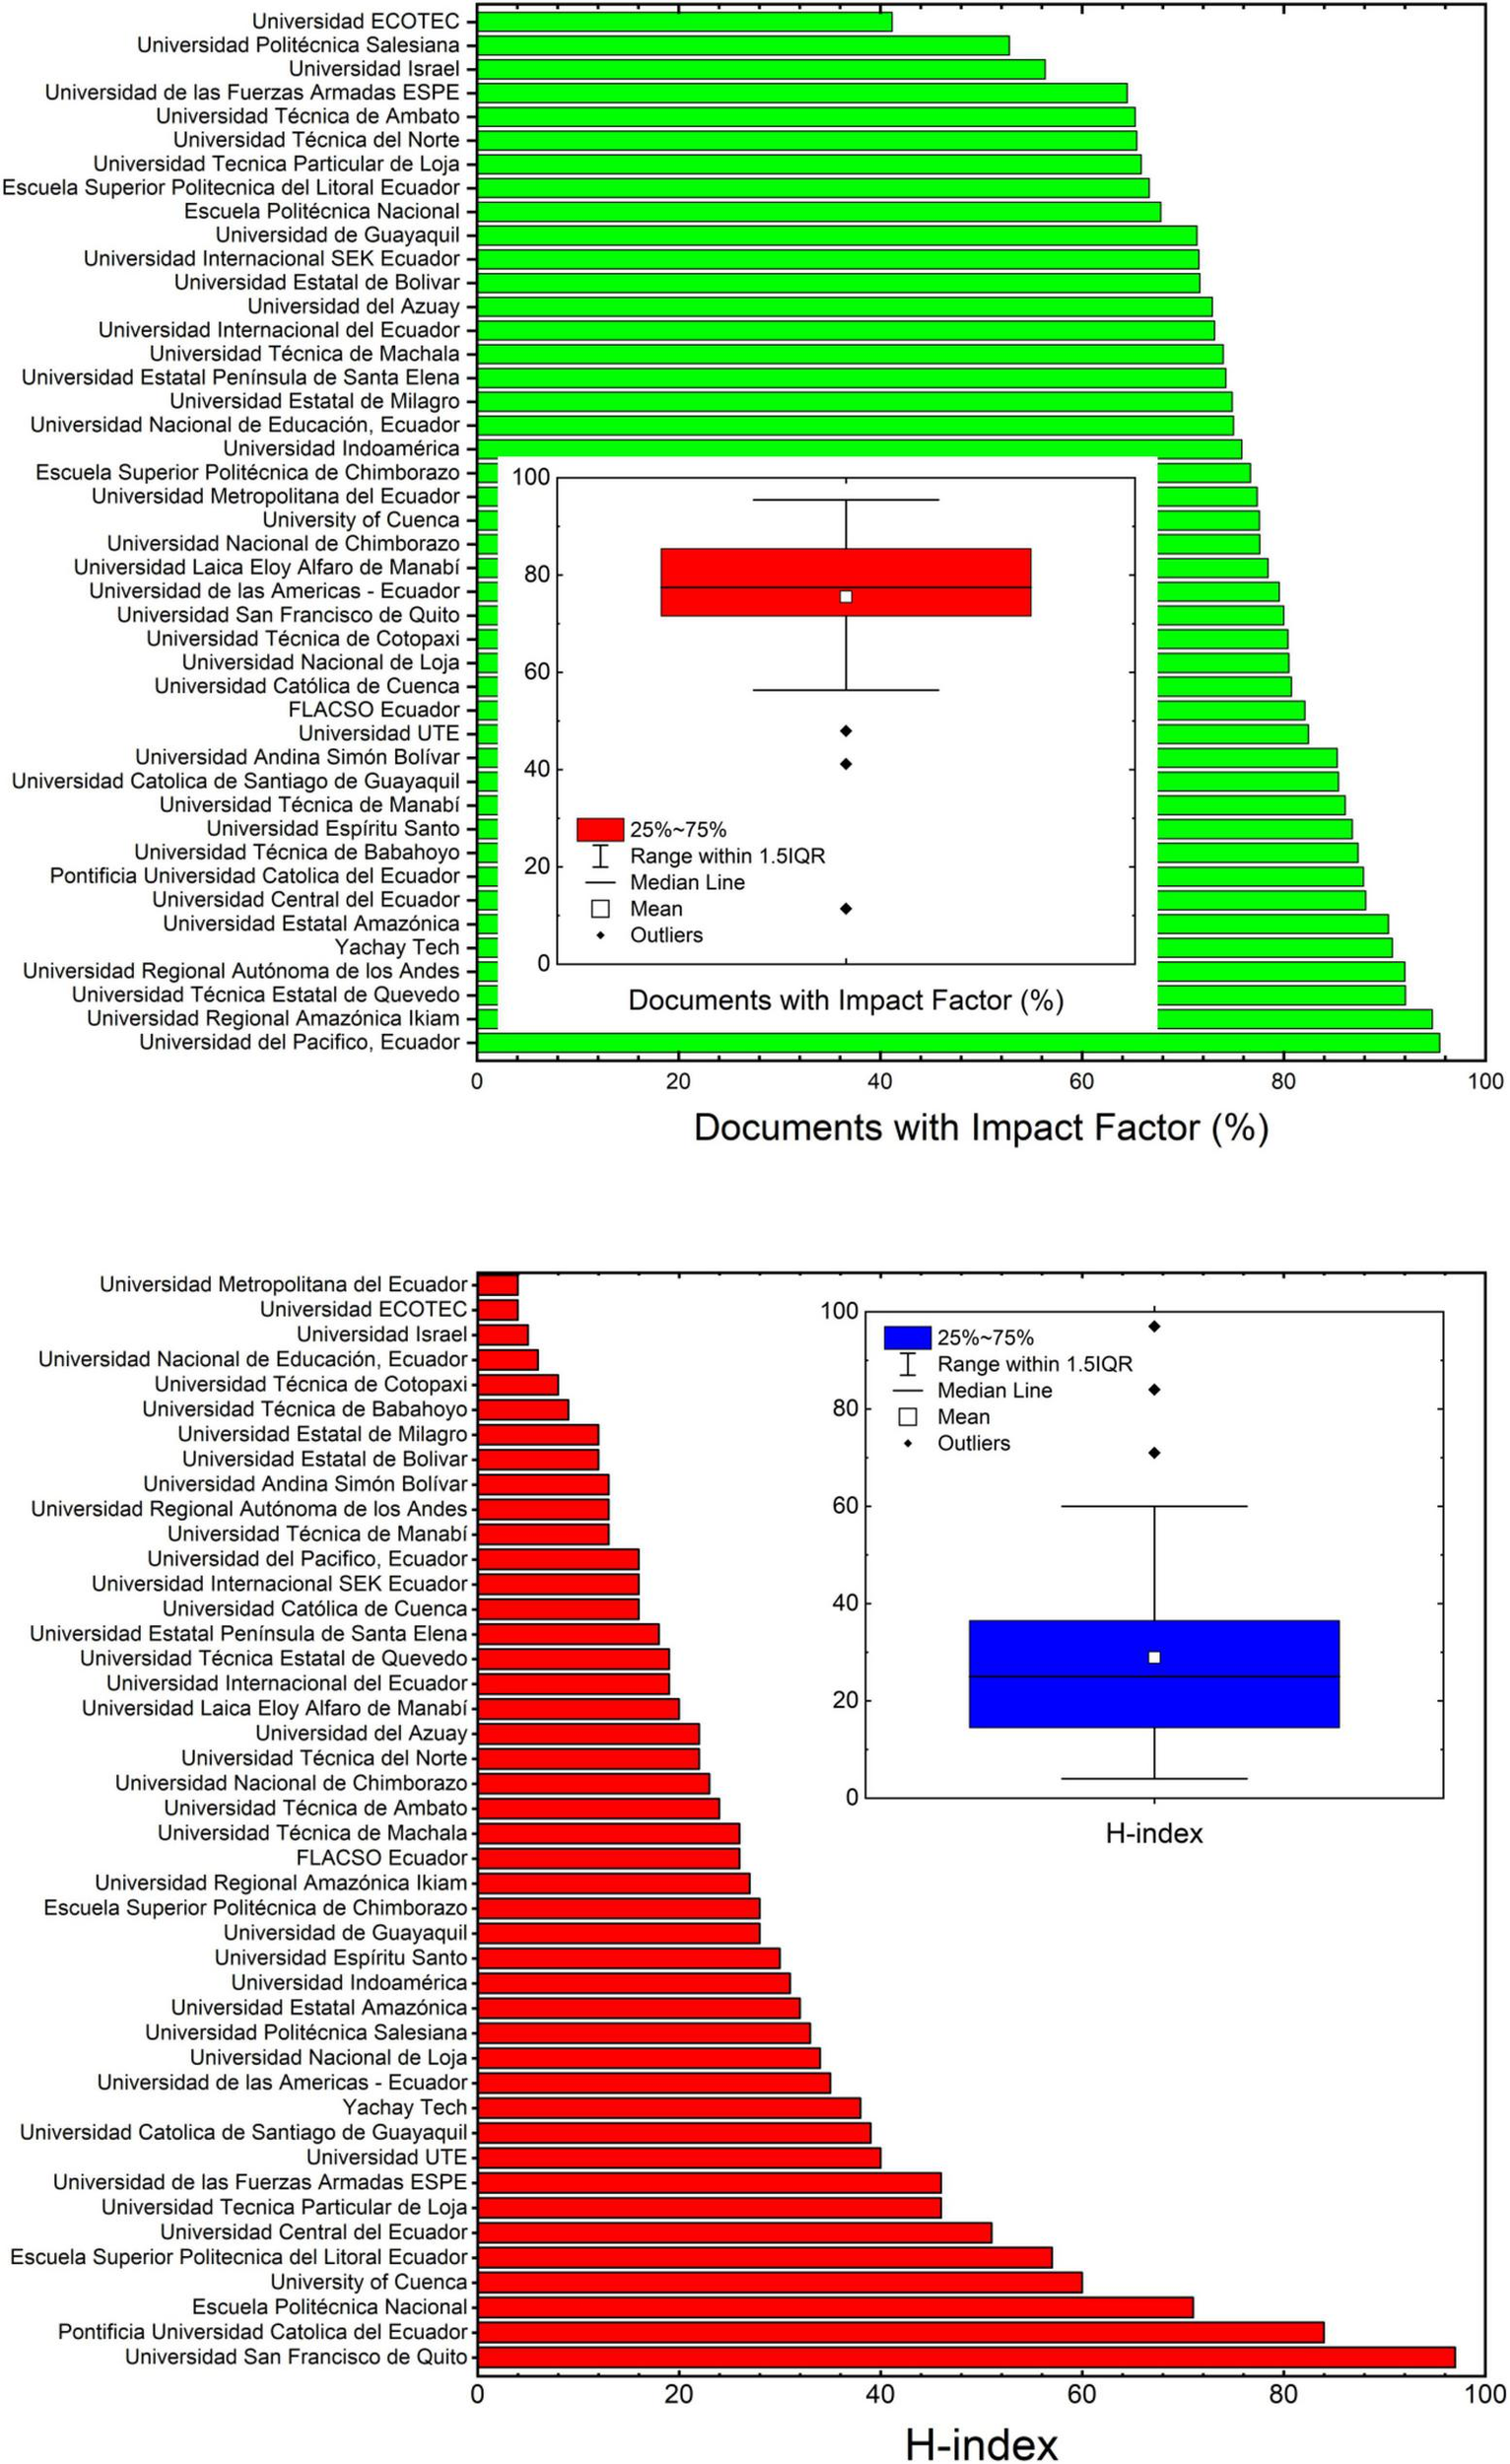
Percentage of documents with impact factor (Left), i.e., CiteScore, SNIP, or SJR, and H-Index (Right) of Ecuadorian Universities and their statistical distribution as of 01/28/2022.
H-index and its correlation with the total number of documents and citations
The H-index of universities is a widely used metric correlating documents’ production and citation impact. This index is also regarded as a measurement of the research quality of universities, faculties, departments, and even researchers (Bornmann and Daniel, 2009; Courtault et al., 2010; Mingers et al., 2012). This index was not considered in any of the research quality indicators. However, it provides a detailed view of the visibility and reception of the research output per University. Similar to the total number of documents and citation profiles, the H-index of the Ecuadorian universities was also heterogeneous and dispersed (Figure 3, Right). The mean and median H-index were 27.9 and 23.0, respectively. The 25–75% of the distribution ranged between 13 and 35.0. Also, few outliers were observed above the 1.5 IQR. 5 private and five public universities were in the H-index top 10. Interestingly, eight universities in the top ten in document production (section 4.1) were also in this H-index top 10, indicating consistency in their research efforts. Nevertheless, increasing the H-factor of a university or researcher is a long process that directly depends on the production of documents and their reception in the academic community, i.e., citations. In addition, the number of citations also depends on the field of research. Developed countries with established and mature research practices also measure the H-index of fields of knowledge within their faculties and departments as a quality indicator (Courtault et al., 2010; Lazaridis, 2010). Based on the above results and the young age of the Ecuadorian academia, this type of disaggregated statistics could not yet be accurately calculated and, thus, compared to their counterparts in developed countries.
The total number of documents, citations, and H-index were plotted in a log-log scatter graph to find a possible correlation describing the research output of the Ecuadorian universities (Figure 4). The data were fitted using the allometric function (y=axb). Despite clear outliers, results show that the research output of the universities can be best described following an exponential constant (b) of 1.801. Although the heterogeneity of the data only allowed for an Adj. R-Square of 0.816, the H-index, citations, and the number of documents produced by the universities evidenced a positive correlation. Globally, a larger number of documents correlated to a larger number of citations received and a higher H-index. Additionally, this trend indicates the difference in research development among Ecuadorian universities despite being subjected to the same research quality indicators during several evaluation processes. However, these three parameters can only describe the research output of the universities on a macro scale. An additional disaggregation of the data to the level of quartiles and impact factors (e.g., SNIP, SJR, and CiteScore) of the documents produced by each University would be required to assess the research quality in more detail, as follows.
FIGURE 4
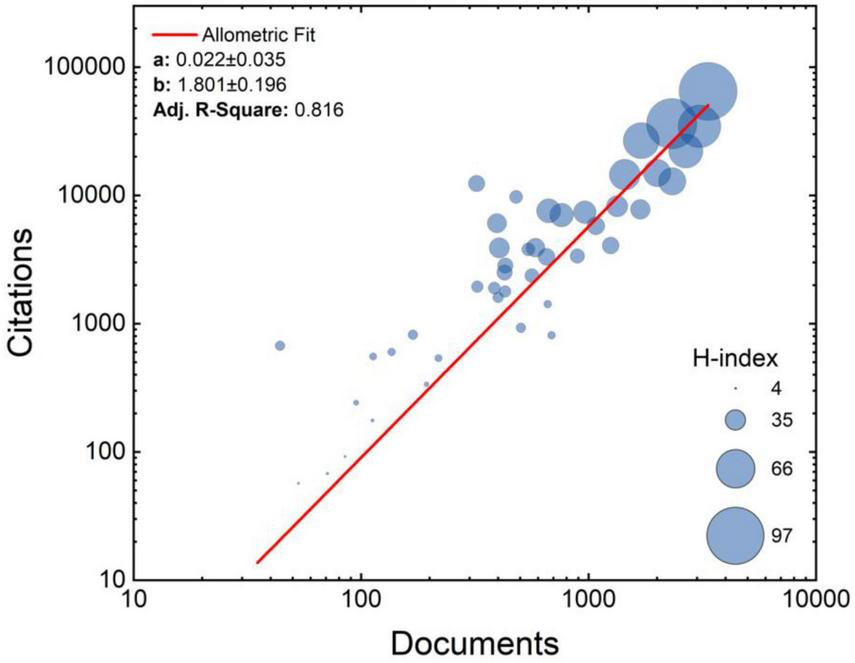
Correlation between the total number of documents, citations, and H-Index of Ecuadorian Universities.
Quartiles
The Scopus database split journals into four quartiles termed Q1, Q2, Q3, and Q4, to reflect the demand for the journal by the academic and scientific community. This classification is performed for every field of knowledge. Remarkably, the Ecuadorian universities published 37.9 and 24.5% of their documents in Q1 and Q2 journals, respectively, accounting for approximately two-thirds of their total production of documents (Figure 5, Left). Also, 17.5 and 19.9% of their documents were published in Q3 and Q4 journals, respectively. These results indicate the preference of Ecuadorian universities to publish in high quartiles and have higher visibility for their research. This preference may be explained by the quantitative indicators 2013.C.3.1, 2015.1.4.2.1, and 2019.11. While the former two were based on the SJR index, the latter was based on quartiles. Specifically, these quantitative research indicators favored publications of high SJR index (IF) and quartiles. Nevertheless, high-impact factor journals associated with high quartiles have rigorous peer-review processes and low acceptance rates in all scientific fields. Therefore, for the Ecuadorian universities to increase the quartile of their documents would still require additional time and effort to acquire more research experience.
FIGURE 5
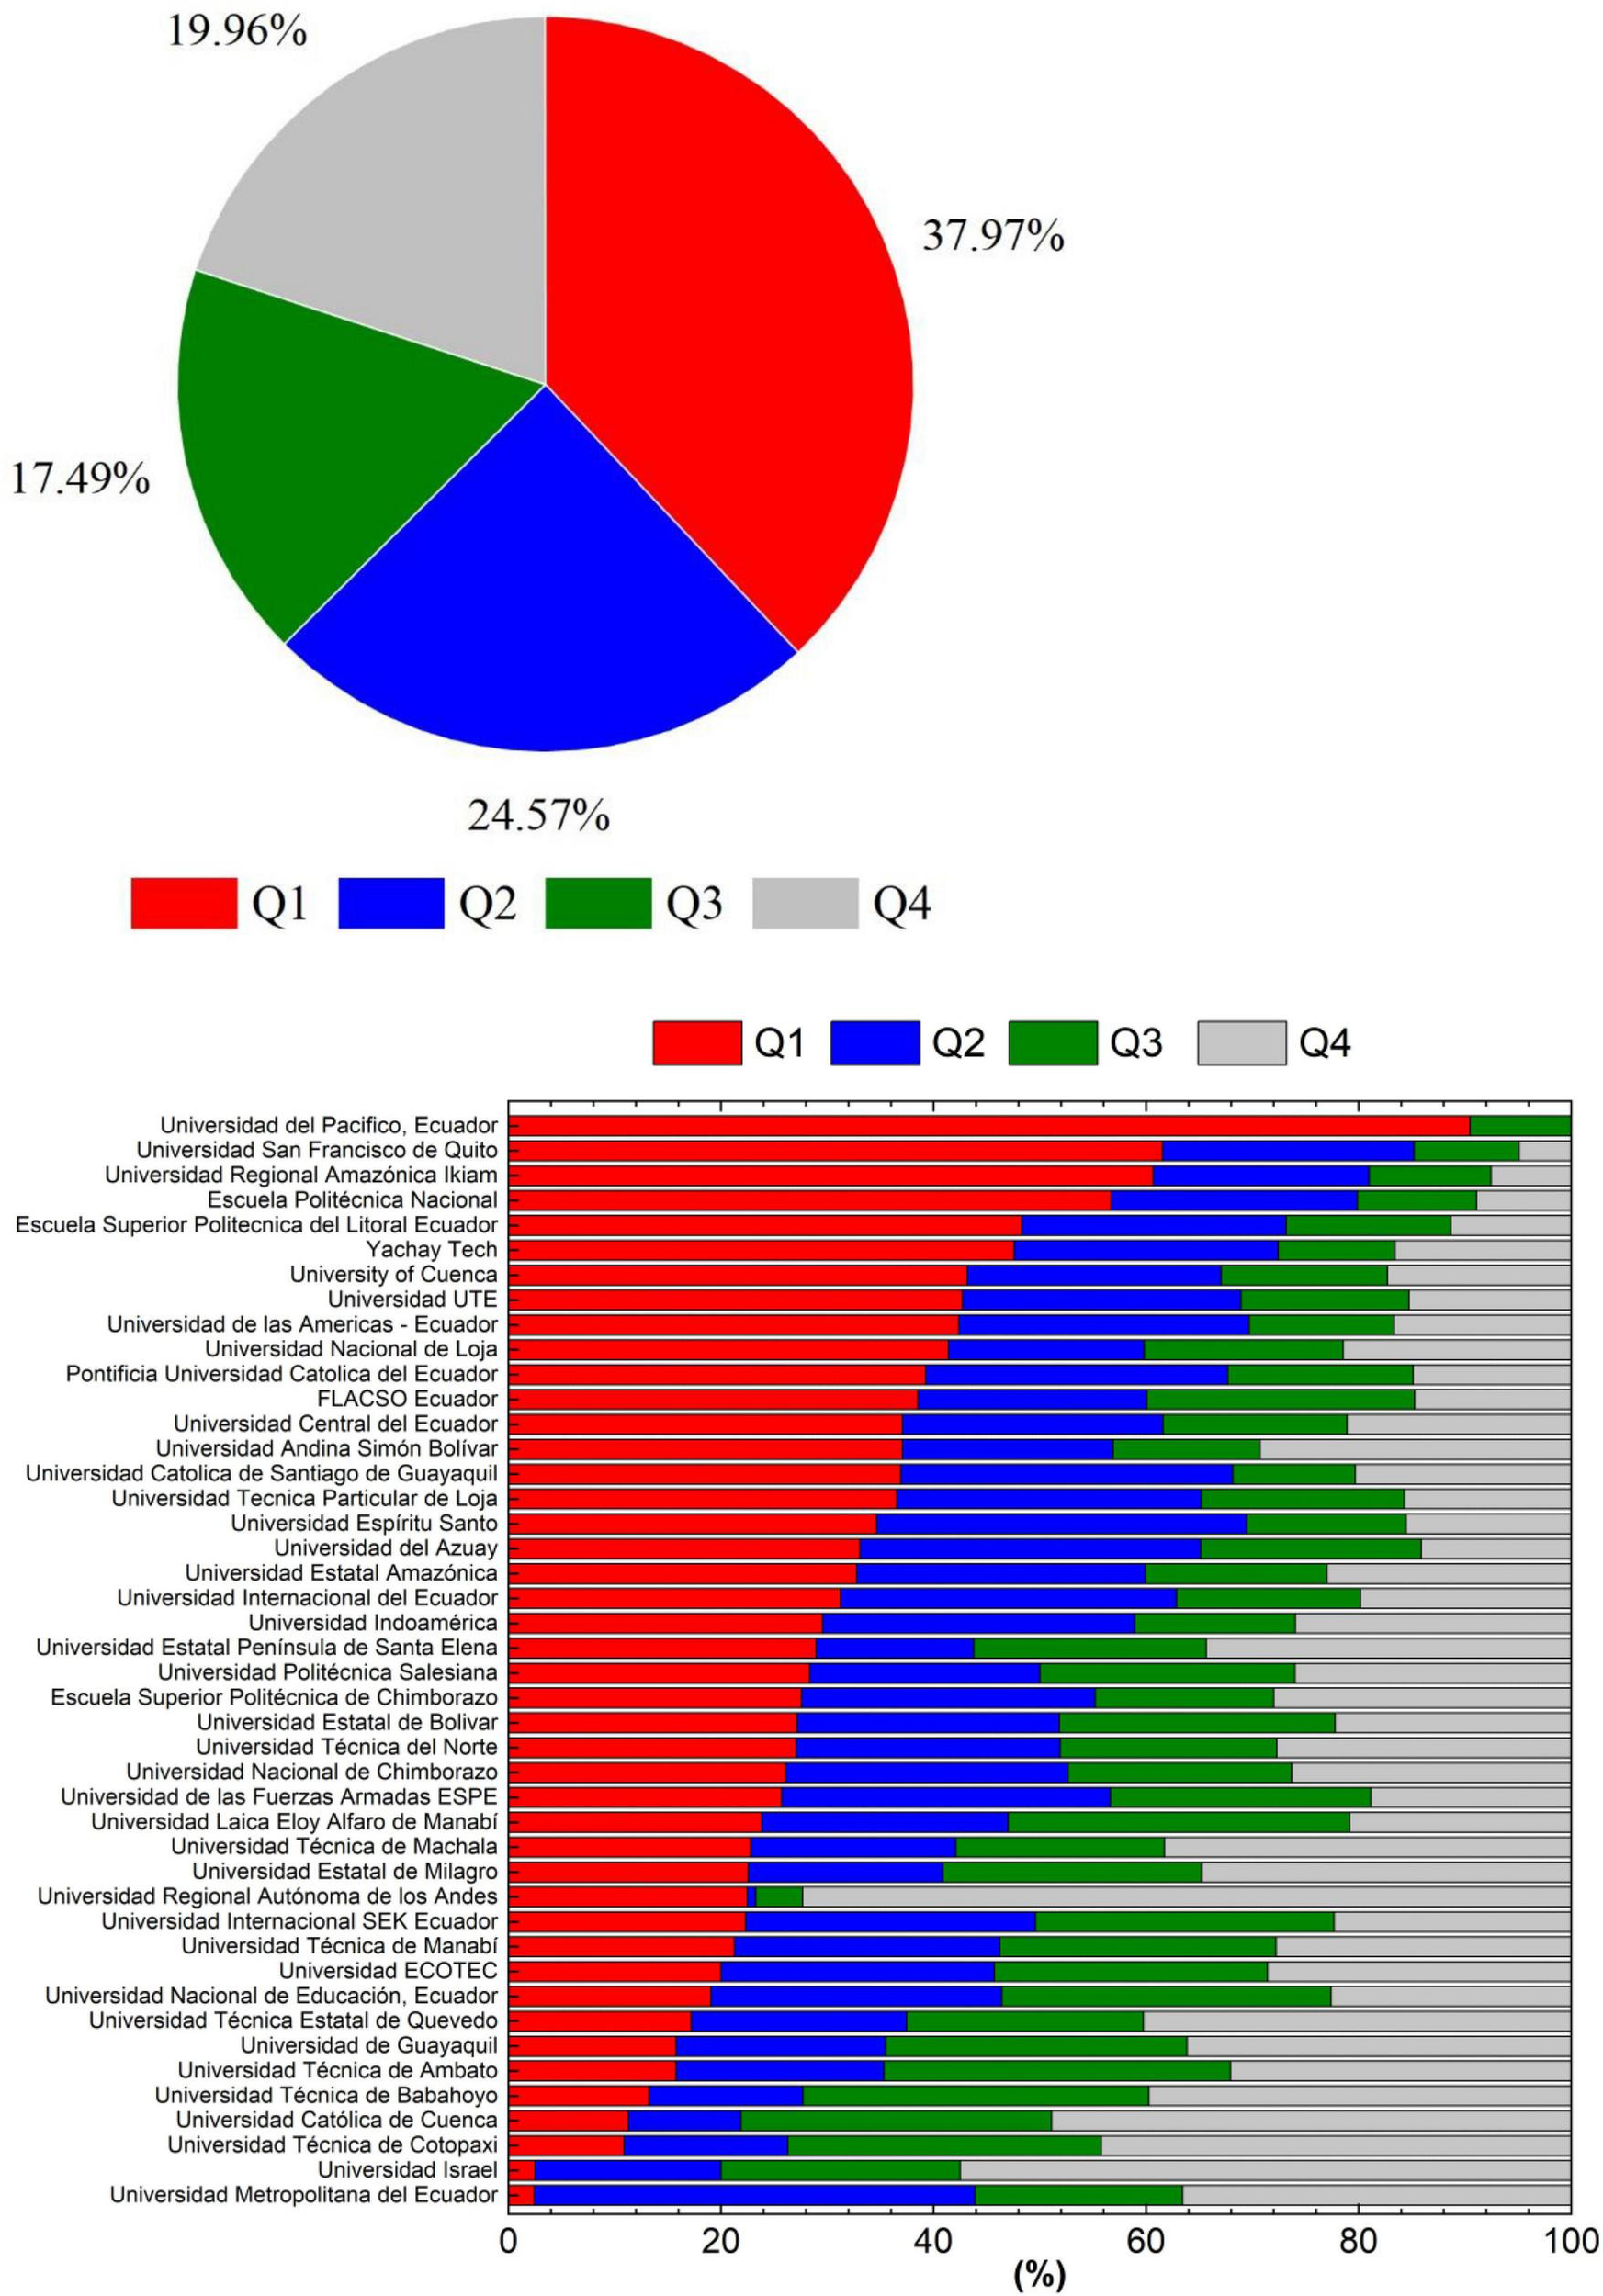
Quartiles of the documents produced by all (Left) and each (Right) of the Ecuadorian Universities.
When disaggregated, the quartile profiles of the documents published by each University broadly varied (Figure 5, Right). For instance, the percentage of documents published in Q1 journals widely ranged from 2.4 to 90.5%, while those of Q4 ranged from 0 to 72.3%. Only four universities published above 50% of their documents in Q1, while 12 universities published above 37.9% of their documents (i.e., the national average, Figure 4) in Q1. These numbers show the difficulties that Ecuadorian universities still face when attempting to publish in Q1 journals, despite the research indicators used for the evaluation processes.
The disaggregation of data provided a more accurate context on the research output of every University as compared to the overall average. For instance, five public and five private universities were in this Q1 top 10. Interestingly, only five universities in the H-index top 10, five universities in the top 10 of producing documents, and five universities in the top 10 citations were also in this Q1 top 10. However, the presence of both public and private universities in the top 10 citations, documents produced, H-index, and quartiles are significantly balanced.
Impact factors
The impact factors have directly been at the core of 2012, 2013, and 2015 evaluation processes (as SJR index) and indirectly at the 2019 process (as quartile). The weight assigned to both SJR and quartiles on the grade of the indicator was evident and provided pressure on universities to publish in high-end journals. In brief, the SJR (SCImago journal rank) is expressed as the average number of weighted citations of all the documents published in a journal in a specific year divided by the total number of documents in the previous 3 years. Due to its prestige metric-based methodology (weighted citations), the subject field and reputation of the journal directly impact the calculation of the SJR index. The SNIP (Source Normalized Impact per Paper) weights citations based on the total number of citations in a subject field, thus allowing the comparison of sources in different fields. Conversely, the CiteScore index is expressed as the ratio between the citations received by a journal in the previous 3 years and the total number of documents published in those same 3 years (Villaseñor-Almaraz et al., 2019). As opposed to CiteScore, both SJR, and SNIP are complex journal metrics that heavily rely on weighted metrics. This latter concept (weighted metrics) was the rationale behind the decision of government to select the SJR index for 2012, 2013, and 2015 evaluation processes. Nevertheless, the current study explored these three impact factors at the country and single-university levels.
These three impact factors showed high heterogeneity and outliers at the country level (Figure 6A). The mean, median, and 25–75% range for CiteScore, SNIP, and SJR were 3.88, 1.04, 0.82, and 2.5, 0.93, 0.49, and 0.8–5.1, 0.49–1.34, and 0.20–0.99 for CiteScore, SNIP, and SJR, respectively. Although the minimum value for these three impact factors (IFs) was zero, the maximum values were 99.7, 23.6, and 37.5. The number of outliers for these three IFs was considerably high. Also, the values of these outliers were one order of magnitude above their means and medians. This box plot statistical analysis evidenced the high scattering of these data, which cannot be described by simple average and standard deviation calculations. Remarkably, the magnitudes of the statistical parameters of SNIP and SJR were similar. A previous study compared the scientific production (i.e., the number of papers published in SJR from 1996 to 2019) of Latin American countries as a function of their population, the number of documents, citations, and self-citations (Gonzalez-Diaz et al., 2022). Ecuadorian scientific production ranked low (i.e., between 20,001 and 100,000 papers in the SJR database) among 20 countries. However, the pull for scientific production recently started in Ecuador in 2012 with the generation of quantitative indicators focusing on the SJR of the publications. Also, to the best of our knowledge, no study reports a direct comparison at a Latin American level of the three IFs analyzed in the current study.
FIGURE 6
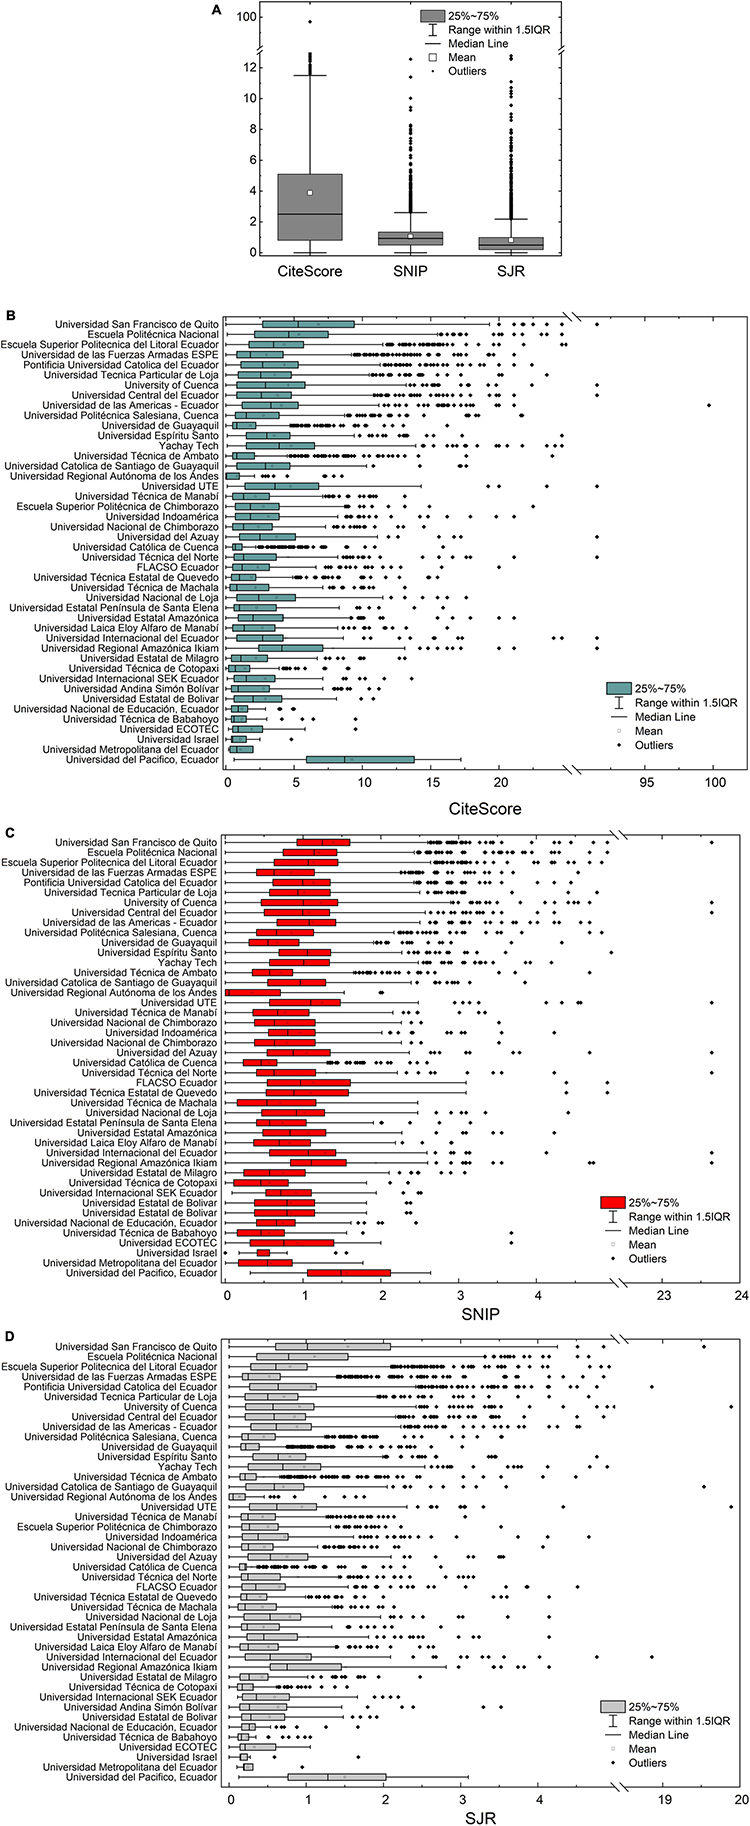
Impact factor of all Ecuadorian Universities (A), CiteScore (B), SNIP (C), and SJR (D) for each of the Ecuadorian Universities.
The data also showed highly dispersed at the single-university level for the three IFs analyzed (Figures 6B–D). Likewise, almost every University showed outliers representing publications of high IF. This latter observation indicates researchers of high-end literary production in every University. For comparison purposes, the order of the universities on the Y-axis of Figures 6B–D followed a descending order of universities producing documents (Figure 2, Left). As such, an analysis of the total number of documents produced vs. the impact factor could be conducted. When considering the 25–75% range of the box plots and the corresponding median and mean, the most productive universities in terms of the number of documents did not necessarily show the highest impact factors. Surprisingly, universities with medium and low production of documents showed higher mean impact factors than their top-10 highly productive counterparts. Also, these results show the priorities of universities in terms of the production of documents vs. IF. This observation applied to the three IFs analyzed and indicated that the number of documents produced does not necessarily correlate to their IF. Although CiteScore is not a weighted-based metric, the box plot profiles of CiteScore and SJR were similar, while the SNIP profile showed more homogeneity between universities.
Principal component analysis (PCA): correlation between the publication metrics
In the previous sections, a comprehensive statistical analysis of several parameters associated with the research output of Ecuadorian academia has been conducted, both at the country level and single-university level. Every parameter has shown highly dispersed data, thus indicating the heterogeneous literary production of universities and their priorities in fulfilling the research indicators and standards of the evaluation processes (e.g., number of documents produced vs. having an IF vs. value of the IF vs. level of quartile). Nevertheless, an additional type of analysis is necessary to understand the correlation between the above-analyzed parameters.
The main goal of Principal Component Analysis (PCA) was the dimensionality reduction of the large dataset analyzed in this current investigation and also the correlation between quartiles, citations, SNIP, CiteScore, and SJR of the 28,070 publications with IF produced in Ecuador. CiteScore and SNIP showed the highest eigenvalues out of the five eigenvectors extracted (Figure 7A). Nevertheless, the eigenvalue of SJR closely followed that of SNIP. These results indicate the IFs as the parameters with the highest variability of the whole dataset. Finally, the lowest eigenvalues were quartile and citations, thus, showing the lowest variability of the whole dataset. Consequently, CiteScore and SNIP were selected as the main eigenvectors, where Principal Component 1 (PC 1) and Principal Component 2 (PC 2) corresponded to 67.5 and 17.1% of the data variability (Figure 7B). Interestingly the three IF vectors (SNIP, CiteScore, and SJR) showed similar magnitude and direction (Figure 7B). This result clearly indicates a strong correlation between these IFs in the Ecuadorian publications. It is also evidenced by the similar IFs profile of the box plots of universities, as shown in Figures 6B–D. On the other hand, the citations and quartile vectors showed a potentially different correlation. When translating these vectors to a correlation matrix (Table 2), CiteScore, SNIP, and SJR showed strong positive correlations of approximately 0.9 between each other. Nevertheless, the quartile (i.e., 1, 2, 3, and 4) showed a medium negative correlation of approximately −0.5 with all the IFs and a weak negative correlation of −0.149 with citations. Conversely, citations showed a medium positive correlation of approximately 0.45 with all the IFs. In brief, the impact factor of the 28,070 publications with IF produced in Ecuador showed a medium positive correlation with their citations and a medium negative correlation with their quartile, while quartile and citations are weakly negatively correlated. These results suggest that the publications by Ecuadorian researchers targeting higher IFs tend to but do not necessarily result in higher citations or higher quartiles. Also, targeting a higher CiteScore journal will tend to result in higher SJR and SNIP.
FIGURE 7
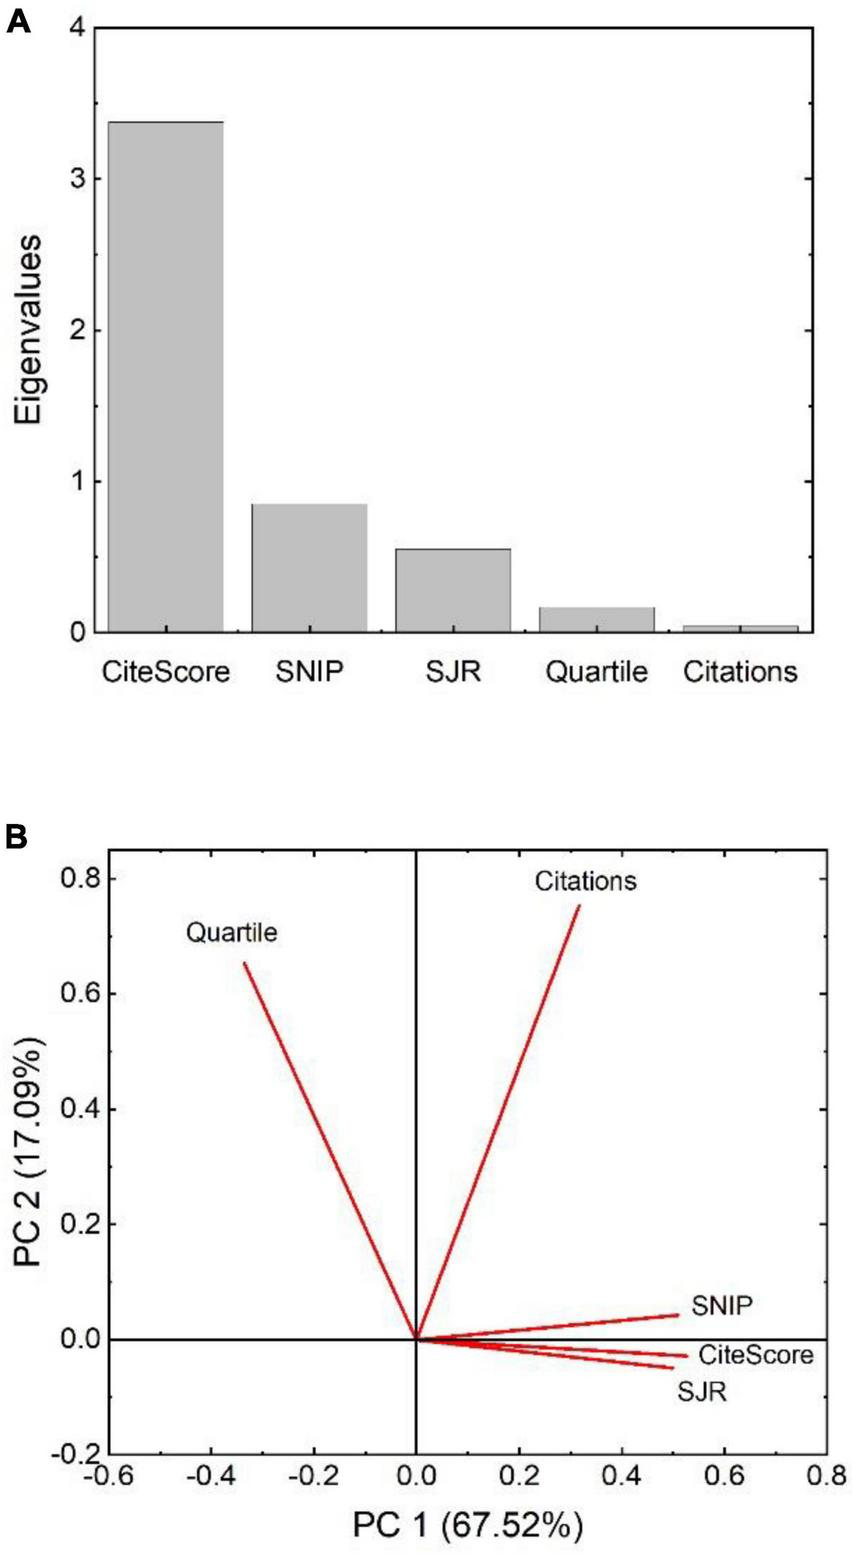
Eigenvalues (A) and principal components (B) of the quartiles, citations, SNIP, SJR, and CiteScore of all the publications by Ecuadorian Universities.
TABLE 2
| 1 | 2 | 3 | 4 | 5 | |
| 1. CiteScore | − | ||||
| 2. SNIP | 0.91 | − | |||
| 3. SJR | 0.93 | 0.82 | − | ||
| 4. Quartile | -0.52 | -0.49 | -0.46 | − | |
| 5. Citations | 0.47 | 0.50 | 0.40 | -0.15 | — |
Correlation matrix.
Cluster analysis: segregation of the research output in groups
K-means cluster analysis was used to partition the extracted data into clusters of similar observations. The characteristics and center of each cluster were extracted to find trends in the research output of Ecuadorian academics. Briefly, the 28,070 publications were clustered in four groups as a function of their similarities in terms of quartiles, citations, SNIP, SJR, and CiteScore, and plotted in the Principal Component diagram (Figure 8). A cluster center was calculated and plotted for each of the four clusters (Table 3), as well as the summary of observations and distances to the center (Table 4). As evidenced in Figure 8 and Tables 3, 4, the cluster analysis showed a dispersed and heterogeneous dataset that was difficult to group. In brief, Cluster 2 comprised 27,538 publications of low citations and IFs (i.e., cluster center at 6.9 and 0.76, citations and SJR, respectively). Cluster 1 comprised 503 publications of considerably higher citations and IFs (i.e., cluster center at 151 and 3.29, citations and SJR, respectively). Finally, Clusters 3 and 4 showed the selective group of publications (i.e., 7 and 22, respectively) achieving the highest impact factors and citations of the 28,070 documents. Although this analysis attempts to show the target of specific Ecuadorian scholars in terms of research metrics, the heterogeneity of the data prevents a more accurate analysis (i.e., as seen in the average and maximum distances to the center of the cluster in Table 4). Nevertheless, these results also show a clear publication trend in Ecuadorian academia.
FIGURE 8
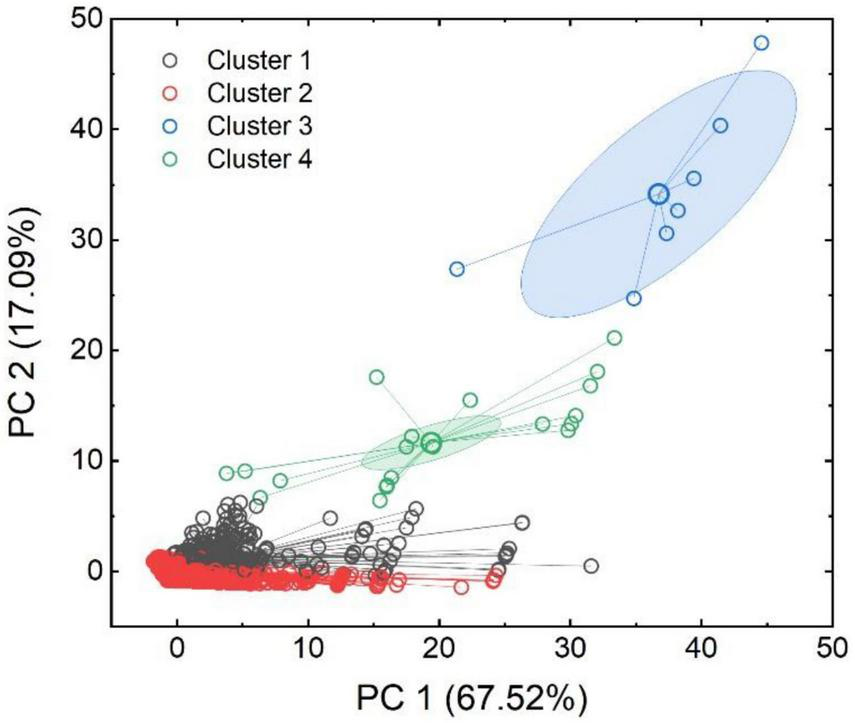
Clustering of quartiles, citations, SNIP, SJR, and CiteScore of all the publications by Ecuadorian universities.
TABLE 3
| CiteScore | SNIP | SJR | Quartile | Citations | |
| Cluster 1 | 13.76 | 2.71 | 3.29 | 1.12 | 151.23 |
| Cluster 2 | 3.64 | 1.00 | 0.76 | 2.22 | 6.95 |
| Cluster 3 | 83.66 | 21.44 | 12.30 | 1 | 2681.43 |
| Cluster 4 | 53.30 | 11.45 | 11.33 | 1.05 | 971.23 |
Cluster center.
TABLE 4
| Number of observations | Within cluster sum of square | Average distance | Maximum distance | |
| Cluster 1 | 503 | 4009972.62 | 64.49 | 391.80 |
| Cluster 2 | 27538 | 4645133.29 | 9.01 | 97.36 |
| Cluster 3 | 7 | 2208366.63 | 465.23 | 1045.60 |
| Cluster 4 | 22 | 2178773.41 | 270.08 | 713.86 |
Cluster summary.
Limitations of the statistical analysis
In brief, the current investigation used a rigorous statistical analysis to process 35,501 documents (i.e., including documents with and w/o impact factor) and their 328,288 citations from 44 Universities during a time frame of 16 years (i.e., 2006 to 2021). Although solid statistical modeling tools were selected for each scenario, no set of statistical analyses is without limitations. This section discusses the strengths and limitations of this statistical analysis. The modeling of linear and non-linear curves in the analysis of the cumulative number of documents published and citations recorded per year for all the Ecuadorian Universities (Figure 1) resulted in coefficients of determination (COD) close to 1 and Reduced Chi-square close to 0. Likewise, the allometric fit (i.e., high adjusted R-square close to 1) confirmed the positive correlation between the total number of documents, citations, and H-Index for all the Ecuadorian Universities (Figure 4). These results indicate the high degree of precision of the modeling selected for these scenarios, which highly assisted in detecting the years in which the production of Academic literature and citations was experiencing a change in trend. On the other hand, the box plot analysis of the disaggregated data, i.e., the individual production of documents, impact factors, citations, documents with impact factor, and H-index of each University (Figures 2, 3, 6), showed a highly heterogeneous dataset with scattered mean and median, and wide 25–75th percentiles and 1.5 interquartile-IQR range. These results evidenced the limitation of this analysis for establishing a representative statistical mean for each of the scenarios studied. Similarly, the clustering of quartiles, citations, SNIP, SJR, and CiteScore of all the publications by the Ecuadorian Universities (Figure 8) showed considerable distances between the cluster center and observations (Tables 3, 4). This result evidences the limitation of this type of analysis for partitioning the extracted data into clusters of similar observations.
Discussion
HEIs are widely recognized as playing a role in the socio-economic progress of a nation due to their inherent possibilities for development, innovation, and dissemination of scientific knowledge (Fernandes and Singh, 2021). One important aspect of this role is the production and dissemination of scientific publications, which are a means of university scientific productivity (Etzkowitz et al., 2000; Abramo et al., 2017). In recent years, many HEIs have been subject to external accreditation and evaluation processes, which have been widely recognized as important drivers of research productivity and scientific output (Iossifova, 2008; Hedrick et al., 2010). These processes are designed to ensure that HEIs meet certain standards of quality and can provide important incentives for institutions to invest in research and development (Altbach and Salmi, 2011).
Accreditation and evaluation can be an external factor that stimulates this production. The present study explored the impact of the multiple accreditation and evaluation processes conducted since 2009 on the research output of Ecuadorian HEIs. Peer-reviewed documents in the Scopus from 2006 to 2021 were statistically analyzed at both country and single university levels. It explored the statistical evolution of the academic production published in the Scopus database of Ecuadorian universities and its relationship with national evaluation and accreditation. Our results suggest that most universities (71%) have published in the Scopus database. The remaining universities probably publish in regional databases (e.g., Latindex). The evidence presented in this work shows that before the accreditations and evaluations of 2013, the scientific production of the universities was significantly poor. Since the 2009 CONEA report and the consequent evaluations associated with university accreditation, Ecuadorian universities have made a remarkable effort in academic production to meet the demands of the publication indicators. This was observed in the substantial proportion of publications in journals of demanding metrics (i.e., impact factor, quartiles, or CiteScore). Therefore, it is suggested that the public accreditation policy has successfully promoted publication in academic journals and the visibility (i.e., citation) of the research of Ecuadorian universities. These results may be evidence of the dominant top-down approach to improving university quality in terms of scholarly publishing. According to Bernasconi and Celis (2017), public accreditation policies are unique due to their strong impulse from the government, which seems far from what has happened in countries like Uruguay or Colombia, where the political policy has integrated contributions from local universities.
However, our results also suggest that the evolution of scientific production and citations has also decreased since 2018. It is not possible to accurately specify the factors that may explain this decrease. However, the relaxation measures associated with the pandemic would play a key role. In 2013, the sub-criterion Research Results of the CEAACES evaluation model included scientific production, regional production, and books or book chapters. Scientific production was calculated based on the SJR index, while in the 2019 evaluation, the quartiles were considered without evidence to justify this decision. In addition, in both evaluations, the previous 3 years were considered. The metrics of a journal are indeed controversial (Falagas et al., 2008). However, there is a substantial difference between publishing in a journal considering the SJR and a quartile. The latter has a large range of SJR scores, and the university accreditation model standardized quartiles with 0.25 for Q4, 0.50 for Q3, 0.75 for Q2, and 1 for Q1. Therefore, a publication in Q2 received a high score of.75 regardless of whether the SRJ was in the upper or lower limit (i.e., prestigious) of the quartile of a specific discipline or category of knowledge. If researchers depend on scarce or private resources (Sisa et al., 2021), scientific production would be published in lower-quality journals or journals without an impact factor.
The results of increased publication in prestigious journals could be explained by collaboration with experienced academics in high-impact publications (Qi et al., 2017; Way et al., 2019). For Ecuadorian universities, the factor that could explain this collaboration seems to be the need to be accredited. International evidence seems to support this argument. However, the conditions or internal mechanisms that facilitate scientific production associated with accreditation are not yet clear. Ke et al. (2016) examined these potential mechanisms when evaluating the effect of AACSB accreditation on universities and research performance by examining the differences before and after the accreditation of four universities in Taiwan. Specifically, they analyzed seven statistics: the number of papers published, the number of citations, the average number of citations per paper, the average number of citations per year, the h-index (annual), h-index, and g-index. Their results suggest a definite improvement in research performance after AACSB accreditation. However, the average number of citations per paper actually decreased for the three research-oriented universities. They found that there is a large increase in research productivity, indicated by the number of published papers and the total number of citations, but the research impact, indicated by citations per paper, h-index, and g-index, does not have the same level of improvement. However, the teaching university showed a greater enhancement in research impact over research productivity. They also found that there was a more significant improvement in research performance for non-active research faculty members than for active ones. Moreover, this difference in improvement between active and non-active research faculty members was greater in the teaching-oriented University. While this study shows that accreditation processes have a positive impact on research performance, there are still some issues that could be addressed by comparing more teaching and research-oriented universities, considering longer examination periods when looking at the change in research performance, and analyzing the strategic objectives of universities.
Concerning the impact of the pandemic, emergent literature (Barber et al., 2021; Gao et al., 2021; Cui et al., 2022; Kim and Patterson, 2022) suggests that the COVID-19 pandemic has significantly impacted scientific production by disrupting research activities, limiting access to facilities, reducing collaboration opportunities, and creating additional demands on researchers’ time. This has caused delays in ongoing research, reduced data quality and quantity, and limited the ability to publish findings. The pandemic has also disproportionately affected early-career researchers and those from underrepresented groups (i.e., junior and assistant professors and female academics) (Jefferson et al., 2021), exacerbating existing inequalities and hindering workforce development. Although there are no studies to date that report on the effects of the pandemic on the productivity and scientific publication of Ecuadorian universities, it is expected that similar or even more negative impacts will occur. According to Gao et al. (2021), the issues associated with the pandemic may persist in the post-pandemic period. Thus more research funding, infrastructure, and innovative virtual collaboration solutions are suggested (Lee and Bozeman, 2016; Qi et al., 2017).
This study has implications for improving scientific productivity.
-
1.
It is suggested to encourage external accreditation and evaluation processes. Universities could submit to external accreditation and evaluation processes to meet certain standards of quality that put more attention on scientific production.
-
2.
Focus on publication in prestigious academic journals. One important aspect of the role of universities is the production and dissemination of scientific publications, which are a means of disseminating university scientific productivity. HEIs should focus on publishing in academic journals with high-impact factors or quartiles to increase the visibility and citation of their research.
-
3.
Collaboration with experienced academics. Collaboration with experienced academics in high-impact publications can improve the research performance of universities. HEIs should reward collaborating with experienced academics to improve their research productivity.
-
4.
Improving and connecting research facilities and conditions. The accreditation of universities may encourage collaboration between universities in the same country in terms of laboratories, researchers, and economic resources, among others.
Future perspectives
The growth and quality of academic publishing is a crucial research topic that should help understand the dynamic processes and results associated with public policies for higher education, the commitment of HEIs, the academic concern in relation to local and global scientific and technological advances, as well as the degree of impact on society (Boelen and Woollard, 2009; Johnson, 2017; Cossani et al., 2022). This work aimed to unravel these issues in the young Ecuadorian academy by exploring the relationship between accreditation and scientific publication. However, there are many questions that remain to be answered, such as the processes that universities carry out to increase their production, the types of relationships between academics and academic production units, the role of scholarship holders and networks of foreign researchers, among others (Cossani et al., 2022).
An explanation for the decrease in recent years may be the relaxation of the rigor of scientific production evaluation indicators (e.g., increased weight of the indicator for publication in regional journals) and the slowdown in research due to the global health emergency. The CES of Ecuador issued a regulation that allowed academics to concentrate their work on teaching if their study was not of strategic value for the country or did not have pre-allocated funding (CES, 2020). Future research should help inform the plausibility of this alternative explanation and whether the impact only involved some disciplines or faculties.
These results should be interpreted from a much broader landscape. Although developing economies are improving their level of production compared to the more developed world, the growth of academic production and its visibility could be better appreciated from an ecosystem perspective (Gonzalez-Brambila et al., 2016; Iyandemye and Thomas, 2019). The academic publication of a university is associated with a set of entry indicators that generally refer to the hiring of highly qualified personnel, such as research staff, Ph.D. students, and Ph.D. professors, as well as the facilities for the production process (Cossani et al., 2022). These internal factors may depend on external conditions of the University, such as research networks or accessibility to research funds. In the case of developing economies, these indicators may be associated mainly with state investment (Gonzalez-Brambila et al., 2016). Consequently, due to the recent development of scientific capacities, these indicators may be susceptible to the effectiveness of university management and external factors such as external accreditation. Briefly, Ecuadorian HEIs may be stimulated through economic investment, hiring the most highly qualified research-oriented professors, and rigorous accreditations that encourage high-impact publications and closer inter-university collaborations around scientific gaps and social problems.
Conclusion
In conclusion, the current study suggests that public accreditation policy has successfully promoted the publication of research in high-impact academic journals from a top-down approach (Bernasconi and Celis, 2017). This finding opens new research opportunities. For instance, the possible variation in publication growth (particularly since 2018), the relationship between university accreditation and public and private investment in research and development, the direct and indirect impacts of Ecuadorian scientific production, the effects of the investment and the pandemic, and the relationship of the publication with other key indicators such as the qualification of the teaching staff or the research facilities.
Statements
Data availability statement
The original contributions presented in this study are included in the article/supplementary material, further inquiries can be directed to the corresponding author.
Author contributions
GG: contribution to writing the manuscript, translation, and statistical analysis. MY and MA: contribution to the policy analysis, discussion, and conclusions. JZ: contribution to the structure of manuscript and final review and analysis. LG: contribution to the data compilation and statistical analysis, and final review and editing. All authors contributed to the article and approved the submitted version.
Funding
The authors acknowledge the support of the Universidad del Pacifico under the Research Grant UP-2022-FDE.
Acknowledgments
The authors acknowledge the valuable support and contribution of the Faculty of Education and Law and the Faculty of Technology and Innovation at the Universidad Del Pacifico-Ecuador.
Conflict of interest
The authors declare that the research was conducted in the absence of any commercial or financial relationships that could be construed as a potential conflict of interest.
Publisher’s note
All claims expressed in this article are solely those of the authors and do not necessarily represent those of their affiliated organizations, or those of the publisher, the editors and the reviewers. Any product that may be evaluated in this article, or claim that may be made by its manufacturer, is not guaranteed or endorsed by the publisher.
References
1
Abramo G. D’Angelo A. C. Murgia G. (2017). The relationship among research productivity, research collaboration, and their determinants.J. Inform.111016–1030. 10.1016/j.joi.2017.09.007
2
Agarwal P. (2006). Higher education in India: The need for change.New Delhi: Indian Council for Research on International Economic Relations.
3
Altbach P. G. Salmi J. (2011). The road to academic excellence: The making of world-class research universities.Washington, DC: World Bank Publications.
4
Atkinson R. C. Blanpied W. A. (2008). Research Universities: Core of the US science and technology system.Technol. Soc.3030–48. 10.1016/j.techsoc.2007.10.004
5
Barber B. M. Jiang W. Morse A. Puri M. Tookes H. Werner I. M. (2021). What explains differences in finance research productivity during the pandemic?J. Finan.761655–1697. 10.1111/jofi.13028
6
Bernasconi A. Celis S. (2017). Higher education reforms: Latin America in comparative perspective.Educ. Policy Anal. Arch.2567. 10.14507/epaa.25.3240
7
Boelen C. Woollard B. (2009). Social accountability and accreditation: A new frontier for educational institutions.Med. Educ.43887–894. 10.1111/j.1365-2923.2009.03413.x
8
Bordons M. Fernández M. Gómez I. (2002). Advantages and limitations in the use of impact factor measures for the assessment of research performance.Scientometrics53195–206. 10.1023/A:1014800407876
9
Bornmann L. Daniel H. D. (2009). The state of h index research: Is the h index the ideal way to measure research performance?EMBO Rep.102–6. 10.1038/embor.2008.233
10
CACES (2019). Modelo de evaluación externa de universidades y escuelas politécnicas.Quito: Consejo de Aseguramiento de la Calidad de la Educación Superior Quito.
11
CEAACES (2015). Modelo de evaluación institucional de universidades y escuelas politécnicas.Quito: CEAACES.
12
CEAAEES (2013). Modelo para la evaluacion de las carreras presenciales y semi-presenciales de las universidades y escuelas politecnicas del Ecuador.Quito: CEAAEES.
13
CES (2020). Normativa transitoria para el desarrollo de actividades académicas en las Instituciones de Educación Superior, debido al estado de excepción decretado por la emergencia sanitaria ocasionada por la pandemia de COVID-19.Quito: El Consejo de Educacion Superior.
14
CES (2022). Universidades y escuelas politécnicas.Quito: CES.
15
CONEA (2009). Evaluacion de desempeno institucional de las Universidades y Escuelas Politecnicas del Ecuador.Quito: CONEA.
16
Cossani G. Codoceo L. Cáceres H. Tabilo J. (2022). Technical efficiency in Chile’s higher education system: A comparison of Rankings and Accreditation.Eval. Program Plann.92:102058. 10.1016/j.evalprogplan.2022.102058
17
Courtault J.-M. Hayek N. Rimbaux E. Zhu T. (2010). Research in economics and management in France: A bibliometric study using the h-index.J. Socio-Econ.39329–337. 10.1016/j.socec.2009.12.006
18
Cui R. Ding H. Zhu F. (2022). Gender inequality in research productivity during the COVID-19 pandemic.Manuf. Serv. Oper. Manage.24707–726. 10.1287/msom.2021.0991
19
De Ridder-Symoens H. Rüegg W. (2003). A history of the university in Europe: Volume 1, Universities in the Middle Ages.England: Cambridge University Press.
20
Dunham S. S. (2009). Government regulation of higher education: The elephant in the middle of the room.J. Coll. Univ. Law36749–790.
21
Espinoza Ó González L. E. (2013). Accreditation in higher education in Chile: Results and consequences.Qual. Assur. Educ.2120–38. 10.1108/09684881311293043
22
Etzkowitz H. Webster A. Gebhardt C. Terra B. R. C. (2000). The future of the university and the university of the future: Evolution of ivory tower to entrepreneurial paradigm.Res. Policy29313–330. 10.1016/S0048-7333(99)00069-4
23
Falagas M. E. Kouranos V. D. Arencibia-Jorge R. Karageorgopoulos D. E. (2008). Comparison of SCImago journal rank indicator with journal impact factor.FASEB J.222623–2628. 10.1096/fj.08-107938
24
Fernandes J. O. Singh B. (2021). Accreditation and ranking of higher education institutions (HEIs): Review, observations and recommendations for the Indian higher education system.TQM J.341013–1038. 10.1108/tqm-04-2021-0115
25
Fielden J. LaRocque N. (2008). The evolving regulatory context for private education in emerging economies.Washington, DC: World Bank.
26
Frey B. S. Osterloh M. (2011). Rankings games.Zurich: University of Zurich.
27
Gao J. Yin Y. Myers K. R. Lakhani K. R. Wang D. (2021). Potentially long-lasting effects of the pandemic on scientists.Nat. Commun.12:6188. 10.1038/s41467-021-26428-z
28
Gingerich O. (1993). The eye of the heaven. Ptolemy, Copernicus, Kepler.College Park, MA: American Institute of Physics.
29
Gomez-Rosselli S. Rosselli D. (2021). Bibliometric analysis of engineering publications in Colombia 2010-2019: A Scopus analysis.DYNA889–14.
30
Gonzales L. D. Núñez A.-M. (2014). Ranking Regimes and the Production of Knowledge in Academia: (Re)shaping Faculty Work?Educ. Policy Anal. Arch.22:31. 10.14507/epaa.v22n31.2014
31
Gonzalez-Brambila C. N. Reyes-Gonzalez L. Veloso F. Perez-Angón M. A. (2016). The scientific impact of developing nations.PLoS One11:e0151328. 10.1371/journal.pone.0151328
32
Gonzalez-Diaz R. Acevedo-Duque Á Martin-Fiorino V. Cachicatari-Vargas E. (2022). Latin American professors’ research culture in the digital age.Comunicar3071–83. 10.3916/C70-2022-06
33
Gruber T. (2014). Academic sell-out: How an obsession with metrics and rankings is damaging academia.J. Market. Higher Educ.24165–177. 10.1080/08841241.2014.970248
34
Harrington J. (2001). Reform in El Salvador.Boston, MA: International Higher Education, 10.6017/ihe.2001.25.6954
35
Hartle T. W. (1998). Complex government rules increase the cost of tuition.Washington, DC: The chronicle of higher education Inc.
36
Hedrick D. W. Henson S. E. Krieg J. M. Wassell C. S. (2010). The effects of AACSB accreditation on faculty salaries and productivity.J. Educ. Bus.85284–291. 10.1080/08832320903449543
37
Iossifova A. (2008). Research productivity, teaching relevance, and AACSB accreditation.Qual. Manage. J.1546–56. 10.1080/10686967.2008.11918204
38
Iyandemye J. Thomas M. P. (2019). Low income countries have the highest percentages of open access publication: A systematic computational analysis of the biomedical literature.PLoS One14:e0220229. 10.1371/journal.pone.0220229
39
Jefferson F. A. Hora M. T. Pickens S. L. Salzman H. (2021). The impact of COVID-19 on tenure clocks, the evaluation of productivity, and academic STEMM career trajectories.Washington, DC: National Academy of Sciences.
40
Johnson M. A. (2017). Contemporary higher education reform in Ecuador: Implications for faculty recruitment, hiring, and retention.Educ. Policy Anal. Arch.25:68. 10.14507/epaa.25.2794
41
Jones G. A. (2014). “An introduction to higher education in Canada,” in Higher education across nations, edsJoshiM.PaivandiS. (New Delhi: B. R. Publishing).
42
Kapur D. Crowley M. (2008). Beyond the ABCs: Higher education and developing countries.Washington, DC: Center for Global Development.
43
Ke S.-W. Lin W.-C. Tsai C.-F. (2016). Research performance of AACSB accredited institutions in Taiwan: Before versus after accreditation.SpringerPlus5:1285. 10.1186/s40064-016-2934-6
44
Kim E. Patterson S. (2022). The pandemic and gender inequality in academia.Polit. Sci. Polit.55109–116. 10.1017/S1049096521001049
45
Kozak M. Bornmann L. Leydesdorff L. (2015). How have the Eastern European countries of the former Warsaw Pact developed since 1990? A bibliometric study.Scientometrics1021101–1117. 10.1007/s11192-014-1439-8
46
Langhauser D. P. (2002). Executive regulations and agency interpretations: Binding law or mere guidance-developments in federal judicial review.JC UL29:1. 10.1016/S1355-0306(04)71705-0
47
Lazaridis T. (2010). Ranking university departments using the mean h-index.Scientometrics82211–216. 10.1007/s11192-009-0048-4
48
Lee S. Bozeman B. (2016). The Impact of research collaboration on scientific productivity.Soc. Stud. Sci.35673–702. 10.1177/0306312705052359
49
Lehmann S. Jackson A. D. Lautrup B. E. (2006). Measures for measures.Nature4441003–1004. 10.1038/4441003a
50
Lezberg A. (2003). Accreditation in the Gulf: The Case of Qatar.Boston, MA: International Higher Education.
51
Middlehurst R. Campbell C. (2004). Quality Assurance and Borderless Higher Education: Finding pathways through the maze.London: Observatory on Borderless Higher Education.
52
Millones-Gómez P. A. Yangali-Vicente J. S. Arispe-Alburqueque C. M. Rivera-Lozada O. Calla-Vásquez K. M. Calla-Poma R. D. et al (2021). Research policies and scientific production: A study of 94 Peruvian universities.PLoS One16:e0252410. 10.1371/journal.pone.0252410
53
Mingers J. Macri F. Petrovici D. (2012). Using the h-index to measure the quality of journals in the field of business and management.Inf. Process. Manage.48234–241. 10.1016/j.ipm.2011.03.009
54
Qi M. Zeng A. Li M. Fan Y. Di Z. (2017). Standing on the shoulders of giants: The effect of outstanding scientists on young collaborators’ careers.Scientometrics1111839–1850. 10.1007/s11192-017-2328-8
55
Saarinen T. Ala-Vähälä T. (2008). Accreditation, the Bologna Process and National Reactions: Accreditation as Concept and Action.Higher Educ. Eur.32333–345. 10.1080/03797720802066195
56
Saint W. Hartnett T. A. Strassner E. (2003). Higher Education in Nigeria: A Status Report.Higher Educ. Policy16259–281. 10.1057/palgrave.hep.8300021
57
Sidhu R. K. (2006). Universities and globalization: To market, to market.England: Routledge.
58
Sisa I. Abad A. Espinosa I. Martinez-Cornejo I. Burbano-Santos P. (2021). A decade of Ecuador’s efforts to raise its health research output: A bibliometric analysis.Glob. Health Act.14:1855694. 10.1080/16549716.2020.1855694
59
Stanko T. Chernyshkova E. Zhirosh O. Melnichenko A. Antokhina Y. Laskina I. et al (2022). “The Effect of Covid-19 Pandemic on the Regional Universities Research Culture and the Quality of the Engineering Education,” in Mobility for Smart Cities and Regional Development - Challenges for Higher Education. ICL 2021. Lecture Notes in Networks and Systems, edsAuerM. E.HortschH.MichlerO.KöhlerT. (Cham: Springer).
60
Tafur Avilés G. (2016). Impacto de las nuevas políticas de Educación Superior en las Universidades y Escuelas Politécnicas del Ecuador.Rev. Empres.1028–34.
61
Villaseñor-Almaraz M. Islas-Serrano J. Murata C. Roldan-Valadez E. (2019). Impact factor correlations with Scimago Journal Rank, Source Normalized Impact per Paper, Eigenfactor Score, and the CiteScore in Radiology, Nuclear Medicine & Medical Imaging journals.La Radiol. Med.124495–504. 10.1007/s11547-019-00996-z
62
Wang J. (2013). Citation time window choice for research impact evaluation.Scientometrics94851–872. 10.1007/s11192-012-0775-9
63
Way S. F. Morgan A. C. Larremore D. B. Clauset A. (2019). Productivity, prominence, and the effects of academic environment.Proc. Natl. Acad. Sci. U.S.A.11610729–10733. 10.1073/pnas.1817431116
Summary
Keywords
higher education, statistics, accreditation, regulation, government, indicators
Citation
Gutiérrez G, Yaguarema M, Ayala M, Zambrano R. J and Gutiérrez L (2023) Impact of government evaluation and accreditation processes on the research output of universities in developing countries: an X-ray of the young Ecuadorian academia. Front. Educ. 8:1093083. doi: 10.3389/feduc.2023.1093083
Received
08 November 2022
Accepted
31 March 2023
Published
20 April 2023
Volume
8 - 2023
Edited by
B. Elango, Rajagiri College of Social Sciences, India
Reviewed by
Jaya Raju, University of Cape Town, South Africa; N. Siva, SRM Institute of Science and Technology, India
Updates
Copyright
© 2023 Gutiérrez, Yaguarema, Ayala, Zambrano R and Gutiérrez.
This is an open-access article distributed under the terms of the Creative Commons Attribution License (CC BY). The use, distribution or reproduction in other forums is permitted, provided the original author(s) and the copyright owner(s) are credited and that the original publication in this journal is cited, in accordance with accepted academic practice. No use, distribution or reproduction is permitted which does not comply with these terms.
*Correspondence: Leo Gutiérrez, leonardo.gutierrezgarces@ugent.be
This article was submitted to Higher Education, a section of the journal Frontiers in Education
Disclaimer
All claims expressed in this article are solely those of the authors and do not necessarily represent those of their affiliated organizations, or those of the publisher, the editors and the reviewers. Any product that may be evaluated in this article or claim that may be made by its manufacturer is not guaranteed or endorsed by the publisher.