 Larissa Hahn
 Pascal Klein
- Physics Education Research, Faculty of Physics, University of Göttingen, Göttingen, Germany
Research has shown that visual representations can substantially enhance the learning and understanding of STEM concepts; despite this, students tend to struggle in using them fluently and consistently. Consequently, educators advocate for explicit instructions that support the coordination of multiple representations, especially when concepts become more abstract and complex. For recent years, the drawing (or sketching) technique has received increasing attention. Theoretical considerations and prior research suggest that drawing has the potential to support knowledge construction and to provide cognitive relief. In this article, we present two studies that investigate the impact of drawing activities in a multi-representational, instruction-based learning scenario from physics, more precisely, in the context of vector fields. Further, mobile and remote eye tracking was used to record students' gaze behavior in addition to monitoring indicators of performance and cognitive load. Here, eye movements provide information about cognitive processes during the completion of the instruction, on the one hand, and during subsequent problem solving, on the other hand. Comparisons of a treatment group instructed with drawing activities and a control group instructed without drawing activities revealed significant differences in students' perceived cognitive load (p = 0.02, d = 0.47 and p = 0.0045, d = 0.37), as well as their response accuracy (p = 0.02, d = 0.51) and their response confidence (p = 0.02, d = 0.55 and p = 0.004, d = 0.64) during assessment after instruction (N = 84). Moreover, students instructed with drawing activities were found to distribute more visual attention to important parts of the instruction (vector field diagram and instructional text, N = 32) compared to the control group and, further, showed effective, expert-like behaviors during subsequent problem solving (N = 53). Finally, as a contribution to current trends in eye-tracking research, the application of mobile and remote eye-tracking in drawing-based learning and assessment scenarios is compared and critically discussed.
1. Introduction
Multiple external representations (MERs) and their interpretations play a central role in STEM and, particularly, in STEM learning. As different representations focus on different characteristics of a concept or a learning subject, and thus complement and constrain each other, multiple, visual representations enable a deep understanding of fundamental scientific concepts (Ainsworth, 1999; Seufert, 2003; Rau, 2017). Moreover, a flexible and conscious use of different representations, which requires enhanced representational competencies, was found to have positive effects on knowledge acquisition, development of conceptual understanding, and problem-solving skills (e.g., Nieminen et al., 2012; Chiu and Linn, 2014; Rau, 2017).
However, learning from and with multiple representations in STEM education often places special demands on the visuo-spatial working memory, hence increasing cognitive load (Baddeley, 1986; Cook, 2006; Logie, 2014). Therefore, current research advocates assistance through drawing activities, for example, by sketching (or drawing) visual cues or by transforming textual information into a drawing (e.g., Figure 1, Left; Kohnle et al., 2020; Ainsworth and Scheiter, 2021). As visualizations are integral to scientific thinking, Ainsworth et al. (2011) emphasized the potential of drawing as an effective learning strategy. Following the authors, the externalizing approach of drawing aligns with the visual-spatial demands of science learning, thus helping students to visually make sense of concepts and providing cognitive relief (Bilda and Gero, 2005; Wu and Rau, 2018). Previous studies have confirmed these theoretical considerations by demonstrating positive learning outcomes of sketching activities in multi-representational learning environments (Leopold and Leutner, 2012; Wu and Rau, 2018; Hellenbrand et al., 2019; Kohnle et al., 2020; Ainsworth and Scheiter, 2021). As such, sketching increased attention and engagement with the representation, allowed to pay more attention to details and important parts of a representation, and thus supported a (visual) understanding of concepts.
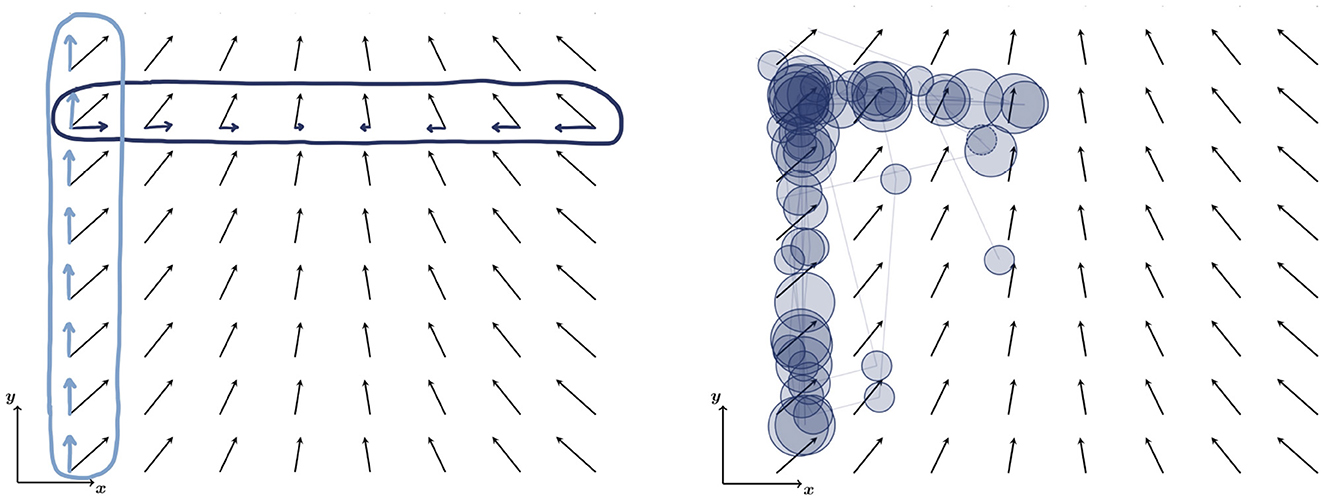
Figure 1. Vector field diagram of the field with drawing of visual cues and vector field components (Left) and visual evaluation in horizontal and vertical directions (Right) to interpret covariation in Cartesian coordinates. x and y components of the field are sketched in dark and light blue, respectively (Left). To evaluate their change along a row (x direction) and a column (y direction), the corresponding row or column is circled. Analysis of covariation yields that the x component of the field changes in x direction (along the row), while the y component is constant in y direction (along the column). Visual evaluation of covariation along Cartesian directions (x and y direction) is associated with horizontal and vertical saccades (Scanpath; fixations are visualized by circles; circle size relates to fixation duration; Right).
Studies investigating cognitive load often postulate limited capacity of working memory resources. This is typically broken down into three types of cognitive load—that are, intrinsic, extraneous, and germane cognitive load (Cognitive Load Theory; Sweller, 2010). Intrinsic cognitive load refers to the inherent complexity of the information to be understood (further specified below for the context of vector fields), extraneous cognitive load to the design of the instructional material, and germane cognitive load to the mental capacities a learner devotes to the learning subject. In that context, sketching activities are considered to allow a more effective use of visuo-spatial working memory resources (Bilda and Gero, 2005; Sweller, 2010). Moreover, studies have shown that using multiple external representations in STEM education, particularly with a focus on drawing, can enhance knowledge acquisition, conceptual understanding, and problem-solving skills while reducing cognitive load (Leopold and Leutner, 2012; Wu and Rau, 2018; Hellenbrand et al., 2019).
In recent years, eye-tracking as a nonintrusive process-based assessment technique has become increasingly popular in research on (multimedia) learning (Hyönä, 2010; Lai et al., 2013; Alemdag and Cagiltay, 2018) and STEM education (e.g., reviews in physics and mathematics see Strohmaier et al., 2020; Hahn and Klein, 2022a). Following the eye-mind hypothesis by Just and Carpenter (1976), refined by Wu and Liu (2022), many studies postulate a relationship between visual attention and cognitive processing (e.g., Tsai et al., 2012). In this context, eye-tracking measures, such as total and mean fixation duration, fixation and transition count, and time to first fixation, are typically used to study students' attention and visual behavior during learning and assessment activities. This includes analyzing their engagement with instructional designs, their strategies during problem solving, and performance on concept tests or tasks (Lai et al., 2013; Hahn and Klein, 2022a), thus allowing to study expertise differences (Gegenfurtner et al., 2011). Thereby, research focused on cognitive processes in learning or assessment scenarios; studies analyzing gaze data during instruction and subsequent assessment, in contrast, were hardly conducted (Hahn and Klein, 2022a). In physics education research, gaze data is typically collected on a screen using remote eye-tracking methods; only one study used mobile eye-tracking glasses thus far (Hahn and Klein, 2022a). As, particularly paper-based, drawing activities significantly influence learning behaviors, mobile eye tracking promises to be particularly suited to track its constructive mechanisms and to gain insight into frequency and timing of externalization (Hellenbrand et al., 2019).
In university physics, vector field representations play a central role, being represented either algebraically as a formula or graphically as a vector field diagram (see Figure 1). When representing a quantity as a vector field, the field's divergence, a measure for its sources and sinks, is of particular relevance for physics applications (Griffiths, 2013). For electrodynamics, one of the largest subfields of physics, an extensive preparation in vector calculus was found to be highly correlated with students' performance at university (Burkholder et al., 2021). However, further research also revealed that students often lack a conceptual understanding of vector field representations and, particularly, divergence, which is highly relevant to physics comprehension (e.g., Pepper et al., 2012; Singh and Maries, 2013; Bollen et al., 2015). Recent studies found, for example, that students interpreted the divergence of a vector field literally instead of referring to its physics-mathematical concepts and that they struggled with evaluating the divergence from a vector field diagram (Ambrose, 2004; Pepper et al., 2012; Singh and Maries, 2013; Bollen et al., 2015, 2016, 2018; Baily et al., 2016; Klein et al., 2018, 2019, 2021). Particularly surprising, graduate students struggle with conceptual aspects of divergence, even though they know how to calculate it mathematically (Singh and Maries, 2013). Several studies deepened this line of research and identified various learning difficulties closely related to the Cartesian representation of divergence. In particular, the concept of covariation between field components and coordinates was found to cause difficulties for students (see Figure 1, Left); they confused components with coordinates or committed errors when decomposing vectors into their components (e.g., Gire and Price, 2012; Barniol and Zavala, 2014; Bollen et al., 2017). Additionally, Pepper et al. (2012) reported about student problems in dealing with partial vector derivatives as they, for example, confused the change of a vector with its magnitude. Analysis of students' gaze when viewing vector field diagrams confirmed the difficulties mentioned above (Klein et al., 2018, 2019, 2021). Moreover, it was shown that conceptual gaps regarding vector calculus were transferred to errors in application (e.g., in electrostatics and -magnetism; Ambrose, 2004; Jung and Lee, 2012; Bollen et al., 2015, 2016; Li and Singh, 2017).
Analysis of introductory and advanced physics texts and textbooks by Smith (2014) revealed that divergence is typically introduced using a mathematical expression, but is either not or insufficiently explained or discussed qualitatively or illustratively. In light of the aforementioned empirical findings, several researchers advocated new instructions using visual representations that address a conceptual understanding of vector field concepts and, particularly, divergence. Following this line of research, Klein et al. (2018) developed text-based instructions for visually interpreting divergence using vector field diagrams. Here, the authors referred to two different mathematical approaches, namely flux through boundary (integral approach) and covariation of components and coordinates (differential approach). A clinical eye-tracking study revealed a quantitative increase in conceptual understanding after students completed the instructions (Klein et al., 2018). However, in post-intervention interviews, some subjects indicated difficulty with diagram-specific mental operations, such as decomposing vectors and evaluating field components along coordinate directions. They further suggested visual aids, for example, sketches of component decomposition, as being helpful to improve their performance. Hence, in a follow-up experimental study, Klein et al. (2019) compared two instructions of the differential strategy, with and without visual cues, and found that adding visual cues for component decomposition actually led to better learning outcomes. Moreover, a positive correlation with students' response confidence was found, as students from the treatment group instructed with visual cues trusted their answers more (Lindsey and Nagel, 2015; Klein et al., 2017, 2019). However, students' transfer performance and their perceived task difficulty during problem-solving did not improve significantly compared to the previous study indicating that visual cues did not fully overcome students' difficulties regarding vector decomposition and partial derivatives. In a third study, using a very similar instruction, Klein et al. (2021) found that particularly students with high or medium spatial abilities—as measured by the Spatial Span Task (SST) by Shah and Miyake (1996)— benefited from the instructional support, whereas students with low spatial abilities perceived high cognitive load and hardly profited from the instruction.
In addition to performance measures, all three studies used eye tracking to analyze students' handling of the instruction and representation-specific visual behaviors during subsequent problem-solving (Klein et al., 2018, 2019, 2021). In the studies by Klein et al. (2019, 2021), it was shown that visual cues increased fixation count and total fixation duration on relevant parts of the instruction. Furthermore, cognitive integration processes indicated by transitions were significantly more pronounced for students instructed with cues. During problem solving, saccadic eye movement patterns of students instructed with visual cues were similar to experts. Here, the authors referred to results by Klein et al. (2018), who found that best-performing students' eye movements are dominated by horizontal and vertical saccades indicating correct interpretation of partial derivatives along Cartesian coordinate directions (Figure 1, Right). Besides characteristic saccadic directions, Klein et al. (2018) found that best-performing students also performed shorter saccades which was associated with a systematic evaluation of component changes in the vector field diagram. However, despite high visuo-spatial demands of the task stimulus, no correlation of such gaze patterns with students' spatial abilities could be confirmed (Klein et al., 2021).
By taking the above-mentioned theoretical considerations into account, the aforementioned multi-representational instructions on divergence (Klein et al., 2018, 2019, 2021) were evolved and extended by dedicated pre-exercises on vector decomposition and partial derivatives. In particular, several task on drawing of vector components or highlighting rows and columns to support evaluation along coordinate directions are incorporated (Hahn and Klein, 2021). The tasks aim at providing cognitive relief, fostering further engagement with the representations and the instructed strategy, and supporting the development of a conceptual understanding of divergence which can be transferred to further concepts. Besides analyzing the general impact of the instruction, this contribution aims at evaluating the value of the drawing activities in a multi-representational instruction on divergence by presenting two studies both comparing a treatment group instructed with drawing activities and a control group instructed without drawing activities. The following guiding question is investigated: “Does the instruction on divergence including drawing activities have a higher learning impact than the instruction without drawing activities?” Besides typical performance indicators, such as response accuracy and response confidence, eye movements are exploited to reveal between-subjects effects during completion of the instruction and subsequent problem solving. Consequently, considering theoretical frameworks on the use of drawing activities, the following research questions and hypotheses are posed:
(RQ1) What impact do drawing activities have on students' conceptual understanding and their accuracy of judging the divergence of vector field diagrams?
(RQ2) What are the differences between students instructed with and without drawing activities concerning their performance (response accuracy and confidence) as measured by several assessment tasks (including the evaluation of the divergence of vector field diagrams, the interpretation of partial derivatives of vector field diagrams, and conceptual questions on divergence)?
(RQ3) What are the differences between students instructed with and without drawing activities concerning their cognitive load (as measured by a cognitive load questionnaire) during learning and task processing?
(H1) Students instructed with drawing activities perceive less cognitive load (as measured by a cognitive load questionnaire) during learning and task processing.
(RQ4) What are the differences between students instructed with and without drawing activities concerning their visual attention
(a) during processing of the instruction?
(b) when evaluating the divergence of vector field diagrams?
2. Materials and methods
The aforementioned research questions are investigated in two separate studies. Study 1 uses performance measures to quantify the impact of the instruction and, particularly, the drawing activities in order to address research questions RQ1, RQ2 and RQ3 including hypothesis H1. In study 2 cognitive processing is focused using mobile and remote eye tracking during completion of the instruction and subsequent problem solving, thus addressing research questions RQ4(a) and RQ4(b).
2.1. Study 1
2.1.1. Participants
The sample of study 1 was drawn from physics students at a German university (Table 1) in the context of a large-scale voluntary physics pre-course before the first study semester. Prior to the study, students received a short introduction to vector fields in the lecture. In the corresponding recitations, students completed the study material in self study (for study design see Section 2.1.2 and Figure 2, and for materials see Section 2.3, Table 2, Figures 3, 4 and Supplementary material). In total, 84 first-year students (19 female, average age 19.2 years) participated in the study (for further characterization of the sample see Table 1, Left). It is notable that the pretest scores on vector fields are rather high, indicating sufficient prior knowledge about visual representations of vector fields and decomposition of single vectors into components of all students to understand the subsequent instruction. But as only 39% of them were able to evaluate the divergence of a vector field diagram the instruction could still have a meaningful impact (Table 1).
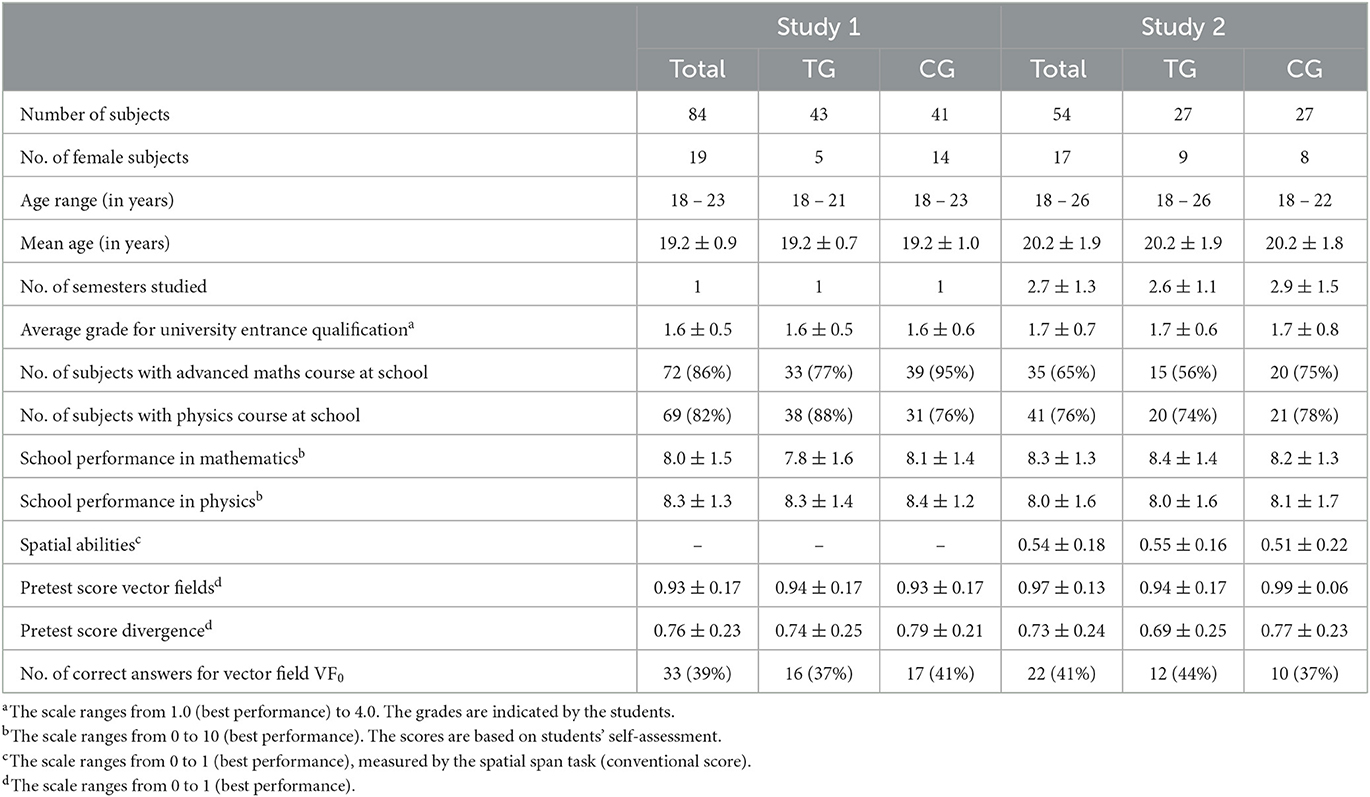
Table 1. Sample data of study 1 (Left) and study 2 (Right; treatment group TG, control group CG, number No.).
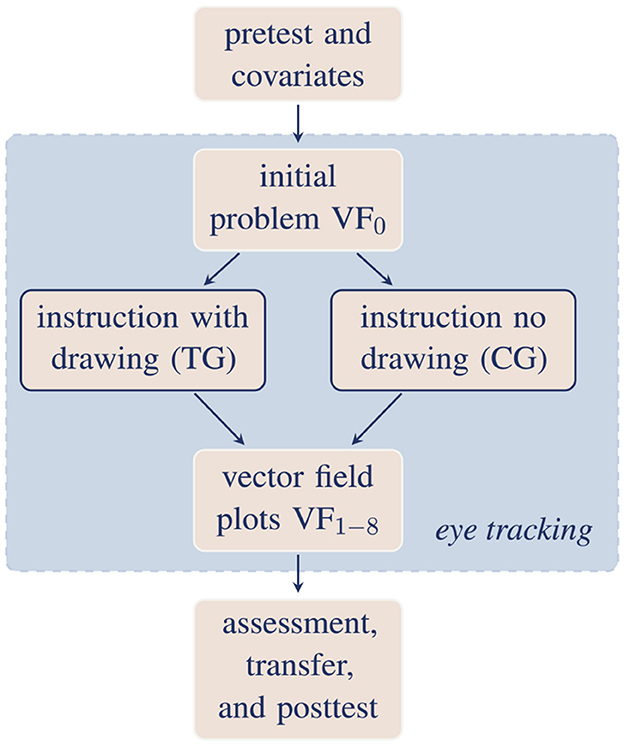
Figure 2. Study design for study 1 (beige) and 2 (extension in blue; treatment group TG, control group CG). All parts of study 1 are colored in beige. In study 2, for the initial problem VF0, the instruction, and the problem-solving task after instruction additional eye-tracking data was collected (colored in blue).
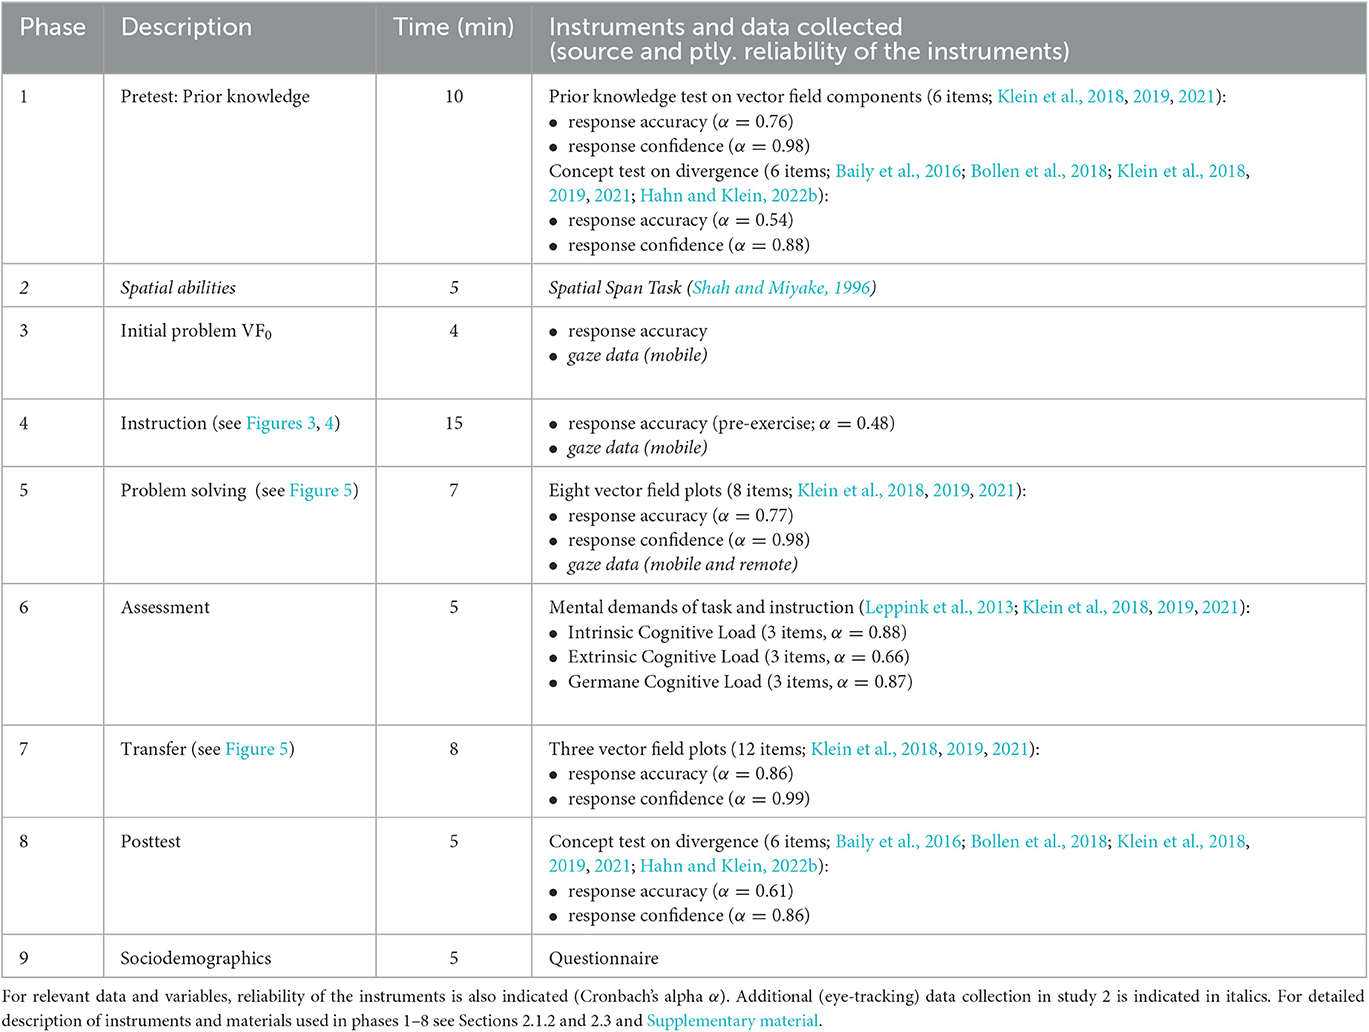
Table 2. Study procedure (including approximate time) and overview of instruments and data collected for study 1.
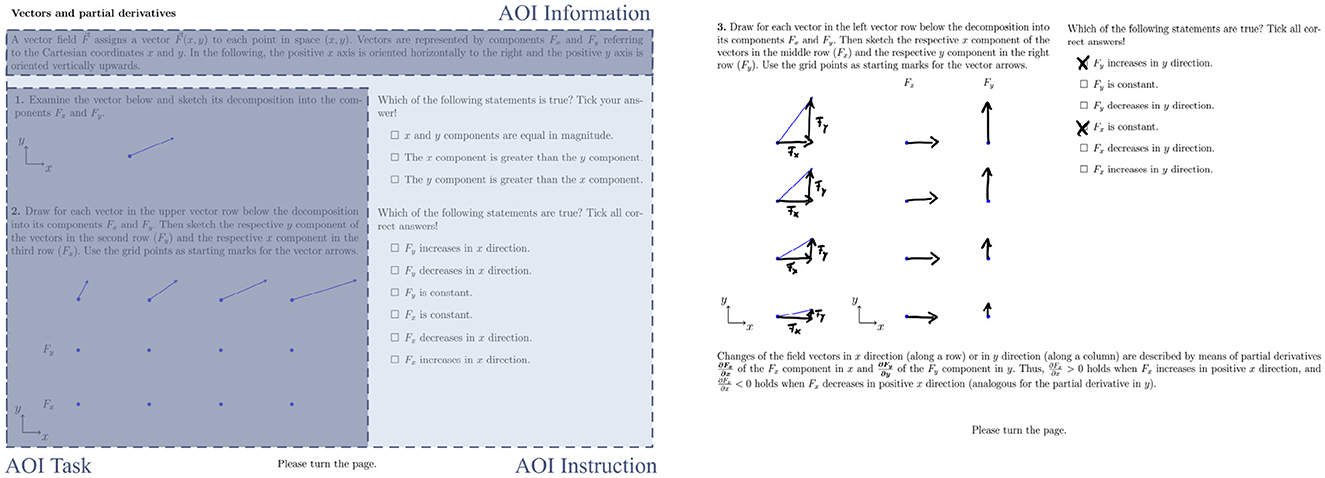
Figure 3. Two-sided pre-exercise on vector components and partial derivatives with drawing activities (treatment group) translated from originally German (the original instruction can be found in the Supplementary material). The second pre-exercise page shows an exemplary completion of the task (Right). In the exercise without drawing activities, the decomposition tasks (left side of the page, respectively) are to be completed without drawing vectors (control group). Definition of AOIs for the first pre-exercise page is marked in blue (Left). The AOIs for both pages are defined identically covering the whole instruction (AOI Instruction), the decomposition tasks (AOI Task), and a definition/information about vector fields or partial derivatives (AOI Information), respectively.
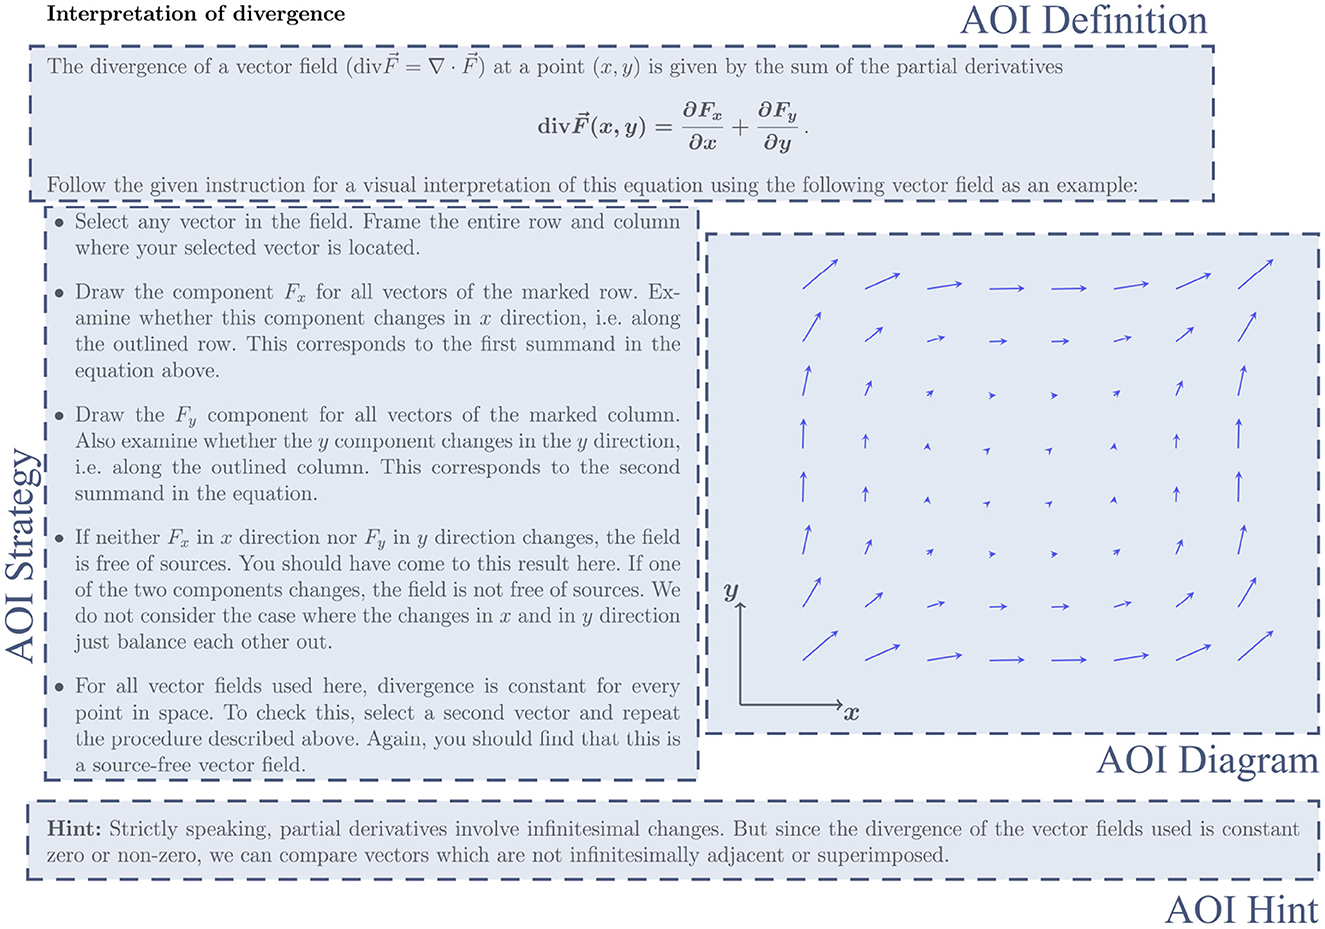
Figure 4. Instruction on visually interpreting divergence of vector fields with drawing activities (treatment group) translated from originally German (the original instruction can be found in the Supplementary material). The explanatory text aims at drawing vector components into the adjacent vector field diagram in order to infer the fields' divergence. In the instruction without drawing activities, the explanatory text asks for a mental decomposition of the vectors (control group). The defined AOIs for eye-tracking analysis are marked in blue. The AOIs follow the structure by Klein et al. (2019) covering the definition of divergence (AOI Definition), the instructional text (AOI Strategy), the vector field plot (AOI Diagram), and the concluding note (AOI Hint).
2.1.2. Study design, procedure, and data analysis methods
Study 1 uses a mixed design including within- and between-subjects treatments (Figure 2). The study procedure is summarized in Table 2 including an overview of all instruments and data (see Section 2.3 and the Supplementary material). First, students took a prior knowledge test, where they were asked to judge whether field components in a vector field diagram equal zero or not, and a pretest that included conceptual questions about divergence. The students then completed a three-page instruction including a pre-exercise on vector decomposition and partial derivatives (Figure 3) and an instruction on divergence (Figure 4) either with drawing activities (treatment group TG) or without drawing activities (control group CG; instructional material adapted from Klein et al., 2018, 2019, 2021). The group assignment was randomized by recitation group, where students selected a fixed recitation group by their own without knowing about the assignment to a treatment condition and about other group members. After finishing the instruction, the students took the posttest. It included several problem-solving tasks with vector field plots (Figure 5), several transfer tasks on partial derivatives, and the conceptual pretest questions on divergence. Last, students' perceived cognitive load and sociodemographic data have been collected. No significant differences between the two groups (treatment and control group) regarding various sociodemographic data and performance indicators were found (Table 1, Left).
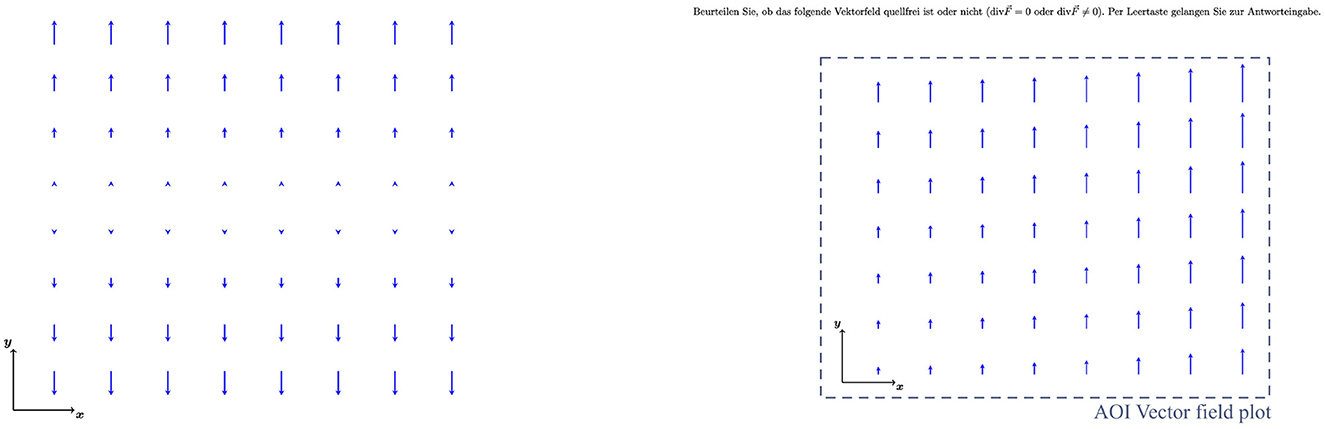
Figure 5. Examples of vector field diagrams used in the problem-solving tasks and the transfer tasks (Left; further development of Klein et al., 2018, 2019, 2021) and AOI definition (Right).
For data analysis, within-subjects effects are investigated through pre and post comparisons of students' achievement in the concept test on divergence and in judging a fields' divergence (initial problem VF0 and VF5 from the problem-solving phase). Here, standard methods of quantitative statistics (e.g., t-tests) were used by referring to the interpretation of Cohen (1988). Additionally, treatment and control group were statistically compared with respect to students' perceived cognitive load as well as their response accuracy and confidence during problem solving, in the transfer task, and in the posttest.
2.2. Study 2
2.2.1. Participants
The sample of study 2 was drawn from physics students at the same German university than study 1 in the context of a large-scale second-semester physics lecture on electromagnetism. Prior to the study, students received a short introduction to vector fields in the context of electric and magnetic fields in the lecture. In total, 54 students (17 female, average age 20.2 years), mostly in their second year of study, participated in the study (for further characterization of the sample see Table 1, Right). Again, students' pretest scores indicated sufficient prior knowledge to understand the subsequent instruction.
2.2.2. Study design and procedure
Study 2 uses the same mixed design as study 1 including drawing activities as between-subjects treatment (Section 2.1.2, Figure 2, Table 2, and Figures 3, 4). Subjects participated voluntarily in the study and were compensated with 20€. Group assignment was randomized before the start of the study and students were guided individually to the eye-tracking laboratory. After prior knowledge assessment, a standardized test on spatial abilities was administered (Spatial Span Task; Shah and Miyake, 1996), which measures the ability to simultaneously process and hold spatial information in memory. In addition to the performance measures from study 1, eye tracking was used to capture gaze behavior during instruction and problem solving (Section 2.4). Again, no significant differences between treatment and control group regarding various sociodemographic data and performance indicators were found (Table 1, Right).
2.3. Materials and measures
Pre-exercises and divergence instruction. The instruction on visually interpreting the divergence of vector fields included preliminary exercises addressing component decomposition and assessment of component change along an isolated row or column, in other words, partial derivatives (Figure 3). The following instruction on a visual interpretation of divergence consisted of a short introduction, an explanatory text with an adjacent vector field diagram, and a concluding note (Figure 4). The pre-exercise and the divergence instruction differed between treatment and control group in that students in the treatment group were asked to draw the vector components, while students in the control group constructed them mentally. Based on the sketched or mentally represented components, the changes of the components in the direction of the Cartesian coordinates (the partial derivatives), had to be evaluated (pre-exercises) and conclusions about the fields' divergence had to be drawn (divergence instruction). Construction and design of the instruction were based on materials used in prior studies (Klein et al., 2018, 2019, 2021).
Problem solving and transfer: Vector field plots. The vector field diagrams used in the study met certain requirements (Singh and Maries, 2013; Klein et al., 2018); first, the vector fields were created not to reflect any physical reality in order to exclude recognition effects. Second, the length scales were to be interpreted arbitrarily (any non-zero constant equals 1 or -1 by definition), and third, the dependencies of the vector field components were at most linear. Last, all vector fields were embedded in two-dimensional Cartesian coordinate systems, represented with approximately 25 arrows. Examples are given in Figure 5. For the problem-solving tasks, students were asked to indicate if a given vector field plot has zero or non-zero divergence. In the transfer task, it was asked for weather the partial derivatives are < 0, > 0, or = 0. In study 2, the first four vector field plots VF1−4 as well as the second four vector field plots VF5−8 were designed in parallel.
Divergence concept test. For assessment of conceptual knowledge regarding the divergence of vector fields, a concept test including six items was deployed. The items were designed in multiple-choice or true-false format. Most of them were taken from established concept tests on electrodynamics (CURrENT) or have been used and validated in a similar form in previous studies (Baily et al., 2016; Bollen et al., 2018; Klein et al., 2018, 2019, 2021). An example item is “The divergence can be different for every spot in the field” (Baily et al., 2016; translated for the study into German).
Questionnaire on cognitive load. The questionnaire addressing the mental demands of instruction and task processing consisted of nine items from an established instrument for measuring cognitive load (Leppink et al., 2013). All three types of cognitive load are addressed by three items each. A fourth item, which was originally dedicated to measure germane cognitive load, was omitted due to insufficient fit.
For both studies, the same materials were used.
2.4. Eye-tracking procedure, areas of interest, and data analysis methods (study 2)
Eye-tracking data collection was two-fold: Mobile eye tracking was used during instruction reading and solving the first four vector field problem-solving tasks VF1−4 and remote eye-tracking was used while working on the last four vector field diagrams VF5−8. While remote eye-tracking was used to collect data for all 54 students, in the mobile eye-tracking phase due to technical capacities only the gaze of 33 students was tracked.
Mobile gaze data was recorded using wearable eye-tracking glasses from Tobii (Tobii Pro Glasses 3) with a sampling rate of 50Hz and an accuracy of 0.6° visual angle. Tobii Glasses software and a one-point system-controlled calibration including a calibration card was used for data collection. Further, all materials were provided on large-scale paper sheets and on a tripod to enable a perpendicular viewing angle. One participant had to be discarded from analysis due to data loss caused by technical issues.
The last four problem-solving tasks were presented on a 24-inch computer screen (1920 × 1080 pixel resolution, 60Hz frame rate) and eye movements were recorded using a stationary head-free eye-tracking system from Tobii (Tobii Pro Fusion). The eye tracker operates with an accuracy of less than 0.3° visual angle and a sampling frequency of 120Hz. A 9-point calibration was used and agreement between the measured gaze positions and the actual points on the screen was checked by the experimenter. Calibration was repeated if the accuracy result was not satisfactory. A calibration plot showed error bars for each of the nine positions, indicating the differences between the gaze point calculated by the eye tracker and the actual dot position. When the eye tracker could not detect enough calibration data, the participant was re-positioned in front of the eye tracker and checked for any factors that could have been interfering with pupil detection. After careful checking of calibration results, one participant had to be discarded due to insufficient fit. Average distance between participant and screen was 64cm.
For all gaze data, the distinction between fixations and saccades was made using a velocity threshold of 30°/s (Tobii I-VT Fixation Filter; Olsen, 2012). Data visualization and analysis was performed using Tobii Pro Lab 1.204 software. First, mobile eye-tracking data was mapped to the corresponding instruction and problem-solving pages by also marking whenever students were focusing outside the worksheet, on their hand, or the answer sheet. Then, areas of interest (AOIs) were defined for quantitative analysis of all three instruction pages (Figures 3, 4). For gaze-data analysis during problem solving, one area of interest covering the vector field diagram was defined for all eight tasks (Figure 5, Right). Due to the identical design of the problem-solving pages, same-sized AOIs could be placed at the same position for all eight tasks.
To investigate differences in cognitive processing of the instruction, fixation count, mean fixation duration, and time to first fixation are compared between both groups (with and without drawing activities) by analyzing visual attention distribution on the defined AOIs of the pre-exercises and the divergence instruction. As total fixation duration and fixation count were found to be dependent, thus showing analogous effects, only fixation count is reported (Susac et al., 2019). Furthermore, to analyze gaze behavior on the vector field diagram during problem solving, process-based metrics—that are, proportion and length of horizontal and vertical saccades within a tolerance margin of ±5°—are analyzed. For mobile eye tracking, saccades (and transitions) were mostly not tracked correctly as the eye-tracking glasses seem to lose track during gaze movement. This was indicated by comments such as “EyesNotFoundMovement” and “UnknownEyeMovement” in the raw gaze data. Thus, for mobile gaze-data analysis, only fixation-based metrics—that are, fixation count, mean fixation duration, and time to first fixation—are used (see Discussion Section 4.3). All comparisons are conducted by use of standard methods of quantitative statistics (e.g., t-tests) and by referring to the interpretations of Cohen (1988).
3. Results
3.1. Study 1
Students' performance improved after instruction, as shown by the increase in their accuracy in the concept test (from 0.76 ± 0.23 to 0.85 ± 0.21) and in solving the initial problem (from 0.39 ± 0.49 to 0.81 ± 0.40) reflecting small sized effects [t(83) = −3.0, p = 0.004, d = 0.32 and , p < 0.001, OR = 1.098; Figure 6]. After instruction, students' problem-solving and transfer scores were 0.85 ± 0.23 and 0.74 ± 0.26, respectively. Further, response confidence in the concept test increased significantly with large effect size [t(83) = −8.4, p < 0.001, d = 0.92].
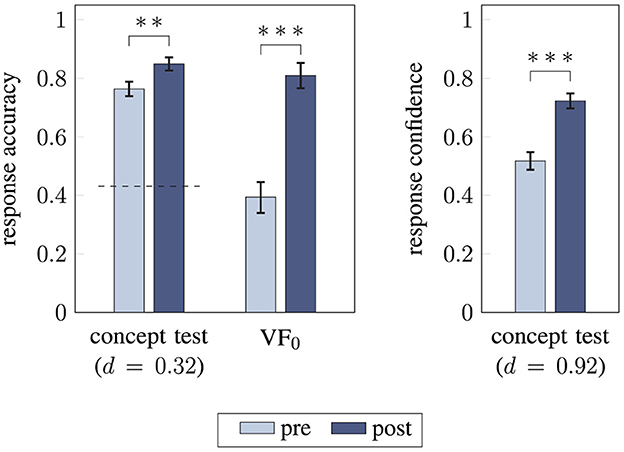
Figure 6. Comparison of students' performance before and after instruction using paired t-tests and McNemar-test (two-sided). Response accuracy for concept test and initial problem (Left) as well as response confidence for the concept test (Right) are compared between pre and post (**/*** statistical significance (p < 0.01 / p < 0.001), effect size d, the dashed line indicates the guessing probability, error bars represent 1 SEM).
While working with the instruction, students in the treatment and the control group answered the included questions equally [0.89 ± 0.18 and 0.90 ± 0.16 respectively, p = 0.80]. After instruction, the problem-solving score and the concept test score did not differ significantly between treatment and control group (p = 0.14 and p = 0.85) with both groups reaching performances above 80% (Figure 7; for example, for problem solving 0.88 ± 0.22 for the treatment group and 0.81 ± 0.23 for the control group). Students in the treatment group scored higher in the transfer tasks than those in the control group (0.81 ± 0.20 and 0.67 ± 0.31, respectively) and this difference was statistically significant with medium effect size [Welch t(66.9) = 2.3, p = 0.02, d = 0.51]. Additionally, students' confidence level in the treatment and the control group differed significantly in both the problem-solving and the transfer tasks, with medium effect sizes [Welch t(72.5) = 2.5, p = 0.02, d = 0.55 and t(82) = 2.9, p = 0.004, d = 0.64]. For the concept test, no such effect was found (p = 0.08). Additionally, there were no significant interaction effects between time and group for response accuracy or response confidence in the concept test (p = 0.41 and p = 0.91).
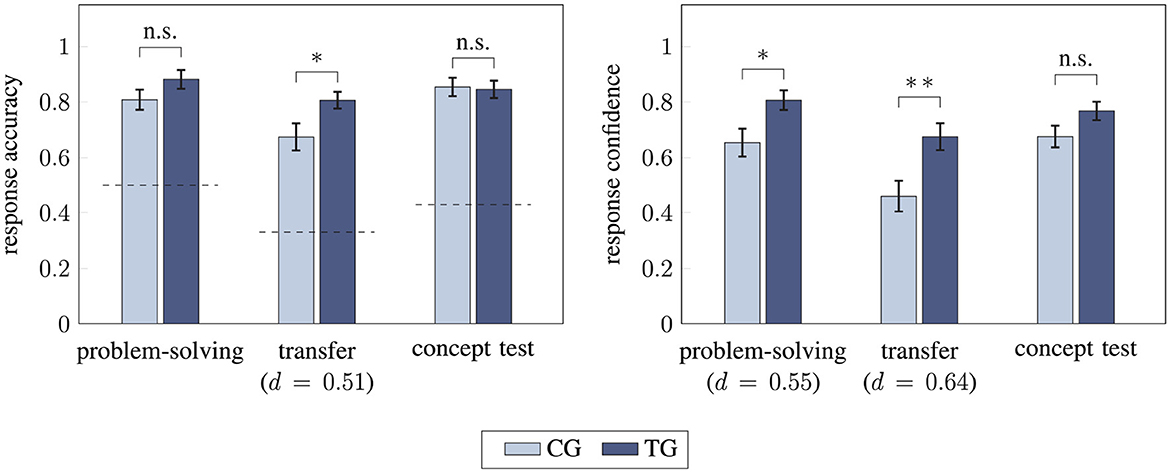
Figure 7. Comparison of students' performance in control and treatment group using unpaired (Welch) t-tests (two-sided). Response accuracy (Left) and response confidence (Right) for the problem-solving tasks, the transfer tasks, and the concept test are compared between treatment group (TG) and control group (CG; */** statistical significance (p < 0.05/p < 0.01), n.s. “(statistically) not significant” indicating p-values > 0.05, effect size d, the dashed lines indicate the guessing probability, error bars represent 1 SEM).
Furthermore, students in the treatment group reported significantly lower intrinsic cognitive load and higher germane cognitive load compared to those in the control group (Figure 8). The differences in intrinsic and germane cognitive load had small effect sizes [t(82) = −2.2, p = 0.02, d = 0.47 and t(82) = 1.7, p = 0.0045, d = 0.37]. No significant difference was found in extraneous cognitive load between the two groups (p = 0.66).
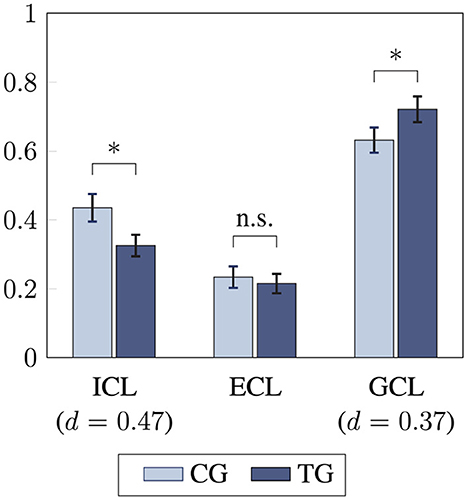
Figure 8. Comparison of students' perceived cognitive load in control and treatment group using unpaired t-tests (one-sided). Intrinsic cognitive load (ICL), extraneous cognitive load (ECL), and germane cognitive load (GCL) are compared between treatment group (TG) and control group (CG; * statistical significance (p < 0.05), n.s. “(statistically) not significant” indicating p-values > 0.05, effect size d, error bars represent 1 SEM).
3.2. Study 2
3.2.1. Mobile eye-tracking analysis of pre-exercise and divergence instruction
Students fixation count on the vector field diagram of the initial problem VF0 was 26.4 ± 19.5 with a mean fixation duration of (0.59 ± 0.39) s, which did not significantly differ between treatment and control group (p = 0.91 and p = 0.91). In average, students visited the first pre-exercise page (177.37 ± 73.15) s, the second pre-exercise page (122.5 ± 48.5) s, and the divergence instruction page (232.6 ± 93.5) s. Average visit durations differed significantly between the groups (p < 0.001, p < 0.001, and p = 0.004, respectively). More precisely, the treatment group visited all three pages significantly longer: the pre-exercise pages (383.1 ± 73.6) s [vs. (205.6 ± 33.4) s for the control group] and the divergence instruction page (275.4 ± 83.5) s [vs. (184.1 ± 81.5) s for the control group]. Results of detailed gaze analysis for the defined AOIs on the pre-exercise pages and the divergence instruction page are summarized in Table 3.
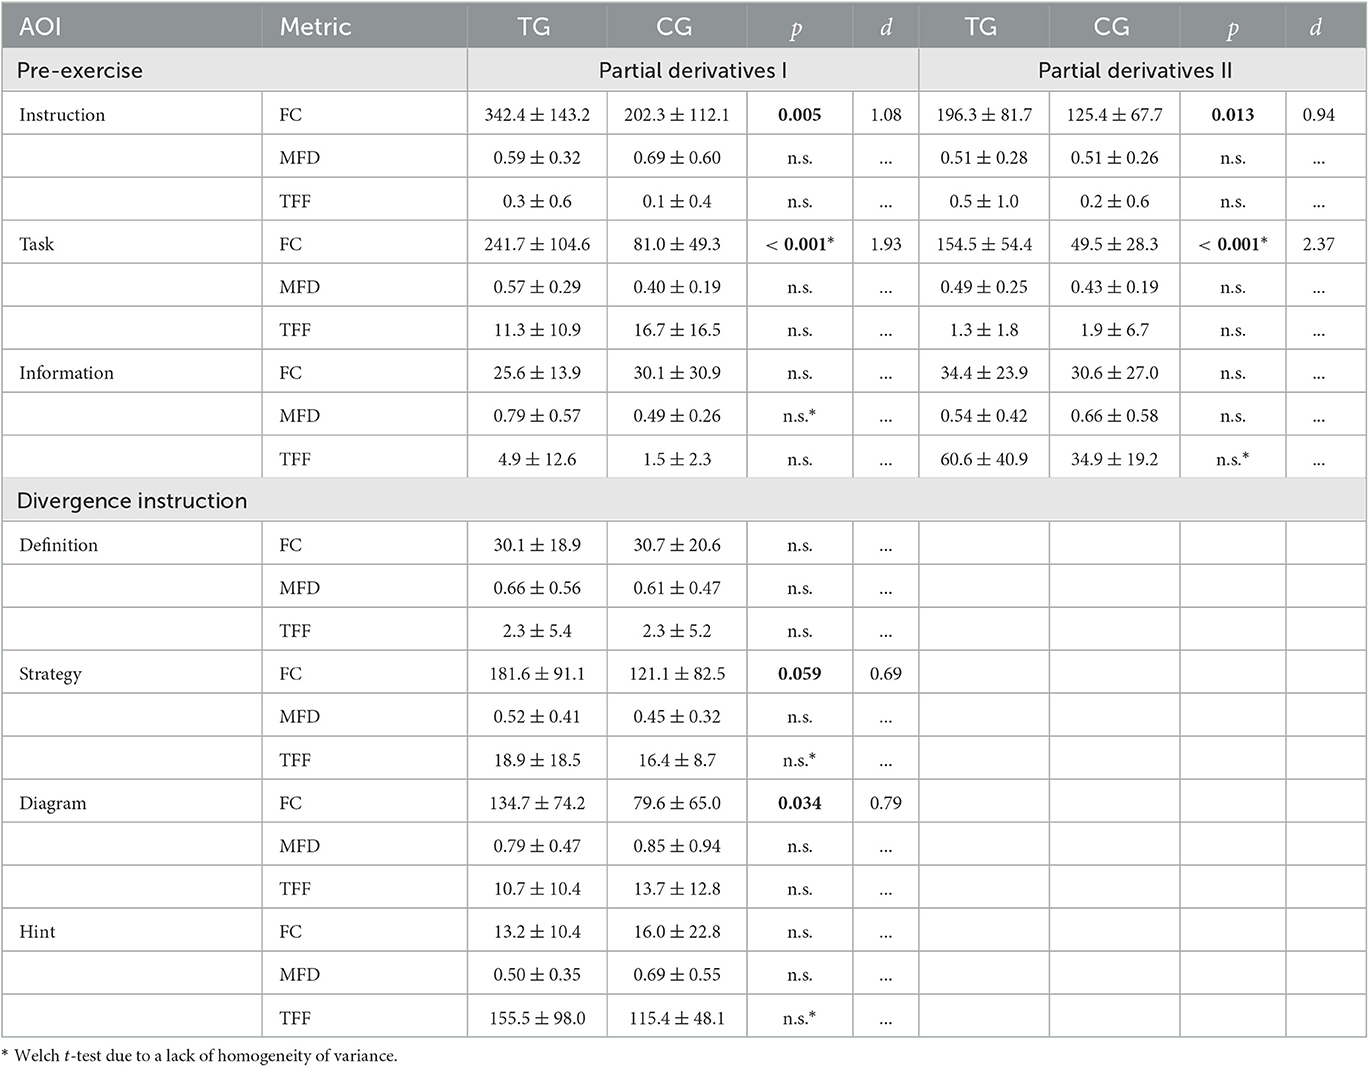
Table 3. Comparison of fixation count (FC), mean fixation duration (MFD in s), and time to first fixation (TFF in s) for the defined areas of interests (AOIs) on pre-exercises and divergence instruction between treatment group (TG) and control group (CG; mean, standard deviation, p-values of two-sided (Welch) t-tests for independent samples, n.s. “(statistically) not significant” indicating p-values > 0.05, effect size d; gaze data was recorded using mobile eye tracking).
AOI-based analysis of visual behavior during completion of the pre-exercises on vector components and partial derivatives showed that students in the treatment group focused more frequently on the entire pre-exercise (AOI Instruction) and particularly on the drawing prompt (AOI Task). For both pre-exercise pages large differences were observed. These results suggest that students in the treatment group paid more attention to the task when they were asked to draw. Regarding the mean fixation duration and the time to first fixation on the defined AOIs, no group differences were found.
For the instruction on divergence, analysis revealed a significant between-subjects effect for the vector field diagram. It was more frequently fixated by students in the treatment group with medium effect size [t(30.0) = 2.2, p = 0.034 d = 0.79]. Further, the instructional strategy was more often fixated by the treatment group with medium effect size [t(30.0) = 2.0, p = 0.059, d = 0.69]. Neither the definition nor the hint were shown to be treated visually different by both groups. Regarding the mean fixation duration and the time to first fixation, no group differences were found. However, Table 3 indicates that students read the instruction from the top to the bottom, whereas the diagram was fixated slightly faster than the strategy by the treatment group [(18.9 ± 18.5) s strategy vs. (10.7 ± 10.4) s diagram] and the control group [(16.4 ± 8.7) s strategy vs. (13.7 ± 12.8) s diagram].
3.2.2. Mobile eye-tracking analysis VF1−4 and remote eye-tracking analysis of VF5−8
In the first part of the assessment (mobile eye tracking, VF1−4), the subjects' average total visit duration on the four task pages was (43.0 ± 13.6) s with no differences between the groups (p = 0.20). Additionally, the average fixation count of all subjects was 32.9 ± 18.9 with a mean fixation duration of (0.54 ± 0.34) s. Comparison of fixation-based metrics on the vector field diagram revealed no significant differences between treatment and control group (Table 4). A tendency for the control group to look at the diagram more frequently was observed, but it was not statistically significant.
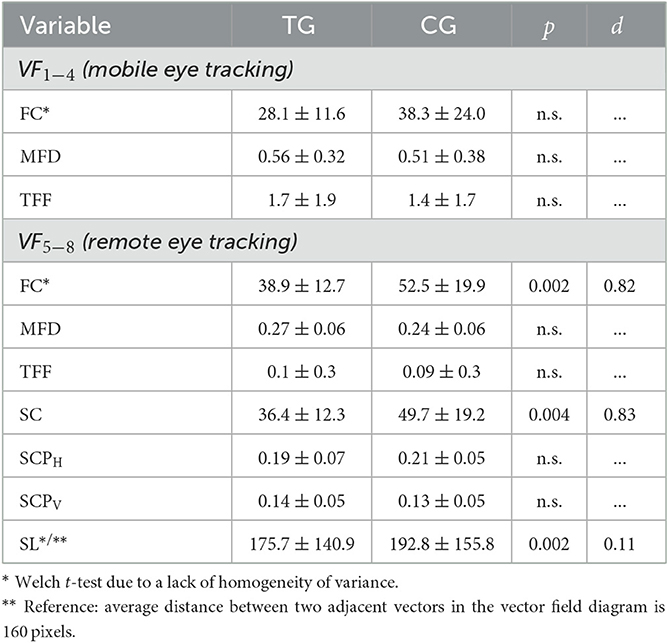
Table 4. Comparison of fixation count (FC), mean fixation duration (MFD in s), and time to first fixation (TFF) on the vector field diagram for vector field plots VF1−8 and saccadic count (SC), proportion of horizontal and vertical saccades (SCPH and SCPV), and saccadic length of horizontal and vertical saccades (SL in pixels) on the vector field diagram for vector field plots VF5−8 between treatment group (TG) and control group (CG; mean, standard deviation, p-values of two-sided (Welch) t-tests for independent samples, n.s. “(statistically) not significant” indicating p-values > 0.05, effect size d).
In the second part of the assessment (computer-based remote eye tracking, VF5−8), subjects spent in average (18.7 ± 7.1) s on the four task pages, without significant group differences (p = 0.08). Eye-tracking analysis for selected metrics on the vector field diagram are summarized in Table 4. By comparing treatment and control group, students in the treatment group fixated significantly less and performed significantly less saccades with large effect sizes [Welch t(51) = −3.0, p = 0.002, d = 0.82 and t(51) = −3.0, p = 0.004, d = 0.83]. In addition, mean fixation duration did not differ significantly between the groups, with the fixation duration varying between different fixations (Figure 9, Right). Further, there was a tendency for students in the control group to perform a higher percentage of horizontal saccades and for students in the treatment group to perform a higher percentage of vertical saccades than the respective other group; but no significant differences were found. The saccade plots (Figure 9, Left) indicate symmetrical gaze behavior along the coordinate directions for both groups. Oblique gaze directions were hardly found, regardless of group assignments. Last, students in the treatment group made significantly shorter horizontal and vertical saccades on the diagram with small effect size [Welch t(2867.4) = −3.1, p = 0.002, d = 0.11]. Average saccade length of the horizontal and vertical saccades on the diagram corresponds approximately to the distance between adjacent vectors (see Figure 9, Right). Regarding the time to first fixation, no group differences were found.
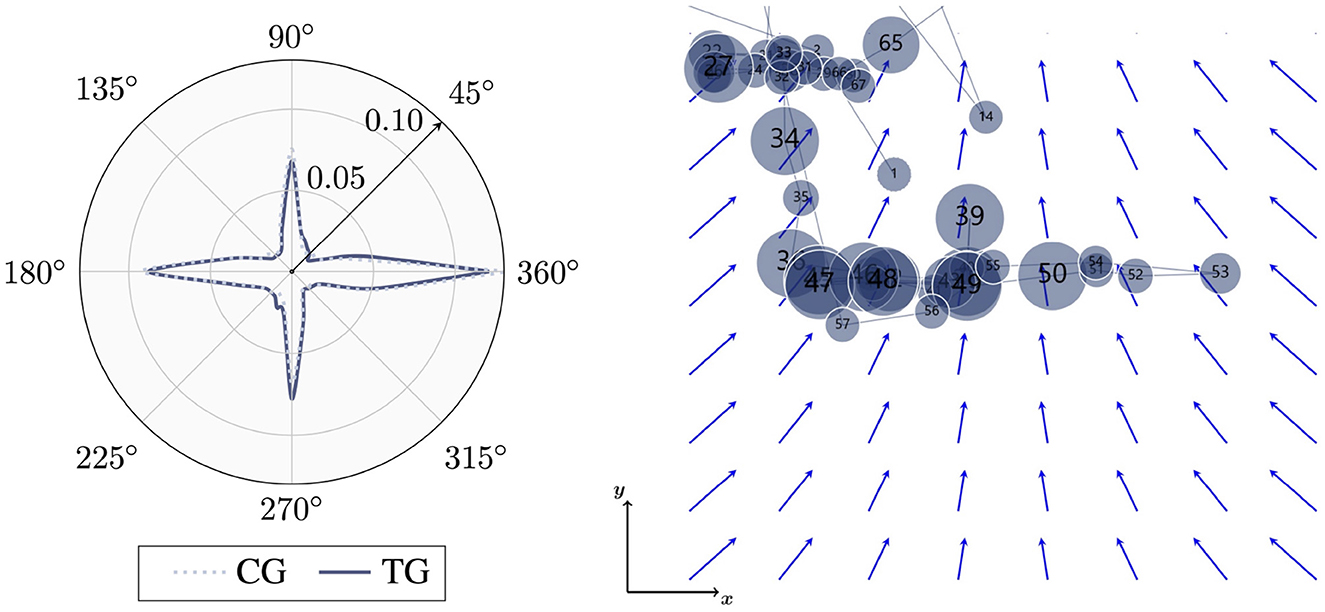
Figure 9. Polar distribution of saccade directions on the vector field diagrams VF5−8 for treatment group TG and control group CG (Left) and scanpath of a student from the treatment group (fixations are visualized by numbered circles; circle size relates to fixation duration) visually comparing adjacent vectors (Right). Gaze data was recorded using remote eye tracking.
4. Discussion
In general, the instruction used in this study is based on prior work by Klein et al. (2018, 2019, 2021), which has been expanded upon theory and empirical findings by drawing activities and pre-exercises on vector decomposition and partial derivatives. Specifically, the prior work comprises eye-tracking studies that analyzed gaze behavior during instruction processing and subsequent problem-solving, which is also part of this study. Moreover, the study sample used in the prior studies and in this study are comparable, as all participants were first-year students at a German university with comparable prior knowledge. Due to the material development and a comparable study design and sample, in the following, the results of this study will be discussed in reference to the aforementioned prior work.
4.1. Study 1
4.1.1. Impact of pre-exercise and divergence instruction on students' achievement (RQ1)
Before instruction, students showed high prior knowledge regarding decomposition of vectors and a high conceptual understanding of divergence (Table 1). But only 39% of them were able to evaluate the divergence of a vector field diagram—a finding that was also reported by previous studies (Singh and Maries, 2013; Baily et al., 2016; Klein et al., 2018, 2019, 2021). After instruction with or without drawing activities, students' accuracy in judging a vector field's divergence and even their response accuracy and confidence in the concept test increased significantly. Then, 81% of the students evaluated the divergence of the initial vector field correctly. Moreover, they achieved a mean score of 85% for all eight vector fields in the problem-solving phase as well as for the concept test. These results underline the educational impact of the instruction, on the one hand, and going beyond, further emphasize the value of instructional support using multiple representations for complex physics concept, on the other hand.
Compared to previous, very similar studies, where students achieved scores of 69% after completing an integral and a differential instruction (Klein et al., 2018) and 77% after being instructed with or without visual cues (Klein et al., 2019), the instruction used here was able to contribute to an even higher improvement in judgment of a vector field's divergence. These findings particularly indicate the added value of the pre-exercises on vector decomposition and partial derivatives which support specific engagement with and learning of the two main concepts that are crucial for divergence. Following theories from cognitive psychology, by staggering the instruction as a step-by-step guide to the main explanation on divergence, the instruction is adapted to the limited working memory capacity (Baddeley, 1986; Rosenshine, 1995). In light of such an instruction as a step-by-step strategy, one could argue that students just learned how to follow the steps, but did not get a superordinate understanding of the underlying concepts—that are, vector decomposition and partial derivatives. However, the high transfer score (74%) referring to superordinate knowledge of partial derivatives beyond divergence, speaks against this effect and indicates an actual growth in conceptual understanding of students from both groups. This conclusion can be supported by comparing the findings with results from Klein et al. (2019), who referred to a matched transfer score of 54% when judging divergence and curl.
4.1.2. Impact of drawing activities on performance measures and cognitive load (RQ2, RQ3, H1)
The instructional support in the treatment group included drawing activities, such as highlighting rows and columns or sketching vector components, which was not provided in the control group. Comparing the results in the transfer tasks (loosely linked with the instruction) students from the treatment group performed particularly better and responded with higher confidence. The transfer tasks covered the concepts of covariation and partial derivatives, and went beyond mere step-by-step instructions on divergence. Our conclusion is that the drawing activities significantly enhanced students' understanding of vector fields and related concepts, such as covariation. Moreover, significant between-subject effects concerning students' perceived intrinsic and germane cognitive load indicated that the drawing activities supported and facilitated students' learning. As germane cognitive load refers to working memory resources that the learner devotes dealing with the matter to be learned, high values of germane cognitive load are associated with targeted devotion of working memory resources and optimized instructional procedures (Sweller, 2010). The aforementioned findings are in line with theories from cognitive psychology that promoted drawing as a powerful learning strategy in multi-representational learning environments by enhancing an effective use of working memory capacities (Bilda and Gero, 2005; Ainsworth et al., 2011; Kohnle et al., 2020; Ainsworth and Scheiter, 2021).
Comparisons between two groups during problem solving and in the concept test on divergence (close to instruction) showed that drawing activities did not yield to better performance, but students had more confidence in their answers. The latter is an equally positive outcome of effective teaching (Lindsey and Nagel, 2015; Klein et al., 2017, 2019). With students from the treatment group achieving a mean score of 88% during problem solving, drawing generated even higher learning outcomes then instructional support including visual cues (82% accuracy; Klein et al., 2019). Similar high performance scores during problem solving were also found for the control group (81%), indicating ceiling effects. These results imply that for tasks close to instruction, the impact of pre-exercises prevailed effects caused by the drawing activities. Here, further research regarding the actual impact of the pre-exercises by systematic manipulation of the instruction is required. Additionally, the positive correlation between performance and confidence that was found in previous studies also regarding instruction-based learning of divergence (Lindsey and Nagel, 2015; Klein et al., 2017, 2019) could be confirmed in this study.
4.2. Study 2
4.2.1. Visual processing of pre-exercises and divergence instruction (RQ4a)
During the instruction, students completed two pages of pre-exercises focused on vector decomposition and partial derivatives and one main instruction page on a visual interpretation of divergence. Since mean fixation duration did not differ between treatment and control group, it can be assumed that students invested the same cognitive effort for learning (Rayner, 1998; Ozcelik et al., 2009). Analysis of the average visit duration regarding the instructional material revealed significant group differences, i.e., students from the treatment group visited all three pages longer than students from the control group. More precisely, the treatment group spent almost twice as much time on the pre-exercise pages compared to the control group, while both groups scored high in the questions contained. Gaze differences were particularly found to result from more frequent fixations on the decomposition task stems. In this process, students systematically manipulated x or y components of vectors, either through drawing or mental imagination, to describe their changes along a row or column. Based on the eye-mind hypothesis, the drawing tasks facilitated a deeper processing of vector decomposition and the evaluation of their changes along coordinate directions, as represented by partial derivatives (Wu and Liu, 2022). Moreover, as both groups spent most of the time fixating the decomposition tasks, it can be assumed that pre-exercises provided a helpful foundation for the subsequent instruction on divergence.
In reference to the visual treatment of the divergence instruction, the findings from Klein et al. (2019) can be drawn upon, as the authors conducted eye-tracking analysis on a similar instruction that included and excluded visual cues. Average visit duration in the study by Klein et al. (2019, 106.8 ± 35.9 s) was similar to the control group's average visit duration in the study reported here, whereas the treatment group's average visit duration was found to be significantly higher. Moreover, definition of AOIs revealed that visual behavior on the diagram reflected the largest difference between students instructed with and without drawing activities—a result, that was also found by Klein et al. (2019, 2021). In general, while here fixation-based metrics for the AOIs Diagram and Strategy were higher compared to the results reported by Klein et al. (2019), visual attention on the AOIs Definition and Hint was less pronounced. In the study reported here, students fixated most on the AOIs Strategy and Diagram, whereas results for the control group in this study were mostly similar to the treatment group in the study by Klein et al. (2019). Thus, visual attention in this study was not evenly distributed over the whole divergence instruction page, but focused on the vector field diagram and the adjacent instructional text. This asymmetric distribution was particularly pronounced for the treatment group. By comparing the eye-tracking results of the previous study by Klein et al. (2019) with those of the study presented here, it thus appeared that drawing activities in the divergence instruction lead to even higher visual attention and, following the eye-mind hypothesis, deeper cognitive processing of the instruction's kernel than adding visual cues to the diagram (Wu and Liu, 2022). This is particularly remarkable since Klein et al. (2019) did not introduce a pre-exercise on component decomposition and partial derivatives which already prefigured central aspects of the divergence instruction. These findings are in line with previous results and theories from cognitive psychology reporting that drawing supported a deeper engagement with details and important parts within a learning environment (Hellenbrand et al., 2019; Kohnle et al., 2020; Ainsworth and Scheiter, 2021). This further underlines the educational impact of drawing activities. As such, eye-tracking data analysis during instruction-based learning allowed to explain the group differences regarding response confidence and cognitive load during problem solving (Section 4.1.2). However, it has to be noted that in the study by Klein et al. (2019) definition and hint were more elaborated than in the present study. Additionally, when comparing study results, the impact of the administration format needs to be taken into account, as in the studies by Klein et al. (2019, 2021) students completed the instruction on a computer screen and in the study reported here the instruction was given on physical paper sheets. Further, Klein et al. (2019, 2021) used remote eye-tracking, while in this study mobile gaze-data analysis was exploited (discussion see Section 4.3).
4.2.2. Gaze behavior during problem-solving (RQ4b)
In the problem-solving phase, visual behavior was analyzed using mobile as well as remote eye tracking. Comparing students visual behavior on VF1−4 with the initial problem VF0 indicated that both instructions (with and without drawing activities) influenced students' visual handling of vector field diagrams. While no significant group differences for the first four tasks were found (discussion see Section 4.3), students from the treatment group performed significantly less fixations and saccades on the vector field diagram then students from the control group—a tendency that, however, was also indicated in the mobile gaze data. Since there were no differences in the mean fixation duration, this result also means that students from the treatment group needed less time for responding. In previous research, fewer fixations, and thus fast finding of a solution was shown to be associated with expertise (Reingold et al., 2001; Chi, 2006; Susac et al., 2014; Klein et al., 2018). In line with the theory of long-term working memory, which says that experts encode and retrieve information more rapidly than novices (Ericsson and Kintsch, 1995), fewer fixation counts are indicators of such rapid procedures (Gegenfurtner et al., 2011).
Moreover, students in the treatment group were shown to perform significantly shorter horizontal and vertical saccades on the vector field diagram. Since their mean length was close to the mean distance between two adjacent vectors, they exhibited behaviors that indicate a systematic comparison of adjacent vectors along coordinate directions (Figure 9, Right). These findings are in line with results in a previous study by Klein et al. (2018), where best-performing students were found to perform significantly shorter saccades compared to worst-performing students. Moreover, a study by Chen et al. (2014), which investigated students' gaze behavior during working on text- and picture based physics concept tasks, revealed that the mean saccade distance negatively predicts the success of retrieval performance in picture presentations, suggesting a greater probability that students will answer correctly if they make shorter saccade movements. Hence, the positive effect of drawing activities for learning of divergence which was found regarding different performance and cognitive load indicators (Section 4.1.2) and which is in line with theories from cognitive psychology, could be further supported by gaze-data analysis during problem solving.
Furthermore, the proportion of horizontal and vertical saccades on the vector field diagram, showed no significant differences between treatment and control group, however, both groups performed over 30% of horizontal and vertical saccades. For reference, given an equal distribution of gaze directions, approximately 11% of all gaze directions would be horizontal and vertical saccades (referring to a tolerance margin of ±5°). As a high proportion of horizontal and vertical saccades was shown to indicate a systematic handling of vector field plots by reflecting comparisons of vector components along the coordinate directions (Klein et al., 2018, 2019), these findings suggest expert-like procedures for students from both groups. Saccadic angle polar distribution (Figure 9, Left) supported this result as a symmetric distribution, where horizontal and vertical directions are pronounced whereas oblique directions are avoided, was associated with expertise in previous studies (Klein et al., 2018, 2019, 2021). While horizontal eye movements were found to be commonly dominant, for example, when looking at pictures, due to oculomotor eye factors and cultural reading habits, vertical eye movements are atypical and, therefore, can be associated with conscious problem-solving processes (Foulsham et al., 2008; Klein et al., 2021).
4.3. Methodological consideration: mobile and remote eye tracking in learning and assessment scenarios
Previous eye-tracking studies commonly used remote gaze data collection to analyze learning and assessment behavior by presenting work sheets, instructions, or tasks on a screen (Hahn and Klein, 2022a). However, in interactive settings, such as drawing-based learning, this method can no longer be applied. Then, mobile eye-tracking glasses provide the possibility to analyze cognitive processes by enabling a nearly natural setting and by not hindering the constructive process (Hellenbrand et al., 2019; Jarodzka et al., 2021). In contrast to typical methods used in such scenarios, for example, questionnaires and interviews, mobile gaze data analysis allows to gather data during actual behavior, thus increasing objectiveness of the measurement (Mayr et al., 2009). However, to the best of our knowledge, only few studies exploited mobile eye tracking in learning scenarios thus far (Hahn and Klein, 2022a). By investigating mobile eye gaze during learning with a drawing-based instruction, study 2 contributes to this line of research.
Further, by examining the same problem-solving task with both mobile and remote eye-tracking, first indications for a comparison of both eye-tracking methods in STEM, and particularly physics, education research assessment scenarios can be provided. Reconsidering the eye-tracking results from a methodological perspective, it was noticeable that students spent more than twice as much time per task in the mobile eye-tracking phase compared to the remote eye-tracking phase. In addition to learning- and routine-related effects, it seems reasonable to assume that this difference was also due to the method of eye-tracking data collection. Recording with glasses is unfamiliar, particularly for non-eyeglass wearers, and makes them more aware of the tracking (Mayr et al., 2009). This can lead to uncertainty and might influence students' behavior during assessment. Additionally, working on paper allows for active manipulation of the materials beyond the intended drawings, for example, by marking or taking notes, which are not available when the stimulus is given on a screen (Mayr et al., 2009). Furthermore, in the study presented here, it was noticeable that the glasses provide higher values for mean fixation duration and time to first fixation, while fixation count is significantly lower compared to the remote eye-tracking data when completing the same task. Consequently, mobile eye tracking showed no significant group differences regarding fixation-based metrics while remote eye-tracking did. Again besides learning and routine-related effects, this might be due to the glasses lower sampling rate and accuracy (Mayr et al., 2009). Particularly, the intermediate step of (manually or automatically) mapping video-recorded eye-tracking data to two-dimensional snapshots of the materials affects data accuracy. In case of manual mapping, fixations shown in the video are manually assigned to the corresponding location on the snapshot; saccades, in contrast, are automatically transferred without mapping (Tobii Pro Lab 1.204 software). Given the large number of fixations per video, this requires high time expenditure and leads to great error potential (e.g., skipping of fixations, inaccurate positioning). As a consequence, small effects that require a high level of measurement precision, for example, when analyzing mean fixation duration, or investigation of small AOIs with only a few fixations, can not be resolved precisely by the mobile gaze data.
Additionally, manually mapped gaze data and fixed AOIs only allow to illustrate processes of minimal interaction with the environment. However, to track processes in constructive settings, automatic adapting AOIs are required which are rarely available thus far (Wolf et al., 2018). Moreover, a look at the raw data of the eye-tracking glasses showed incomplete recordings of gaze paths as saccades, in particular, were mostly not completely tracked although the eye tracker indicated to have recorded a high percentage of gaze samples. However, as the calibration was system-controlled, no individual adjustment could be done. Additionally, accuracy is reduced as calibration refers to a fixation distance of 0.5–1 m which, however, continuously changes during data collection—a problem that was also reported to occur in other settings (Mayr et al., 2009). Particularly, analysis of saccadic angles and lengths is strongly affected by the described sources of error. To summarize the experiences in this study, mobile eye tracking provided additional insight into students' cognitive processes during drawing-based learning, however, the data needs to be evaluated and interpreted with caution. Particularly in scenarios that require detailed analysis of specific (particularly small) AOIs or saccade-based procedures, for example, navigating along coordinate directions of vector fields, mobile eye-tracking data is hardly resilient which should be kept in mind in light of the high time requirements for gaze-data mapping.
4.4. Conclusion and future work
In this work, the impact of drawing activities in multi-representational, instruction-based learning in the context of vector fields was investigated in two studies through analysis of different performance measures and eye-tracking data. Besides showing an immense overall impact of the instruction on students' conceptual understanding and their accuracy of judging a vector field's divergence, drawing activities were shown to led to significantly higher learning outcomes in the transfer task. Furthermore, intrinsic cognitive load of the learning subject was lower for students instructed with drawing activities, which increased their germane cognitive load enabling to devote more working memory resources in dealing with the subject matter to be learned. Moreover, eye-tracking analysis revealed that students instructed with drawing activities fixated important parts of the pre-exercises and the divergence instruction, that are, decomposition tasks, vector field diagram, and instructional text, more frequently. During subsequent assessment, both groups showed representation-specific, expert-like behaviors, such as comparing vectors in horizontal and vertical direction along the Cartesian coordinates, indicating a correct interpretation of partial derivatives. Furthermore, students instructed with drawing activities were found to be more effective compared to students instructed without drawing activities by fixating the vector field diagram less frequently in order to determine its divergence, and to systematically compare adjacent vectors along coordinate directions.
Concerning the value of this article for STEM education, it extends previous research on learning in the context of vector fields by showing how dedicated pre-exercises on vector decomposition and partial derivatives, on the one hand, and drawing activities, on the other hand, can further enhance previous instructions on divergence (Klein et al., 2018, 2019, 2021). An explicit focus on covariation for both groups, but particularly for those students who actively sketched them, not only supported students' visual knowledge of divergence, but was shown to actually deepened students' understanding of vector fields. For educational practice, the added value of a pre-exercise aimed at concrete practicing of vector decomposition and partial derivatives could be supported. However, since a systematic manipulation of the pre-exercise was not dedicated focus of this study, further research regarding its actual value and a meaningful design is required. To further continue this line of research, particularly regarding conceptual knowledge that could be transferred to associated concepts of vector fields, such as curl, huge potential emerge for combining drawing activities with other methods, for example, simulations (e.g., Kohnle et al., 2020; Ainsworth and Scheiter, 2021).
Although the instruction used here requires certain prior knowledge, and thus gears to university science students, some implications can also be transferred to other subjects and domains. For instructors, drawing activities aiming at step-by-step introducing a learning strategy or a problem-solving procedure can be recommended. Particularly, if most of the steps were usually done mentally or not explicitly introduced, drawing appears to be a promising learning method also beyond university learning, for example, in school.
From a methodological perspective, this article particularly benefited from existing prior work on previous divergence instructions and the same problem-solving task type (Klein et al., 2018, 2019, 2021), which enabled comparisons and conclusions regarding manipulations of the learning material and different methods of gaze-data collection. In this context, this article revealed valuable insights into mobile gaze-data collection and analysis in drawing-based learning and assessment scenarios, which were found to valuable complement performance and cognitive load data. However, although mobile eye tracking allowed to capture natural visual behaviors, particularly when the learner interacts with the learning environment, data obtained from eye-tracking glasses proved to be rather unsuitable for detailed analysis on a process level. In problem solving, a non-interactive setting, remote gaze data was shown to provide more reliable resolution of processes and strategies. By discussing limitations of mobile gaze-data analysis in educational settings and comparing mobile and remote eye tracking, this article may provide guidance and support for other researchers, who plan to study such cognitive processes with eye tracking. Specifically, a huge potential of mobile eye tracking emerges, for example, for collaborative learning and in experimental settings (e.g., Chien et al., 2015; Schneider et al., 2018), thus further development, for example, concerning supported mapping and automatic adaption of AOIs, is two-fold, required and promising.
Data availability statement
The raw data supporting the conclusions of this article will be made available by the authors, without undue reservation.
Ethics statement
Ethical review and approval was not required for the study on human participants in accordance with the local legislation and institutional requirements. The patients/participants provided their written informed consent to participate in this study.
Author contributions
PK supervised data collection and gave feedback to the first draft of the manuscript. LH performed the statistical analyses and wrote the first draft of the manuscript. All authors contributed to conception and design of the study. All authors contributed to the article and approved the submitted version.
Funding
Students' expense allowance was funded by the Joachim Herz Foundation under Project No. 850030 (eyePhysics). Further, we acknowledge support by the Open Access Publication Funds of the Göttingen University.
Conflict of interest
The authors declare that the research was conducted in the absence of any commercial or financial relationships that could be construed as a potential conflict of interest.
Publisher's note
All claims expressed in this article are solely those of the authors and do not necessarily represent those of their affiliated organizations, or those of the publisher, the editors and the reviewers. Any product that may be evaluated in this article, or claim that may be made by its manufacturer, is not guaranteed or endorsed by the publisher.
Supplementary material
The Supplementary Material for this article can be found online at: https://www.frontiersin.org/articles/10.3389/feduc.2023.1162281/full#supplementary-material
References
Ainsworth, S. E. (1999). The functions of multiple representations. Comput. Educ. 33, 131–152. doi: 10.1016/S0360-1315(99)00029-9
Ainsworth, S. E., Prain, V., and Tytler, R. (2011). Drawing to learn in science. Science 333, 1096–1097. doi: 10.1126/science.1204153
Ainsworth, S. E., and Scheiter, K. (2021). Learning by drawing visual representations: Potential, purposes, and practical implications. Curr. Direct. Psychol. Sci. 30, 61–67. doi: 10.1177/0963721420979582
Alemdag, E., and Cagiltay, K. (2018). A systematic review of eye tracking research on multimedia learning. Comput. Educ. 125, 413–428. doi: 10.1016/j.compedu.2018.06.023
Ambrose, B. S. (2004). Investigating student understanding in intermediate mechanics: Identifying the need for a tutorial approach to instruction. Am. J. Phys. 72, 453–459. doi: 10.1119/1.1648684
Baily, C., Bollen, L., Pattie, A., Van Kampen, P., and De Cock, M. (2016). “Student thinking about the divergence and curl in mathematics and physics contexts,” in Proceedings of the Physics Education Research Conference 2016 (College Park, MD; New York, NY: American Institute of Physics), 51–54. doi: 10.1119/perc.2015.pr.008
Barniol, P., and Zavala, G. (2014). Test of understanding of vectors: a reliable multiple-choice vector concept test. Phys. Rev. ST Phys. Educ. Res. 10, 010121. doi: 10.1103/PhysRevSTPER.10.010121
Bilda, Z., and Gero, J. S. (2005). Does sketching off-load visuo-spatial working memory. Stud. Desig. 5, 145–160.
Bollen, L., Van Kampen, P., Baily, C., and De Cock, M. (2016). Qualitative investigation into students' use of divergence and curl in electromagnetism. Phys. Rev. Phys. Educ. Res. 12, 020134. doi: 10.1103/PhysRevPhysEducRes.12.020134
Bollen, L., Van Kampen, P., Baily, C., Kelly, M., and De Cock, M. (2017). Student difficulties regarding symbolic and graphical representations of vector fields. Phys. Rev. Phys. Educ. Res. 13, 020109. doi: 10.1103/PhysRevPhysEducRes.13.020109
Bollen, L., Van Kampen, P., and De Cock, M. (2015). Students' difficulties with vector calculus in electrodynamics. Phys. Rev. ST Phys. Educ. Res. 11, 020129. doi: 10.1103/PhysRevSTPER.11.020129
Bollen, L., Van Kampen, P., and De Cock, M. (2018). Development, implementation, and assessment of a guided-inquiry teaching-learning sequence on vector calculus in electrodynamics. Phys. Rev. Phys. Educ. Res. 14, 020115. doi: 10.1103/PhysRevPhysEducRes.14.020115
Burkholder, E. W., Murillo-Gonzalez, G., and Wieman, C. (2021). Importance of math prerequisites for performance in introductory physics. Phys. Rev. Phys. Educ. Res. 17, 010108. doi: 10.1103/PhysRevPhysEducRes.17.010108
Chen, S.-C., She, H.-C., Chuang, M.-H., Wu, J.-Y., Tsai, J.-L., and Jung, T.-P. (2014). Eye movements predict students' computer-based assessment performance of physics concepts in different presentation modalities. Comput. Educ. 74, 61–72. doi: 10.1016/j.compedu.2013.12.012
Chi, M. T. (2006). “Two approaches to the study of experts' characteristics,” in The Cambridge handbook of expertise and expert performance, eds K. A. Ericsson, N. Charness, P. J. Feltovich, and R. R. Hoffman (Cambridge, UK: Cambridge University Press), 21–30. doi: 10.1017/CBO9780511816796.002
Chien, K.-P., Tsai, C.-Y., Chen, H.-L., Chang, W.-H., and Chen, S. (2015). Learning differences and eye fixation patterns in virtual and physical science laboratories. Comput. Educ. 82, 191–201. doi: 10.1016/j.compedu.2014.11.023
Chiu, J. L., and Linn, M. C. (2014). Supporting knowledge integration in chemistry with a visualization-enhanced inquiry unit. J. Sci. Educ. Technol. 23, 37–58. doi: 10.1007/s10956-013-9449-5
Cohen, J. (1988). Statistical Power Analysis for the Behavioral Sciences. Hillsdale, NJ: Lawrence Erlbaum Associates.
Cook, M. P. (2006). Visual representations in science education: the influence of prior knowledge and cognitive load theory on instructional design principles. Sci. Educ. 90, 1073–1091. doi: 10.1002/sce.20164
Ericsson, K. A., and Kintsch, W. (1995). Long-term working memory. Psychol. Rev. 102, 211–245. doi: 10.1037/0033-295X.102.2.211
Foulsham, T., Kingstone, A., and Underwood, G. (2008). Turning the world around: Patterns in saccade direction vary with picture orientation. Vision Res. 48, 1777–1790. doi: 10.1016/j.visres.2008.05.018
Gegenfurtner, A., Lehtinen, E., and Säljö, R. (2011). Expertise differences in the comprehension of visualizations: a meta-analysis of eye-tracking research in professional domains. Educ. Psychol. Rev. 23, 523–552. doi: 10.1007/s10648-011-9174-7
Gire, E., and Price, E. (2012). “Graphical representations of vector functions in upper-division E&M,” in AIP Conference Proceedings (New York, NY: American Institute of Physics), 27–30. doi: 10.1063/1.3679985
Hahn, L., and Klein, P. (2021). “Multiple Repräsentationen als fachdidaktischer Zugang zum Satz von Gauß - Qualitative Zugänge zur Interpretation der Divergenz von Vektorfeldern,” in PhyDid B-Didaktik der Physik-Beiträge zur DPG-Frühjahrstagung, eds J. Grebe-Ellis and H. Grötzebauch (Fachverband Didaktik der Physik, virtuelle DPG-Frühjahrstagung 2021), 95–100. Available online at: https://ojs.dpg-physik.de/index.php/phydid-b/article/view/1151/1237
Hahn, L., and Klein, P. (2022a). Eye tracking in physics education research: A systematic literature review. Phys. Rev. Phys. Educ. Res. 18, 013102. doi: 10.1103/PhysRevPhysEducRes.18.013102
Hahn, L., and Klein, P. (2022b). “Kognitive Entlastung durch Zeichenaktivitäten Eine empirische Untersuchung im Kontext der Vektoranalysis,” in Unsicherheit als Element von naturwissenschaftsbezogenen Bildungsprozessen, eds S. Habig and H. van Vorst (Gesellschaft für Didaktik der Chemie und Physik, virtuelle Jahrestagung 2021), 384–387. Available online at: https://www.gdcp-ev.de/wp-content/tb2022/TB2022_384_Hahn.pdf
Hellenbrand, J., Mayer, R. E., Opfermann, M., Schmeck, A., and Leutner, D. (2019). How generative drawing affects the learning process: an eye-tracking analysis. Appl. Cogn. Psychol. 33, 1147–1164. doi: 10.1002/acp.3559
Hyönä, J. (2010). The use of eye movements in the study of multimedia learning. Learn. Instr. 20, 172–176. doi: 10.1016/j.learninstruc.2009.02.013
Jarodzka, H., Skuballa, I., and Gruber, H. (2021). Eye-tracking in educational practice: investigating visual perception underlying teaching and learning in the classroom. Educ. Psychol. Rev. 33, 1–10. doi: 10.1007/s10648-020-09565-7
Jung, K., and Lee, G. (2012). Developing a tutorial to address student difficulties in learning curl: a link between qualitative and mathematical reasoning. Can. J. Phys. 90, 565–572. doi: 10.1139/p2012-054
Just, M. A., and Carpenter, P. A. (1976). Eye fixations and cognitive processes. Cogn. Psychol. 8, 441–480. doi: 10.1016/0010-0285(76)90015-3
Klein, P., Hahn, L., and Kuhn, J. (2021). Einfluss visueller Hilfen und räumlicher Fähigkeiten auf die graphische Interpretation von Vektorfeldern: Eine Eye-Tracking-Untersuchung. Zeitschrift für Didaktik der Naturwissenschaften 27, 181–201. doi: 10.1007/s40573-021-00133-2
Klein, P., Müller, A., and Kuhn, J. (2017). Assessment of representational competence in kinematics. Phys. Rev. Phys. Educ. Res. 13, 010132. doi: 10.1103/PhysRevPhysEducRes.13.010132
Klein, P., Viiri, J., and Kuhn, J. (2019). Visual cues improve students' understanding of divergence and curl: evidence from eye movements during reading and problem solving. Phys. Rev. Phys. Educ. Res. 15, 010126. doi: 10.1103/PhysRevPhysEducRes.15.010126
Klein, P., Viiri, J., Mozaffari, S., Dengel, A., and Kuhn, J. (2018). Instruction-based clinical eye-tracking study on the visual interpretation of divergence: How do students look at vector field plots? Phys. Rev. Phys. Educ. Res. 14, 010116. doi: 10.1103/PhysRevPhysEducRes.14.010116
Kohnle, A., Ainsworth, S. E., and Passante, G. (2020). Sketching to support visual learning with interactive tutorials. Phys. Rev. Phys. Educ. Res. 16, 020139. doi: 10.1103/PhysRevPhysEducRes.16.020139
Lai, M.-L., Tsai, M.-J., Yang, F.-Y., Hsu, C.-Y., Liu, T.-C., Lee, S. W.-Y., et al. (2013). A review of using eye-tracking technology in exploring learning from 2000 to 2012. Educ. Res. Rev. 10, 90–115. doi: 10.1016/j.edurev.2013.10.001
Leopold, C., and Leutner, D. (2012). Science text comprehension: Drawing, main idea selection, and summarizing as learning strategies. Learn. Instr. 22, 16–26. doi: 10.1016/j.learninstruc.2011.05.005
Leppink, J., Paas, F., Van der Vleuten, C. P., Van Gog, T., and Van Merriënboer, J. J. (2013). Development of an instrument for measuring different types of cognitive load. Behav. Res. Methods 45, 1058–1072. doi: 10.3758/s13428-013-0334-1
Li, J., and Singh, C. (2017). Investigating and improving introductory physics students' understanding of symmetry and Gauss's law. Eur. J. Phys. 39, 015702. doi: 10.1088/1361-6404/aa8d55
Lindsey, B. A., and Nagel, M. L. (2015). Do students know what they know? Exploring the accuracy of students' self-assessments. Phys. Rev. ST Phys. Educ. Res. 11, 020103. doi: 10.1103/PhysRevSTPER.11.020103
Logie, R. H. (2014). Visuo-Spatial Working Memory. London: Psychology Press. doi: 10.4324/9781315804743
Mayr, E., Knipfer, K., and Wessel, D. (2009). “In-sights into mobile learning: An exploration of mobile eye tracking methodology for learning in museums,” in Researching Mobile Learning: Frameworks, Tools and Research designs, eds G. Vavoula, N. Pachler, and A. Kukulska-Hulme (Oxford: Peter Lang), 189–204.
Nieminen, P., Savinainen, A., and Viiri, J. (2012). Relations between representational consistency, conceptual understanding of the force concept, and scientific reasoning. Phys. Rev. ST Phys. Educ. Res. 8, 010123. doi: 10.1103/PhysRevSTPER.8.010123
Ozcelik, E., Karakus, T., Kursun, E., and Cagiltay, K. (2009). An eye-tracking study of how color coding affects multimedia learning. Comput. Educ. 53, 445–453. doi: 10.1016/j.compedu.2009.03.002
Pepper, R. E., Chasteen, S. V., Pollock, S. J., and Perkins, K. K. (2012). Observations on student difficulties with mathematics in upper-division electricity and magnetism. Phys. Rev. ST Phys. Educ. Res. 8, 010111. doi: 10.1103/PhysRevSTPER.8.010111
Rau, M. A. (2017). Conditions for the effectiveness of multiple visual representations in enhancing STEM learning. Educ. Psychol. Rev. 29, 717–761. doi: 10.1007/s10648-016-9365-3
Rayner, K. (1998). Eye movements in reading and information processing: 20 years of research. Psychol. Bull. 124, 372–422. doi: 10.1037/0033-2909.124.3.372
Reingold, E. M., Charness, N., Pomplun, M., and Stampe, D. M. (2001). Visual span in expert chess players: Evidence from eye movements. Psychol. Sci. 12, 48–55. doi: 10.1111/1467-9280.00309
Rosenshine, B. (1995). Advances in research on instruction. J. Educ. Res. 88, 262–268. doi: 10.1080/00220671.1995.9941309
Schneider, B., Sharma, K., Cuendet, S., Zufferey, G., Dillenbourg, P., and Pea, R. (2018). Leveraging mobile eye-trackers to capture joint visual attention in co-located collaborative learning groups. Int. J. Comput. Support. Collab. Learn. 13, 241–261. doi: 10.1007/s11412-018-9281-2
Seufert, T. (2003). Supporting coherence formation in learning from multiple representations. Learn. Instr. 13, 227–237. doi: 10.1016/S0959-4752(02)00022-1
Shah, P., and Miyake, A. (1996). The separability of working memory resources for spatial thinking and language processing: an individual differences approach. J. Exp. Psychol. 125, 4–27. doi: 10.1037/0096-3445.125.1.4
Singh, C., and Maries, A. (2013). “Core graduate courses: a missed learning opportunity?,” in AIP Conference Proceedings (New York, NY: American Institute of Physics), 382–385. doi: 10.1063/1.4789732
Smith, E. M. (2014). Student & Textbook Presentation of Divergence [Master thesis]. Corvallis, OR: Oregon State University.
Strohmaier, A. R., MacKay, K. J., Obersteiner, A., and Reiss, K. M. (2020). Eye-tracking methodology in mathematics education research: A systematic literature review. Educ. Stud. Math. 104, 147–200. doi: 10.1007/s10649-020-09948-1
Susac, A., Bubic, A., Planinic, M., Movre, M., and Palmovic, M. (2019). Role of diagrams in problem solving: An evaluation of eye-tracking parameters as a measure of visual attention. Phys. Rev. Phys. Educ. Res. 15, 013101. doi: 10.1103/PhysRevPhysEducRes.15.013101
Susac, A. N., Bubic, A., Kaponja, J., Planinic, M., and Palmovic, M. (2014). Eye movements reveal students' strategies in simple equation solving. Int. J. Sci. Math. Educ. 12, 555–577. doi: 10.1007/s10763-014-9514-4
Sweller, J. (2010). Element interactivity and intrinsic, extraneous, and germane cognitive load. Educ. Psychol. Rev. 22, 123–138. doi: 10.1007/s10648-010-9128-5
Tsai, M.-J., Hou, H.-T., Lai, M.-L., Liu, W.-Y., and Yang, F.-Y. (2012). Visual attention for solving multiple-choice science problem: an eye-tracking analysis. Comput. Educ. 58, 375–385. doi: 10.1016/j.compedu.2011.07.012
Wolf, J., Hess, S., Bachmann, D., Lohmeyer, Q., and Meboldt, M. (2018). Automating areas of interest analysis in mobile eye tracking experiments based on machine learning. J. Eye Mov. Res. 11, 1–11. doi: 10.16910/jemr.11.6.6
Wu, C.-J., and Liu, C.-Y. (2022). Refined use of the eye-mind hypothesis for scientific argumentation using multiple representations. Instr. Sci. 50, 551–569. doi: 10.1007/s11251-022-09581-w
Keywords: drawing, multiple representations, physics, vector fields, eye movements, instruction-based learning, conceptual understanding, eye tracking
Citation: Hahn L and Klein P (2023) Analysis of eye movements to study drawing in the context of vector fields. Front. Educ. 8:1162281. doi: 10.3389/feduc.2023.1162281
Received: 09 February 2023; Accepted: 15 May 2023;
Published: 22 June 2023.
Edited by:
André Bresges, University of Cologne, GermanyReviewed by:
Cédric Sueur, UMR7178 Institut pluridisciplinaire Hubert Curien (IPHC), FranceBianca Watzka, Otto von Guericke University Magdeburg, Germany
Copyright © 2023 Hahn and Klein. This is an open-access article distributed under the terms of the Creative Commons Attribution License (CC BY). The use, distribution or reproduction in other forums is permitted, provided the original author(s) and the copyright owner(s) are credited and that the original publication in this journal is cited, in accordance with accepted academic practice. No use, distribution or reproduction is permitted which does not comply with these terms.
*Correspondence: Larissa Hahn, bGFyaXNzYS5oYWhuQHVuaS1nb2V0dGluZ2VuLmRl