 Linda Margarita Medina Herrera
 Saúl Juárez Ordóñez
 Sergio Ruiz-Loza
- 1Mathematics Department, Tecnologico de Monterrey, Mexico City, Mexico
- 2Computer Department, Tecnologico de Monterrey, Mexico City, Mexico
Introduction: This article highlights the innovative approach of incorporating spatial visualization tools in mathematics education, specifically focusing on the exploration of virtual environments and 3D printing. By integrating these advanced technologies, educators can enhance the learning experience and facilitate a deeper understanding of mathematical concepts. This research delves into the potential benefits and practical applications of these tools, shedding light on their effectiveness in fostering spatial reasoning skills and promoting active student engagement. The study aims to uncover new avenues for leveraging technology in the mathematics classroom and re-imagining the teaching and learning process.
Methods: To assess the progress in spatial visualization ability, the Revised Purdue Spatial Visualization Test (Revised PSVT: R) was administered as both a pre-test and a post-test to a sample of 255 students divided into control and experimental groups.
Results: The findings indicate that the control group exhibited no significant development (p = 0.163) and had a minimal effect size of change (g = 0.035), whereas the experimental group demonstrated a substantial improvement in spatial visualization ability (p < 0.05) with a noteworthy medium effect size of change (g = 0.325). Furthermore, an analysis of variance was conducted to compare the mean normalized change in spatial visualization ability between the control and experimental groups. The results, with 95% confidence, establish that the normalized spatial visualization change is significantly higher in the experimental group. Specifically, the experimental group witnessed a 25% increase in spatial visualization skills, while the control group only experienced a 5% increase.
Discussion: Our study demonstrates the significance and effectiveness of integrating spatial visualization tools in mathematics education to enhance students’ spatial reasoning skills and mathematics understanding.
1 Introduction
Spatial skills have a vital significance in the acquisition of mathematical knowledge, particularly in the realms of geometry and calculus (Arcavi, 2003; Battista, 2007; Medina Herrera et al., 2019). Proficiency in spatial visualization, encompassing the manipulation of figures in three-dimensional space, recognition of patterns, projections, and the ability to describe concepts using both natural and mathematical language, are essential attributes sought in promoting mathematical learning (Gilligan et al., 2022; Ruiz Loza et al., 2022). Research shows that throughout development, there is a consistent, predictive, and strengthening relationship between spatial reasoning and mathematical achievement (Resnick et al., 2020). Particularly, for a comprehensive understanding of the fundamental concepts of calculus in multiple variables, students need spatial visualization abilities that enable them to grasp the relationships between surface transformations in space and the corresponding equations and inequalities (Medina Herrera et al., 2019; Buentello Montoya et al., 2021).
Spatial visualization plays a pivotal role in the integration of augmented reality (AR) and virtual reality (VR) technologies, these immersive tools leverage spatial understanding to create interactive and lifelike experiences (Alqahtani et al., 2017; Gilligan et al., 2022). By harnessing spatial visualization abilities, learners can seamlessly interact with virtual objects and environments, enhancing their understanding and engagement with mathematical concepts (Sorby, 2009; Kovacevic, 2019). AR overlays digital content onto the real world, while VR immerses users in entirely virtual environments, both relying heavily on spatial cognition to facilitate natural interactions. The synergy of spatial skills and immersive technologies presents promising opportunities to revolutionize mathematics education and deepen students’ mathematical understanding (Buentello Montoya et al., 2021).
Furthermore, a fundamental intricate connection exists between mathematical problem-solving and problem-solving skills. The former entails the systematic and analytical application of mathematical concepts to find solutions to problems. While problem-solving skills extend beyond mathematics to address challenges in various life domains, the engagement with mathematical problems has proven to be an effective means of developing and refining problem-solving abilities. This perspective aligns with the Organisation for Economic Co-operation and Development’s Programme for International Student Assessment (OECD, 2014), which defines problem-solving skills as “… an individual’s capacity to engage in cognitive processing to understand and resolve problem situations where a method of solution is not immediately obvious. It includes the willingness to engage with such situations to achieve one’s potential as a constructive and reflective citizen.”
Amidst the growing recognition of the pivotal role played by spatial skills in mathematics education and the transformative potential of AR and VR technologies, this study seeks to address a fundamental research question: Can the integration of AR and VR tools and 3D printing with disruptive educational methodologies, such as project oriented learning, in the context of multiple-variable calculus significantly enhance students’ spatial reasoning and problem-solving skills and deepen their understanding of intricate mathematical concepts?
In this research, we introduce a methodology and tools that have enabled us not only to enhance spatial visualization but also to develop problem-solving skills within a mathematical context. The primary focus of this paper is to demonstrate the development of spatial visualization skills. However, it is crucial to emphasize that the enhancement of spatial abilities is closely intertwined with problem-solving. In our approach, problem-solving serves as a catalyst for fostering spatial skills. Through our methodology and tools, we not only aim to showcase the advancement of spatial visualization capabilities but also underscore the pivotal role of problem-solving in this process.
More precisely, this paper illustrates how AR and VR can be used in a multiple-variable calculus context to develop students’ spatial skills. We present various technological tools designed for this purpose, including three developed by our team: AVRAM (Spanish acronym for Remote Virtual Environments for Mathematics Learning), which utilizes virtual environments, and ARC (Augmented Reality Calculus), which harnesses augmented reality (Medina Herrera et al., 2019). Additionally, we introduce LUMEN (Learning in Unified Mathematics Environments) (Ruiz Loza et al., 2022), a recent platform that seamlessly integrates both virtual and augmented reality capabilities. Furthermore, we incorporate other valuable tools in our research, such as GeoGebra 3D (GeoGebra 3D, 2018) and CalcPlot3D (Seeburger, 2011). These software tools generate 3D mathematical graphs that can be manipulated through rotation, translation, scaling, and Boolean operations, all of which are essential components of spatial visualization skills. Moreover, by combining these graphing tools with 3D printing, students gain the opportunity to interact with mathematical surfaces visually and tactually.
It is crucial to acknowledge that the development of students’ skills is not solely dependent on the incorporation of these tools. A well-defined pedagogical design is essential, which involves a series of thoughtfully crafted activities aimed at facilitating the learning and application of intricate mathematical concepts, while also nurturing problem-solving abilities and spatial skills.
The subsequent sections will explore the outcomes of utilizing augmented and virtual reality, along with 3D printing, in mathematics education. We will delve into the concept of mathematical visualization, describe the teaching methodology employed in the classroom, and discuss the developed technological tools. Additionally, we will introduce the Revised Purdue Spatial Visualization Test: Visualization of Rotations (Revised PSVT: R) (Yoon, 2011; Maeda et al., 2013), utilized to assess the progression of spatial skills in participating students. This paper presents new empirical evidence on the efficacy of AR, VR, and 3D printing for developing spatial skills.
2 Theoretical framework
2.1 Spatial ability
Spatial visualization is the cognitive ability to represent, manipulate, and comprehend objects and relationships in three-dimensional mental space, even when they are not physically present. It involves the ability to mentally imagine and rotate objects, identify patterns, and understand how different elements relate in space (Battista, 2007; Sorby, 2009; Revina et al., 2011). On the other hand, spatial reasoning is the process of thinking and problem-solving that involves spatial and visual relationships. The ability to visualize and manipulate objects in space is essential for reasoning and problem-solving involving spatial aspects (Buckley et al., 2019; Guntur et al., 2020; Gilligan et al., 2022). Both skills are interconnected and mutually reinforce each other in the learning and problem-solving process involving spatial concepts. Spatial reasoning is a trainable skill that can be improved through practice and deliberate training (Alqahtani et al., 2017; Lowrie et al., 2018). Research has shown a causal relationship between enhanced spatial reasoning and improved mathematical understanding (Lowrie et al., 2018; Kovacevic, 2019; Medina Herrera et al., 2019). Particularly, spatial visualization, a key aspect of spatial reasoning, involves mentally manipulating and comprehending spatial relationships. It plays a crucial role in understanding geometry and integral calculus concepts and solving problems related to areas and volumes (Battista, 2007; Bishop, 2008; Sorby, 2009).
Past studies (Lowrie et al., 2018; Atit et al., 2020; Resnick et al., 2020) have demonstrated that spatial aptitude can be developed and improved through targeted training and intentional practice. Additionally, novel intervention approaches, like the one presented in Medina Herrera et al. (2019), integrate various 3D tools in the teaching-learning process to enhance spatial visualization and spatial orientation skills among engineering students.
Effective mental image processing requires a variety of skills. Previous research on spatial abilities (Bishop, 2008; Medina Herrera et al., 2019), has identified 10 specific skills, including mentally rotating objects, envisioning the unfolding of solids, manipulating their positions in space, comprehending configurations with moving parts, manipulating imaginary three-dimensional movements and objects, transforming spatial patterns, identifying relationships among objects in space, recognizing objects from varying angles or motion, considering spatial relations based on the observer’s body orientation, perceiving and comparing spatial patterns, and maintaining orientation relative to objects in space.
Furthermore, Atit et al. (2020) indicate that spatial skills and motivation interact to significantly predict students’ mathematics performance. This finding emphasizes the importance of both spatial abilities and intrinsic motivation in shaping students’ achievements in mathematics. Encouraging spatial reasoning abilities and nurturing students’ intrinsic motivation in mathematics education can lead to improved academic outcomes. Similarly, Uttal et al. (2013) found that training students to think spatially and apply spatial skills resulted in significant increases in their spatial ability. This spatial ability, which involves perceiving the location and dimensions of objects and their relationships, is vital in everyday actions and is associated with expertise in mathematics (Arcavi, 2003; Bishop, 2008; Kovacevic, 2019; Medina Herrera et al., 2019; Resnick et al., 2020). Spatial training has been shown to be effective in improving math performance, benefiting young children and increasing expertise in science, technology, engineering, and mathematics in later life.
Assessment tools, such as those presented in Sorby (2009), are used to gage an individual’s level of spatial visualization development. These assessments often involve abstract reasoning exercises, examining logical progressions or block movements in three-dimensional space across various planes. Universities frequently use abstract reasoning tests to assess potential success in engineering programs. In this study, The Revised Purdue Spatial Visualization Test: Visualization of Rotations (Revised PSVT:R) was utilized to evaluate the advancement of spatial skills in students (see Section 3.1).
The relationship between mathematical problem-solving and problem-solving skills is intricate and foundational. Mathematical problem-solving entails the application of mathematical concepts to find solutions to posed situations, demanding a systematic and analytical approach. This process involves not only the direct application of formulas or algorithms but also the ability to comprehend the problem, identify patterns, formulate strategies, and evaluate the validity of potential solutions. Conversely, problem-solving skills encompass cognitive abilities that extend beyond mathematics, encompassing the capacity to identify, analyze, and address challenges across various domains of life. Key skills associated with problem-solving include creativity, cognitive flexibility, logical reasoning, perseverance, and teamwork. Mathematical problem-solving serves as an effective medium for developing and strengthening general problem-solving skills. By engaging with mathematical problems, students have the opportunity to refine their ability to tackle challenges, thereby enhancing their capacity to address problems in diverse contexts. Moreover, the structured and methodical approach required for mathematical problem-solving can serve as a model for addressing challenges in other areas of life. In summary, the relationship between mathematical problem-solving and problem-solving skills is symbiotic, each reinforcing the other in a mutually beneficial manner.
The utilization of Augmented reality, virtual reality and 3D printing have been a subject of investigation in educational research, particularly regarding their impact on spatial visualization and problem-solving skills among students. Previous studies have demonstrated that incorporating these tools into pedagogical activities can lead to significant enhancements in students’ understanding of complex mathematical concepts and their ability to apply them in problem-solving contexts (Humphreys et al., 1993; Hsi et al., 1997; Sorby, 2007; Martín-Gutiérrez et al., 2015). For instance (Herrera et al., 2020) found that students who engaged with 3D tools exhibited improved spatial visualization skills, as evidenced by their ability to manipulate objects, and describe spatial relationships accurately. Moreover, Medina Herrera et al. (2019) reported a notable increase in students’ final grades and a decrease in failure rates following the implementation of a 3D-based methodology in the mathematics curriculum. These findings suggest that the integration of 3D tools can positively impact both academic performance and student motivation in mathematics classrooms (Bishop, 1989; Arcavi, 2003; Battista, 2007; Pitta-Pantazi and Christou, 2010; Alqahtani et al., 2017; Buentello Montoya et al., 2021). Furthermore, assessments conducted in various studies indicate that students achieve higher scores, particularly in sections assessing spatial and problem-solving abilities, which are crucial components of mathematical proficiency (Humphreys et al., 1993; Martín-Gutiérrez et al., 2015; Medina Herrera et al., 2019). Additionally, qualitative feedback from students suggests a heightened sense of engagement and enthusiasm when participating in activities involving 3D tools, indicating their potential to enhance the overall learning experience (Medina Herrera et al., 2019). Overall, the literature supports the notion that the integration of 3D tools and methodologies holds promise for improving spatial visualization skills, problem-solving abilities, and overall mathematical proficiency among students (Hake, 1998; Hegarty and Kozhevnikov, 1999; Delahunty et al., 2016; Ruiz Loza et al., 2022).
2.2 Exploring virtual and augmented reality in the teaching-learning process of mathematics
Researchers have proposed various activities and approaches to develop spatial skills in mathematics. Some of these proposals include the use of blocks in different forms, such as flat images or augmented reality images, to aid students in visualizing and manipulating objects in space (Sorby, 2009; Ruiz Loza et al., 2022). Augmented reality has been employed as a tool to virtually model objects, enabling students to visualize vertices, edges, and object projections, thereby enhancing their ability to form mental images and comprehend spatial relationships (Medina Herrera et al., 2019; Buentello Montoya et al., 2021). Additionally, the development of semi-immersive systems for Virtual Mental Rotation Training allows students to interact with 3D models by selecting, rotating, zooming, and navigating them, resulting in improved mental rotation abilities for spatial objects (Medina Herrera et al., 2019).
Virtual reality and augmented reality present exciting possibilities for enhancing mathematics education (Bishop, 2008; Medina Herrera et al., 2019; Atit et al., 2020; Resnick et al., 2020; Buentello Montoya et al., 2021): (1) Visualizing geometric concepts: By utilizing VR and AR, students can engage in immersive experiences that enable them to interact with three-dimensional geometric shapes and objects. This hands-on approach allows for a deeper exploration of spatial relationships, angles, and proportions, making the learning experience more tangible and captivating. (2) Simulating mathematical scenarios (Sorby, 2009; Revina et al., 2011): Virtual mathematical environments created through VR and AR can provide students with opportunities to solve problems and conduct experiments. For instance, they can simulate physics phenomena, visualize three-dimensional graph functions, or delve into mathematical modeling within a virtual realm. (3) Enhancing problem-solving skills: VR and AR can present real-world scenarios that demand mathematical problem-solving (Guntur et al., 2020). Students are encouraged to apply their mathematical knowledge and skills to analyze and resolve problems within a realistic context. (4) Gamifying mathematics: The integration of VR and AR into educational games and activities can transform the learning of mathematics into an interactive and enjoyable experience. Students can engage in math-based puzzles, quizzes, and simulations that offer instant feedback and rewards, fostering a sense of achievement. (5) Promoting collaborative learning experiences: VR and AR facilitate collaborative learning by allowing students to interact with virtual objects and mathematical concepts collectively. Through teamwork, students can work together to solve problems, discuss strategies, and visualize mathematical concepts in a collaborative manner (Medina Herrera et al., 2019).
Individualized instruction: VR and AR could adapt to individual students’ needs, offering individualized learning experiences. These technologies can provide interactive tutorials, adaptive exercises, and customized feedback based on students’ progress and performance, catering to their unique learning requirements (Ruiz Loza et al., 2022). When incorporating VR and AR into mathematics education, it is crucial to provide proper guidance, establish clear learning objectives, and ensure that the technology serves to enhance mathematical comprehension. Additionally, considering the availability of necessary equipment and appropriately integrating VR and AR experiences into the curriculum are vital considerations for successful implementation.
3 Method
In this section, we present the educational methodology implemented to develop spatial visualization skills in engineering students. By incorporating cutting-edge 3D technological tools into a precise pedagogical design based on the educational methodology of project-oriented learning, we have created mixed reality learning environments for the study of multivariable calculus. This approach involves actively engaging students in hands-on projects that challenge them to apply spatial visualization skills in real-world contexts. To measure the improvement in spatial skills, the Revised PSVT: R assessment was utilized in this study. Mean and difficulty scores from the control and experimental groups’ tests were employed as indicators of skill enhancement. In prior research, a series of experiments were conducted over a four-year period involving control and experimental groups. These studies aimed to analyze the development of students’ visualization skills and their impact on final grades and failure rates. The results have demonstrated that the experimental groups achieved superior final grades, higher scores in spatial skills assessments, and a reduced number of failures compared to the control group (Uttal et al., 2013).
3.1 The revised Purdue spatial visualization test: visualization of rotations
The Revised Purdue Spatial Visualization Test: Visualization of Rotations (Revised PSVT:R) is a psychometric assessment designed to measure an individual’s spatial visualization ability, particularly their aptitude for mentally rotating objects. The test consists of 30 multiple choice problems that require the test-taker to mentally manipulate and visualize objects in three-dimensional space. These tasks may involve rotating objects, identifying their transformed orientations, or selecting the correct rotation from a set of options. The Revised PSVT:R provides a standardized and quantifiable measure of an individual’s spatial visualization capabilities (Yoon, 2011; Maeda et al., 2013).
The initial iteration of the test gained widespread usage in research within Science, Technology, Engineering, and Mathematics (STEM) education. It aimed to explore the correlation between spatial ability and the success of STEM students in terms of achievement, retention, and graduation (Maeda et al., 2013). Additionally, it served as a placement test to allocate engineering students to suitable courses, assess gender differences, and evaluate the impact of intervention programs on enhancing spatial ability and academic performance, among other purposes. However, concerns arose regarding the validity of inferences drawn from test scores due to figural errors present in the original version, leading to its revision in Yoon (2011). The errors were rectified, and the Revised PSVT:R underwent psychometric evaluation using a sample of 1,022 undergraduate students from diverse majors. In this study, the Revised PSVT:R demonstrated satisfactory reliability, with a Cronbach’s α coefficient of 0.862. Recent investigations (Maeda et al., 2013). have further explored the test’s psychometric properties and its relationship with academic-related variables, always demonstrating good internal consistency.
3.2 Student learning measures
Four methods have been widely used to compare learning gains between control and experimental groups by utilizing pre-test and post-test. (1) Raw change score or learning gain, which is just the difference between post-and pre-tests scores. (2) The normalized gain score or relative learning gain; A metric that quantifies the actual increase in learning in relation to the maximum potential gain. (3) The normalized change score, which coincides with normalized gain for students whose post-test scores are higher than the pre-test ones, but students who achieve identical scores on both the pre-test and post-test are assigned a gain of zero, while students who obtain lower scores on the post-test compared to the pre-test exhibit a negative gain. This negative gain is adjusted based on the total number of points they could potentially have lost. In this study we call it the normalized visualization change, and (4) The effect sizes; measures that reveal how much a group differ from another, particularly, with control and experimental groups, thus quantifying the result that it would be found in the population (Hake, 1998; DeVellis, 2006; Marx and Cummings, 2007). Since we are dealing with groups of different sizes, in this study we use Hedge’s standard deviation.
3.3 Experimental procedure and sample description
The sample for this experiment consisted of 255 second-semester engineering students enrolled in a multiple-variable calculus course. During registration, students had the option to choose from 24 groups taught by 9 different professors. Two of these 9 professors, with similar credentials and expertise in handling technological tools, participated in the experiment, each teaching a total of 8 groups. Among these 8 groups, the ones where the methodology would be applied were randomly selected as the experimental groups, while the others served as control groups. This resulted in 162 students in the experimental groups and the remaining 93 students in the control groups.
The course lasted for 10 weeks. During the first class, all students took the Revised PSVT:R test. The experimental group engaged in a detailed project, divided into stages over the 10 weeks. Meanwhile, the control group received a regular multivariable calculus course without the use of augmented reality (AR), virtual reality (VR), or 3D printing. In the experimental groups, the professors utilized 3D tools to explain the concepts, while in the control groups, traditional 2D chalkboards and graphing tools were employed. In the last class session, all students took the Revised PSVT:R test once again.
The technological tools used in the experimental group were introduced to the students in the first class session, and they were allowed to choose from among these tools for completing activities both in and outside the class. Each week, the students were required to work on a team activity and an individual activity, both related to the final project.
Below are the technological tools that the students in the experimental group used, along with the pedagogical methodology employed.
3.3.1 Technological tools
The first three technological tools were developed ad-hoc and designed following Hartson’s taxonomy of affordances (Hartson, 2003; Hartson and Pyla, 2018). We ensured the provision of comprehensive information on functional, cognitive, physical, sensory, and emotional affordances for these environments, aiming to deliver an integrated user experience. This kind of integrated experience was not found in the currently available tools, but was proposed as a key element to prioritize the user’s focus on developing mathematical competencies, over the time spent learning how to use different software tools. A broader description of these tools can be found in Medina Herrera et al. (2019) and Ruiz Loza et al. (2022).
AVRAM software (remote virtual environments for learning mathematics) was developed, allowing for the creation of 3D graphical representations, and enabling system-spanning interactions (Hartson and Pyla, 2018) interaction between students and teachers in a virtual reality (VR) environment. It provides an affordance for a more intuitive understanding of mathematical functions and relationships. Figure 1 shows an ellipsoid drawn in AVRAM and used in class.
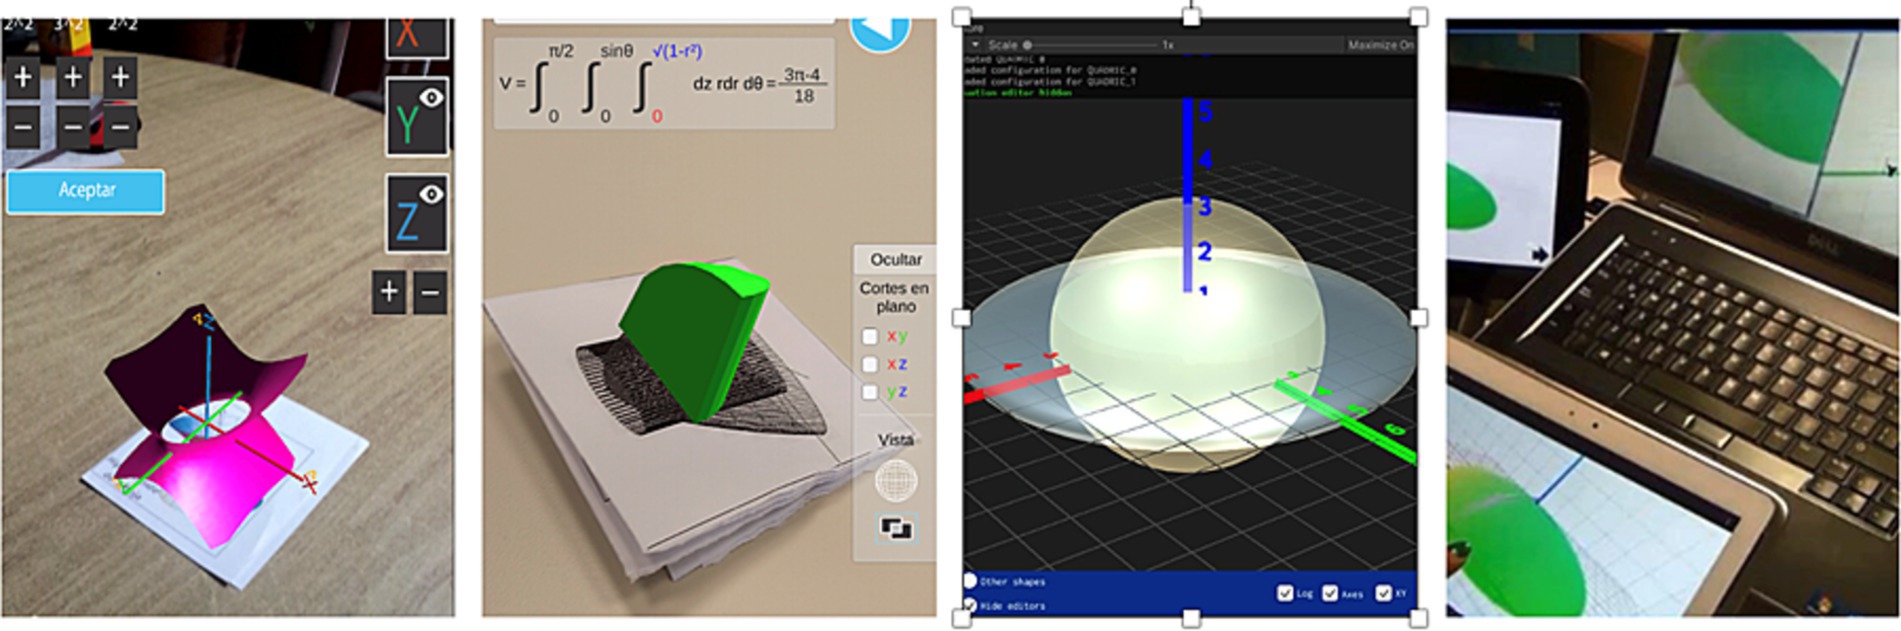
Figure 1. From left to right, a quadric surface in ARC, a region of integration in ARC, a sphere in LUMEN and an ellipsoid in AVRAM software.
ARC (Augmented reality in calculus) was created, incorporating augmented reality (AR) cards for drawing 3D surfaces, along with games related to curves and regions in space, ideal for working with concepts such as volumes and areas. This affordance connects physical and virtual representations, making abstract calculus concepts more tangible. Figure 1 shows two ARC’s cards, one showing a quadric surface and the other a region of integration used in class.
LUMEN (Learning in Unified Mathematics Environments) was developed, a VR and AR software that combines the functionalities of AVRAM and ARC, with improvements and new features. This enhances the user experience, making it more user-friendly, versatile, and effective for learning calculus concepts. Figure 1 shows a sphere in LUMEN used in class.
Calplot3D (Seeburguer) is a visual exploration tool for multivariable calculus that enables users to graph points, vectors, curves, surfaces, vector fields, and more. It also supports the use of red-blue or red-cyan 3D glasses for enhanced visualization (see Figure 2).
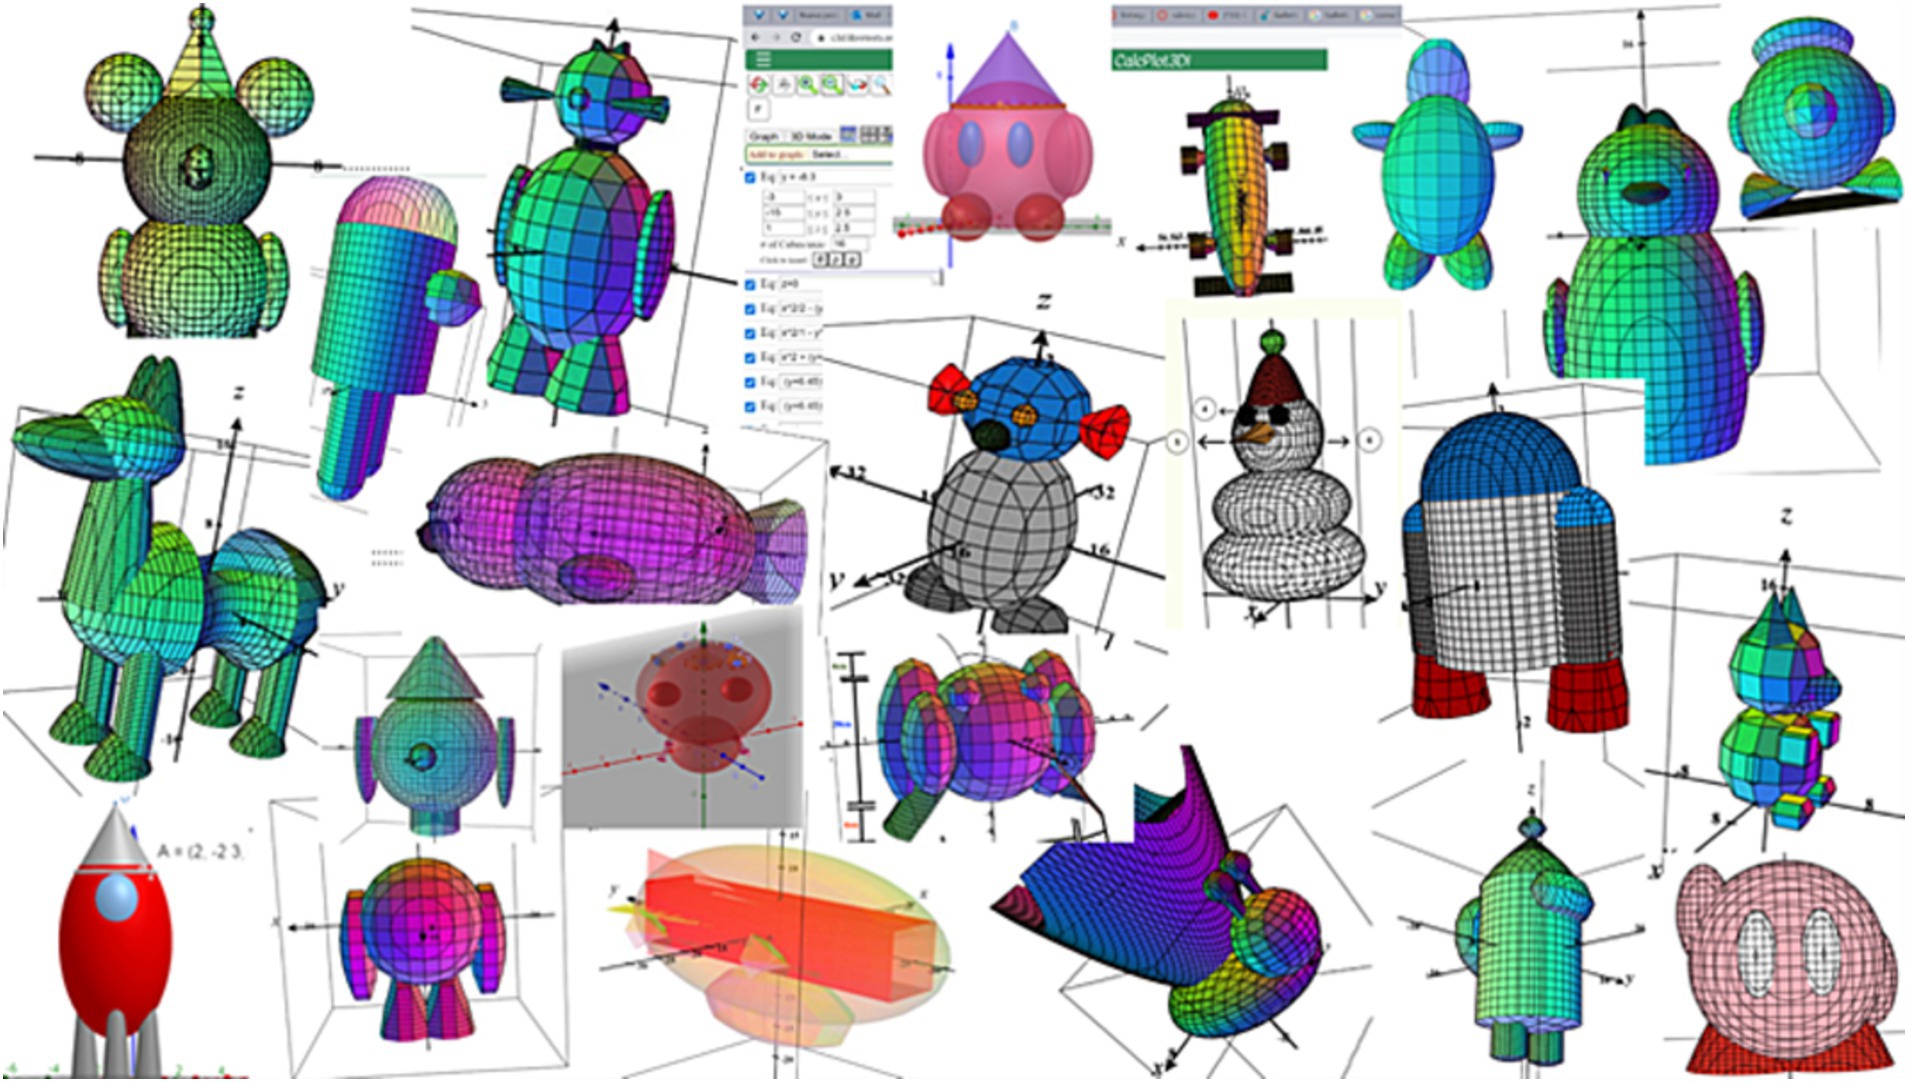
Figure 2. Models made by students using CalcPlot3d or GeoGebra.
GeoGebra3D. Model 3D mathematics using augmented reality (AR). Create solids, spheres, planes, cross-sections, and various other three-dimensional objects. Solve problems in linear geometry, represent functions z = f(x, y), and plot parametric surfaces. With augmented reality, you can bring mathematical concepts to life and explore them in a more immersive and interactive way (see Figure 2).
These programs are used by teachers to teach concepts, but the most interesting aspect is how students apply them in project-based or problem-based learning. The implementation of 3D printers began to incorporate the sense of touch, which, together with vision, allows for increased possibilities in developing spatial visualization skills. Figure 3 shows some 3D prints used in class.
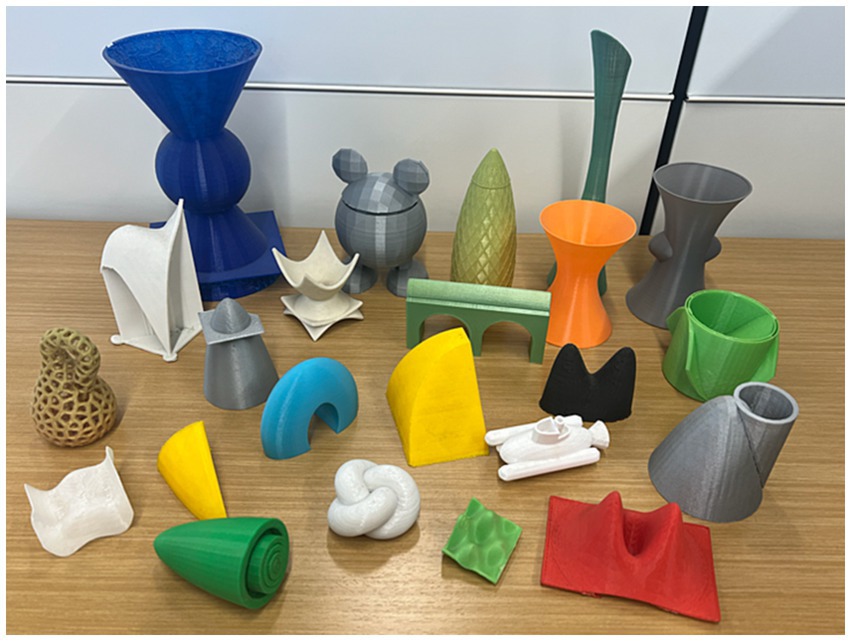
Figure 3. 3D prints of mathematically modeled objects used in class.
Utilizing 3D printing in the classroom offers more than just the development of spatial skills; it also fosters student engagement and enthusiasm. The learning experience extends beyond the final outcome and encompasses the entire 3D printing process. Achieving a proper 3D-printed model requires students to work with variables’ ranges (x, y, and z), model width, scales, supporting structures, and the overall print setup. This process proves to be more challenging than it appears. The significance lies in the journey of 3D printing rather than solely focusing on the resulting model. Observing a 3D printer in action provides students with a deeper comprehension of level curves as they witness the layers forming the model. Additionally, it enhances their understanding of concepts like cylindrical shells and disk methods employed in finding the volume of a solid of revolution. The appeal of 3D printing extends to both students and professors, becoming a source of inspiration across various disciplines. It bridges the gap between abstract mathematical ideas and their real-world applications, helping students build a deeper understanding of multivariable calculus principles. Instructors have integrated 3D printing into their classes to effectively teach essential concepts, recognizing its value as an educational tool.
3.3.2 Pedagogical activities
The investigation starts with the aim of identifying the essential skills that engineering students need to acquire during a multivariable calculus course. These skills are crucial for a comprehensive understanding of mathematical concepts and their efficient application in solving real-world problems encountered in their professional careers. Since the multivariable calculus course revolves around the geometry of three-dimensional space, spatial skills play a fundamental role. While various skills such as logical thinking and collaborative work are involved, this research specifically focuses on problem-solving skills due to their close connection with spatial abilities. Alongside the use of 3D tools for teaching mathematical concepts, the methodology incorporates a project-based learning approach where students engage in a multi-stage project throughout the course.
The project encompasses the design of various figures, including submarines, bottles, and chess pieces. The different stages of the project involve progressing from hand-drawn sketches to calculating the volume and surface area of the components using multiple integrals. Figure 4 illustrates the various stages undertaken by the students.
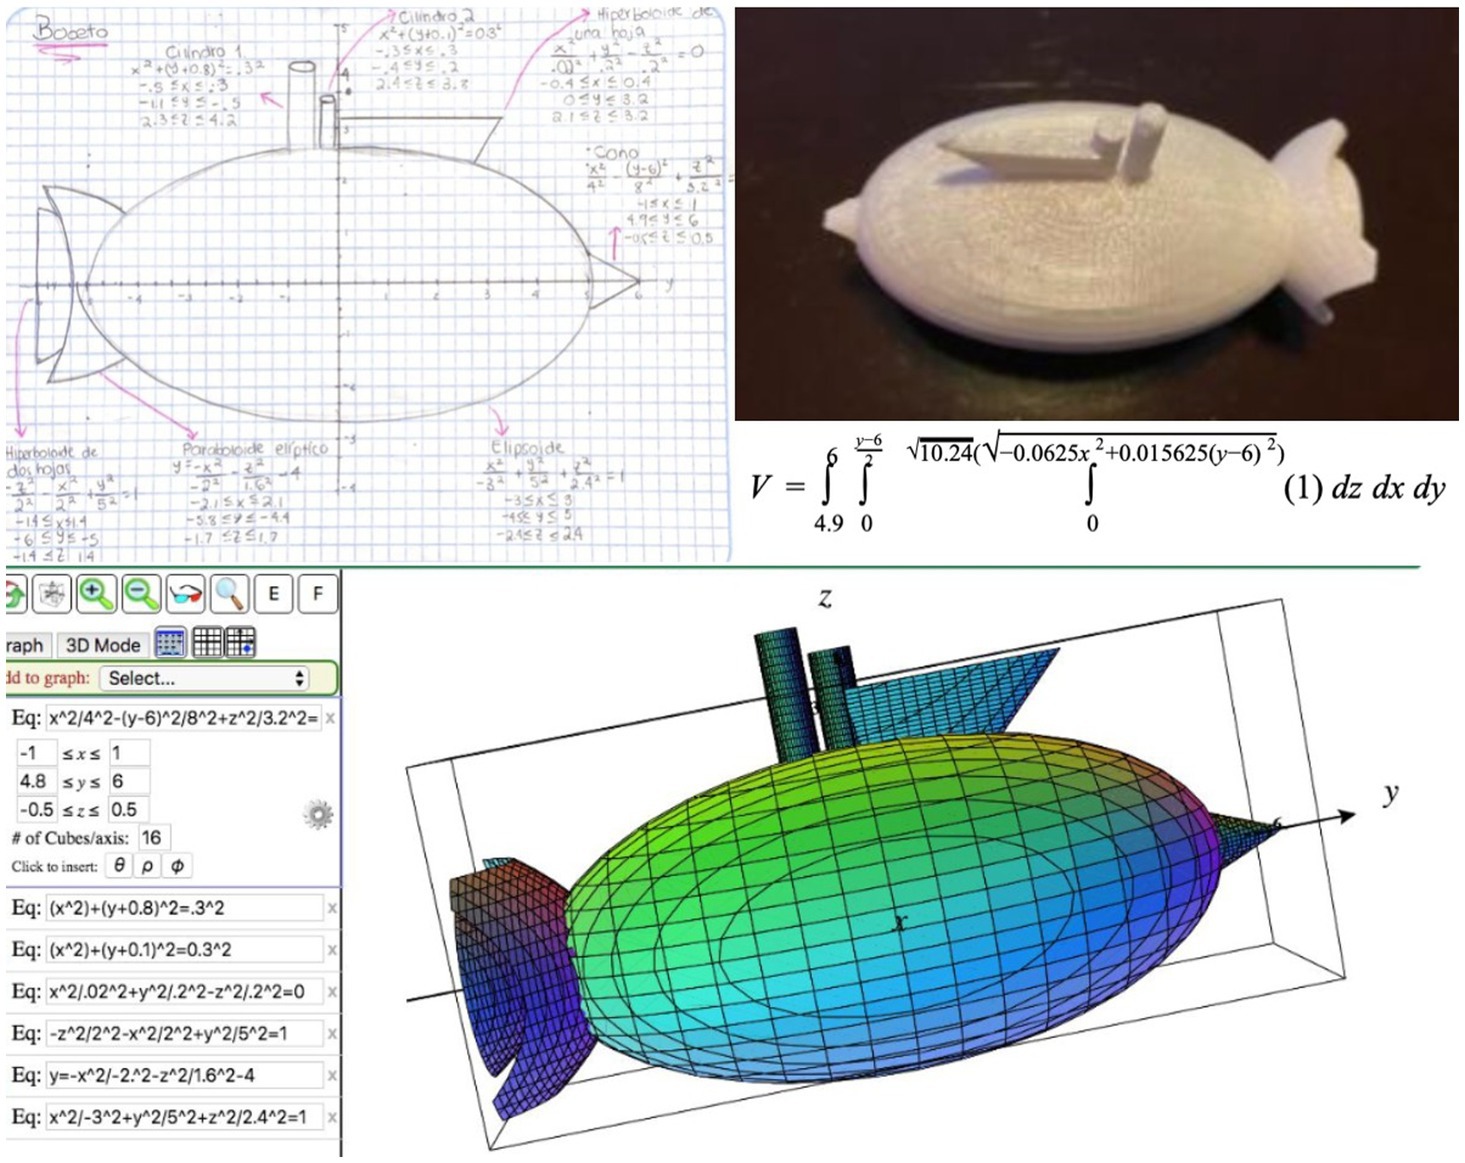
Figure 4. Several stages of students’ product development under a project-based learning framework.
In Stage 1, students engage in the preliminary design phase of the object. This initial stage places emphasis on the use of graphing software and the 3D technological tools mentioned above, facilitating collaborative design through the manipulation of surfaces in space.
Stage 2 involves a mathematical description of the object. With the aid of the 3D technological tools, students learn to describe surfaces, perform transformations, projections, visualizations, orientations, and effectively use both natural and mathematical language to describe their work.
In Stage 3, students 3D print basic pieces and create a video where they explain the processes they have executed. This video plays a critical role as it allows for initial observations of spatial skill development.
Stage 4 centers on analyzing the surfaces that compose the box or base. Students engage in substantial argumentation and employ language and symbolic operations. The transition from surface observations to descriptions and mathematical analysis involves utilizing Boolean operations between surfaces again with the aid of the 3D tools. Students work with simple mathematical models to determine intersections, identify maximum and minimum curves, and solve optimization problems related to packaging, surface area, and costs.
Stage 5 encompasses the 3D printing of the 3D model. The model must meet specific requirements, including accurate sizing, precise surface area, and volume. Through calculations and tests, adjustments are made to both the model and its packaging until the desired 3D printable model is achieved. Figure 4 shows the different stages of the project.
Every stage in the process is accompanied by rubrics that serve as guidelines for instructors to provide guidance and assess students. The methodology described in this paper fosters a sense of responsibility in students for acquiring solid mathematical knowledge. Through interactive mixed learning environments, students engage not only with their teachers but also with one another, ensuring their active participation in the learning process. As mentioned in Uttal et al. (2013) several interactive approaches are employed in teaching, including creative tasks, social projects, the utilization of innovative materials, and problem-solving activities.
This project incorporates these approaches by integrating 3D technological tools into collaborative student projects and activities that embody the characteristics of Project Oriented Learning (POL). In these activities, students harness their creativity to design mathematical models, describe them both verbally and mathematically using equations and inequalities, and ultimately bring their models to life through 3D printing.
In addition to the benefits offered by the 3D printing stage, we have identified two key factors that facilitate the development of activities from a computational standpoint. Firstly, the real-time rendering speed of designed objects enables a visual representation that accurately depicts mathematical shapes in a virtual three-dimensional space. This not only enhances the comprehension of the relationship between mathematical equations and their geometric counterparts, but also serves as a valuable tool for instructors to illustrate these concepts. It allows for numerous relational examples, each accompanied by instant visual perspectives. Secondly, the utilization of a generalized form of quadric equations provides a common framework for describing and comprehending the impact of changing coefficients, exponents, and offsets on the actual geometric shape, all in real-time.
Cheng and Tsai (2013) conducted research about affordances of AR in science learning, providing a summary of technical features, focus topics, participants and affordances of 12 AR research papers in science education, suggesting a path for future research. In this work, the general affordances identified by the mixed reality learning environments in the teaching of multivariable calculus, among others, are:
1) Enhanced visualization; students grasp abstract and complex mathematical ideas more intuitively, with 3D printing, complex 3D graphs of multivariable functions can be printed, enabling students to visualize functions that involve multiple variables.
2) Interactive engagement; students interact with mathematical concepts in real time, which encourages active participation and exploration.
3) Spatial understanding; students can view and manipulate objects from various angles, aiding in the comprehension of geometry and calculus in three dimensions, 3D printing can bring volume integrals to the physical world by printing objects with varying densities, helping students grasp the concept of integration in multiple dimensions.
4) Collaborative learning; students and teachers can interact in virtual or augmented reality spaces, enabling real-time collaboration, discussion, and problem-solving.
5) Practical application; contextualization helps students see the real-world relevance of mathematical ideas, 3D printing connects abstract mathematical concepts to real-world applications in engineering design, analysis, and problem-solving.
6) Immediate feedback; interaction with these 3D tools provides immediate feedback, helping students identify errors and misconceptions in real time, thereby promoting a deeper understanding of the concepts.
7) Multisensory learning; these 3D tools offer a multisensory learning experience, students engage their visual and kinesthetic senses, the tactile experience of handling 3D printed objects engages multiple senses, enhancing the learning process and memory retention.
3.4 Data and results
The initial focus of our research lies in analyzing the difficulty scores of the test based on the Classical Test Theory (CTT) (DeVellis, 2006), which utilizes the true score model. In this model, observed test scores are considered as the combination of true scores and error scores of respondents, where the observed variable represents a mix of relevant information and random errors.
Firstly, a comparison is made between the pre-test and post-test gain in difficulty scores for the entire sample, as well as for both the control and experimental groups, using analysis of variance. Subsequently, paired t-tests are conducted to evaluate whether there was a significant increase in the mean scores of both the control and experimental groups. Additionally, t-tests are employed to compare the average normalized change in visualization ability development between the control and experimental groups.
3.4.1 Difficulty analysis
In this section we conduct a CTT-based item difficulty analysis. The difficulty of an item is defined as the proportion of correct responses of the item across all students, since each correct response is worth one point in the Revised PSVT:R, the difficulty of an item is just the mean score of the item across all students. Thus, the higher the difficulty, the easier the question. The difficulty statistics of this study are reported in Table 1. From the statistics we can see that there was an increase in the mean difficulty from the pre to the post-test in all three categories (entire sample, control group, and experimental group), but the greatest increase corresponds to the experimental group.
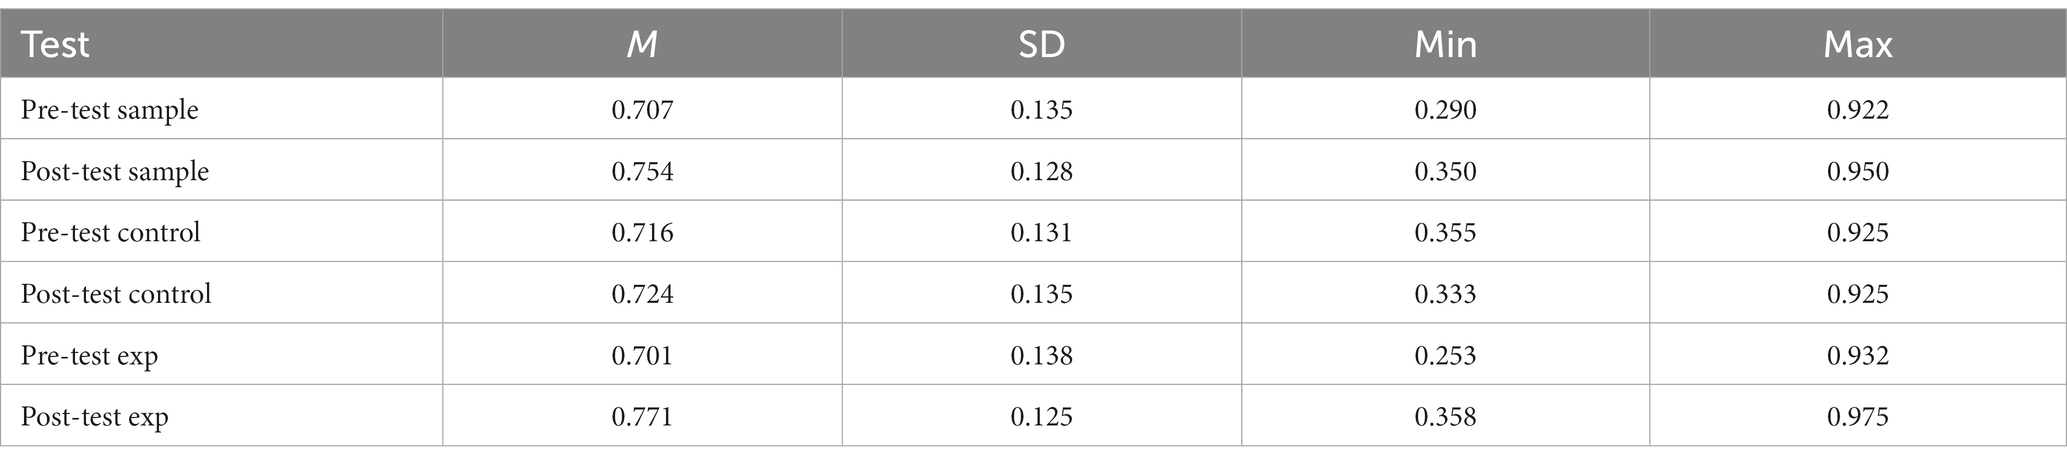
Table 1. Difficulty statistics.
Visual representations of difficulty for the control and experimental groups are shown in Figures 5, 6. From this graphical description we can see that the increase in difficulty in the entire sample is mainly due to the increase in difficulty in the experimental group.
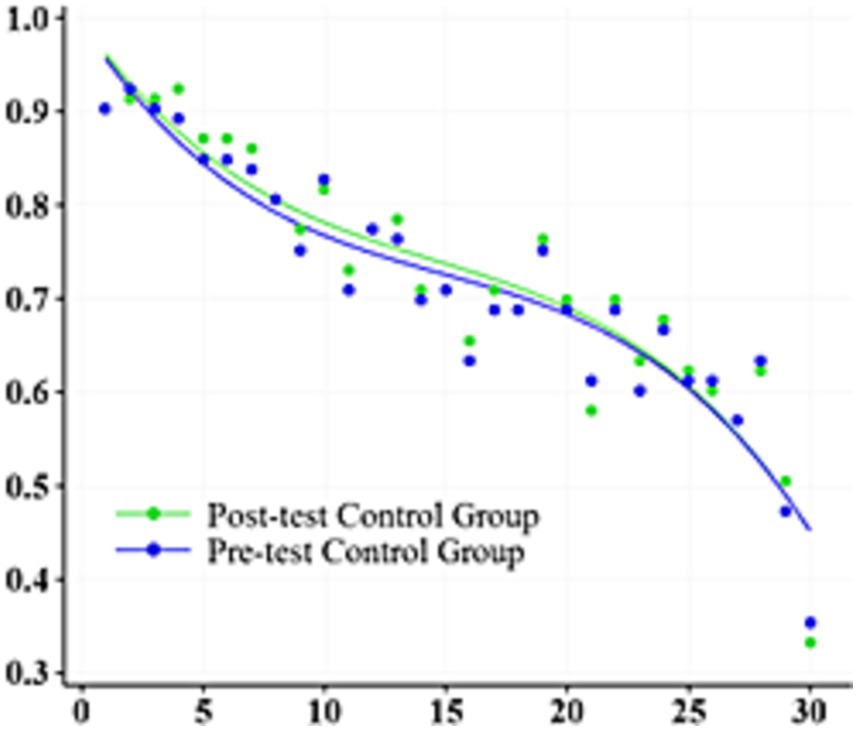
Figure 5. Cubic models for pre-and post-test difficulties of the control group.
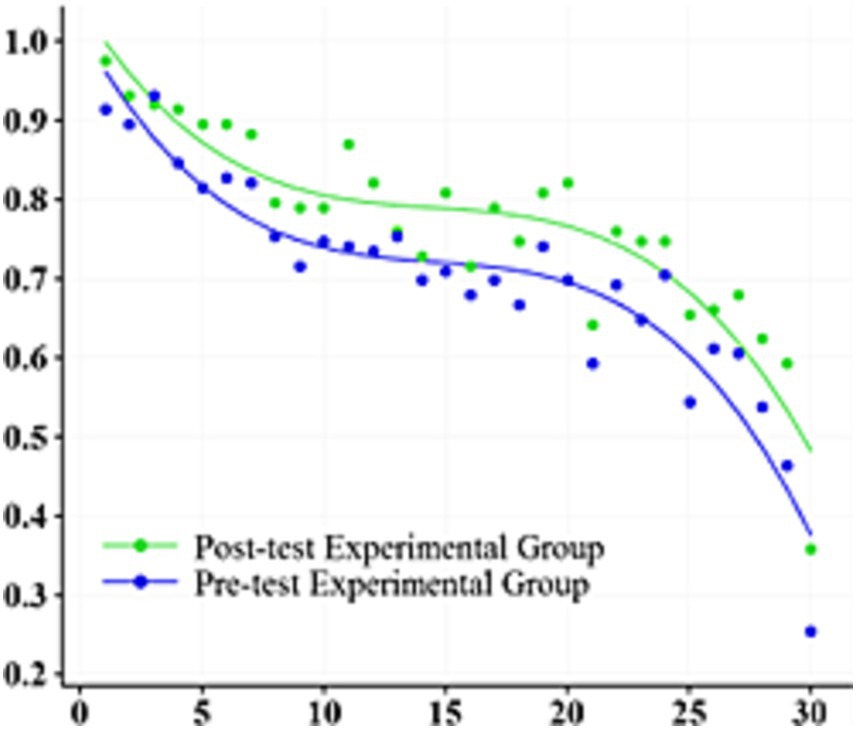
Figure 6. Cubic models for pre and post-test difficulties of the experimental group.
Hedge’s g values and their corresponding 95% confidence intervals that quantify the degree of precision of the estimate for the three categories support the above observation and are shown in Table 2. These intervals reveal a significant medium effect size of change in the experimental group and no significant effect size of change in the control group and in the entire sample.
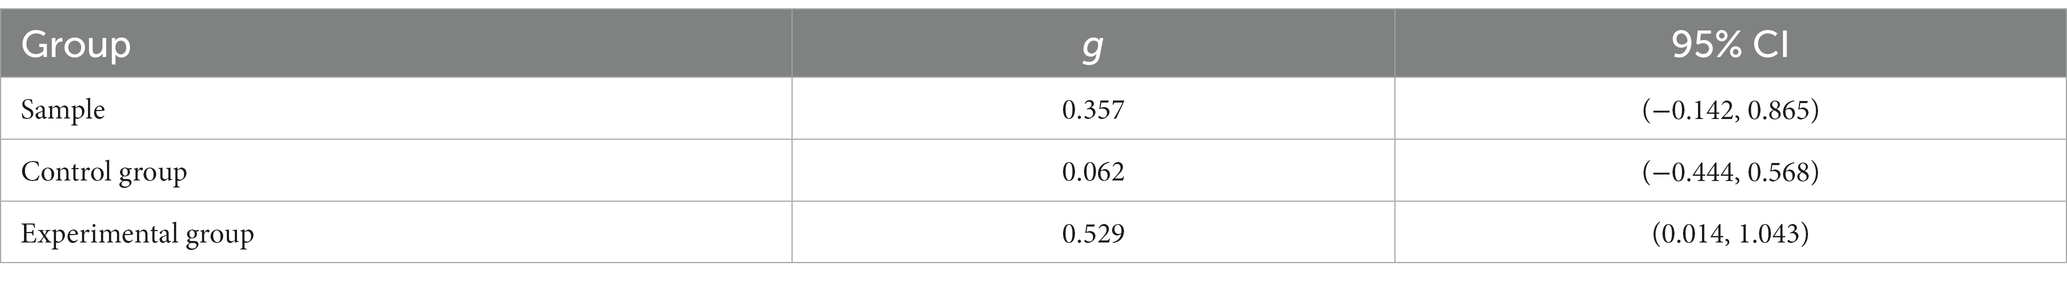
Table 2. 95% Confidence intervals of the effect size measure Hedge’s g for the three groups.
The results of paired t-test with a significance level of 5% showed that the mean difficulty of the post-test is higher than the mean difficulty of the pre-test (p < 0.05), in other words, the post-test was easier than the pre-test in the entire sample; however, the increase was not homogeneous across the control and experimental group, Games-Howell simultaneous tests for the difference in mean difficulty among the three pair of samples revealed a significant difference between the sample and the control group (p < 0.001), between the sample and the experimental group (p = 0.012), and between the control and the experimental group (p < 0.001). These results are reported in Table 3, along with their corresponding 95% confidence intervals, which do not contain 0, thus supporting the results of the test (see Figure 7).
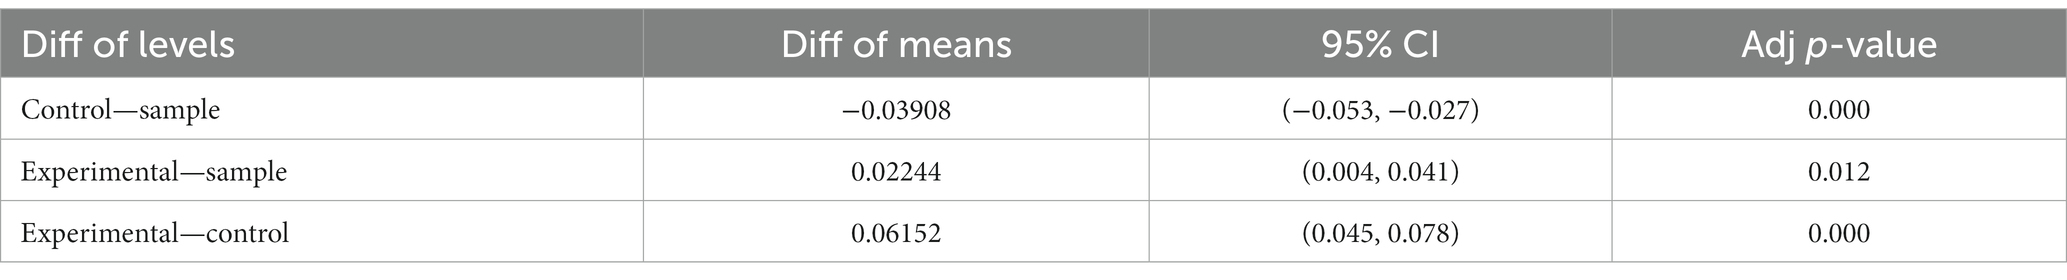
Table 3. Games-Howell simultaneous tests for difference of means.
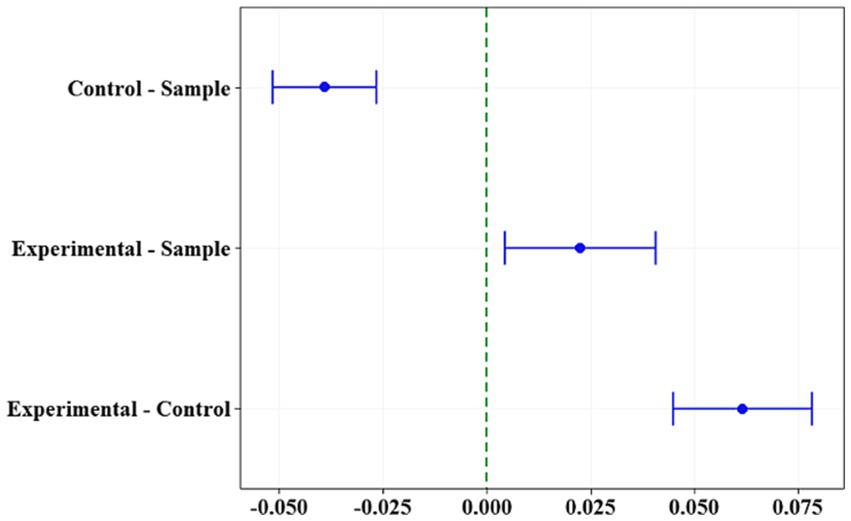
Figure 7. Games-Howell simultaneous 95% confidence intervals for the difference between mean increase in difficulty.
3.4.2 Mean visualization change analysis
In this section we conduct t-tests using the Revised PSVT:R pre-and post-test scores for the control and experimental group. The purpose is to measure and compare the mean normalized visualization change between these groups. The descriptive statistics are shown in Table 4.
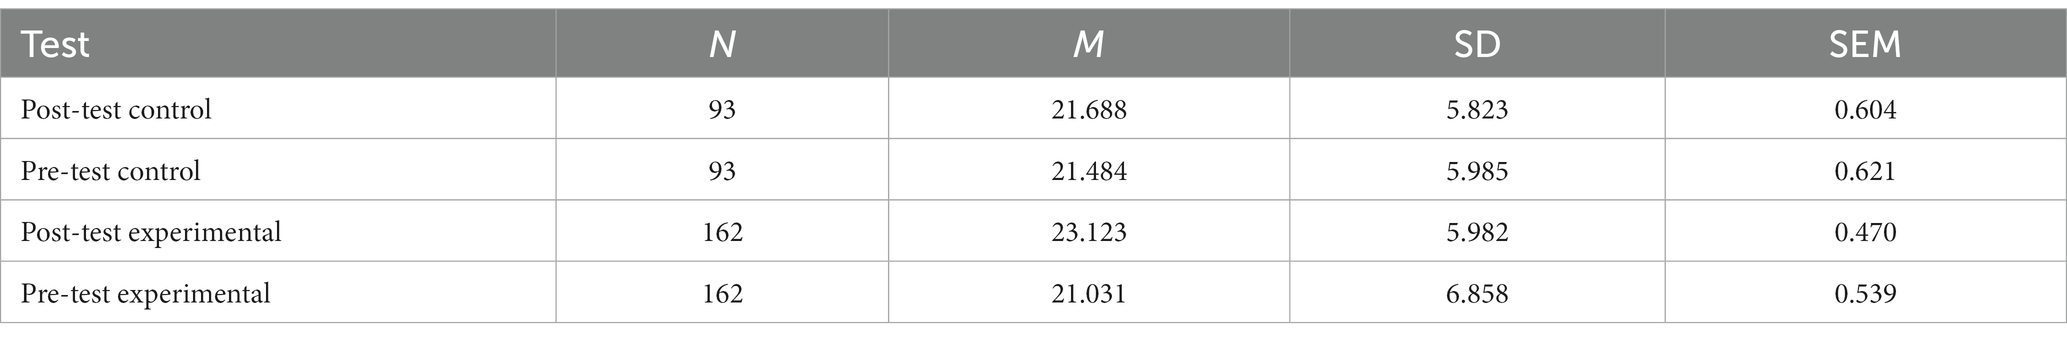
Table 4. Descriptive statistics.
Hedge’s g values and their corresponding 95% confidence intervals for both groups reveal a significant small to medium effect size of change in the experimental group and no significant effect size of change in the control group (see Table 5).
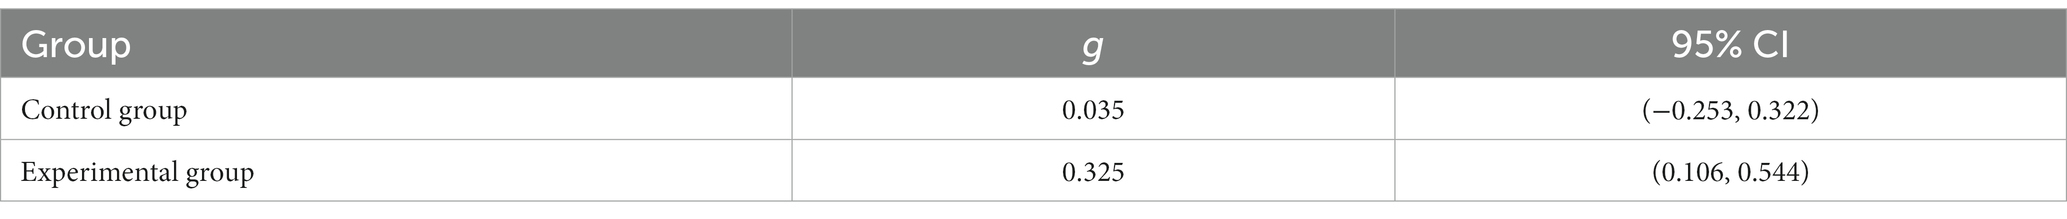
Table 5. 95% confidence intervals of the effect size measure Hedge’s g for the two groups.
Moreover, results of paired t-tests show that the mean difference in the experimental group was significant (p < 0.001), whereas the mean difference in the control group was not (p = 0.163). 95% lower bounds for the mean difference for both groups support the conclusions of the tests. The results are reported in Table 6.
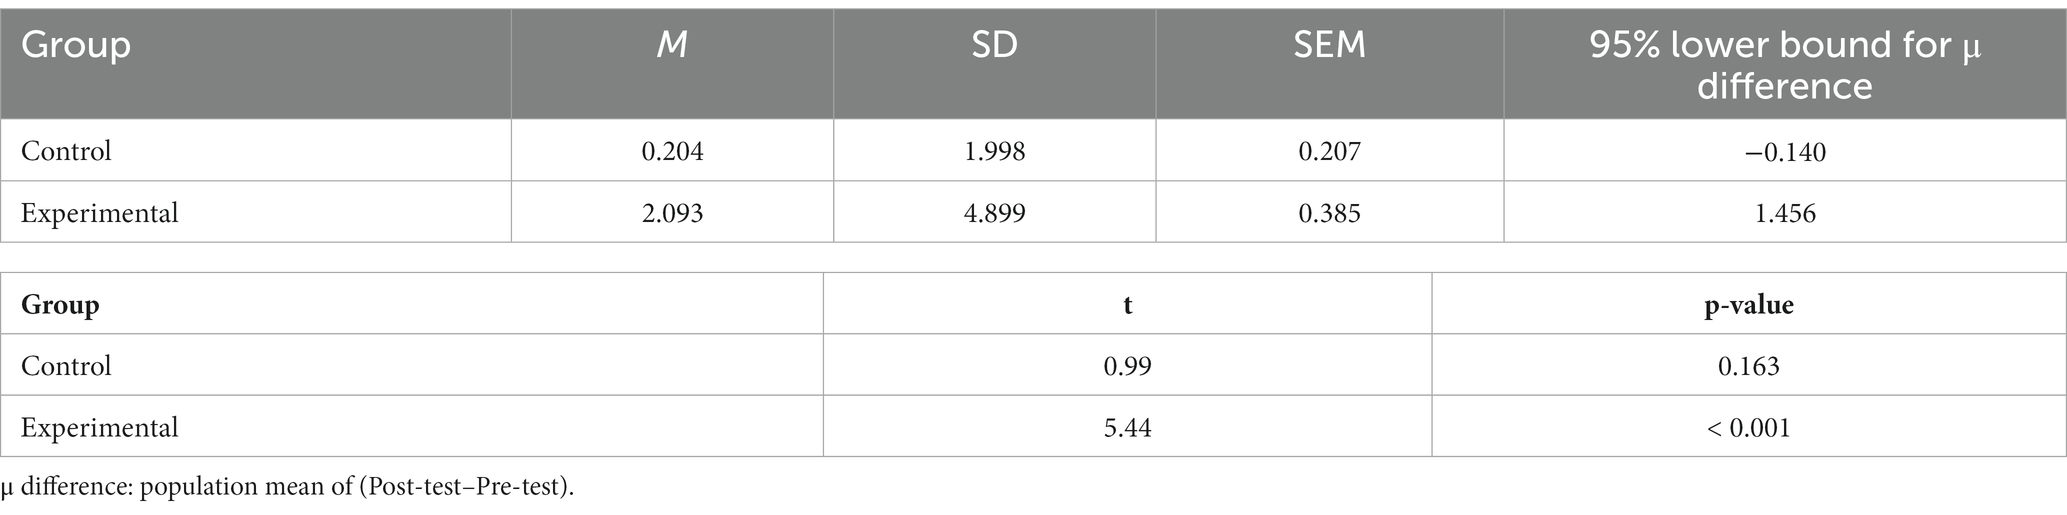
Table 6. Estimation of paired differences.
In addition, the mean normalized visualization changes statistics show that the experimental group had a 25% change versus the control group with a 5% change in the development of spatial visualization skills, as shown in Table 7.
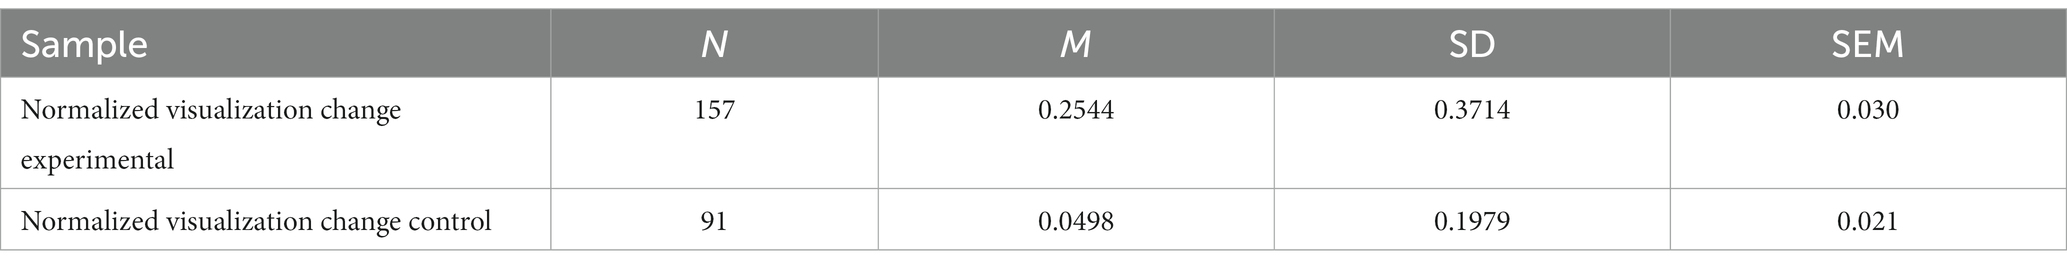
Table 7. Normalized visualization changes statistics.
The results of an independent t-test for the difference between mean normalized visualization changes in the control and experimental groups show that the development of spatial visualization ability in 3D mental rotations was significantly higher for the experimental group than for the control group (p < 0.001), a 95% lower bound of 0.1448 for the difference between means supports this claim (see Table 8). Equality of variances was not assumed in this analysis (Levene’s p < 0.001).

Table 8. Estimation for the difference between mean normalized visualization changes.
4 Discussion
The lack of development of spatial skills in engineering students is evidenced in mathematics courses that are developed in a 3D environment. This lack of spatial skills causes many students to be unable to understand or apply important mathematical concepts. The development of spatial skills and the ability to solve problems, as addressed in our research question, is underscored by the substantial improvement demonstrated by the experimental group exposed to our intervention methodology involving spatial visualization tools.
The paper provides the foundation for a comprehensive investigation into the integration of spatial visualization tools in mathematics education, with a particular emphasis on their application in the context of multivariable calculus. The study focuses on incorporating cutting-edge technologies, including augmented reality, virtual reality, and 3D printing in mathematics education. Its primary goal is to explore the potential advantages of these tools and assess their impact on students’ spatial reasoning skills and overall engagement in the learning process. The paper highlights the critical importance of spatial visualization in mathematical learning, especially in the complex domain of calculus involving multiple variables, where a solid grasp of spatial abilities is essential for understanding the relationships between various surfaces and equations.
The integration of spatial visualization tools, such as AVRAM, ARC, and LUMEN, along with other software like GeoGebra 3D and CalcPlot3D, aims to create immersive and interactive learning experiences. These tools allow students to manipulate 3D mathematical graphs, which is essential for developing spatial skills. Additionally, 3D printing offers a tactile aspect to mathematical surfaces, providing a unique way for students to interact with mathematical concepts.
One crucial aspect highlighted in the abstract is that the development of spatial skills is not solely reliant on technology; it is achieved through a well-designed pedagogical approach and carefully crafted activities. This indicates that while technology plays a significant role, the teaching methodology itself is equally important in fostering spatial skills and problem-solving abilities.
The study employed a pre-post-test design with control and experimental groups, utilizing the Revised Purdue Spatial Visualization Test: Visualization of Rotations to assess the progression of spatial skills in participating students. The statistical analysis revealed noteworthy findings. The experimental group, which experienced the intervention methodology involving spatial visualization tools, demonstrated substantial improvement in spatial visualization ability, as indicated by a significant increase in the mean difficulty of the test and a medium effect size of change. In contrast, the control group, which did not receive the intervention, showed no significant development in spatial skills.
Moreover, the mean normalized visualization change, comparing the experimental and control groups, indicated that the experimental group experienced a 25% increase in spatial visualization skills, while the control group only experienced a 5% increase. This stark difference further highlights the effectiveness of the spatial visualization tools in enhancing students’ spatial abilities.
5 Conclusion
The study presented in this paper demonstrates the significance and effectiveness of integrating spatial visualization tools, including augmented reality, virtual reality, and 3D printing, in mathematics education. By combining these advanced technologies with a well-designed pedagogical approach, educators can facilitate a deeper understanding of mathematical concepts and foster problem-solving abilities.
The findings indicate that the experimental group, exposed to the intervention methodology involving spatial visualization tools, exhibited a substantial improvement in spatial visualization ability. In contrast, the control group, without such intervention, showed minimal development in spatial skills. The outcomes of our study, as discussed in the preceding sections, underscore the importance of integrating spatial visualization tools in the mathematics classroom. These results directly support our initial research questions and hypotheses, confirming the positive influence of these innovative technologies on students’ spatial reasoning skills and mathematical learning.
The findings emphasize the importance of considering spatial visualization as a vital component of mathematics education and encourage educators to embrace innovative technologies to enhance the teaching and learning process. By continuing to explore new avenues for leveraging technology in the mathematics classroom, educators can prepare students for the challenges of a rapidly evolving technological world and empower them to become confident problem solvers and critical thinkers.
In summary, our study’s results directly align with our research questions by highlighting the significance of spatial skills in mathematics, the potential advantages of spatial visualization tools, and their substantial impact on students’ spatial reasoning abilities and engagement in the learning process. These findings provide a solid foundation for future investigations in the field of mathematics education, emphasizing the importance of integrating technology and pedagogy to enhance students’ mathematical learning experiences.
While software, manuals, and guidance are provided, students may encounter challenges when using augmented reality, virtual reality, and 3D printing tools in educational settings. However, it has not been observed that students have significant difficulties in their use. In many cases, students themselves offer assistance to team members who may have difficulties, while teachers also provide guidance to address any technical or navigational issues. These additional resources help students overcome challenges and make the most of the educational potential of these tools. Nevertheless, conducting research to assess students’ performance with these technologies would be beneficial, providing valuable insights for improving their implementation and effectiveness in educational settings.
Data availability statement
The raw data supporting the conclusions of this article will be made available by the authors, without undue reservation.
Author contributions
LM: conceptualization, funding acquisition, and project administration. SJ and LM: data curation. SJ, SR, and LM: figures and tables. LM and SJ: formal analysis, investigation, methodology, and validation. SJ: resources. SR and SJ: software. SR, LM, and SJ: visualization, writing—review and editing. LM, SR, and SJ: writing—original draft preparation. All authors contributed to the article and approved the submitted version.
Funding
This manuscript is a product of the project “LUMEn: Learning in Unified Mathematics Environments,” with funding from the NOVUS 2019 Fund, Grant with PEP nos. PHHT032-19ZZ00012-04-001 and PHHT032-19ZZ00012-05-001.
Acknowledgments
The authors would like to acknowledge the financial and the technical support of Writing Lab, Institute for the Future of Education, Tecnologico de Monterrey, Mexico, in the production of this work. The authors would like to acknowledge the financial support of Novus Grant with PEP No. PHHT032-17CX00005 and PHHT032-19ZZ00012, TecLabs, Tecnologico de Monterrey, Mexico, in the production of this work. Our deepest appreciation to all the members of the project “Touching Math: From Concepts to Reality through 3D Tools”.
Conflict of interest
The authors declare that the research was conducted in the absence of any commercial or financial relationships that could be construed as a potential conflict of interest.
Publisher’s note
All claims expressed in this article are solely those of the authors and do not necessarily represent those of their affiliated organizations, or those of the publisher, the editors and the reviewers. Any product that may be evaluated in this article, or claim that may be made by its manufacturer, is not guaranteed or endorsed by the publisher.
References
Alqahtani, S., Daghestani, L. F., and Ibrahim, L. F. (2017). Semi-immersive virtual reality for improving the mental rotation skill for engineering students: an experimental study. J. Comput. Eng. Inf. Technol. 6:4. doi: 10.4172/2324-9307.1000180
Arcavi, A. (2003). The role of visual representations in the learning of mathematics. Educ. Stud. Math. 52, 215–241. doi: 10.1023/A:1024312321077
Atit, K., Power, J. R., Veurink, N., Uttal, D. H., Sorby, S., Panther, G., et al. (2020). Examining the role of spatial skills and mathematics motivation on middle school mathematics achievement. Ini. J. Stem Educ. 7:38. doi: 10.1186/s40594-020-00234-3
Battista, M. T. (2007). “The development of geometric and spatial thinking” in Second handbook of research on mathematics teaching and learning. ed. F. K. Lester (Charlotte, NC: Information Age Publishing), 843–908.
Bishop, A. J. (1989). Review of research on visualization in mathematics education. Focus. Learn. Probl. Math. 11, 7–16.
Bishop, A. (2008). Values in mathematics and science education: similarities and differences. Math. Enthus. 5, 47–58. doi: 10.54870/1551-3440.1085
Buckley, J., Seery, N., and Canty, D. (2019). Investigating the use of spatial reasoning strategies in geometric problem-solving. Int. J. Technol. Des. Educ. 29, 341–362. doi: 10.1007/s10798-018-9446-3
Buentello Montoya, D., Lomelí Plascencia, G., and Medina Herrera, L. (2021). The role of reality-enhancing technologies in the teaching and learning of mathematics. Comput. Electr. Eng. 94:107287. doi: 10.1016/j.compeleceng.2021.107287
Cheng, K. H., and Tsai, C. C. (2013). Affordances of augmented reality in science learning: suggestions for future research. J. Sci. Educ. Technol. 22, 449–462. doi: 10.1007/s10956-012-9405-9
Delahunty, T., Sorby, S., Seery, N., and Pérez, L. (2016). Spatial skills and success in engineering education: A case for investigating etiological underpinnings. In 70th Engineering design graphics division annual mid-year conference, 24–26 January 2016, Daytona Beach, FL.
DeVellis, R. F. (2006). Classical test theory. Med. Care 44, S50–S59. doi: 10.1097/01.mlr.0000245426.10853.30
GeoGebra 3D . (2018). Version 6.0. Available at: https://www.geogebra.org/3d?lang=en (Accessed September 25, 2023).
Gilligan, K. A., Hawes, Z. C. K., and Mix, K. S. (2022). Spatial thinking as the missing piece in mathematics curricula. NPJ Sci. Learn. 7:10. doi: 10.1038/s41539-022-00128-9
Guntur, M. I. S., Setyaningrum, W., Retnawati, H., and Marsigit, (2020). Can augmented reality improve problem-solving and spatial skill? J. Phys. Conf. Ser. 1581:012063. doi: 10.1088/1742-6596/1581/1/012063
Hake, R. R. (1998). Interactive-engagement versus traditional methods: a six-thousand-student survey of mechanics test data for introductory physics courses. Am. J. Phys. 66, 64–74. doi: 10.1119/1.18809
Hartson, R. (2003). Cognitive, physical, sensory, and functional affordances in interaction design. Behav. Inform. Technol. 22, 315–338. doi: 10.1080/01449290310001592587
Hartson, R., and Pyla, P. S. (2018). The UX book: agile UX design for a quality user experience. Cambridge, MA: Morgan Kaufmann.
Hegarty, M., and Kozhevnikov, M. (1999). Types of visual–spatial representations and mathematical problem solving. J. Educ. Psychol. 91, 684–689. doi: 10.1037/0022-0663.91.4.684
Herrera, L. M. M., Glaros, D., and Abalo, M. A. (2020). “MATHPOL: development of mathematical competencies in engineering students using project-oriented learning” in 2020 V international conference on information Technologies in Engineering Education (Inforino). (Moscow, Russia: IEEE), 1–5.
Hsi, S., Linn, M. C., and Bell, J. E. (1997). The role of spatial reasoning in engineering and the design of spatial instruction. J. Eng. Educ. 86, 151–158. doi: 10.1002/j.2168-9830.1997.tb00278.x
Humphreys, L. G., Lubinski, D., and Yao, G. (1993). Utility of predicting group membership and the role of spatial visualization in becoming an engineer, physical scientist, or artist. J. Appl. Psychol. 78, 250–261. doi: 10.1037/0021-9010.78.2.250
Lowrie, T., Logan, T., Harris, D., and Hegarty, M. (2018). The impact of an intervention program on students' spatial reasoning: student engagement through mathematics-enhanced learning activities. Cogn. Res. Principles Implicat. 3, 1–10. doi: 10.1186/s41235-018-0147-y
Maeda, Y., Yoon, S. Y., Kim-Kang, K., and Imbrie, P. K. (2013). Psychometric properties of the revised PSVT: R for measuring the first-year engineering students’ spatial ability. Int. J. Eng. Educ. 29, 763–776.
Martín-Gutiérrez, J., Contero, M., and Alcañiz, M. (2015). Augmented reality to training spatial skills. Proc. Comput. Sci. 77, 33–39. doi: 10.1016/j.procs.2015.12.356
Marx, J. D., and Cummings, K. (2007). Normalized change. Am. J. Phys. 75, 87–91. doi: 10.1119/1.2372468
Medina Herrera, L., Castro Pérez, J., and Juárez Ordóñez, S. (2019). Developing spatial mathematical skills through 3D tools: augmented reality, virtual environments and 3D printing. Int. J. Interact. Des. Manuf. (IJIDeM) 13, 1385–1399. doi: 10.1007/s12008-019-00595-2
OECD (2014). PISA 2012 results: Creative problem solving: Students’ skills in tackling real-life problems (Volume V). PISA, OECD Publishing. Available at: http://dx.doi.org/10.1787/9789264208070-en
Pitta-Pantazi, D., and Christou, C. (2010). Spatial versus object visualisation: the case of mathematical understanding in three-dimensional arrays of cubes and nets. Int. J. Educ. Res. 49, 102–114. doi: 10.1016/j.ijer.2010.10.001
Resnick, I., Harris, D., Logan, T., and Lowrie, T. (2020). The relation between mathematics achievement and spatial reasoning. Math. Educ. Res. J. 32, 171–174. doi: 10.1007/s13394-020-00338-7
Revina, S., Zulkardi, Z., Darmawijoyo, D., and Van Galen, F. (2011). Spatial visualization tasks to support students’ spatial structuring in learning volume measurement. J. Math. Educ. 2, 127–146. doi: 10.22342/jme.2.2.745.127-146
Ruiz Loza, S., Medina Herrera, L. M., Molina Espinosa, J. M., and Huesca Juárez, G. (2022). Facilitating mathematical competencies development for undergraduate students during the pandemic through ad-hoc technological learning environments. Front. Educ. 7:830167. doi: 10.3389/feduc.2022.830167
Seeburger, P. (Monroe Community College) (2011). “CalcPlot3D, an Exploration Environment for Multivariable Calculus,” Convergence. doi: 10.4169/loci003781
Sorby, S. A. (2007). Developing 3D spatial skills for engineering students. Australas. J. Eng. Educ. 13, 1–11. doi: 10.1080/22054952.2007.11463998
Sorby, S. A. (2009). Educational research in developing 3-D spatial skills for engineering students. Int. J. Sci. Educ. 31, 459–480. doi: 10.1080/09500690802595839
Uttal, D. H., Meadow, N. G., Tipton, E., Hand, L. L., Alden, A. R., Warren, C., et al. (2013). The malleability of spatial skills: a meta-analysis of training studies. Psychol. Bull. 139, 352–402. doi: 10.1037/a0028446
Keywords: 3D printing, augmented reality, educational innovation, mathematics teaching, spatial visualization, virtual environments, higher education
Citation: Medina Herrera LM, Juárez Ordóñez S and Ruiz-Loza S (2024) Enhancing mathematical education with spatial visualization tools. Front. Educ. 9:1229126. doi: 10.3389/feduc.2024.1229126
Edited by:
S. Putrawangsa, Universitas Islam Negeri Mataram, IndonesiaReviewed by:
Frank Reinhold, University of Education Freiburg, GermanySimone Jablonski, Goethe University Frankfurt, Germany
Copyright © 2024 Medina Herrera, Juárez Ordóñez and Ruiz-Loza. This is an open-access article distributed under the terms of the Creative Commons Attribution License (CC BY). The use, distribution or reproduction in other forums is permitted, provided the original author(s) and the copyright owner(s) are credited and that the original publication in this journal is cited, in accordance with accepted academic practice. No use, distribution or reproduction is permitted which does not comply with these terms.
*Correspondence: Sergio Ruiz-Loza, c2VyZ2lvLnJ1aXoubG96YUB0ZWMubXg=