 Amy E. Pomeroy1
 Andrea Bixler2
 Stefanie H. Chen3,4
 Jennifer E. Kerr5
 Todd D. Levine6
 Elizabeth F. Ryder7*
- 1Department of Pharmacology, Computational Medicine Program, UNC Lineberger Comprehensive Cancer Center, University of North Carolina at Chapel Hill, Chapel Hill, NC, United States
- 2Biology Program, Clarke University, Dubuque, IA, United States
- 3Department of Biological Sciences, North Carolina State University, Raleigh, NC, United States
- 4Biotechnology Program, North Carolina State University, Raleigh, NC, United States
- 5Department of Biology, Notre Dame of Maryland University, Baltimore, MD, United States
- 6Department of Life Sciences and Prairie Springs Environmental Education Center, Carroll University, Waukesha, WI, United States
- 7Department of Biology and Biotechnology, Worcester Polytechnic Institute, Worcester, MA, United States
As high-throughput methods become more common, training undergraduates to analyze data must include having them generate informative summaries of large datasets. This flexible case study provides an opportunity for undergraduate students to become familiar with the capabilities of R programming in the context of high-throughput evolutionary data collected using macroarrays. The story line introduces a recent graduate hired at a biotech firm and tasked with analysis and visualization of changes in gene expression from 20,000 generations of the Lenski Lab’s Long-Term Evolution Experiment (LTEE). Our main character is not familiar with R and is guided by a coworker to learn about this platform. Initially this involves a step-by-step analysis of the small Iris dataset built into R which includes sepal and petal length of three species of irises. Practice calculating summary statistics and correlations, and making histograms and scatter plots, prepares the protagonist to perform similar analyses with the LTEE dataset. In the LTEE module, students analyze gene expression data from the long-term evolutionary experiments, developing their skills in manipulating and interpreting large scientific datasets through visualizations and statistical analysis. Prerequisite knowledge is basic statistics, the Central Dogma, and basic evolutionary principles. The Iris module provides hands-on experience using R programming to explore and visualize a simple dataset; it can be used independently as an introduction to R for biological data or skipped if students already have some experience with R. Both modules emphasize understanding the utility of R, rather than creation of original code. Pilot testing showed the case study was well-received by students and faculty, who described it as a clear introduction to R and appreciated the value of R for visualizing and analyzing large datasets.
1 Introduction
High-throughput methods have revolutionized the field of biology, enabling researchers to generate unprecedented amounts of data. This trend of increasingly large datasets will continue with new technological advancement.
Traditionally, undergraduate biology curricula have focused on theoretical and experimental aspects of the discipline, often leaving students in need of training on the intricacies of modern large-scale, data-driven research. The science education community has recognized the need to define bioinformatics core competencies (Welch et al., 2014; Wilson Sayres et al., 2018; Attwood et al., 2019). While different kinds of users will require different profiles of these competencies (Mulder et al., 2018), there has been consistent recognition of the need to integrate many of these skills into undergraduate biology education, since they are required to appropriately design and analyze high-throughput biological experiments (Rosenwald et al., 2016; Attwood et al., 2019; Clemmons et al., 2020). Integration of these competencies may also inspire some students to new career paths. As Attwood et al. (2019) point out, “not all biologists need to master programming, [but] incorporating bioinformatics earlier in the education cycle could help to bring more computationally minded biologists into wet-lab teams to help manage the programming and statistical components of data analyses.” This suggestion stands in sharp contrast to the survey results reported by Attwood et al. (2019) that many scientists do not realize their need for bioinformatics training until they have collected data that cannot be handled otherwise.
Instructors have identified barriers, including a lack of engaging and accessible learning resources and a lack of instructor competency in bioinformatics, that prevent them from teaching these topics in the undergraduate classroom (Williams et al., 2019; Işık et al., 2023). A number of efforts are being made to provide such resources (Attwood et al., 2015; Nolan and Temple Lang, 2015; Greene et al., 2016; Ryder et al., 2020; Dill-McFarland et al., 2021; Kleinschmit et al., 2023), but there is still a great need to effectively integrate them into classrooms (Attwood et al., 2019; Işık et al., 2023). In particular, there is a need for engaging and accessible resources for biology students that do not require the instructor to be highly trained in bioinformatics or data science.
Evidence-based practices have shown us that case studies are a valuable tool allowing students to learn and apply their skills to real world data analysis (White et al., 2009; Herreid et al., 2011; Harman et al., 2015; Bernhardt and Richmond, 2021). Importantly, case studies also increase the performance and persistence of underrepresented students in STEM with active learning (Theobald et al., 2020). The goal of the HITS (High-throughput Discovery Science and Inquiry-based Case Studies for Today’s Students) Research Coordination Network, funded by the National Science Foundation (Award # 1730317), was to bring together researchers and instructors to create learning resources to improve student quantitative skills and participation in high-throughput discovery (Robertson et al., 2021). We suggest that “dry lab” activities presented as case studies are a means to introduce undergraduates at any institution to the promise and challenges of high-throughput science and give them practice with critical thinking, analysis and visualization skills needed in modern biological research. This work describes one such case study, oriented to undergraduate biology or bioinformatics students and requiring little instructor or student background knowledge in bioinformatics, data science, or high-throughput technology.
2 Pedagogical framework
Our intention in developing the “R” U Ready? case study was to create an activity that helps students in the life sciences acquire some of the recommended bioinformatics competencies (Campbell and Nehm, 2017; Wilson Sayres et al., 2018). The main goals of the activity are to engage students in big data analysis and to avoid barriers to implementation in biology or bioinformatics classrooms. Students should have a general background in biology including foundations of Central Dogma, gene expression, and evolution. Thus, we developed an activity with two modules (Introduction to R – Iris Module and Long-Term Evolution Experiment – LTEE Module) that assume no programming background on the part of either students or instructor, and utilize the open source platform R Studio (Posit), which can be downloaded locally or used in the cloud (Posit Cloud). To make the activity particularly relevant, we presented the case study as a situation that a student might well face as a summer intern or newly hired employee – having to quickly learn the skills needed to analyze high-throughput data.
R was chosen as the basis for this case study due to its versatility and wide use as a programming language for large-scale statistical computing, as well as for data visualization and analysis.1 The free availability, both for the desktop and in the cloud, growing number of analysis packages, and powerful visualization capabilities make R a valuable tool for students seeking to analyze, interpret, and visualize biological data. R Studio (Posit Software) is an IDE (Integrated Development Environment) that makes the R language much more accessible to beginners [Posit Software, PBC formerly RStudio, Posit Software (2024)]. R’s ability to handle large datasets makes it an ideal platform for introducing undergraduates to high-throughput data analysis. Importantly, R scripts and open source software make any analysis highly reproducible, a concept that is emphasized in the case study. In addition, screen readers do not work well in some spreadsheet software; R may offer a more accessible interface. Recent work has shown that coupling R programming with case studies provides a contextual framework that bridges the gap between abstract concepts and applications, and builds intuition for data manipulation and visualization (Nolan and Temple Lang, 2015; Li, 2021; Del Toro et al., 2022).
Case studies have a long history and strong evidence base demonstrating their effectiveness as an educational method (Herreid, 1994; Herreid et al., 2011). “Case studies are stories to educate” (Herreid, 1997). They “make the process of scientific learning more genuine and rigorous” (Camill, 2006) and help students understand why they should care about what is often presented as just a body of facts (Camill, 2006; Chamany, 2006). While traditional case studies in medicine and law were “real stories dealing with people in trouble” (Herreid, 1997), scientific case studies have diversified in both scope and pedagogy, including real-life and fictional stories on a range of subjects, and have been used in traditional, flipped and online classrooms (Herreid, 1997; Herreid and Schiller, 2013; Bixler et al., 2021). Case studies are an excellent way to teach critical thinking, such as analyzing and evaluating arguments (Herreid et al., 2011), by asking students to consider the scientific method (in particular, the experimental design) necessary to obtain or validate facts they learn. While the story in our case study is fictional, one module of the case helps students critically analyze data from a published paper that is part of a significant decades-long study on evolution (Cooper et al., 2003).
The learning objectives for the activity map to several recognized bioinformatics and data science competencies that foster analytical thinking and scientific inquiry (Table 1). Clemmons et al. (2020) developed their “Bioskills Guide” as a tool to aid instructors in implementing the core competencies described in ‘Vision and Change’ [AAAS (American Association for the Advancement of Science), 2010]. Wilson Sayres et al. (2018) developed core bioinformatics competencies for undergraduate life science majors, while Mulder et al. (2018) specified different types and levels of competencies for different audiences (bioinformatics specialists vs. physicians, for example). The learning objectives we chose are compiled from all of these sources, focusing on those objectives most appropriate to learners with little background, as detailed in Table 1. After completion of the case study, students should be able to (1) use computational and analytical techniques to ensure reproducibility of results; (2) find, retrieve, and organize data from public databases; (3) explain and utilize basic R programming concepts; (4) interpret and analyze scientific data through visualizations; (5) apply critical thinking and hypothesis formulation; and (6) interpret high-throughput gene expression data.
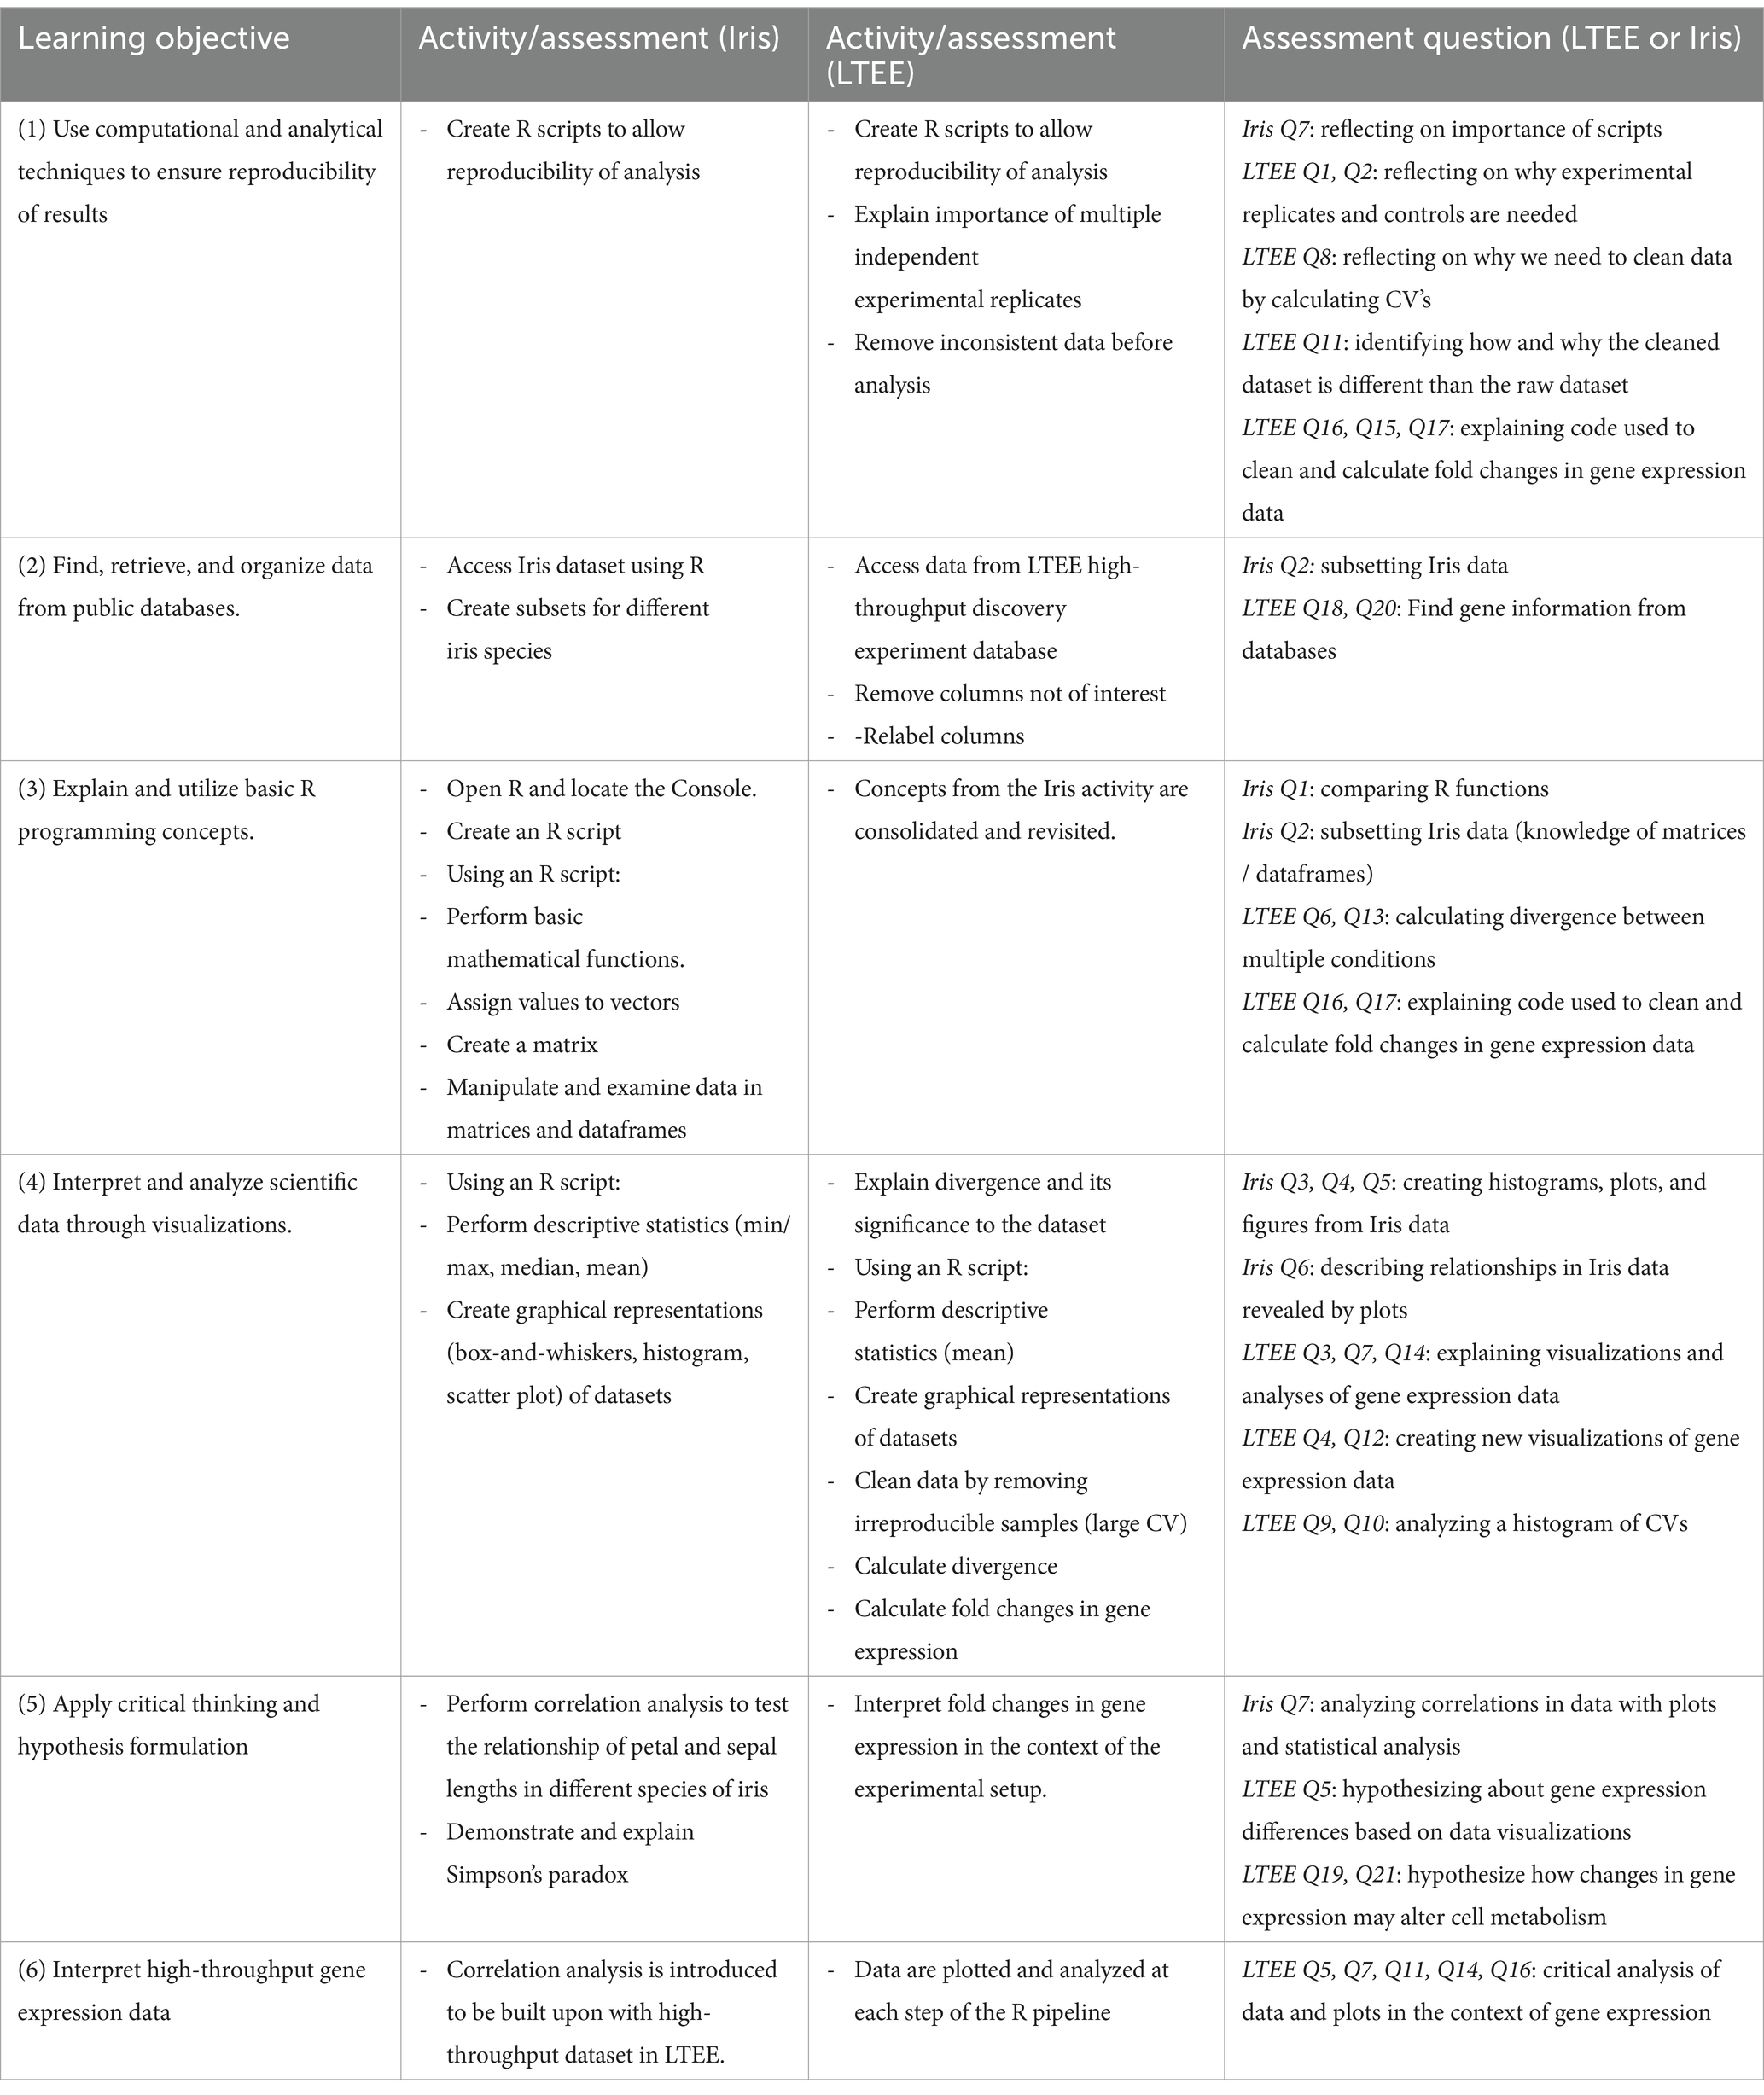
Table 1. Case study learning objectives, associated activities and assessment questions.
3 Learning environment
This case is designed for undergraduate students in their second semester or beyond in biology or bioinformatics courses. Case learning objectives and associated activities and assessments are described in Table 1. The case can also be broken down into parts to address specific learning outcomes if not all of them are relevant to the class (Figure 1). The full case study is available (Data Sheets 1–7 in Supplementary materials).
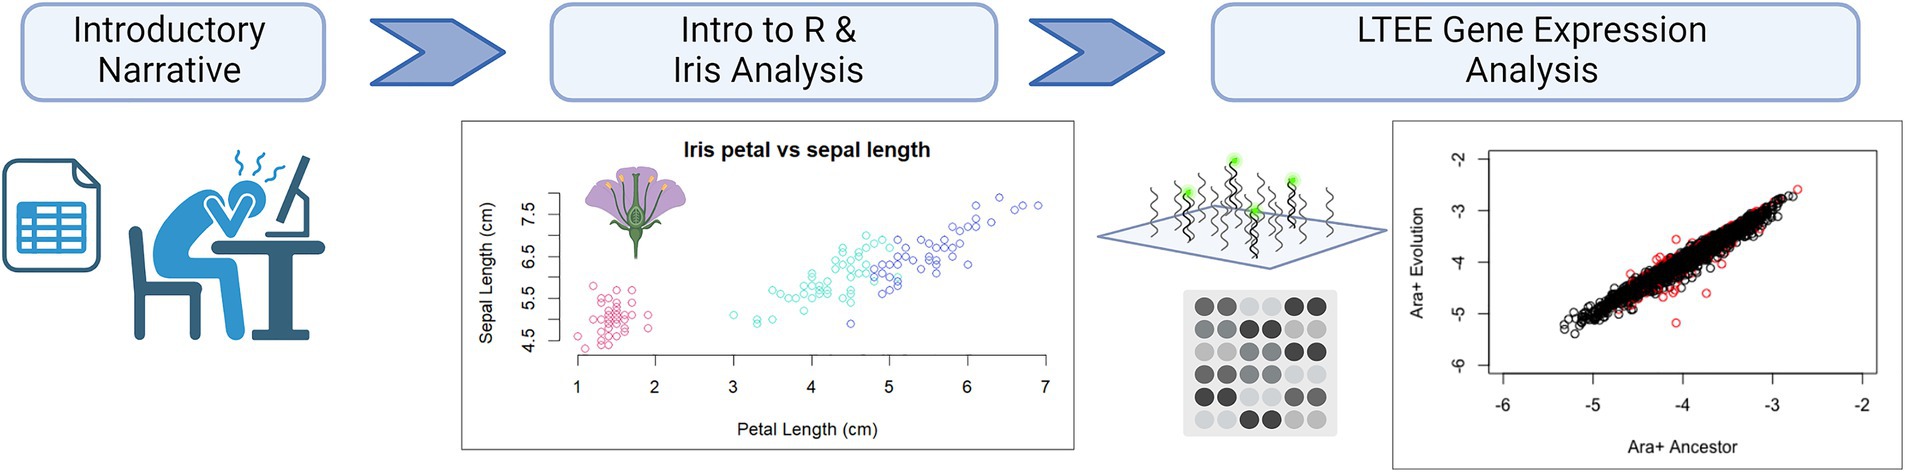
Figure 1. Workflow of the “R U Ready?” case study. First, students are introduced to the challenges of big data. Next, students install R, perform basic calculations, and work with the Iris dataset. Finally, students use R to download gene expression data from the Lenski lab’s long term evolution experiment (LTEE) and manipulate this dataset through R. Figure created in BioRender.
3.1 Iris module: introduction to R programming
The first module of the narrative introduces new users to R and walks through Iris, one of the standard training datasets included with the base package of R. While other introductions to R also use the Iris dataset, this version is written to specifically prime users with tools and approaches that can be transferred to and built upon in the LTEE gene expression module.
We begin the module by emphasizing the importance of reproducibility, our first learning objective, by having students create and save an R script, which will allow them to exactly reproduce the analysis they perform. We then focus on our second and third learning objectives, as students walk through basic functions in R and learn how computational objects, such as vectors and dataframes, are used to organize and manipulate data. Students next engage with summarizing data graphically using boxplots, histograms, and scatterplots. The Iris module concludes by introducing a brief analysis of correlations. Thus, students learn R data visualization and analysis tools as they apply critical thinking and hypothesis formation and testing to the Iris data. These techniques are used again in the analysis of the LTEE dataset in incrementally more challenging ways, so that students build upon their knowledge and see its usefulness in the context of large datasets. Many screenshots of what the interface should look like are incorporated to allow students to check their progress easily, and tips for ease of use are also included, as well as summarized in a separate “R Tips and Definitions” sheet (Data Sheet 4 in Supplementary materials). The RStudio environment makes use of a straightforward script and allows students to see the organization of the data as they work with it. This approach allows a beginner with no coding experience to start and successfully complete this case study with minimal help needed from the instructor.
3.2 LTEE module: analyzing gene expression data
The second module of the narrative focuses on analyzing the gene expression profiles from every gene in E. coli before and after 20,000 generations of passaging bacterial cultures, based on Lenski’s Long Term Evolution Experiment (LTEE) (Cooper et al., 2003). The dataset is relatively large without being too overwhelming for beginners: 4290 genes (rows) by 26 different culture conditions (columns). The size of the dataset is important because it helps new R users to understand the advantages of using R over other, more familiar, approaches, like spreadsheets. The experimental topic ties into key concepts from evolution and the Central Dogma of molecular biology that are covered in many biology courses. Students take on the role of a newly hired data scientist who needs to efficiently analyze this large dataset and present the results to their boss. The case walks through specific, sequential steps needed for the analysis, including downloading the data, graphing, cleaning, finding divergence, and finally creating a ranked list of genes that are differentially expressed in ancestral as compared to evolved populations of bacteria.
At each step, students are provided with code to enter into their script and run, along with an explanation of the function. Students then paste the code into R and view the results. Along the way, students answer questions about the data that they generate and are periodically asked to alter the provided code to compare different choices of variables within the dataset. Code modifications are relatively small and straightforward, giving students both agency and practice with practical applications of the code. After ultimately creating the ranked list of genes whose expression changed the most during laboratory evolution, instructors may optionally ask students to look into the function of the genes on the list to learn more about microbial metabolism. Emphasis is placed on the ability of the student to reproduce the analysis that was done in the published paper, both to show the student’s competency in using R, and to demonstrate the importance of carefully documenting data analysis so that it can be reproduced.
We avoided the use of downloaded R packages, sticking to “base R” functions that are included with the language itself, except for one package at the end of the LTEE module. While R packages can be extremely useful, they are somewhat confusing to beginners, including both students and instructors. Downloading and installing packages often results in warning and error messages that can be frustrating. In addition, packages are often updated, potentially causing incompatibilities. Thus, avoiding package use makes it more likely that the case study code will continue to function over time. Perhaps most importantly, packages can appear as “mystery boxes” whose function is not transparent to students. Having students manipulate vectors and dataframes themselves rather than utilizing a package can show them what manipulations are actually happening. For example, in the LTEE module, students “clean data” by calculating the coefficient of variation of various samples and selecting those that are below a particular threshold they choose themselves, rather than simply using a packaged routine that might hand them a “cleaned dataframe”.
4 Results
The case uses a narrative that evokes a typical late undergraduate scenario and introduces the student to the case as an early-career scientist. In doing so, it presents students with a rationale for why this software and approach make sense.
4.1 Implementation logistics
A typical implementation of both modules is expected to take a total of 4–5 h of class time with some work required outside of that time [for details, see Instructor’s Notes (Data Sheet S1 in Supplementary materials)], based on three separate implementations involving students from varied STEM backgrounds in their first through fourth years of undergraduate degrees. In general, more advanced students were better prepared for and were more successful in handling these activities. Students needed relatively little computational background, but did require a basic understanding of both evolution and gene expression to fully understand and interpret the entire case.
Our implementations took the form of two testing sessions with volunteers in a mock classroom environment and a third implementation as part of an undergraduate introductory course, “Exploring Bioinformatics and Computational Biology.” The initial testing sessions focused on delivery to undergraduate student workers, but included a graduate student and several faculty. These testing sessions were delivered in a hybrid mode with a shared screen. We collected feedback from testing sessions through discussion and comments made in shared documents. The implementation in the introductory class included students with a range of backgrounds, from first year bioinformatics majors to senior biology and computer science majors (n = 24). Half of the students in the bioinformatics class had a strong computer science background (12/24). About a third (9/24) were biology and biotechnology majors or first year bioinformatics and computational biology majors, both groups with little (1 course in high school or college) or no programming experience. Some students were aware of R but had never used it (8/24), while others had used R code written by someone else (9/24); some were proficient in R (7/24). From this class, we collected answers to content questions included in the case study (n = 12 groups of 2 students each) and survey feedback after the lesson was completed (n = 13 individuals).
In all of our implementations, we presented the case in two distinct sessions, each centered around a case module (Iris introduction and LTEE). These parts represent accessible and independent activities appropriate for lab or lecture. We tested the case by presenting the narrative as an integral part of the lesson. Pre-reading, which might consist of the narrative and/or the paper on which the case is built, could be used to streamline the in-class lesson and make more efficient use of in-class time. During meeting sessions, participants responded favorably to an interrupted approach, where the teacher/moderator presented a portion of the activity between code blocks.
4.2 Student responses and self-assessment of learning gains
Most of the students in the two initial testing sessions indicated that they had little experience with programming and were unaware or only vaguely aware of R. The students who gave feedback on the initial versions of this case study were a mix of biology and environmental science students, as well as faculty and an MS student. As discussed earlier, there are numerous barriers to learning and using a programming approach to data analysis. However, this introduction provides a step-by-step guide that allows students to be both self-directed and self-evaluate more than in many tutorials. In our preliminary test with a small group, the instructor provided context from the narrative and worked through the case in a hybrid environment. All participants used personal computers. Student-testers had strong positive responses to the screenshots that helped them orient to the new environment and identify the function of each pane in the RStudio environment. Our approach helped students gain confidence by executing straightforward commands using well-explained code, and verifying the results. As they progressed through the case, students reported feeling more capable and competent and actively used the questions to self-assess their new abilities to work within the R framework.
For the implementation in the introductory bioinformatics class, each module began with a short lecture based on the Narrative Introduction to the case study (Data Sheet S2 in Supplementary materials). Student groups paired by their level of R preparation then completed each module with the instructor and TA circulating to answer questions. While the class was in a computer lab, most students preferred to use their own laptops. Student groups turned in answers to all of the content questions included with each module. In addition, we asked students to identify what they liked about the modules and any issues or problems they had. We also asked students to complete a self-assessment survey after finishing both modules.
In response to questions about what they liked and had trouble with in the modules, students reported similar positive responses to the Iris module as in our initial testing sessions (Table 2). These included comments about ease of use for beginners, structuring the code and explanations into small pieces that were easy to understand and test, and the helpfulness of screenshots as a reference for what should be appearing on the console. There were many positive responses to the LTEE module as well. Students mentioned enjoying seeing an application of programming to real biological data, and learning what a data pipeline looks like by going through the process step-by-step.

Table 2. Positive student comments on modules overall.
Many of the problems that students reported led us to make minor wording changes to clear up confusion over specific questions, mostly in the LTEE module. One area that caused confusion involved misunderstanding how the evolution experiment was performed. We wrote a detailed description of the experiment in the “Instructor Notes” (Data Sheet S1 in Supplementary materials) that should address this problem. The other areas that caused confusion involved exactly how coefficients of variation (CVs) were calculated and particular genes of interest were chosen by the researchers for further analysis. In response to this student input, we re-wrote sections of the LTEE tutorial to include more explanation of the use of CVs. We also broke up one long explanation into several smaller ones, interspersing blocks of code to make it easier to see what each code block was doing. Several reflection questions were added to ensure that students were understanding what the code was doing, and not just cutting and pasting code.
Students responded very positively in the self-assessment survey; the lowest median response was 6.5/10 (n = 13), and that question was not about the use of R (Table 3). On comparing responses by students with no R experience (n = 5) to those with some R experience (n = 8), we noted that both groups felt strongly that reproducibility is important and R is a useful tool for quantitative analysis. As would be expected, students with more R background reported slightly more confidence in using R for most categories we asked about, The exception was the ability to interpret high throughput data, where students with no R background were somewhat more confident, perhaps because they may have had more biology background. Differences between the groups were small and not statistically significant, supporting the idea that students with many levels of preparation were confident in their ability to perform many standard tasks in R upon completing the two modules (Figure 1).
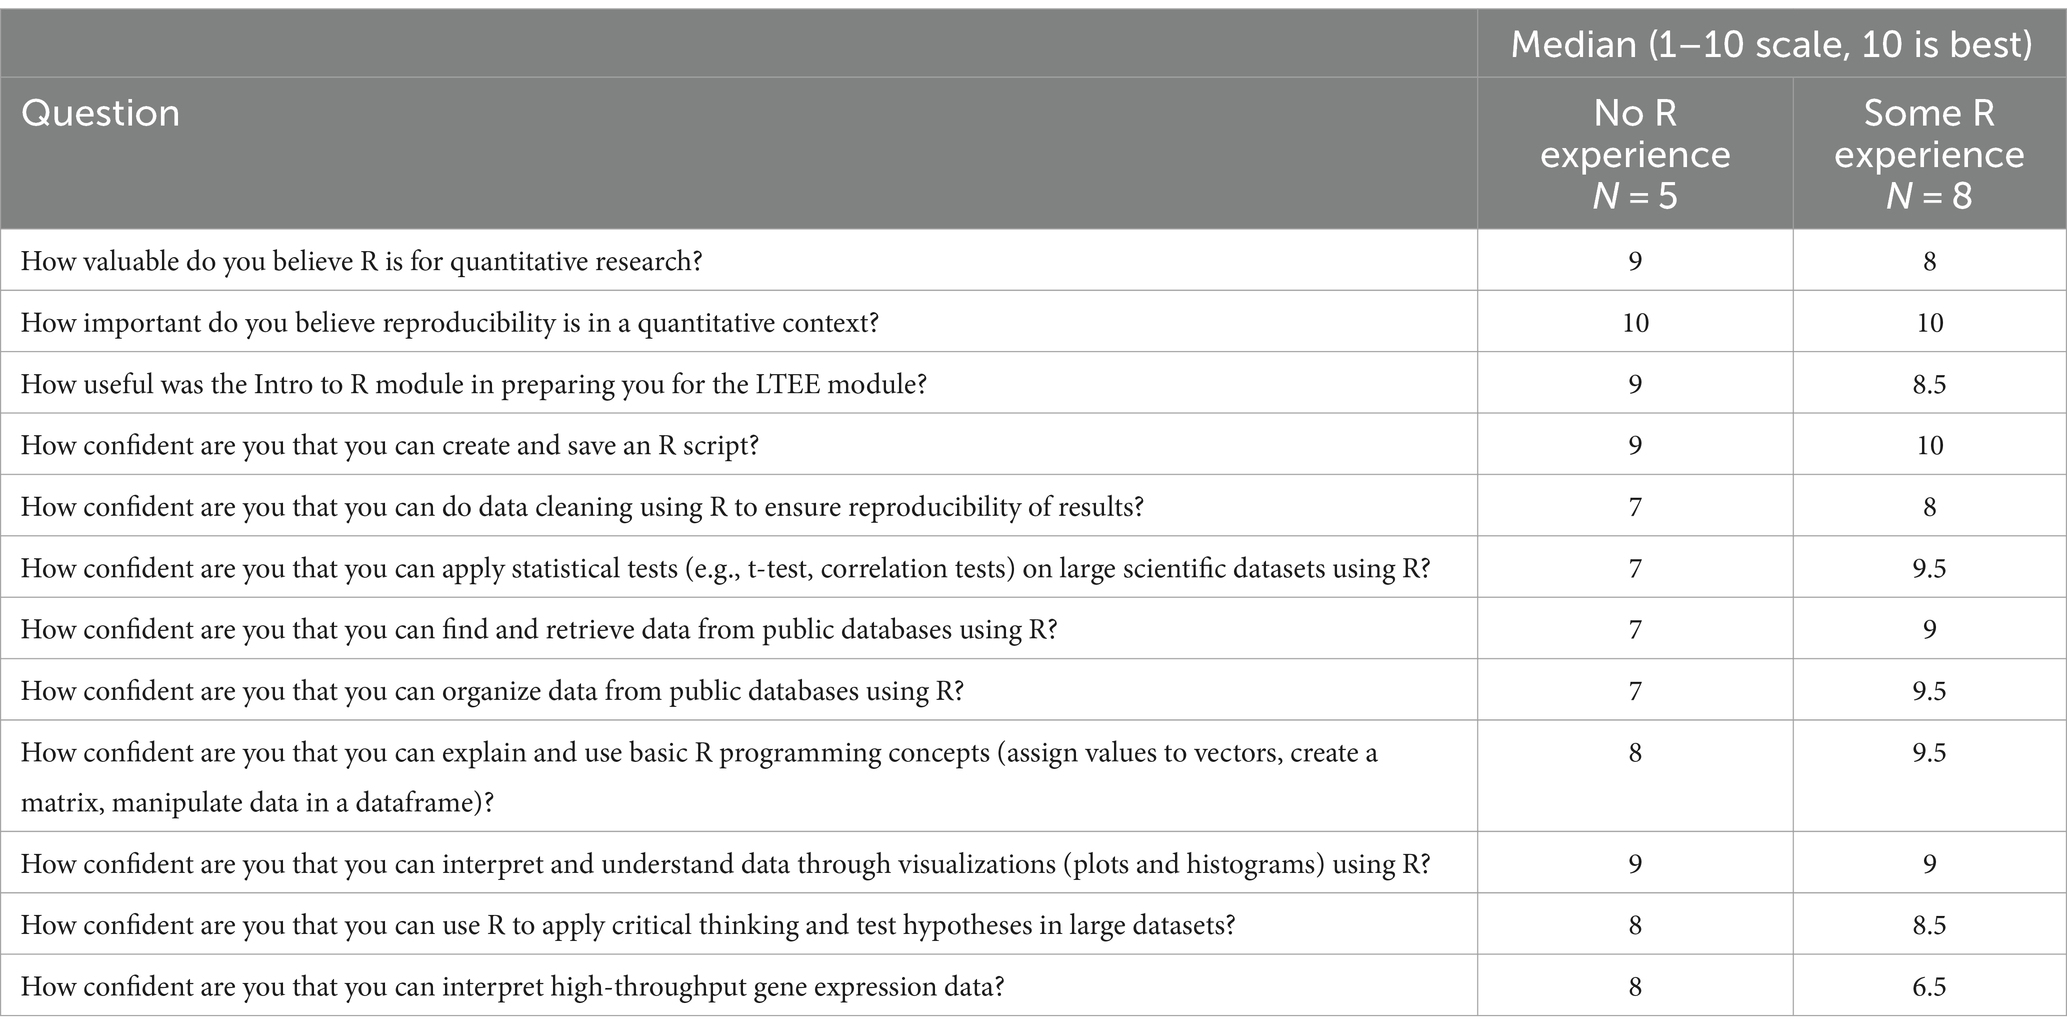
Table 3. Student responses to post-exercise classroom survey.
4.3 Students completing the case study modules achieved the desired learning objectives
To assess student achievement of our learning objectives, we examined student responses to several key questions in each module (Supplementary Table S1 in Supplementary materials). While we had only a small number of students participating in our pilot study (n = 24), their answers suggested that the students met our learning objectives, in that most were able to achieve a good understanding of the six questions that we chose. These questions could form a solid basis for a more detailed assessment of a larger set of students in the future. Questions and student sample answers are shown in Supplementary Table S1 in Supplementary materials and Figure 2.
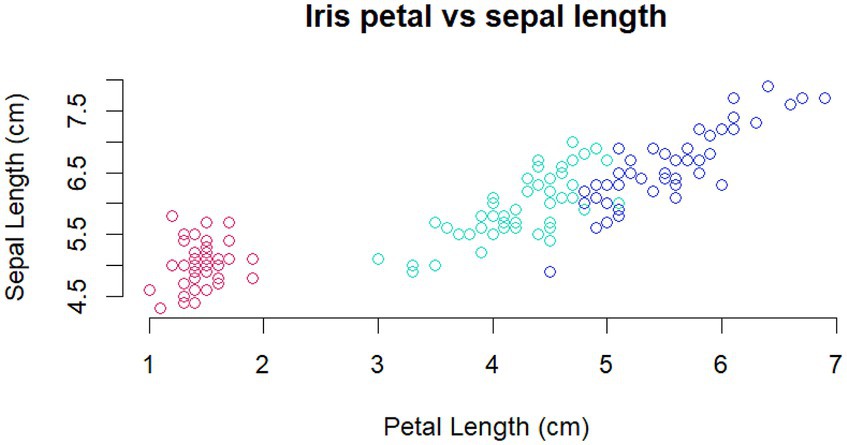
Figure 2. Example of student answer to Iris Q5, generated in R. Student Legend: Figure. Iris petal vs. sepal length: a scatter plot showing the relationship between petal and sepal lengths in three species of Iris. The pink circles correspond to Iris setosa, the green circles correspond to Iris versicolor, and the blue circles correspond to Iris virginica.
To assess student understanding of the importance of reproducibility (LO 1), we reviewed one question from each module (Supplementary Table S1 in Supplementary materials). In the Iris module, we asked students to state why R scripts are important (Iris Q7). In their answers, 10 of the 12 student groups mentioned the words “reproducibility,” “replication,” “repeatable,” or “standardization”; two typical answers are shown in Supplementary Table S1 in Supplementary materials. In the LTEE module, we asked why the coefficient of variation (CV) was calculated for the gene expression values (LTEE Q8). This question was meant to address the importance of data analysis in assessing how reproducible the experimental results were. Eleven of the 12 student groups understood the important point that large CV’s suggested that the data were highly variable and thus not very reproducible, and should thus be eliminated from the analysis.
We chose several questions to assess students’ ability to use R to help them organize, visualize, and think critically about data (LO’s 2,3,4,5). After being introduced to R scripts, vectors, dataframes, histograms, and plots, students completing the Iris section of the case were asked to complete their own figure (Iris Q5). All of the students completing the Iris exercise were able to accomplish this task and produce a figure; a typical example is shown (Figure 2). Every student group completing the LTEE exercise was able to create graphs showing correlations in gene expression between ancestral and evolved groups of genes. In answering LTEE Q14, all student groups also showed a good understanding of the idea that deleting the most variable genes from the dataset would be expected to increase the size of the correlation (reduce the divergence) (Supplementary Table S1 in Supplementary materials).
Finally, to assess the students’ ability to understand the larger picture of high throughput gene expression analysis, we looked at their answers to two questions near the end of the LTEE module. LTEE Q16 concerned a dataframe that students constructed using R. The question required students to show that they understood that the dataframe contained gene expression data, and that statistical tests were conducted in order to select only genes that had significant differences in expression. Eleven of the 12 student groups understood that the data represented significant fold-changes in gene expression levels, which was the important point. Half of the group did not understand subtler aspects of the analysis that were not essential to interpreting the overall result, but useful in discriminating students’ understanding of what the R code was doing in detail. LTEE Q17 simply required students to go back through the exercise and record all the steps that were taken and why; this allowed us to assess that students were reading and understanding explanations of each step in the pipeline and not just cutting and pasting code. Several student groups left out of their summary the critical last step of the analysis (calculating gene expression fold-changes), which caused us to rewrite the last section of the exercise with more explanation and smaller code blocks, as mentioned above.
5 Discussion
5.1 Practical implications
As genomic data collection methods continue to generate increasingly large amounts of data, traditional analysis methods (e.g., Microsoft Excel) become increasingly unwieldy and impractical. In addition, the data visualization and statistical capabilities of most spreadsheet software programs are somewhat limited. Our case study allows students to experience this problem first-hand and work with tools (i.e., R) that will overcome this limitation. By immersing themselves in the life of a researcher, students gain an appreciation of working with large datasets, including the types of experiments that generate such data, the programming tools needed to process and visualize the data, and the types of questions that can be asked with the data. These skills will be increasingly valuable and marketable in the future.
By using and modifying, but not creating, R code, students are able to experience a ‘zero entry’ into the world of bioinformatics programming. The emphasis throughout the case is on understanding and modifying existing code to analyze an existing dataset. This use of R also reflects the ‘real world’ experience of researchers, who often use pre-existing code from their labmates, collaborators, or GitHub to analyze novel data.
In addition to data processing skills, the case reinforces the biology concepts of gene expression and evolution through connection to recent research in these areas. The dataset used includes levels of gene expression across the entire genome for pre- and post-evolved bacterial strains as part of the long-term evolution experiment. Biology students can relate the concepts of genes, transcription and translation, and metabolic functions to the case material. Sorting the relative expression levels also gives students a sense of how researchers reach biological conclusions from large datasets. While further details are not needed for completion of the case, instructors can optionally have students learn about micro/macroarrays, adaptive laboratory evolution, and details of data normalization and statistical tests. For lower-level students, the stand-alone analysis of flower structures (Iris dataset) can be used as a simpler entry to R analysis of biological datasets using features that are noticeable by eye.
5.2 Lessons learned and reflections
The progression from the Iris module, which provides an introduction to R programming, to the more complex LTEE module equips students with a scaffolded learning experience, gradually building their proficiency and confidence in data analysis. The emphasis on understanding the utility of R over writing code aligns with the broader goal of growing data literacy and confidence among students.
While most students (and instructors) find RStudio straightforward to use, the idea of using command line programming can induce an initial negative emotional response in students who do not have experience in this area (Chang, 2005; Forrester et al., 2022; Lapierre et al., 2023). To alleviate some of this coding anxiety, the case presented here uses an explicit step-by-step protocol to help students use, explain, and modify existing R code, rather than write it from scratch. Since researchers often use code from online repositories or colleagues, knowing how to read and run the code is a valid professional skill. Going through the exercises during a synchronous class period when instructors are available to offer assistance as students progress and providing out-of-class resources (student handouts and tips sheets) help to alleviate student apprehension (Forrester et al., 2022; Liu et al., 2023).
6 Acknowledgment of constraints
This case employs RStudio, which is freely available; it can be downloaded onto a computer, requiring a certain level of computational power (e.g., Chromebooks will not be compatible), or used in the cloud. RStudio is screen reader capable; while colors are used for displaying parts of the code, the colors are not necessary for obtaining the information. The instructor should have some familiarity with R, which could come from completing the case themself and reading the Instructor Notes (Data Sheet S1 in Supplementary materials). There are also many online resources available for learning and troubleshooting R. While time estimates are given, students may take more or less time for completion of each section. This case is designed to be a first look at data analysis that requires the advanced computational power that comes from using command line coding; it does not teach students how to code or prepare them for analysis of all large datasets. However, completion of this case should decrease the barrier, and related anxiety, of using command line coding in the future.
Our implementation groups included students with diverse learning backgrounds. Our initial testing groups were students with biology backgrounds and no programming experience. Most of the students in the introductory bioinformatics class had more programming experience, although about a third were biology and biotechnology majors or first year bioinformatics and computational biology majors with little or no programming experience. Interestingly, most of the responses to both modules were highly positive across all backgrounds. Those with weaker programming backgrounds, typical of many life science students, appreciated the step-by-step and highly scaffolded approach to learning to code. Students from all backgrounds appreciated seeing the application of statistics and programming to real biological data. While our test group was limited in size, the results provide confidence that this module can be successfully used for many undergraduate biology and bioinformatics courses.
Data availability statement
Publicly available datasets were analyzed in this study. This data can be found at: https://lenski.mmg.msu.edu/ecoli/arrays/index.html. Relevant student data is included in the publication. Further student data could be identified and is not publicly available, per WPI IRB rules.
Ethics statement
The studies involving humans were approved by Worcester Polytechnic Institute Institutional Review Board. The studies were conducted in accordance with the local legislation and institutional requirements. The participants provided their written informed consent to participate in this study.
Author contributions
AP: Conceptualization, Data curation, Software, Visualization, Writing – original draft, Writing – review & editing. AB: Conceptualization, Validation, Visualization, Writing – original draft, Writing – review & editing. SC: Conceptualization, Validation, Visualization, Writing – original draft, Writing – review & editing. JK: Conceptualization, Validation, Visualization, Writing – original draft, Writing – review & editing. TL: Conceptualization, Data curation, Investigation, Software, Visualization, Writing – review & editing, Methodology. ER: Conceptualization, Data curation, Investigation, Software, Visualization, Writing – original draft, Writing – review & editing, Methodology.
Funding
The author(s) declare that financial support was received for the research, authorship, and/or publication of this article. Funding for this collaborative project was provided by the National Science Foundation as part of the High-throughput Discovery Science & Inquiry-based Case Studies for Today’s Students (HITS) under RCN-UBE #1730317. AP, AB, JK, and TL were Fellows supported by the HITS Network. ER was a member of the HITS Advisory Board. Funding for the publication of the article was provided by the NC State Biotechnology Program annual operating budget and Professional Development funds from Worcester Polytechnic Institute.
Conflict of interest
The authors declare that the research was conducted in the absence of any commercial or financial relationships that could be construed as a potential conflict of interest.
Publisher’s note
All claims expressed in this article are solely those of the authors and do not necessarily represent those of their affiliated organizations, or those of the publisher, the editors and the reviewers. Any product that may be evaluated in this article, or claim that may be made by its manufacturer, is not guaranteed or endorsed by the publisher.
Supplementary material
The Supplementary material for this article can be found online at: https://www.frontiersin.org/articles/10.3389/feduc.2024.1379910/full#supplementary-material
Footnotes
References
AAAS (American Association for the Advancement of Science). (2010). Vision and Change: A Call to Action. Washington, D.C.: AAAS.
Attwood, T. K., Blackford, S., Brazas, M. D., Davies, A., and Schneider, M. V. (2019). A global perspective on evolving bioinformatics and data science training needs. Brief. Bioinform. 20, 398–404. doi: 10.1093/bib/bbx100
Attwood, T. K., Bongcam-Rudloff, E., Brazas, M. E., Corpas, M., Gaudet, P., Lewitter, F., et al. (2015). GOBLET: the global organisation for bioinformatics learning, education and training. PLOS Comput. Biol. 11:e1004143. doi: 10.1371/journal.pcbi.1004143
Bernhardt, P. E., and Richmond, A. S. (2021). Promoting critical thinking through the use of student generated case studies. Research anthology on developing critical thinking skills in students (pp. 1-10). IGI Global. doi: 10.4018/978-1-7998-3022-1.ch050
Bixler, A., Eslinger, M., Kleinschmit, A. J., Gaudier-Diaz, M. M., Sankar, U., Marsteller, P., et al. (2021). Three steps to adapt case studies for synchronous and asynchronous online learning. J. Microbiol. Biol. Educ. 22:22.1.22. doi: 10.1128/jmbe.v22i1.2337
Camill, P. (2006). “Case Studies add Value to a Diverse Teaching Portfolio in Science Courses.” Journal of College Science Teaching 36, 31–37.
Campbell, C. E., and Nehm, R. H. (2017). A Critical Analysis of Assessment Quality in Genomics and Bioinformatics Education Research. CBE—Life Sciences Education. 12. doi: 10.1187/cbe.12-06-0073
Chamany, K. (2006). Science and social justice: making the case for case studies. J. Coll. Sci. Teach., 36, 54–59.
Chang, S. E. (2005). Computer anxiety and perception of task complexity in learning programming-related skills. Comput. Hum. Behav. 21, 713–728. doi: 10.1016/j.chb.2004.02.021
Clemmons, A. W., Timbrook, J., Herron, J. C., and Crowe, A. J. (2020). BioSkills guide: development and National Validation of a tool for interpreting the vision and change Core competencies. CBE life. Sci. Educ. 19:ar53. doi: 10.1187/cbe.19-11-0259
Cook-Snyder, D. R. (2017). Using case studies to promote student engagement in primary literature data analysis and evaluation. J. Undergrad. Neurosci. 16, C1–C6.
Cooper, T. F., Rozen, D. E., and Lenski, R. E. (2003). Parallel changes in gene expression after 20,000 generations of evolution in Escherichia coli. Proc. Natl. Acad. Sci. U.S.A. 100, 1072–1077. doi: 10.1073/pnas.0334340100
Del Toro, I., Dickson, K., Hakes, A. S., and Newman, S. L. (2022). Early Undergraduate Biostatistics & Data Science Introduction Using R, R studio & the Tidyverse. Am. Biol. Teach. 84, 124–129. doi: 10.1525/abt.2022.84.3.124
Dill-McFarland, K. A., König, S. G., Mazel, F., Oliver, D. C., McEwen, L. M., Hong, K. Y., et al. (2021). An integrated, modular approach to data science education in microbiology. PLoS Comput. Biol. 17:e1008661. doi: 10.1371/journal.pcbi.1008661
Forrester, C., Schwikert, S., Foster, J., and Corwin, L. (2022). Undergraduate R Programming anxiety in ecology: persistent gender gaps and coping strategies. CBE Life Sci. Educ. 21:ar29. doi: 10.1187/cbe.21-05-0133
Greene, A. C., Giffin, K. A., Greene, C. S., and Moore, J. H. (2016). Adapting bioinformatics curricula for big data. Brief. Bioinform. 17, 43–50. doi: 10.1093/bib/bbv018
Harman, T., Bertrand, B., Greer, A., Pettus, A., Jennings, J., Wall-Bassett, E., et al. (2015). Case-based learning facilitates critical thinking in undergraduate nutrition education: students describe the big picture. J. Acad. Nutr. Diet. 115, 378–388. doi: 10.1016/j.jand.2014.09.003
Herreid, C. F. (1994). Case studies in science: a novel method of science education. J. Coll. Sci. Teach., 23, 221–229.
Herreid, C. F., and Schiller, N. A. (2013). Case studies and the flipped classroom. J. Coll. Sci. Teach., 42, 62–66.
Herreid, C. F., Schiller, N. A., and Herreid, K. F. (2011). Science stories: using case studies to teach critical thinking. Nat. Sci. Teach. Assoc. doi: 10.2505/9781936137251
Işık, E. B., Brazas, M. D., Schwartz, R., Gaeta, B., Palagi, P. M., van Gelder, C. W. G., et al. (2023). Grand challenges in bioinformatics education and training. Nat. Biotechnol. 41, 1171–1174. doi: 10.1038/s41587-023-01891-9
Kleinschmit, A. J., Rosenwald, A., Ryder, E. F., Donovan, S., Murdoch, B., Grandgenett, N. F., et al. (2023). Accelerating STEM education reform: linked communities of practice promote creation of open educational resources and sustainable professional development. Int. J. STEM Educ. 10:16. doi: 10.1186/s40594-023-00405-y
Lapierre, H. G., Charland, P., and Léger, P.-M. (2023). Looking “under the hood” of learning computer programming: the emotional and cognitive differences between novices and beginners. Comput. Sci. Educ. 22, 1–22. doi: 10.1080/08993408.2023.2214033
Li, R. (2021). Teaching undergraduates R in an introductory research methods course: a step-by-step approach. J. Polit. Sci. Educ. 17, 653–671. doi: 10.1080/15512169.2019.1667811
Liu, I.-F., Hung, H.-C., and Liang, C.-T. (2023). A study of programming learning perceptions and effectiveness under a blended learning model with live streaming: comparisons between full-time and working students. Interact. Learn. Environ. 15, 1–15. doi: 10.1080/10494820.2023.2198586
Mulder, N., Schwartz, R., Brazas, M. D., Brooksbank, C., Gaeta, B., Morgan, S. L., et al. (2018). The development and application of bioinformatics core competencies to improve bioinformatics training and education. PLoS Comput. Biol. 14:e1005772. doi: 10.1371/journal.pcbi.1005772
Nolan, D., and Temple Lang, D. (2015). Explorations in statistics research: an approach to expose undergraduates to authentic data analysis. Am. Stat. 69, 292–299. doi: 10.1080/00031305.2015.1073624
Posit Software, PBC formerly RStudio, PBC (2024). RSTUDIO IDE Posit [Internet]. Available at: https://posit.co/products/open-source/rstudio/
Robertson, S. D., Bixler, A., Eslinger, M. R., Gaudier-Diaz, M. M., Kleinschmit, A. J., Marsteller, P., et al. (2021). HITS: Harnessing a Collaborative Training Network to Create Case Studies that Integrate High-Throughput, Complex Datasets into Curricula. Front. Educ., 6. doi: 10.3389/feduc.2021.711512
Rosenwald, A. G., Pauley, M. A., Welch, L., Elgin, S. C. R., Wright, R., and Blum, J. (2016). The course source bioinformatics learning framework. CBE Life Sci. Educ. 15:le2. doi: 10.1187/cbe.15-10-0217
Ryder, E. F., Morgan, W. R., Sierk, M., Donovan, S. S., Robertson, S. D., Orndorf, H. C., et al. (2020). Incubators: building community networks and developing open educational resources to integrate bioinformatics into life science education. Biochem. Mol. Biol. Educ. Bimon. Publ. Int. Union 48, 381–390. doi: 10.1002/bmb.21387
Theobald, E. J., Hill, M. J., Tran, E., and Freeman, S. (2020). Active learning narrows achievement gaps for underrepresented students in undergraduate science, technology, engineering, and math. PNAS. 117, 6476–6483. doi: 10.1073/pnas.1916903117
Welch, L., Lewitter, F., Schwartz, R., Brooksbank, C., Radivojac, P., Gaeta, B., et al. (2014). Bioinformatics curriculum guidelines: toward a definition of core competencies. PLoS Comput. Biol. 10:e1003496. doi: 10.1371/journal.pcbi.1003496
White, T. K., Whitaker, P., Gonya, T., Hein, R., Kroening, D., Lee, K., et al. (2009). The use of interrupted case studies to enhance critical thinking skills in biology. J. Microbiol. Biol. Educ. 10, 25–31. doi: 10.1128/jmbe.v10.96
Williams, J. J., Drew, J. C., Galindo-Gonzalez, S., Robic, S., Dinsdale, E., Morgan, W. R., et al. (2019). Barriers to integration of bioinformatics into undergraduate life sciences education: a national study of US life sciences faculty uncover significant barriers to integrating bioinformatics into undergraduate instruction. PLoS One 14:e0224288. doi: 10.1371/journal.pone.0224288
Keywords: high-throughput data analysis, R programming, case studies, evolutionary biology, data cleaning, data visualization, summary statistics, reproducibility
Citation: Pomeroy AE, Bixler A, Chen SH, Kerr JE, Levine TD and Ryder EF (2024) “R” U ready?: a case study using R to analyze changes in gene expression during evolution. Front. Educ. 9:1379910. doi: 10.3389/feduc.2024.1379910
Edited by:
Davida Smyth, Texas A&M University San Antonio, United StatesReviewed by:
Michael J. Wolyniak, Hampden–Sydney College, United StatesJeremy Seto, New York City College of Technology, United States
Copyright © 2024 Pomeroy, Bixler, Chen, Kerr, Levine and Ryder. This is an open-access article distributed under the terms of the Creative Commons Attribution License (CC BY). The use, distribution or reproduction in other forums is permitted, provided the original author(s) and the copyright owner(s) are credited and that the original publication in this journal is cited, in accordance with accepted academic practice. No use, distribution or reproduction is permitted which does not comply with these terms.
*Correspondence: Elizabeth F. Ryder, cnlkZXJAd3BpLmVkdQ==