 Wen-Jing Cai1,2
 Xu-Fang Liang
 Shan He
- 1Chinese Perch Research Center, College of Fisheries, Huazhong Agricultural University, Wuhan, China
- 2Innovation Base for Chinese Perch Breeding, Key Lab of Freshwater Animal Breeding, Ministry of Agriculture, Wuhan, China
Although studies have determined that epigenetics plays an essential role in regulating metabolism in mammals, research on nutrition-related DNA methylation remains to be lacking in teleosts. In the present study, we provided a hepatic whole-genome DNA methylation analysis in grass carp fed with moderate- or excessive-carbohydrate-level diet. Although a high-carbohydrate (HC) diet significantly changed the mRNA expression levels of metabolic genes, it did not affect the global genomic DNA methylation levels in grass carp liver. However, compared with the control group, 3,972 genes were hyper-methylated and 2,904 genes were hypo-methylated in the promoter region. Meanwhile, 10,711 genes were hyper-methylated and 6,764 genes were hypo-methylated in the gene body region in the HC group. These differentially methylated genes (DMGs) were enriched in multiple pathways, including carbohydrate metabolism, insulin pathway, lipid metabolism, and adipocytokine signaling pathway. In addition, the variations in DNA methylation significantly regulated the transcription levels of key genes of metabolism, which could affect the glucose concentrations and the lipid deposition of grass carp. Furthermore, we compared the DNA methylation alterations of genes in glucose metabolism and obesity pathways of grass carp with those of mammalian models in different nutritional states. The results showed that most of the DMGs in grass carp were also regulated by DNA methylation in mammals when the nutritional state changed. The findings revealed more differentially methylated regions and candidate genes for glucose metabolism and broken species boundaries.
Introduction
Carbohydrate acts as the primary substance of metabolism in vertebrates, especially in mammals. However, many fish are considered as glucose intolerant, especially carnivorous fish. After having been fed with excessive carbohydrate, they exhibit a persistent postprandial hyperglycemia, appetite decrease, and subsequently a decrease in growth rate and even a “fatty liver.” Carnivorous fish, such as rainbow trout (Oncorhynchus mykiss), cannot tolerate more than 20% of digestible carbohydrate in their diet (1). However, intolerance to glucose is not apparent in herbivorous and omnivorous fish. They possess greater ability to digest and utilize dietary carbohydrate compared to carnivorous fish. Despite all that, carbohydrate is usually regarded as an economical food source because of its protein-sparing effect on reducing dietary protein contents in aquafeed (2).
In recent years, remarkable progress has been made in building fish species as diabetes research models (3). A diet-induced obese zebrafish model exhibited symptoms of type 2 diabetes (T2D) such as hyperinsulinemia and impaired glucose tolerance (4). Other non-traditional fish species have also been used as models for diabetes studies. Tilapia (Oreochromis niloticus) and goby (Gillichthys mirabilis) have been established as type 1 diabetes models (5, 6). Blind cavefish (Astyanax mexicanus) is born with insulin-resistant and diabetes-like phenotypes without the usual complications. A study on blind cavefish provided potential insights into better controlling high blood glucose in diabetes patients (7). Glucose/carbohydrate metabolism and utilization continues to be a contentious issue in fish as an economical food source and diabetes research models.
Recently, attention has been paid to exploring the function of epigenetics in the glucose metabolism and obesity, especially DNA methylation. Obese rats fed with high-fat diet revealed a hypermethylation of hepatic glucokinase (gck) and pyruvate kinase (pk) genes in the promoter region, suggesting the relevance between metabolic syndrome and epigenetic regulation (8). High fructose intake induced a hypermethylation of perixisome proliferation-activated receptor alpha (pparα) and carnitine palmitoyltransferase 1a (cpt1a) genes in the promoter region in rat liver (9). DNA methylation influenced phenotype transmission and development of diseases, including T2D. In the pancreas of T2D patients, hypermethylation of peroxisome proliferator-activated receptor gamma coactivator 1 alpha (pgc1a), pancreatic pdx l (pdx1), and insulin (ins) genes decreased the mRNA expression levels of these genes (10–12). Volkov described the comprehensive features of DNA methylome in the pancreatic islet of humans with or without diabetes (13). The studies discovered novel diabetes-related changes of DNA methylation and suggested the importance of epigenetics in T2D. Ma and Kang demonstrated the relationship between environmental factors and DNA methylation regulation, concluding that differential methylated regions and genes are associated with obesity and T2D (14). Although studies have determined metabolism-associated epigenetic variations in mammals, research on nutrition-related DNA methylation remains to be lacking in teleosts.
The production of grass carp (Ctenopharyngodon idella) composes the largest aquaculture industry in China. As a typical herbivorous fish, it possesses greater capability to utilize carbohydrate compared with omnivorous and carnivorous fish (15). Gao et al. (16) revealed that the growth rates of grass carp were maximal when the dietary carbohydrate level was 274.7 g kg−1. According to our previous studies, the concentrations of serum glucose and insulin were significantly increased in grass carp when the dietary carbohydrate level was 42% (17). A high-carbohydrate diet (more than 40%) also increased serum cholesterol and total lipid contents; however, it suppressed appetite in grass carp (18). To address the knowledge gap of glucose metabolism and obesity-related epigenetics in fish, our study provided an in-depth analysis of whole-genome DNA methylation of grass carp liver. Furthermore, we compared the DNA methylation alterations of key genes related to glucose metabolism with those of other animal models to reveal novel differentially methylated regions and candidate genes for more information on disorders of glucose metabolism.
Materials and Methods
Experimental Diets
The formulation of diet was designed based on our previous research. Different diets which satisfied the nutritional requirement of grass carp but with varied carbohydrate levels (25.00 and 42.00 g 100g−1, named as control group and HC group) were produced (17). Table 1 displays the composition and the chemical component analysis of the two diets. All the ingredients used in the diet were purchased from Fulong Dietary Company (Wuhan, China). The ingredients were finely ground, fully mixed, and dry-pelleted into 1.5-mm pellets using a pellet mill.
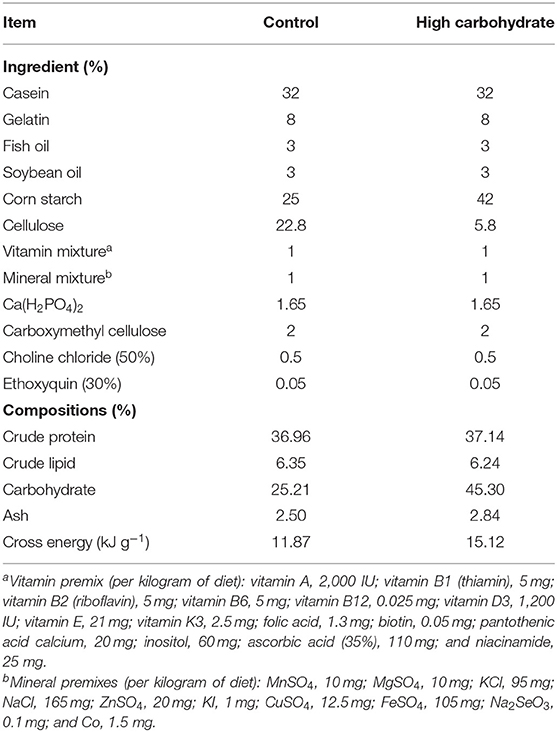
Table 1. Composition of the experimental diets.
Experimental Conditions and Sample Collection
Experimental grass carp were purchased from the Fish Center in Xiantao, Hubei Province, China, and kept in 1,000-L tanks with constant flow of filtered water. The fish were fed twice a day at 9:00 a.m. and 6:00 p.m. for 2 weeks to be acclimated to the feeding conditions. After acclimation, the fish (196.82 ± 2.64 g) were randomly distributed into six 1,000-L tanks (three tanks per group) with 15 fish per cage. During the experiment, the fish were fed with equal quantities of the experimental diets at 9:00 a.m. and 6:00 p.m. for 6 weeks. At 2 h after feeding, the residual diets were collected and dried at 60°C and then weighed for calculation of food intake. At the end of the feeding trial, all the fish were anesthetized with MS-222 and weighed ~24 h after the last feeding. In each group, six fish were randomly captured and dried at 60°C or frozen at −20°C until the analysis of body composition. Another six fish were randomly captured; the small pieces of liver were immediately collected and frozen in liquid nitrogen and stored at −80°C for isolation of DNA and RNA. Blood was collected from the caudal vein and centrifuged at 3,500 g for 30 min, and then the serum was separated and stored at −80°C until use.
The crude lipid was determined based on ether extraction method by Soxtec System HT (Soxtec System HT6, Tecator, Sweden). The glucose contents were determined using an automatic biochemical analyzer (Abbott Aeroset Analyzer, USA) in Zhongnan Hospital of Wuhan University (Wuhan, Hubei, China). The insulin levels were detected by enzyme linked immunosorbent assay (ELISA) based on the manual of the Fish Insulin ELISA kit (Xinle, Shanghai, China).
Extraction of DNA and Bisulfite Conversion
The hepatic genomic DNA of three grass carp in each group was extracted using TIANamp Genomic DNA Kit (Tiangen, Beijing, China) in accordance with the standard procedures. An Eppendorf BioPhotometer (Hamburg, Germany) and 1.5% agarose gel electrophoresis were used to detect the integrity and the quantity of genomic DNA.
Library Preparation and Quantification
For whole-genome bisulfite sequencing (WGBS) library construction, the genomic DNA of grass carp liver was fragmented by sonication with a Bioruptor (Diagenode, Belgium) to an average size of around 250 bp, followed by having it end-repaired, 3-end-adenylated, and ligated with adapters, essentially based on the instructions of the manufacturer. Using EZ DNA Methylation-Gold kit (ZYMO), the ligated DNA was bisulfite-converted. Fragments were extracted from the same lane of 2% agarose gel. Lastly, the products were purified with QIAquick Gel Extraction kit (Qiagen) and amplified by PCR.
The Whole-Genome Bisulfite Sequencing and Identification of DMRs
The libraries were sequenced on Illumina Hiseq Xten platform. The peak signal was transformed into base sequence by base calling as raw reads. The data of raw reads were filtered to guarantee the quality, including the removal of reads with more than 10% N content or more than 10% low-quality bases. The final filtered data were called clean reads.
Mapping Reads to the Grass Carp Genome Database
After filtering, the clean reads were mapped to the reference genome (http://www.ncgr.ac.cn/grasscarp/) by the Bisulfite Sequence Mapping Program. Then, the duplication reads were removed, and the mapping rate and the bisulfite conversion rate of each sample were calculated.
Identification of Methylation Levels and Differentially Methylated Regions
DNA methylation level was calculated by dividing the read number of each methyl-cytosine (mC) by the total read number of cytosines, equal to the mC/C ratio at each reference cytosine. The methylation levels of the C site were counted as Nm/(Nm + Nnm). Nm represented the reads of mC, while Nnm meant the non-methylation reads.
The differentially methylated regions (DMRs) between two groups of grass carp were identified by comparison of the sample methylomes through windows which are composed of five CpG sites, at least with a twofold change in the methylation level and with p ≤ 0.05 (Fisher test). In addition, two neighboring DMRs were joined into one continuous DMR if the genomic methylation level of the region from the start of upstream DMR to the end of downstream DMR also showed twofold differences between the two groups. Otherwise, the two DMRs were considered as independent.
GO and KEGG Enrichment Analysis of Genes Related to DMRs
Genes that overlapped with DMRs were termed as differentially methylated genes (DMGs). DNA methylation in different gene sub-elements plays different roles in gene expressions. Thus, in our research, Gene Ontology (GO) and Kyoto Encyclopedia of Genes and Genomes (KEGG) pathway analyses were separated in DMGs whose DMR was located in the promoter region or in the gene body. The GO analysis of DMGs was as follows: Firstly, we mapped all DMRs to GO terms in the database (http://www.geneontology.org/), calculating the gene numbers for every term. Then, we searched for significantly enriched GO terms in the input list of DMRs based on GO TermFinder (http://www.yeastgenome.org/help/analyze/go-term-finder). The method used can be described as follows:
where N is the number of all genes with GO annotation, n is the number of DMRs in N, M is the number of all genes that are annotated to certain GO terms, and m is the number of DMRs in M. The calculated p-value goes through Bonferroni correction. GO terms with corrected p ≤ 0.05 were considered as significantly enriched.
The statistical enrichment of DMGs in KEGG pathways was conducted with KOBAS software (19). The pathways with corrected p ≤ 0.05 were determined as significantly enriched.
RNA Isolation and Reverse Transcription
The hepatic total RNA of six fish in each group was extracted using Trizol Reagent (TaKaRa, Japan). The quantity and the integrity of RNA were determined by an Eppendorf BioPhotometer and agarose gel electrophoresis method (Hamburg, Germany). The hepatic cDNAs of grass carp were achieved from 1 μg total RNA according to the instructions of HiScript® II Reverse Transcriptase (Vazyme Biotech, China).
Quantification of the Hepatic Transcript of Differentially Methylated Genes
The genes of key enzymes that participated in glucose and fatty acid metabolism, the transcription factors of the above-mentioned genes, and the critical genes in insulin/leptin/AMPK pathways were selected as the candidate genes for an analysis of mRNA levels. If the gene was differently methylated in the promoter region or in the gene body region, the mRNA expression levels would be detected on a quantitative thermal cycler (CFX96 Real-Time PCR Detection System, Bio-Rad, USA). Information on the primers used in this experiment is shown in Table 2. The PCR cycling parameters were 95°C for 3 min, followed by 40 cycles at 95°C for 10 and 30 s at annealing temperature. After amplification, melting curve assays were performed. The temperature gradually increased from 65 to 95°C, with 0.5°C every 6 s. According to the instructions of GoTaq® qPCR Master Mix (Bio-Rad, USA), the reaction was composed of 0.2 μM of primers, 1 μl cDNA, 10 and μl GoTaq® qPCR Master Mix and supplied with double-distilled water at 20 μl. The mRNA expression levels were quantified relative to the expression of elongation factor 1 α (ef1-α) as endogenous reference (20) and analyzed by the optimized comparative Ct (2ΔΔCt) value method (21).
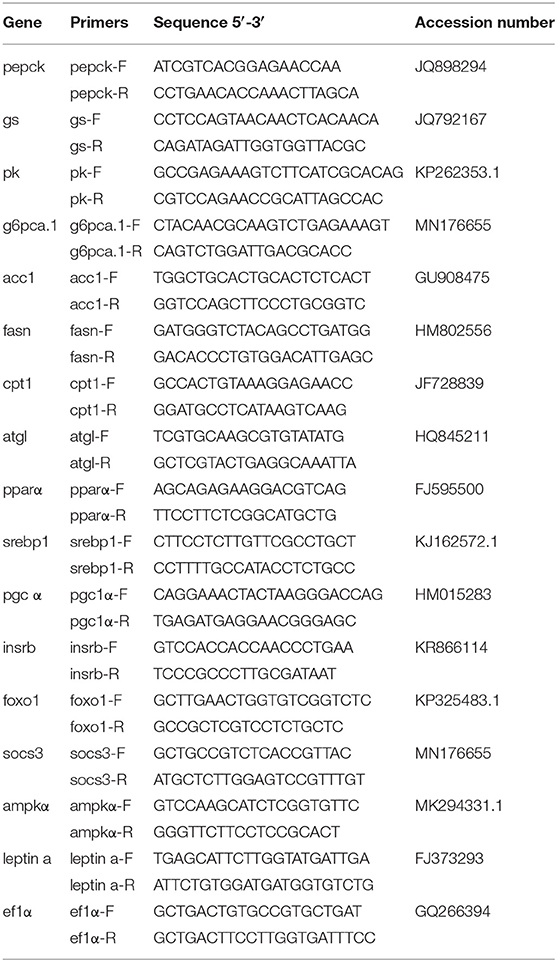
Table 2. Primer sequences for the quantitative real-time PCR.
In vitro Analysis of the Effects of 5-Aza-2′-deoxycytidine on Glucose Consumption
Grass carp liver cell line (L8824) was obtained from Wuhan Cell Instruction Repository (Wuhan, Hubei, China). The cells were seeded in 24-well culture plates, at a density of 105 cells/well, and cultured in Medium 199 (Cat. No. C11150500BT, gibco) supplemented with 10% fetal bovine serum (Sigma-Aldrich, Saint Louis, MO) at 28°C in 5% CO2. After 24 h, the cells were treated with different concentrations of glucose (5, 15, and 30 mM) and a DNA methyltransferase inhibitor (0 and 10 μM), 5-Aza-2′-deoxycytidine (Product Number A3656, Sigma-Aldrich), for 48 h. For each treatment, three biological replicates were set. The glucose concentration of the cell culture medium was detected at 0 and 48 h after treatment by a glucose assay kit (glucose oxidase method; ROBIO, Shanghai). The glucose concentration difference between 0 and 48 h was considered as the glucose consumption level of L8824 cells.
Statistical Analysis
Data on growth performance, food intake, serum components, target DMG expression levels, and in vitro analysis of the effects of 5-Aza-2′-deoxycytidine on glucose consumption were analyzed with SPSS 19.0 software (SPSS, USA). The differences were assessed using independent-samples t-test. Statistical significance was considered at p < 0.05. All data were presented as mean ± S.E.M (standard error of the mean). GraphPad Prism 8 software was employed to generate the figures. The whole-genome bisulfite sequencing library, identification of DMRs, GO annotation, and KEGG pathway enrichment of DMGs were operated by BGI Genomics Co., Ltd. (Shenzhen, China). The figures of DMG enriched pathways involved in metabolism were generated with ScienceSlides and Powerpoint 2010.
Results
Growth Performance and Serum Components
After a 6-week feeding trial, the weight gain, specific growth ratio (SGR), and food intake were significantly decreased in grass carp fed with high-carbohydrate diets (p < 0.05) compared with the control group. The body crude lipid contents, serum glucose, and insulin concentrations of grass carp fed with high-carbohydrate diets were significantly increased compared with the control group (p < 0.05; Figure 1).
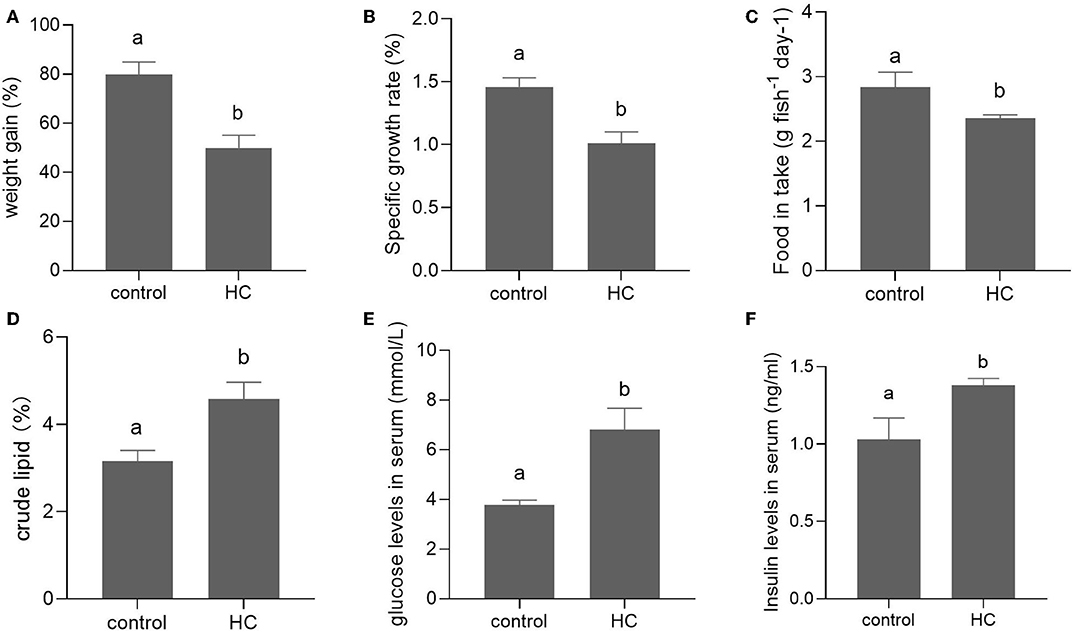
Figure 1. Growth performance and serum components in grass carp fed with moderate carbohydrate diet (control) or excessive carbohydrate diet. (A) Weight gain. (B) Specific growth ratio. (C) Food intake. (D) Body crude lipid contents. (E) Concentration of serum glucose. (F) Concentration of serum insulin. Values are mean ± SEM (n = 6). The vertical bars which are not sharing the same letter are significantly different (P < 0.05).
Bisulfite Sequencing and DNA Methylation Profile
In the present study, hepatic DNA methylation of grass carp fed with control and high-carbohydrate (HC) diets were sequenced using WGBS technology. An average of 36.470 Gb clean bases was generated. The sequencing data for each sample is presented in Table S1. The mapping reads and the bisulfite conversion rate of each sample are shown in Table S2. High-quality DNA methylation pictures of the two groups were achieved, and the unique mapping rates ranged from 76.42 to 83.37%. The bisulfite conversion rate of genomic DNA ranged from 99.35 to 99.61%. Strict quality control (QC) was performed for each sample on several QC terms, as illustrated in Table S3. The sequencing data of all the samples were qualified (Table S3). The clean data have been submitted to the SRA database (SRA accession: PRJNA558443).
Genome-Wide Methylation Patterns in Grass Carp Liver
Methylation in grass carp existed in different sequence contexts, including CG, CHG, and CHH (H is A, C, or T). There were about 9.45 and 9.38% of all genomic cytosines methylated in the control and the HC groups, respectively. Meanwhile, the average level of methylated cytosines in each context was also calculated. In the control group, 81.02% of CG, 0.66% of CHG, and 0.69% of CHH were methylated. Correspondingly, 80.78, 0.77, and 0.80% of cytosines were methylated in CG, CHG, and CHH contexts in the HC group (Figure S1A). The proportion of different types of methyl-cytosine varies between species and even between different tissues of the same species, and there are specific methylation profiles under physiological changes. The proportion of methylated cytosines, including mCG, mCHG, and mCHH, is presented in Figure S1B. Whole genomic DNA was defined by seven different regions, including upstream, first exon, first intron, internal exon, internal intron, last exon, and downstream. About 80% of CG was methylated in all regions, with a slight drop near the transcription start sites (TSS). The CHG and CHH methylation patterns were with higher methylation levels at the 5′ and the 3′ flanking regions compared with the other regions (Figure S1C). In general, there were no significant differences in the CG, CHG, or CHH methylation patterns between the two groups.
Identification of Hepatic Differentially Methylated Genes in Grass Carp Fed With Diets With Different Compositions of Carbohydrate
By a genome-wide comparison of the DNA methylation sequences in grass carp, the accepted different levels of carbohydrate (102,837 DMRs in CG context, 221 DMRs in CHG context, and 7,434 DMRs in CHH context) were identified. The distribution of differentially methylated genes is shown in Figure S2. A total of 6,403, 13, and 460 DMGs in CG, CHG, and CHH contexts in the promoter region were obtained. Meanwhile, 15,007, 66, and 2,403 DMGs in CG, CHG, and CHH contexts in the gene body region were observed (Figure S2A). Compared to the control group, 3,972 genes were hyper-methylated, while 2,904 genes were hypo-methylated in the promoter region in the HC group. Meanwhile, 10,711 genes were hyper-methylated and 6,764 genes were hypo-methylated in the gene body region in grass carp fed with high-carbohydrate diet (Figure S2B).
GO Annotation and KEGG Pathway Enrichment Analyses of DMGs
The GO enrichment analysis of DMGs in CG context revealed that DMGs were significantly enriched in cellular process, biological regulation, single-organism process, metabolic process, cell part, and molecular binding (Figure S3). KEGG enrichment of DMGs was also conducted both in the promoter region and in the gene body region for CG context. In the promoter region, 302 pathways were significantly enriched (Figure S4A). The top 20 pathways in ascending order of corrected Q-value are displayed in Figure 2A. The results suggested that TGF-beta signaling pathway was the most enriched pathway. In addition, DMGs were significantly enriched in metabolism-related pathways, including fatty acid metabolism (ko00061), PPAR signal pathway (ko03320), protein digestion and absorption (ko04974), fatty acid biosynthesis (ko01212), and adipocytokine signaling pathway (ko04920). In the gene body region, 305 pathways were significantly enriched (Figure S4B). However, no metabolism-related pathway was enriched in the top 20 KEGG pathways (Figure 2B). Furthermore, as a continuation of a previous study (17, 18), the present study focused on the DNA methylation changes of pathways involved in the regulation of metabolism, including carbohydrate metabolism (Figure 3), lipid metabolism (Figure 4), insulin signaling pathway (Figure 5), adipocytokine signaling pathway (Figure 6), and AMPK pathway (Figure 7).
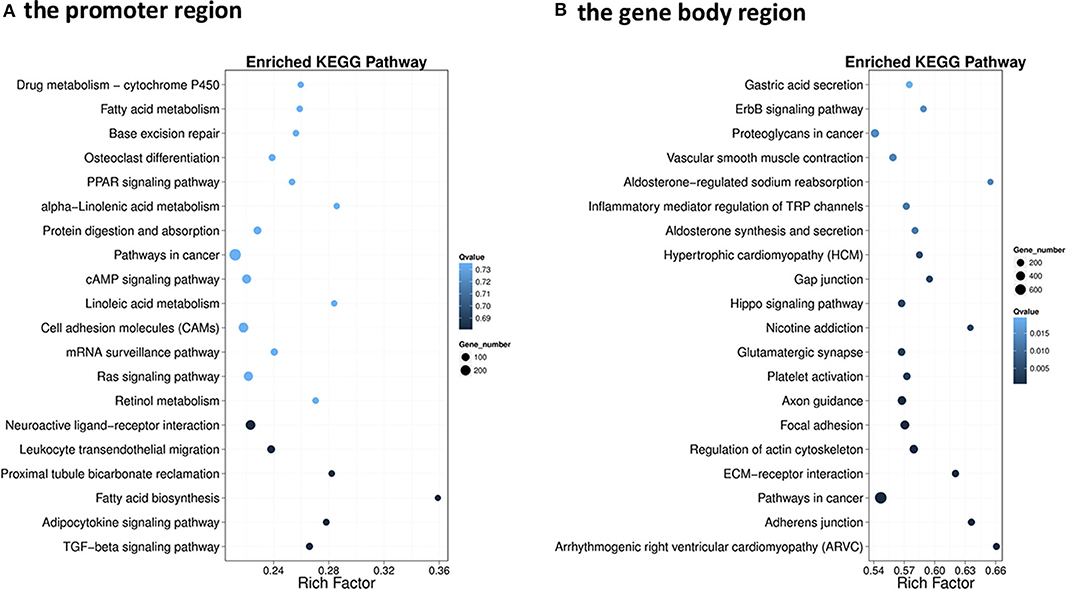
Figure 2. Scatterplot of the enriched top 20 Kyoto Encyclopedia of Genes and Genome pathways of differentially methylated genes (DMGs) that differentially methylated in the promoter (A) and the gene body regions (B). The y-axis represents the enriched pathways, and the x-axis represents the rich factor of the corresponding pathways; the size of the spots represents the number of genes related to differentially methylated regions enriched in each pathway, while the color of the spot represents the corrected p-value of each pathway. The rich factors indicate the ratio of the number of DMGs mapped to a certain pathway to the total number of genes mapped to this pathway. Greater rich factor means greater enrichment.
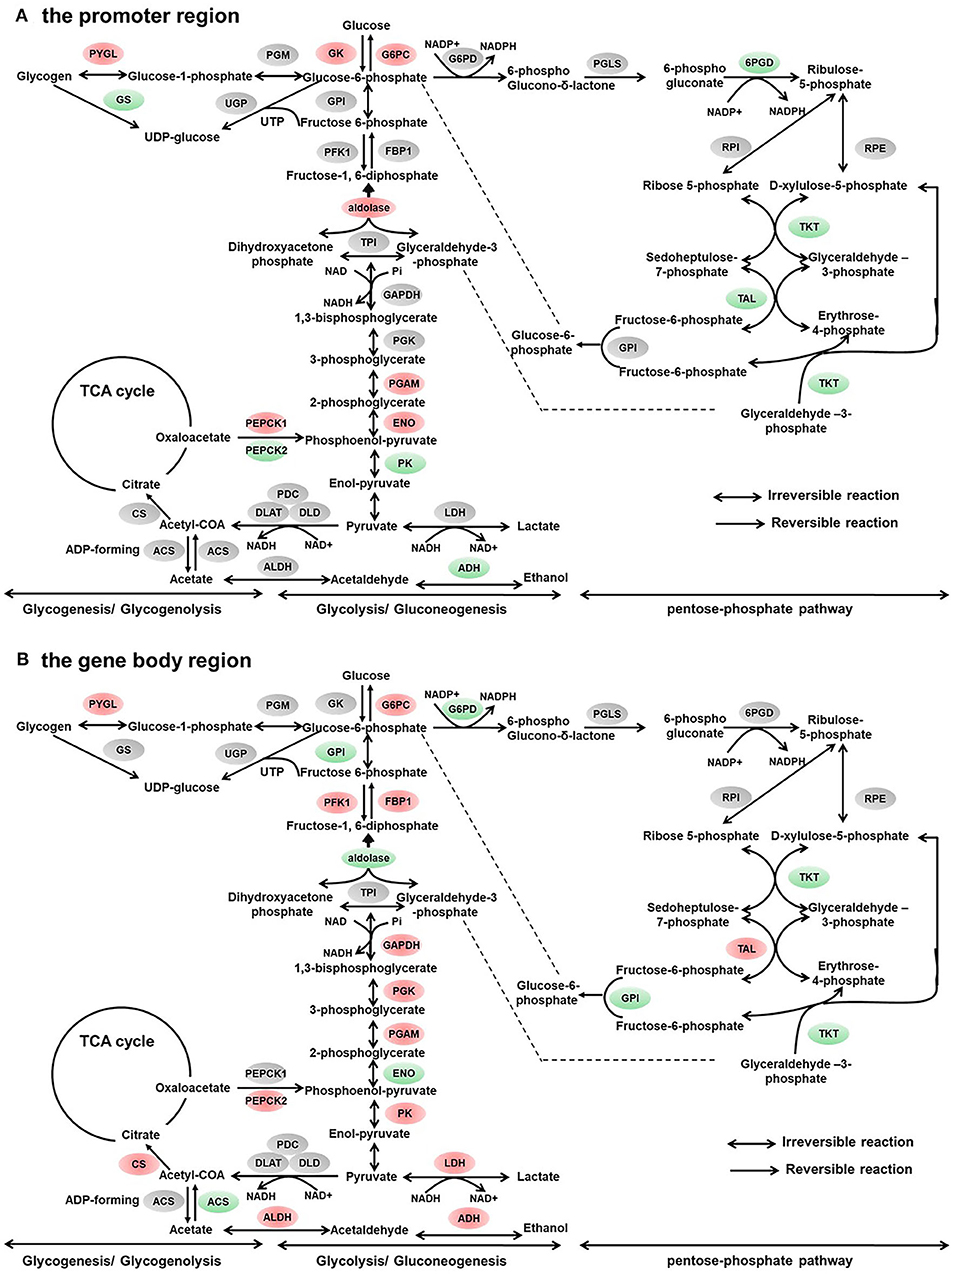
Figure 3. Differentially methylated genes enriched in the carbohydrate metabolism. (A) Genes differentially methylated in the promoter region. (B) Genes differentially methylated in the gene body regions. The colors of the ellipses were shaded according to significance level. Red: the DNA methylation levels of the control group were significantly higher than those in the high carbohydrate (HC) group [log2ratio(control/HC) ≥ 0 and corrected p ≤ 0.05]. Green: the DNA methylation levels of the control group were significantly lower than those in the HC group (log2ratio(control/HC) ≥ 0 and corrected p ≤ 0.05). Gray: not significantly changed.
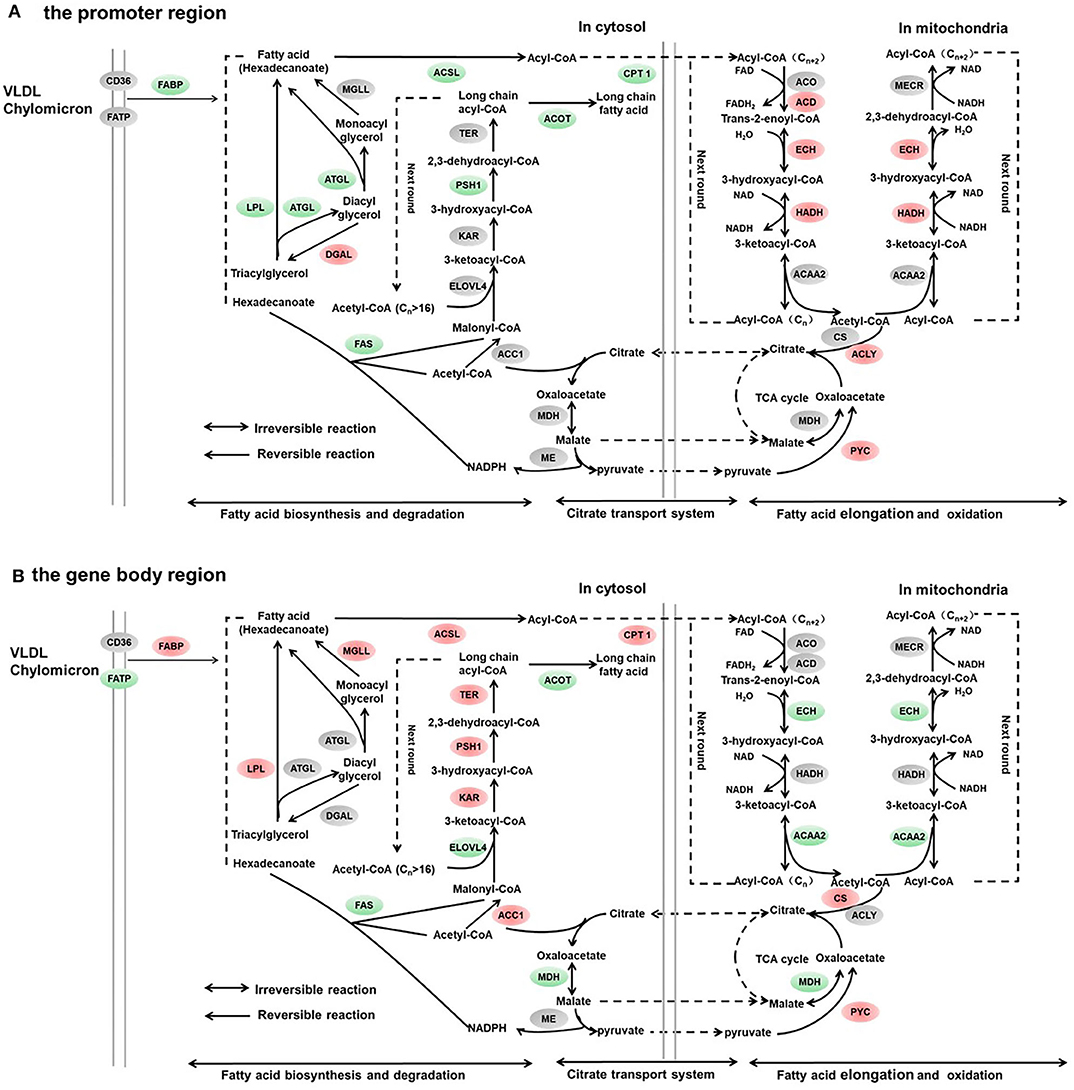
Figure 4. Differentially methylated genes enriched in the lipid metabolism. (A) Genes differentially methylated in the promoter region. (B) Genes differentially methylated in the gene body regions. The colors of the ellipses were shaded according to significance level. Red: the DNA methylation levels of the control group were significantly higher than those in the high carbohydrate (HC) group [log2ratio(control/HC) ≥ 0 and corrected p ≤ 0.05]. Green: the DNA methylation levels of the control group were significantly lower than those in the HC group [log2ratio(control/HC) ≥ 0 and corrected p ≤ 0.05]. Gray: not significantly changed.
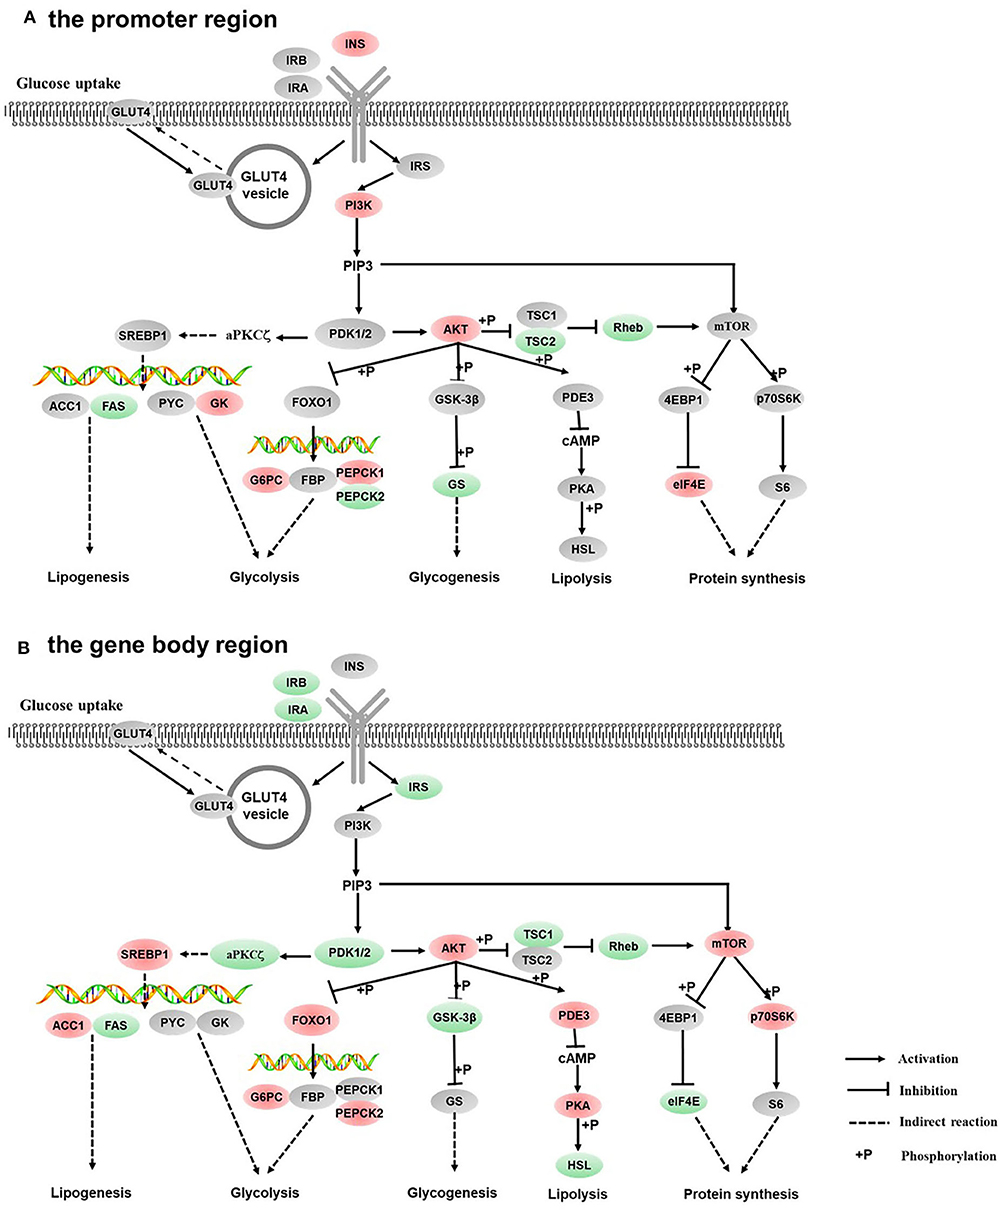
Figure 5. Differentially methylated genes enriched in the insulin signaling pathway. (A) Genes differentially methylated in the promoter region. (B) Genes differentially methylated in the gene body regions. The colors of the ellipses were shaded according to significance level. Red: the DNA methylation levels of the control group were significantly higher than those in the high carbohydrate (HC) group [log2ratio(control/HC) ≥ 0 and corrected p ≤ 0.05]. Green: the DNA methylation levels of the control group were significantly lower than those in the HC group [log2ratio(control/HC) ≥ 0 and corrected p ≤ 0.05]. Gray: not significantly changed.
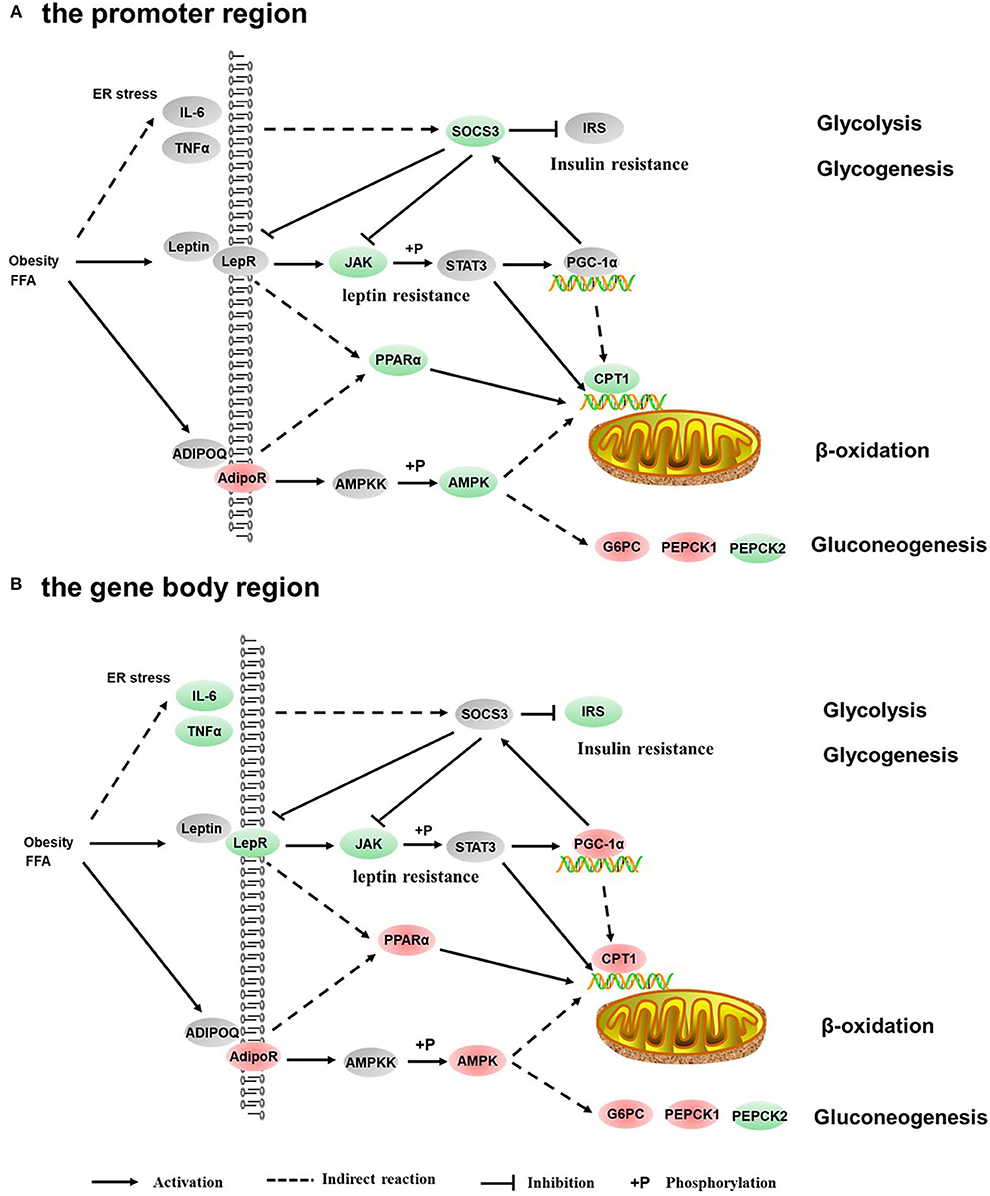
Figure 6. Differentially methylated genes enriched in the adipocytokine signaling pathway. (A) Genes differentially methylated in the promoter region. (B) Genes differentially methylated in the gene body regions. The colors of the ellipses were shaded according to significance level. Red: the DNA methylation levels of the control group were significantly higher than those in the high carbohydrate (HC) group [log2ratio(control/HC) ≥ 0 and corrected p ≤ 0.05]. Green: the DNA methylation levels of the control group were significantly lower than those in the HC group [log2ratio(control/HC) ≥ 0 and corrected p ≤ 0.05]. Gray: not significantly changed.
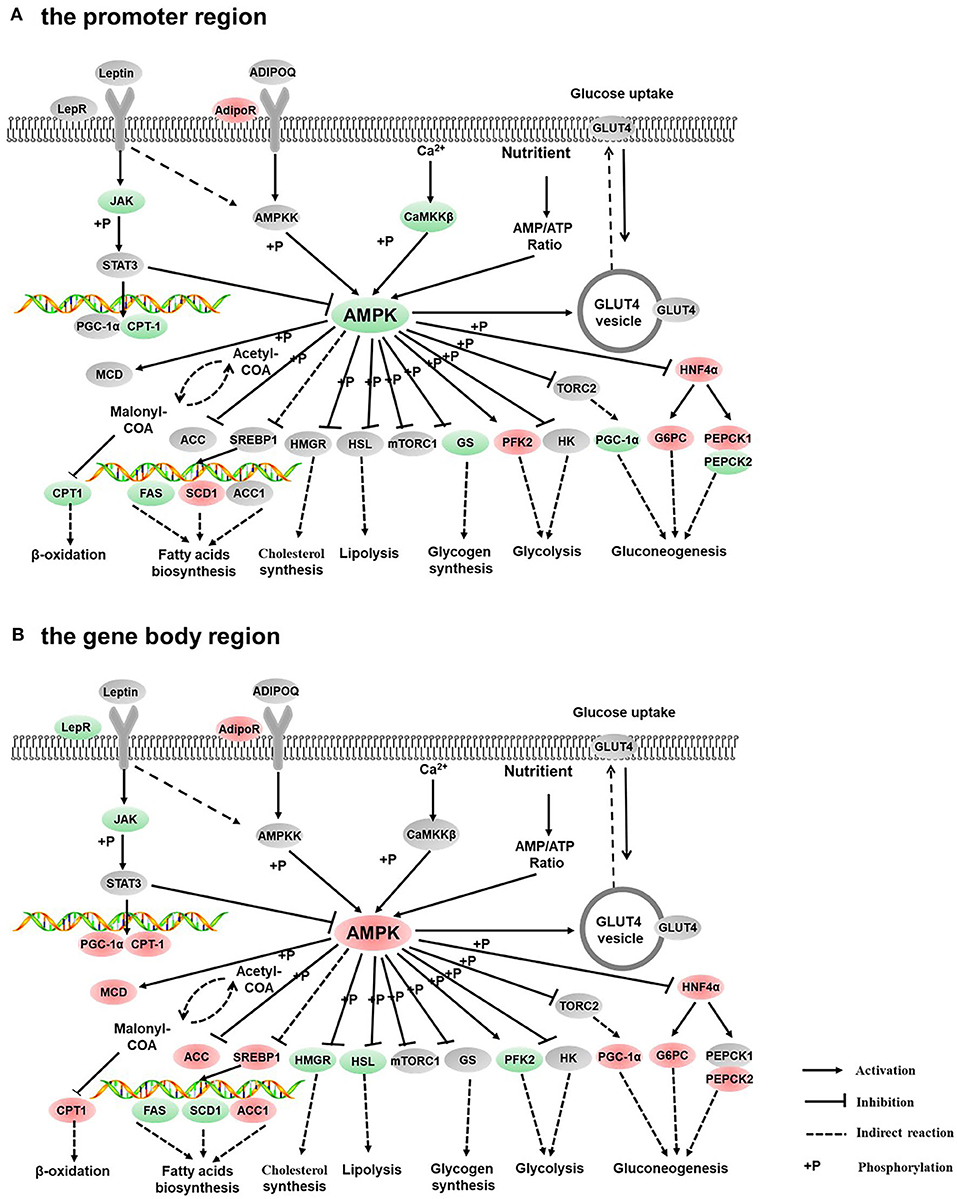
Figure 7. Differentially methylated genes enriched in the AMPK signaling pathway. (A) Genes differentially methylated in the promoter region. (B) Genes differentially methylated in the gene body regions. The colors of the ellipses were shaded according to significance level. Red: the DNA methylation levels of the control group were significantly higher than those in the high carbohydrate (HC) group [log2ratio(control/HC) ≥ 0 and corrected p ≤ 0.05]. Green: the DNA methylation levels of the control group were significantly lower than those in the HC group (log2ratio(control/HC) ≥ 0 and corrected p ≤ 0.05). Gray: not significantly changed.
Expression Levels of Target DMGs by Real-Time PCR
To validate the correction between DNA methylation and gene mRNA expression levels, qRT-PCR was conducted with 16 DMGs. As displayed in Figure 8A, compared with the control group, the mRNA expression levels of glycogen synthase (gs) and pk genes were significantly decreased (p < 0.05). However, the mRNA expression levels of phosphoenolpyruvate carboxykinase (pepck) and glucose-6-phosphatase a.1 (g6pca.1) were significantly increased (p < 0.05) in the HC group. The hepatic transcript levels of lipid metabolism-related genes are presented in Figure 8B. In the HC group, the hepatic transcript levels of acetyl-coA carboxylase 1 (acc1), cpt1, and adipose triglyceride lipase (atgl) were obviously increased when compared with the control group. However, the expression levels of fatty acid synthase (fasn) showed an inverse variation (p < 0.05). The hepatic transcript levels of the transcription factors are displayed in Figure 8C. High-carbohydrate diets significantly stimulated the mRNA expression levels of pparα and pgc1α genes (p < 0.05) but did not affect the gene expression of sterol-regulatory element binding protein 1 (srebp1). Furthermore, the high-carbohydrate diet impacted the mRNA expression levels of signal factors in insulin signaling and adipocytokine signaling pathways (Figure 8D). The mRNA expression levels of insulin receptor b (insrb), forkhead box O 1 (foxo1), and leptin a were significantly increased (p < 0.05). The correlation between changes of the gene expression levels and the methylation levels is presented in Figure 8E.
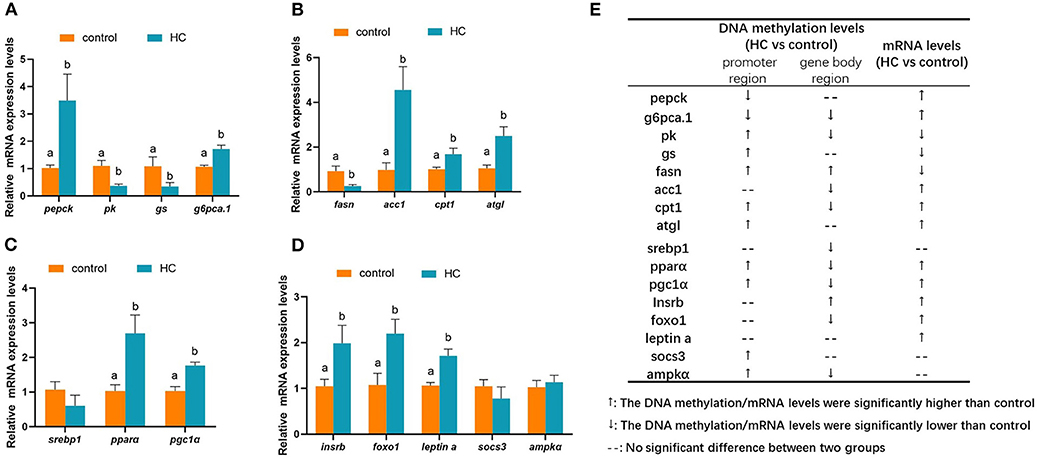
Figure 8. Hepatic mRNA expression levels of different methylated genes (DMGs) in grass carp fed with different carbohydrate levels. (A) mRNA expression levels of DMGs involved in carbohydrate metabolism. (B) mRNA expression levels of DMGs involved in lipid metabolism. (C) mRNA expression levels of different methylated transcription factor genes related to metabolism. (D) mRNA expression levels of DMGs in insulin pathway, adipocytokine pathway and AMPK pathway. (E) A summarization of the mRNA expression levels and DNA methylation pattern of the DMGs. Values are mean ± S.E.M. (n = 6). Vertical bars not sharing the same letter are significantly different (p < 0.05).
Effects of 5-Aza-2′-deoxycytidine on Glucose Consumption
The effects of 5-Aza-2′-deoxycytidine on glucose consumption were determined by detecting the glucose concentration of the cell culture medium. The addition of 5-Aza-2′-deoxycytidine into the L8824 cell line significantly reduced the glucose consumption when the initial glucose concentration of the cell culture medium was 15 mM (p < 0.05). However, the glucose concentration was not affected by the DNA methylase inhibitor when the initial glucose concentration was 5 and 30 mM (Figure 9).
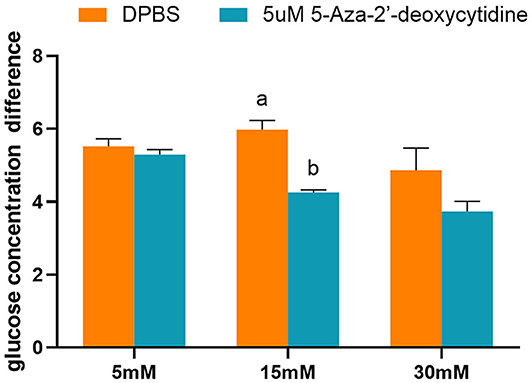
Figure 9. The glucose concentration difference of L8824 cell culture medium treated with different concentrations of glucose and 5-Aza-2′-deoxycytidine for 48 h. Values are mean ± SEM (n = 3). The vertical bars not sharing the same letter are significantly different (p < 0.05).
Discussion
To date, most studies on epigenetics have been undertaken in mammalian species. DNA methylation is the best-known epigenetic modification. It has been proven to be sensitive to external contributors, including food nutrition in mammals (22). Different food components and dietary nutrients are associated with DNA methylation that might contribute to obesity and other metabolic disorders in mammals (23). Palmitic acid increased the global DNA methylation levels of human pancreatic islets, reducing the secretion of insulin and raising the risk of T2D as a result (24). Addition of saturated fatty acids and elaidic acid to a diet induced the hypomethylation of tumor necrosis factor and the hypermethylation of pparγ, regulating the gene mRNA expression levels and inducing inflammation in adipose tissue (25). In teleosts, although studies examining the role of epigenetics in regulating the phenotypic responses to dietary nutrition have been performed in rainbow trout and European sea bass (26, 27), the knowledge of epigenetics in fish is still in its infancy.
Grass carp is considered as a promising research model for improving the capacity of carbohydrate utilization in fish species. In the present study, by the inhibition of DNA methyltransferase in a grass carp liver cell line L8824, we confirmed that DNA methylation could mediate the glucose consumption of liver cells. To address the knowledge gap of nutrition-related epigenetics in fish, especially glucose metabolism and obesity-related epigenetics, hepatic genome-wide methylation analysis was performed in grass carp fed with suitable and excessive carbohydrates. According to our previous studies, a high-carbohydrate diet (more than 40%) intake increased the insulin concentrations and induced high serum glucose, cholesterol, and total lipid contents (17, 18). Thus, we hypothesized that a high-carbohydrate diet (more than 40%) which induced hyperglycemia and fat deposition could be compared to metabolic syndrome in humans. Integrative comparative genome-wide methylation would not only provide a comprehensive view on the epigenetic mechanisms in fish but also expand the knowledge about human T2D and related metabolic diseases.
In grass carp, the genome-wide methylation patterns were similar between two groups. Approximately 9% of all total cytosines and 80% of CG were methylated. In zebrafish, about 12% of total cytosines were methylated; 86–87% of cytosines were methylated in CG context (28). The methylation patterns of hybrid tilapias (O. niloticus × Oreochromis mossambicus) were different from those of grass carp. In skeletal muscles of hybrid tilapias, ~69.60% of cytosines in CG context were methylated. The CG methylation levels decreased gradually to 25% nearby TSS before sharply increasing to 75% in the gene body region (29). In grass carp, whole genomic DNA was defined as seven different regions, and about 80% of CG was methylated in all regions, with a slight drop near to TSS. The high level of DNA methylation in CG content was a specific characteristic of animals. DNA methylation in CHH and CHG patterns is a major characteristic of plant methylomes and largely absent in animal methylomes (30).
In juvenile rainbow trout, hypoxia exposure in the embryonic period and a high-carbohydrate diet intake at first feeding caused a long-term programming effect on the transcript of genes related to glucose metabolism, but it did not induce a significant difference in global DNA methylation in either liver or muscle tissue (31). Similar to rainbow trout, although the mRNA expression levels of glucose metabolism-related genes were significantly changed by dietary carbohydrate contents, there was no significant difference in the global genomic DNA methylation levels in grass carp liver between the two groups. Despite that, the numbers of differentially methylated genes were identified. The number of hyper-methylated DMGs was almost 1.33–1.58 times the number of hypo-methylated DMGs in grass carp fed with a high-carbohydrate diet. To understand the effect of carbohydrate-induced DNA methylation variations on the metabolic characteristics and the phenotypes in grass carp, the DNA methylation profiles of critical metabolism-related pathways, including carbohydrate metabolism, insulin pathway, lipid metabolism, adipocytokine signaling pathway and AMPK signaling pathway, were analyzed.
Insulin is regarded as the primary regulator of glucose concentration in blood. It stimulates the uptake of glucose in muscle and fat tissues and suppresses glucose production in the liver. The initial molecular signal of insulin action contains the activation of insulin receptor tyrosine kinase and then brings about phosphorylation of insulin receptor substrates on tyrosine residues (32). In grass carp, dietary carbohydrate significantly changed the DNA methylation of genes involved in insulin signaling pathway, including insulin, insulin receptors, insulin receptor subsrate-1 (irs1), phosphoinositide 3 kinase (pi3k), and their downstream factors. Furthermore, a high-carbohydrate diet remarkably increased the serum insulin concentrations and the hepatic transcript levels of insrb gene in grass carp. However, the increased secretion of insulin did not suppress blood glucose and lipid deposition, suggesting that the high-carbohydrate diet might cause symptoms of “insulin resistance” in grass carp. In carnivorous fish, glucose intolerance was usually considered as a consequence of poor peripheral insulin action or possibly “insulin resistance” (33). In mammals, interleukin-6 (IL6) and tumor necrosis factor have been proven to induce hepatic insulin resistance through the suppression of the cytokine signaling (SOCS3) pathway (34, 35). The subsequent studies indicated that nutrition content in a diet could result in the DNA methylation changes of these genes (36, 37). In grass carp, KEGG enrichment analysis suggested that TGF-beta signaling pathway was the most significantly correlated pathway. In addition, DNA methylation of il6, tnf, and socs3 genes were impacted by a high-carbohydrate diet intake; however, the gene expression levels of socs3 were not affected. However, more evidence should be provided to confirm the speculation that a high-carbohydrate diet could generate “insulin resistance” by epigenetic changes in fish.
In addition, the hepatic transcript levels of key glucose metabolism genes were impacted by dietary carbohydrate levels via DNA methylation regulation. In the present study, the DNA methylation profiles of key glucose enzymes, including gs, gck, g6pc a.1, pepck, pk, phosphofructokinase (pfk), and fructose-1,6-bisphosphatase 1 (fbp1), were regulated by dietary carbohydrate levels. Compared with the control group, the mRNA expression levels of gs and pk genes were significantly decreased. Meanwhile, the mRNA expression levels of gluconeogenesis genes (pepck and g6pca.1) were significantly increased in the HC group. As a result, the serum glucose concentrations were significantly increased. These viewpoints have also been proposed in mammalian models. Increasing folic acid levels in maternal or post-weaning diets caused differential variations in promoter DNA methylation levels and mRNA expression levels of pepck in rats (38). In high-fat-diet-induced obese rats, hypermethylation was correlated with a decline in the hepatic transcript levels of gck and pk genes (8). In the liver of piglets born from sows fed with betaine-supplemented diet, DNA methylation in g6pc promoter was decreased in accordance with the higher mRNA expression levels of g6pc (39). In contrast, pepck1 was significantly hypermethylated in the promoter region, corresponding to the diminished mRNA expression levels (39).
It is noteworthy that KEGG enrichment analysis showed that, in the promoter region, DMGs were significantly enriched in fatty acid metabolism, PPAR signal pathway, fatty acid biosynthesis, and adipocytokine signaling pathway. The results demonstrated that a high-carbohydrate diet could modify the epigenetic processes and contribute to an increase in lipid deposition in grass carp liver. The assumption was also supported by studies carried out in mammals. Dietary methionine regulated the lipogenic transcription factors. The promoter of srebp1 was hypomethylated under vitamin B12-deficient conditions (40). Research in rodents indicated that betaine reduced the hepatic TG concentration by increasing the transcript levels of pparα and the hypomethylation of gene promoter (41). In grass carp, a high-carbohydrate diet caused the variation of DNA methylation profiles in lipogenic transcription factors such as srebp1, pparα, and pcg1α and significantly increased these gene expression levels. As a result, the mRNA expression levels of acc1 were dramatically up-regulated and the hepatic transcripts of fasn, cpt1, and atgl genes were significantly reduced. In male Sprague–Dawley rats, metabolic syndrome pathogenesis caused by fructose was connected with DNA methylation status. Fructose feeding generated the hypermethylation of pparα and cpt1a genes in the promoter regions and decreased the mRNA expression levels in these genes (9). A high-fat diet caused hepatic lipid accumulation by programming lipid-synthesizing genes through DNA methylation in the gene body of fasn and acc1 in rats (42). Supplementation of methyl donor in diets modified the DNA methylation profiles of fasn and reduced the fatty liver in rats fed with an obesogenic diet (43).
In mammals, adipokines—secreted primarily by adipocytes—modulate lipid and glucose metabolism and insulin sensitivity (44). In the present study, the DNA methylation patterns of adipocytokine signaling pathway in grass carp were also analyzed. Leptin acts as one of the most crucial adipocytokines in metabolism. It regulates hepatic lipogenesis by inhibiting the transcript levels of key enzymes in the fatty acid synthesis pathway (45). Leptin also plays a major role in the regulation of metabolism in fish (46). In our previous study, the hepatic mRNA expression levels of leptin a were significantly improved by a high-fat diet and a high-carbohydrate diet in grass carp (15, 18). In mammals, DNA methylation of leptin was associated with maternal nutritional state and diet contents. In obese rats, DNA methylation of leptin promoter was related to decreased leptin levels in the circulation (47). The epigenetic alteration of leptin might be one of the mechanisms through which maternal phenotypes can program offspring health (48). Adiponectin, identified as one of the important adipokines, is able to reduce the triglyceride levels and strengthen the insulin signaling pathway in mammals (49, 50). Two different subtype receptors of adiponectin have been reported, named as AdipoR1 and AdipoR2. AdipoR2 is exclusively expressed in liver tissue (51). Binding to its receptors, adiponectin could activate the signaling pathway conduction and play a biological effect (52). Hypermethylation in adiponectin promoter suppressed its mRNA expression levels and exacerbated the metabolic diseases in obesity (53). In the present study, although the hepatic transcript levels of leptin were remarkably increased by a high-carbohydrate diet, there was no significant difference in DNA methylation in the promoter or the gene body regions of leptin or adiponectin between the two groups in grass carp. On the contrary, the DNA methylation levels of leptin receptor and adiponectin receptor were altered by a high-carbohydrate diet. The results indicated differences in the epigenetic regulation mechanism between mammals and fish. However, more studies in fish species should be conducted to identify the epigenetic regulation mechanisms and the differences among species.
Up to now, most knowledge of epigenetic regulation in animals has come from investigations in mammals, and researchers should be cautious when generalizing results from mammals to fish. Comparative methylome analysis across taxa exposed wide discrepancies in methylation profiles and indicated that DNA methylation might perform different functions among species (30, 54, 55). Comparative DNA methylation profiles of mouse and zebrafish likewise uncovered a high divergence between species. The global DNA methylation levels in zebrafish were significantly higher than those in rats (56). A comparative genomics analysis of carbohydrate metabolic genes between fish and human revealed that most metabolic genes were conserved in vertebrates (57). Whether the DNA methylation regulation of a single gene in different species is conserved remains an important question. Therefore, we compared the DNA methylation alterations related to glucose metabolism and obesity pathways in grass carp with the mammalian models of obesity and T2D or in a different nutritional state (Table 3). The results showed that most of the DMGs in grass carp were also regulated by DNA methylation in mammals when the nutrient states changed. The findings would lead us to reveal novel differentially methylated regions and candidate genes for glucose metabolism by breaking species boundaries.
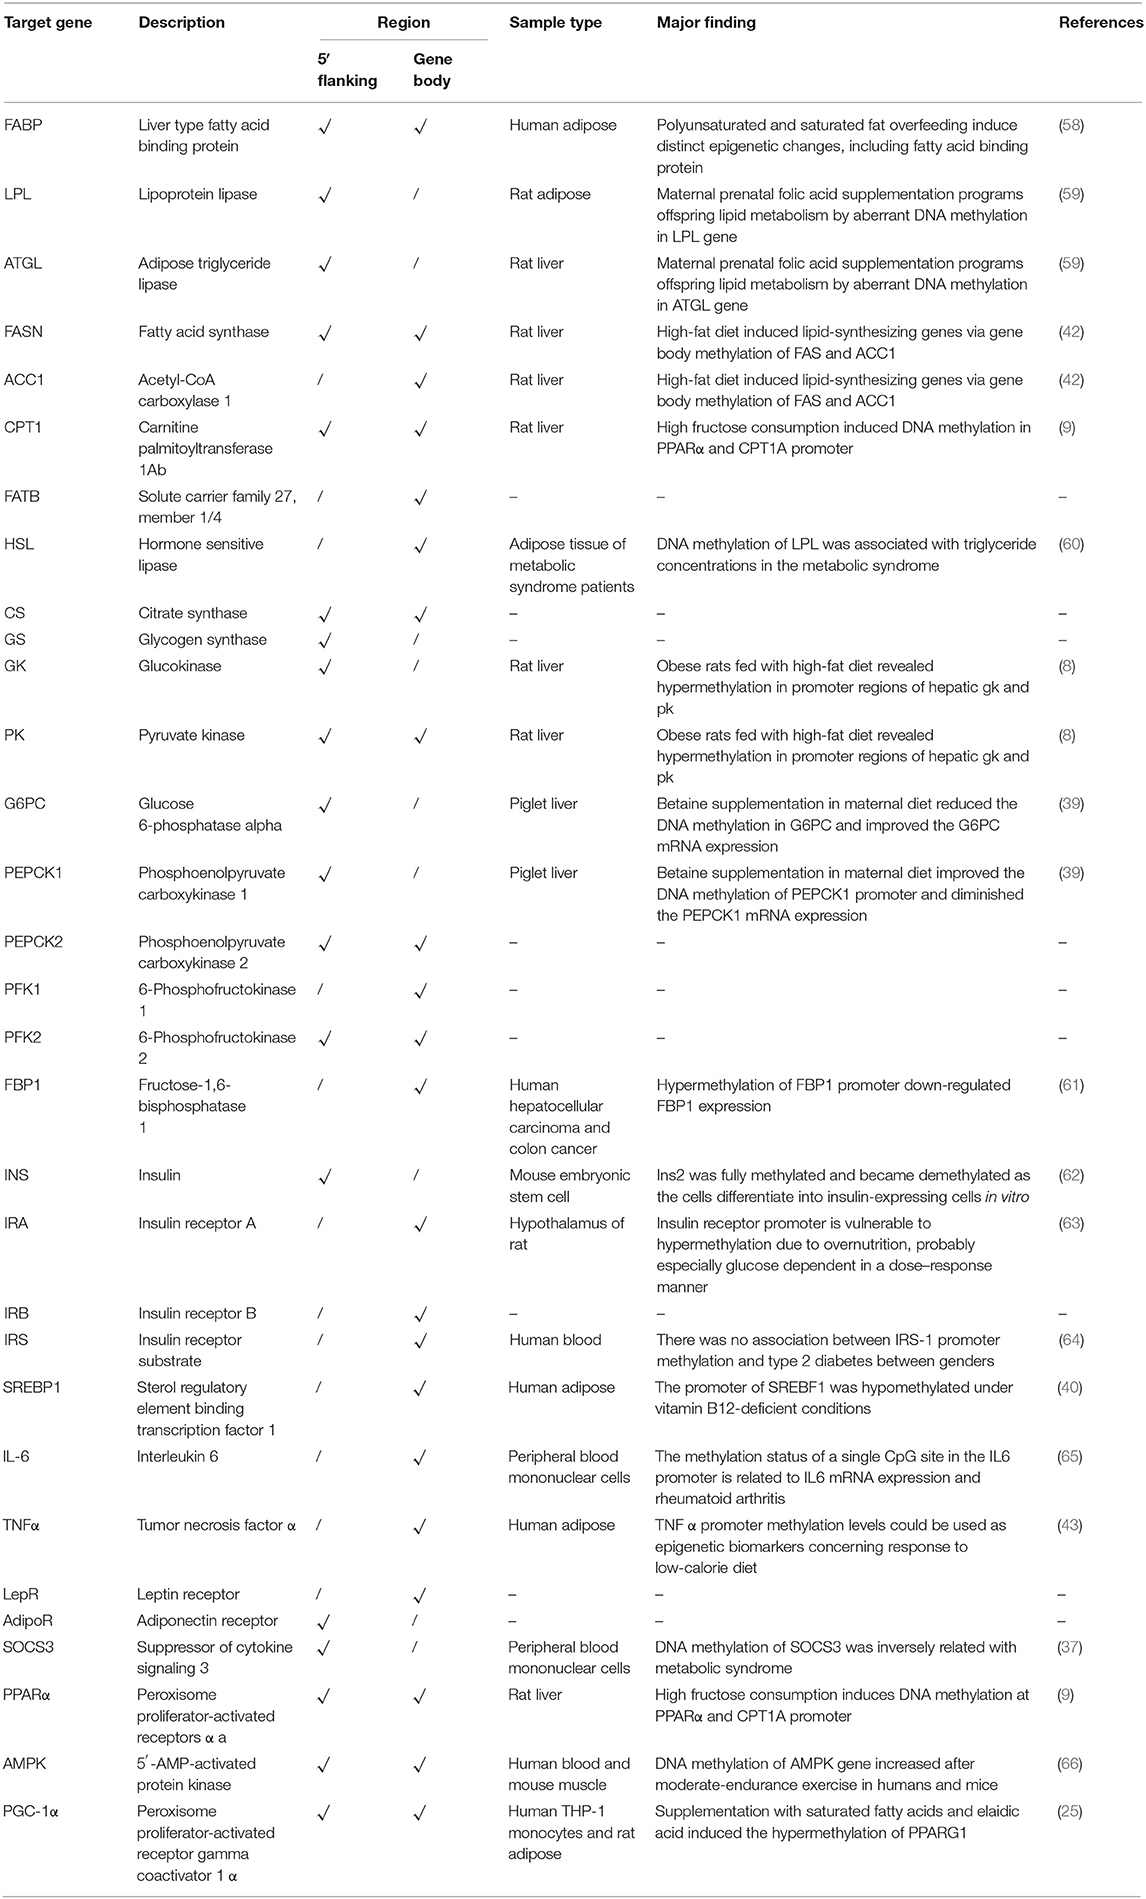
Table 3. Comparison of DNA methylation alterations of metabolism-related genes with mammal models of obesity and type 2 diabetes.
Conclusions
In conclusion, to address the knowledge gap of nutrition-related, especially glucose metabolism- and obesity-related, epigenetics in fish, our study provided an in-depth analysis of genome-wide methylation in grass carp liver. It is the first research that systematically performs a comparative analysis on the genome-wide methylation profiles in fish with different nutritional states. Although the mRNA expression levels of genes involved in glucose metabolism were significantly changed in grass carp fed with diets of different carbohydrate contents, there was no significant difference in the global genomic DNA methylation levels. Despite that, differentially methylated genes related to the regulation of metabolism pathways were found between the two groups. Furthermore, a comparison of DNA methylation alterations with mammals demonstrated that most of the DMGs in grass carp were also regulated by DNA methylation in mammals when the nutrient states changed. Our study may resolve some complexities of glucose metabolic heterogeneity among vertebrates and provide a reference for the aquaculture industry and the treatment of diabetes.
Data Availability Statement
Publicly available datasets were analyzed in this study. The data sets used are available in the Sequence ReadArchive database (SRA accession: PRJNA558443).
Ethics Statement
The animal study was reviewed and approved by Institutional Animal Care and Use Ethics Committee of Huazhong Agricultural University.
Author Contributions
W-JC conceived the study, participated in the design of the study, carried out the laboratory work, participated in data analysis, and wrote the first draft of the manuscript. X-FL designed the study and contributed to the final version. X-CY and A-XL collected the source animals and assisted with establishing the experimental treatments. SH participated in the design of the study. All authors contributed to the article and approved the submitted version.
Funding
This work was supported by the National Key R&D Program of China (2018YFD0900400), the National Natural Science Foundation of China (31772822), and the China Agriculture Research System (CARS-46).
Conflict of Interest
The authors declare that the research was conducted in the absence of any commercial or financial relationships that could be construed as a potential conflict of interest.
Supplementary Material
The Supplementary Material for this article can be found online at: https://www.frontiersin.org/articles/10.3389/fendo.2020.00398/full#supplementary-material
Figure S1. Feature of hepatic genome-wide methylation in grass carp fed with moderate carbohydrate diet (control) or excessive carbohydrate diet (HC). (A) Genome-wide methylated cytosines levels. (B) Proportion of methylated cytosines in mCG, mCHG, and mCHH patterns. The red part represents mCG, blue represents mCHG and green represents mCHH. The sum of three parts is 100% which consists of the whole pie chart. (C) Canonical DNA methylation profiles of the entire transcriptional units. The canonical gene structure is defined by seven different features, denoted by the x-axis. a: upstream, b: first exon, c: first intron, d: internal exon, e: internal intron, f: last exon, and g: downstream. The length of each feature was normalized and divided into equal numbers of bins. Each dot denotes the mean methylation level per bin and the respective lines denote the five-bin moving average. Each feature was analyzed separately for the numbers listed in the table below the figure. The green vertical line indicates the mean location of the transcription start sites.
Figure S2. Distribution and proportion of differentially methylated genes (DMGs) that differently methylated in the promoter and the gene body regions. (A) Number of differentially methylated genes of mCG, mCHG, and mCHH. (B) Number of hyper-methylated and hypo-methylated genes.
Figure S3. Gene Ontology (GO) enrichment analysis of DMGs. (A) GO enrichment analysis of DMGs that differentially methylated in the promoter region. (B) GO enrichment analysis of DMGs that differentially methylated in the gene body region. Y-axis represents three domains of GO and x-axis represents the gene number in every pathway and processes.
Figure S4. KEGG enrichment analysis of DMGs. (A) Pathway analysis of DMGs differentially methylated in the promoter region. (B) Pathway analysis of DMGs differentially methylated in the gene body region. Y-axis represents pathways and x-axis represents the gene number in every pathway and processes.
Table S1. Data Summary and Quality Control (QC).
Table S2. Alignment statistics with reference genome.
Table S3. QC items for each sample.
References
2. Shiau SY, Peng CY. Protein-sparing effect by carbohydrates in diets for tilapia, Oreochromis niloticus × O. aureus. Aquaculture. (1993) 117:327–34. doi: 10.1016/0044-8486(93)90329-W
3. Krishnan J, Rohner N. Sweet fish: Fish models for the study of hyperglycemia and diabetes. J Diabetes. (2019) 11:193–203. doi: 10.1111/1753-0407.12860
4. Zang L, Shimada Y, Nishimura N. Development of a novel zebrafish model for type 2 diabetes mellitus. Sci Rep. (2017) 7:1461. doi: 10.1038/s41598-017-01432-w
5. Kelley KM. Experimental diabetes mellitus in a teleost fish. I. Effect of complete isletectomy and subsequent hormonal treatment on metabolism in the goby, Gillichthys mirabilis. Endocrinology. (1993) 132:2689–95. doi: 10.1210/endo.132.6.8504768
6. Wright JR, Abraham C, Dickson BC, Yang H, Morrison CM. Streptozotocin dose-response curve in tilapia, a glucose-responsive teleost fish. Gen Comp Endocr. (1999) 114:431–40. doi: 10.1006/gcen.1999.7269
7. Riddle MR, Aspiras AC, Gaudenz K, Peuß R, Sung JY, Martineau B, et al. Insulin resistance in cavefish as an adaptation to a nutrient-limited environment. Nature. (2018) 555:647. doi: 10.1038/nature26136
8. Jiang M, Zhang Y, Liu M, Lan MS, Fei J, Fan W, et al. Hypermethylation of hepatic glucokinase and L-type pyruvate kinase promoters in high-fat diet-induced obese rats. Endocrinology. (2011) 152:1284–9. doi: 10.1210/en.2010-1162
9. Ohashi K, Munetsuna E, Yamada H, Ando Y, Yamazaki M, Taromaru N, et al. High fructose consumption induces DNA methylation at PPARα and CPT1A promoter regions in the rat liver. Biochem Biophys Res Commun. (2015) 468:185–9. doi: 10.1016/j.bbrc.2015.10.134
10. Ling C, Del Guerra S, Lupi R, Rönn T, Granhall C, Luthman H, et al. Epigenetic regulation of PPARGC1A in human type 2 diabetic islets and effect on insulin secretion. Diabetologia. (2008) 51:615–22. doi: 10.1007/s00125-007-0916-5
11. Yang BT, Dayeh TA, Volkov PA, Kirkpatrick CL, Malmgren S, Jing X, et al. Increased DNA methylation and decreased expression of PDX-1 in pancreatic islets from patients with type 2 diabetes. Mol Endocrinol. (2012) 26:1203–12. doi: 10.1210/me.2012-1004
12. Yang BT, Dayeh TA, Kirkpatrick CL, Taneera J, Kumar R, Groop L, et al. Insulin promoter DNA methylation correlates negatively with insulin gene expression and positively with HbA 1c levels in human pancreatic islets. Diabetologia. (2011) 54:360–7. doi: 10.1007/s00125-010-1967-6
13. Volkov P, Bacos K, Ofori JK, Esguerra JLS, Eliasson L, Rönn T, et al. Whole-genome bisulfite sequencing of human pancreatic islets reveals novel differentially methylated regions in type 2 diabetes pathogenesis. Diabetes. (2017) 66:1074–85. doi: 10.2337/db16-0996
14. Ma X, Kang S. Functional implications of DNA methylation in adipose biology. Diabetes. (2019) 68:871–8. doi: 10.2337/dbi18-0057
15. Li A, Yuan X, Liang XF, Liu L, Li J, Li B, et al. Adaptations of lipid metabolism and food intake in response to low and high fat diets in juvenile grass carp (Ctenopharyngodon idellus). Aquaculture. (2016) 457:43–9. doi: 10.1016/j.aquaculture.2016.01.014
16. Gao W, Liu YJ, Tian LX, Mai KS, Liang GY, Yang HJ, et al. Effect of dietary carbohydrate-to-lipid ratios on growth performance, body composition, nutrient utilization and hepatic enzymes activities of herbivorous grass carp (Ctenopharyngodon idella). Aquacult Nutr. (2010) 16:327–33. doi: 10.1111/j.1365-2095.2009.00668.x
17. Cai W, Liang XF, Yuan X, Li A, He Y, He S. Genomic organization and expression of insulin receptors in grass carp, Ctenopharyngodon idellus. Comp Biochem Phys B. (2016) 194:51–7. doi: 10.1016/j.cbpb.2015.11.013
18. Cai W, Liang XF, Yuan X, Liu L, He S, Li J, et al. Different strategies of grass carp (Ctenopharyngodon idella) responding to insufficient or excessive dietary carbohydrate. Aquaculture. (2018) 497:292–8. doi: 10.1016/j.aquaculture.2018.07.042
19. Mao X, Cai T, Olyarchuk JG, Wei L. Automated genome annotation and pathway identification using the KEGG Orthology (KO) as a controlled vocabulary. Bioinformatics. (2005) 21:3787–93. doi: 10.1093/bioinformatics/bti430
20. Ma D, Fan J, Tian Y, Jiang P, Wang J, Zhu H, et al. Selection of reference genes for quantitative real-time PCR normalisation in largemouth bass Micropterus salmoides fed on alternative diets. J Fish Biol. (2019) 95:393–400. doi: 10.1111/jfb.13991
21. Livak KJ, Schmittgen TD. Analysis of relative gene expression data using real-time quantitative PCR and the 2ΔΔCT method. Methods. (2001) 25:402–8. doi: 10.1006/meth.2001.1262
22. Weaver IC, Cervoni N, Champagne FA, D'Alessio AC, Sharma S, Seckl JR, et al. Epigenetic programming by maternal behavior. Nat Neurosci. (2004) 7:847. doi: 10.1038/nn1276
23. Samblas M, Milagro FI, Martínez A. DNA methylation markers in obesity, metabolic syndrome, and weight loss. Epigenetics. (2019) 14:421–44. doi: 10.1080/15592294.2019.1595297
24. Hall E, Volkov P, Dayeh T, Bacos K, Rönn T, Nitert MD, et al. Effects of palmitate on genome-wide mRNA expression and DNA methylation patterns in human pancreatic islets. BMC Med. (2014) 12:103. doi: 10.1186/1741-7015-12-103
25. Flores-Sierra J, Arredondo-Guerrero M, Cervantes-Paz B, Rodríguez-Ríos D, Alvarado-Caudillo Y, Nielsen FC, et al. The trans fatty acid elaidate affects the global DNA methylation profile of cultured cells and in vivo. Lipids Health Dis. (2016) 15:75. doi: 10.1186/s12944-016-0243-2
26. Terova G, Díaz N, Rimoldi S, Ceccotti C, Gliozheni E, Piferrer F. Effects of sodium butyrate treatment on histone modifications and the expression of genes related to epigenetic regulatory mechanisms and immune response in European sea bass (Dicentrarchus Labrax) fed a plant-based diet. PLoS One. (2016) 11:e0160332. doi: 10.1371/journal.pone.0160332
27. Marandel L, Lepais O, Arbenoits E, Véron V, Dias K, Zion M, et al. Remodelling of the hepatic epigenetic landscape of glucose-intolerant rainbow trout (Oncorhynchus mykiss) by nutritional status and dietary carbohydrates. Sci Rep. (2016) 6:32187. doi: 10.1038/srep32187
28. Akemann C, Meyer DN, Gurdziel K, Baker TR. Developmental dioxin exposure alters the methylome of adult male zebrafish gonads. Front Genet. (2018) 9:719. doi: 10.3389/fgene.2018.00719
29. Wan ZY, Xia JH, Lin G, Wang L, Lin VC, Yue GH. Genome-wide methylation analysis identified sexually dimorphic methylated regions in hybrid tilapia. Sci Rep. (2016) 6:35903. doi: 10.1038/srep35903
30. Zemach A, McDaniel IE, Silva P, Zilberman D. Genome-wide evolutionary analysis of eukaryotic DNA methylation. Science. (2010) 328:916. doi: 10.1126/science.1186366
31. Liu J, Dias K, Plagnes-Juan E, Veron V, Panserat S, Marandel L. Long-term programming effect of embryonic hypoxia exposure and high-carbohydrate diet at first feeding on glucose metabolism in juvenile rainbow trout. J Exp Biol. (2017) 220:3686–94. doi: 10.1242/jeb.161406
32. Whitehead JP, Clark SF, Ursø B, James DE. Signalling through the insulin receptor. Curr Opin Cell Biol. (2000) 12:222–8. doi: 10.1016/S0955-0674(99)00079-4
33. Polakof S, Skiba-Cassy S, Choubert G, Panserat S. Insulin-induced hypoglycaemia is co-ordinately regulated by liver and muscle during acute and chronic insulin stimulation in rainbow trout (Oncorhynchus mykiss). J Exp Biol. (2010) 213:1443–52. doi: 10.1242/jeb.037689
34. Kim JH, Kim JE, Liu H-Y, Cao W, Chen J. Regulation of interleukin-6-induced hepatic insulin resistance by mammalian target of rapamycin through the STAT3-SOCS3 pathway. J Biol Chem. (2008) 283:708–15. doi: 10.1074/jbc.M708568200
35. Kern PA, Ranganathan S, Li C, Wood L, Ranganathan G. Adipose tissue tumor necrosis factor and interleukin-6 expression in human obesity and insulin resistance. Am J Physiol Endocrinol Metab. (2001) 280:E745–E51. doi: 10.1152/ajpendo.2001.280.5.E745
36. Cordero P, Campion J, Milagro FI, Goyenechea E, Steemburgo T, Javierre BM, et al. Leptin and TNF-alpha promoter methylation levels measured by MSP could predict the response to a low-calorie diet. J Physiol Biochem. (2011) 67:463–70. doi: 10.1007/s13105-011-0084-4
37. Ali O, Cerjak D, Kent JW Jr, James R, Blangero J, Carless MA, et al. Methylation of SOCS3 is inversely associated with metabolic syndrome in an epigenome-wide association study of obesity. Epigenetics. (2016) 11:699–707. doi: 10.1080/15592294.2016.1216284
38. Hoile SP, Lillycrop KA, Grenfell LR, Hanson MA, Burdge GC. Increasing the folic acid content of maternal or post-weaning diets induces differential changes in phosphoenolpyruvate carboxykinase mRNA expression and promoter methylation in rats. Br J Nutr. (2012) 108:852–7. doi: 10.1017/S0007114511006155
39. Cai D, Jia Y, Song H, Sui S, Lu J, Jiang Z, et al. Betaine supplementation in maternal diet modulates the epigenetic regulation of hepatic gluconeogenic genes in neonatal piglets. PLoS One. (2014) 9:e105504. doi: 10.1371/journal.pone.0105504
40. Adaikalakoteswari A, Finer S, Voyias PD, McCarthy CM, Vatish M, Moore J, et al. Vitamin B 12 insufficiency induces cholesterol biosynthesis by limiting s-adenosylmethionine and modulating the methylation of SREBF1 and LDLR genes. Clin Epigenet. (2015) 7:14. doi: 10.1186/s13148-015-0046-8
41. Wang L, Chen L, Tan Y, Wei J, Chang Y, Jin T, et al. Betaine supplement alleviates hepatic triglyceride accumulation of apolipoprotein E deficient mice via reducing methylation of peroxisomal proliferator-activated receptor alpha promoter. Lipids Health Dis. (2013) 12:34. doi: 10.1186/1476-511X-12-34
42. Jung PM. High Fat Diet Causes Hepatic Lipid Accumulation by Programming Lipid Synthesizing Genes via Gene Body Methylation. (2017). Available online at: http://hdl.handle.net/2142/99124
43. Cordero P, Gómez-Úriz AM, Campion J, Milagro F, Martinez JA. Dietary supplementation with methyl donors reduces fatty liver and modifies the fatty acid synthase DNA methylation profile in rats fed an obesogenic diet. Genes Nutr. (2013) 8:105–13. doi: 10.1007/s12263-012-0300-z
44. Rabe K, Lehrke M, Parhofer KG, Broedl UC. Adipokines and insulin resistance. Mol Med. (2008) 14:741–51. doi: 10.2119/2008-00058.Rabe
45. Cohen P, Miyazaki M, Socci ND, Hagge-Greenberg A, Liedtke W, Soukas AA, et al. Role for stearoyl-CoA desaturase-1 in leptin-mediated weight loss. Science. (2002) 297:240–3. doi: 10.1126/science.1071527
46. Dalman MR, Liu Q, King MD, Bagatto B, Londraville RL. Leptin expression affects metabolic rate in zebrafish embryos (D. rerio). Front Physiol. (2013) 4:160. doi: 10.3389/fphys.2013.00160
47. Milagro F, Campion J, Garcia-Diaz D, Goyenechea E, Paternain L, Martinez J. High fat diet-induced obesity modifies the methylation pattern of leptin promoter in rats. J Physiol Biochem. (2009) 65:1–9. doi: 10.1007/BF03165964
48. Lesseur C, Armstrong DA, Paquette AG, Li Z, Padbury JF, Marsit C. Maternal obesity and gestational diabetes are associated with placental leptin DNA methylation. Am J Obstet Gynecol. (2014) 211:651.e1–654.e9. doi: 10.1016/j.ajog.2014.06.037
49. Pajvani UB, Scherer PE. Adiponectin: systemic contributor to insulin sensitivity. Curr Diabetes Rep. (2003) 3:207–13. doi: 10.1007/s11892-003-0065-2
50. Goldstein BJ, Scalia R. Adiponectin: a novel adipokine linking adipocytes and vascular function. J Clin Endocr Metab. (2004) 89:2563–8. doi: 10.1210/jc.2004-0518
51. Kadowaki T, Yamauchi T. Adiponectin adiponectin receptors. Endocr Rev. (2005) 26:439–51. doi: 10.1210/er.2005-0005
52. Yoon MJ, Lee GY, Chung J-J, Ahn YH, Hong SH, Kim JB. Adiponectin increases fatty acid oxidation in skeletal muscle cells by sequential activation of AMP-activated protein kinase, p38 mitogen-activated protein kinase, and peroxisome proliferator-activated receptor α. Diabetes. (2006) 55:2562–70. doi: 10.2337/db05-1322
53. Kim AY, Park YJ, Pan X, Shin KC, Kwak S-H, Bassas AF, et al. Obesity-induced DNA hypermethylation of the adiponectin gene mediates insulin resistance. Nat Commun. (2015) 6:7585. doi: 10.1038/ncomms8585
54. Lee TF, Zhai J, Meyers BC. Conservation and divergence in eukaryotic DNA methylation. Proc Natl Acad Sci U S A. (2010) 107:9027–8. doi: 10.1073/pnas.1005440107
55. Feng S, Cokus SJ, Zhang X, Chen P-Y, Bostick M, Goll MG, et al. Conservation and divergence of methylation patterning in plants and animals. Proc Natl Acad Sci U S A. (2010) 107:8689–94. doi: 10.1073/pnas.1002720107
56. Zhang C, Hoshida Y, Sadler K. Comparative epigenomic profiling of the DNA methylome in mouse and zebrafish uncovers high interspecies divergence. Front Genet. (2016) 7:110. doi: 10.3389/fgene.2016.00110
57. Zhang Y, Qin C, Yang L, Lu R, Zhao X, Nie G. A comparative genomics study of carbohydrate/glucose metabolic genes: from fish to mammals. BMC Genomics. (2018) 19:246. doi: 10.1186/s12864-018-4647-4
58. Perfilyev A, Dahlman I, Gillberg L, Rosqvist F, Iggman D, Volkov P, et al. Impact of polyunsaturated and saturated fat overfeeding on the DNA-methylation pattern in human adipose tissue: a randomized controlled trial. Am J Clin Nutr. (2017) 105:991–1000. doi: 10.3945/ajcn.116.143164
59. Yang X, Huang Y, Sun C, Li J. Maternal prenatal folic acid supplementation programs offspring lipid metabolism by aberrant DNA methylation in hepatic ATGL and adipose LPL in rats. Nutrients. (2017) 9:935. doi: 10.3390/nu9090935
60. Castellano-Castillo D, Moreno-Indias I, Fernández-García JC, Alcaide-Torres J, Moreno-Santos I, Ocaña L, et al. Adipose tissue LPL methylation is associated with triglyceride concentrations in the metabolic syndrome. Clin Chem. (2018) 64:210–8. doi: 10.1373/clinchem.2017.277921
61. Chen M, Zhang J, Li N, Qian Z, Zhu M, Li Q, et al. Promoter hypermethylation mediated downregulation of FBP1 in human hepatocellular carcinoma and colon cancer. PLoS One. (2011) 6:e25564. doi: 10.1371/journal.pone.0025564
62. Kuroda A, Rauch TA, Todorov I, Ku HT, Al-Abdullah IH, Kandeel F, et al. Insulin gene expression is regulated by DNA methylation. PloS One. (2009) 4:e6953. doi: 10.1371/journal.pone.0006953
63. Plagemann A, Roepke K, Harder T, Brunn M, Harder A, Wittrock-Staar M, et al. Epigenetic malprogramming of the insulin receptor promoter due to developmental overfeeding. J Perinat Med. (2010) 38:393–400. doi: 10.1515/jpm.2010.051
64. Ma J, Cheng J, Wang L, Wang H, Xu L, Liu P, et al. No association between IRS-1 promoter methylation and type 2 diabetes. Mol Med Rep. (2013) 8:949–53. doi: 10.3892/mmr.2013.1569
65. Nile CJ, Read RC, Akil M, Duff GW, Wilson AG. Methylation status of a single CpG site in the IL6 promoter is related to IL6 messenger RNA levels and rheumatoid arthritis. Arthritis Rheum. (2008) 58:2686–93. doi: 10.1002/art.23758
Keywords: whole-genome DNA methylation analysis, metabolism, high carbohydrate intake, grass carp, hyperglycemia
Citation: Cai W-J, Liang X-F, Yuan X-C, Li A-X and He S (2020) Changes of DNA Methylation Pattern in Metabolic Pathways Induced by High-Carbohydrate Diet Contribute to Hyperglycemia and Fat Deposition in Grass Carp (Ctenopharyngodon idellus). Front. Endocrinol. 11:398. doi: 10.3389/fendo.2020.00398
Received: 18 January 2020; Accepted: 18 May 2020;
Published: 10 July 2020.
Edited by:
Anne-Sophie Vercoutter-Edouart, Centre National de la Recherche Scientifique (CNRS), FranceReviewed by:
Laia Navarro-Martin, Instituto de Diagnóstico Ambiental y Estudios del Agua (IDAEA), SpainHélène Volkoff, Memorial University of Newfoundland, Canada
Copyright © 2020 Cai, Liang, Yuan, Li and He. This is an open-access article distributed under the terms of the Creative Commons Attribution License (CC BY). The use, distribution or reproduction in other forums is permitted, provided the original author(s) and the copyright owner(s) are credited and that the original publication in this journal is cited, in accordance with accepted academic practice. No use, distribution or reproduction is permitted which does not comply with these terms.
*Correspondence: Xu-Fang Liang, eHVmYW5nX2xpYW5nQGhvdG1haWwuY29t