- 1Chinese Academy of Medical Sciences and Peking Union Medical College, Beijing, China
- 2Department of Ultrasound, China-Japan Friendship Hospital, Beijing, China
- 3Department of Liver Surgery, Peking Union Medical College Hospital, Chinese Academy of Medical Sciences and Peking Union Medical College, Beijing, China
- 4Institute of Clinical Medicine, China-Japan Friendship Hospital, Beijing, China
- 5Department of Ultrasound, China-Japan Friendship Hospital, National Center for Respiratory Medicine, National Clinical Research Centerfor Respiratory Diseases, Institute of Respiratory Medicine of Chinese Academy of Medical Sciences, Beijing, China
Background: The preoperative identification of BRAF mutation could assist to make appropriate treatment strategies for patients with papillary thyroid microcarcinoma (PTMC). This study aimed to establish an ultrasound (US) radiomics nomogram for the assessment of BRAF status.
Methods: A total of 328 PTMC patients at the China-Japan Friendship Hospital between February 2019 and November 2021 were enrolled in this study. They were randomly divided into training (n = 232) and validation (n = 96) cohorts. Radiomics features were extracted from the US images. The least absolute shrinkage and selection operator (LASSO) regression was applied to select the BRAF status-related features and calculate the radiomics score (Rad-score). Univariate and multivariate logistic regression analyses were subsequently performed to identify the independent factors among Rad-score and conventional US features. The US radiomics nomogram was established and its predictive performance was evaluated via discrimination, calibration, and clinical usefulness in the training and validation sets.
Results: Multivariate analysis indicated that the Rad-score, composition, and aspect ratio were independent predictive factors of BRAF status. The US radiomics nomogram which incorporated the three variables showed good calibration. The discrimination of the US radiomics nomogram showed better discriminative ability than the conventional US model both in the training set (AUC 0.685 vs. 0.592) and validation set (AUC 0.651 vs. 0.622). Decision curve analysis indicated the superior clinical applicability of the nomogram compared to the conventional US model.
Conclusions: The US radiomics nomogram displayed better performance than the conventional US model in predicting BRAF mutation in patients with PTMC.
Introduction
Papillary thyroid cancer (PTC) is the main contributor to the rapidly rising incidence of thyroid malignancies worldwide (1). Approximately 40%–50% of PTC is composed of papillary thyroid microcarcinomas (PTMCs), which are defined as the maximum diameter of tumors less than or equal to 10 mm (2). Although the majority of PTMCs are known to have indolent disease progression and excellent outcomes (3), some patients with high-risk features do have aggressive tumor behavior, including local recurrence and metastasis (4). For clinically low-risk PTMC patients, defined as the absence of extrathyroidal extension (ETE), lymph node metastasis (LNM), and distant metastasis, the standard management varies differently in clinical practice, and active surveillance has emerged as an alternative to surgical resection (3, 5). Nevertheless, some patients with clinically low-risk PTMC still show recurrence in the later course, resulting in a poor prognosis.
BRAF mutation is the most common genetic alteration in PTC (6), which has been proven to drive aggressive tumor behavior. Abundant studies revealed that BRAF mutation was independently correlated with recurrence and metastasis of PTMC, which can be introduced as a genetic prognostic indicator for PTMC patients (5, 7–9). In that case, the preoperative diagnosis of the BRAF mutation can help identify high-risk PTMC patients and plan more aggressive treatment strategies.
Fine-needle aspiration (FNA) is the most commonly used technique to diagnose BRAF mutation in preoperative evaluation (10). However, current guidelines do not recommend FNA for nodules with a diameter less than 10 mm (11–13). Although some patients presented with high-risk thyroid nodules on ultrasound, they would not be suggested to do the FNA due to the small diameter of the nodules. Some patients might choose conservative surveillance and still have unclear BRAF mutation status. Therefore, if BRAF mutation status can be determined in the preoperative examination, further FNA and gene sequencing could provide more critical information for risk stratification and surgical planning.
Ultrasound (US) is the primary imaging technique for the evaluation of thyroid nodules (14). Several studies have investigated whether conventional US features could predict the presence of the BRAF mutation in PTMC and have reported controversial results, which might be due to limitations of the conventional US image, such as high dependency on the radiologist’s experience and interobserver variation (15). Radiomics, which automatically extracts innumerable high-dimensional features from images, has recently emerged as a novel method to acquire more information from image material. Radiomics analyses based on US images have been utilized to predict molecular properties in various cancers, including PTC (16, 17). To our knowledge, there are no published studies aimed at identifying the presence of BRAF mutation in PTMC using US radiomics features. Therefore, this study was conducted in order to explore the association between BRAF mutation status and radiomics features and develop a US radiomics nomogram for the prediction of preoperative BRAF mutation for PTMC patients.
Materials and methods
Patient selection
Between February 2019 and November 2021, consecutive patients from the China-Japan Friendship Hospital were included. This retrospective study was approved by the Institutional Review Board of China-Japan Friendship Hospital. The inclusion criteria of this study were detailed as follows: 1) the target nodule was pathologically confirmed as PTC; 2) the largest size of the target nodule was less or equal to 10 mm; 3) the US image of the targeted tumor in the longest axis was available; and 4) the BRAF mutation test was performed and acquired a specific diagnostic result. The exclusion criteria were as follows: 1) the pathological and BRAF mutation status of the target tumor was uncertain; 2) the patient previously underwent thyroidectomy, radiofrequency ablation, or radiotherapy; and 3) concomitant with other types of thyroid malignancies or other variants of gene mutation. The final analyzed cohort consisted of 328 patients with PTMC. According to the gene mutation status, the patients were divided into two groups: BRAF (+) and BRAF (−). By using the “createDataPartiton” function in R (version 3.6.3), the discovery cohort was divided into training and validation sets with a ratio of 7:3. All the included patients were finally classified into training (n = 232) and validation (n = 96) cohorts. Patients’ information about age, gender, and conventional US features was collected from medical records.
BRAF mutation analysis
US-guided FNAs were performed by an experienced radiologist with more than 20 years of experience in FNA for thyroid nodules. At least three repeated aspirations were performed in different directions. Samples obtained with 23-gauge needles were sent for cytological examination. The remaining tissue was flushed into normal saline and used for BRAFV600E mutation analysis. Genomic DNA was extracted from FNA specimens using AmoyDx® BRAF Mutation Detection Kit (V2) (ADx-BR02) provided by Amoy Diagnostics Co., Ltd. (Xiamen, China). Mutations of BRAFV600E were analyzed by a next-generation sequencing (NGS) method. This was followed by a real-time fluorescence polymerase chain reaction-amplification refractory mutation system (PCR-ARMS).
US image acquisition and feature evaluation
US examinations were performed by radiologists with 5–20 years of experience in thyroid US evaluation. These examinations were performed with a 5–14-MHz transducer (Siemens, ACUSON Sequoia, Siemens Medical Solutions USA, Inc. Malvern, USA). US images were stored digitally as Digital Imaging and Communications in Medicine (DICOM) in axial and/or sagittal planes of the thyroid nodules for subsequent evaluation.
All the US images were independently reviewed by two experienced radiologists to assess the US features in a single-blind manner. They did not know whether there was BRAF mutation of the target nodule when evaluating the US features. The two radiologists made final decisions by consensus when discordant cases occurred. The conventional US features include shape (regular, irregular), margin (smooth, rough), aspect ratio (≥1 or<1), calcification (absent or present), halo (absent or present), location (right lobe, left lobe, isthmus), maximum diameter of the tumor, association with the capsule (subcapsule thyroidal or intrathyroidal), and close to the tracheal cartilage (absent or present). The vascular characteristics of the target tumor were classified into five types by Frates et al. (18): 0 for no visible flow, 1 for minimal internal flow without a peripheral ring, 2 for a peripheral ring of flow (defined as >25% of the nodule’s circumference) with minimal or no internal flow, 3 for a peripheral ring of flow with a small to moderate amount of internal flow, and 4 for extensive internal flow with or without a peripheral ring.
Feature selection and radiomics score establishment
The MaZda software (version 4.6, available at http://www.eletel.p.lodz.pl/mazda/) was used for texture analysis (TA) (19). The region of interest (ROI) was manually delineated on the largest diameter image using the MaZda software. All the manual segmentations were conducted by two radiologists and one radiologist (twice) with more than 4 years of experience in thyroid imaging who were blinded from the BRAF mutation status (for interobserver and intraobserver reproducibility evaluation). The interclass correlation coefficient (ICC) was used to evaluate the interobserver and intraobserver agreement of the feature extraction. An ICC larger than 0.80 was considered excellent. The MaZda software allows the computation of almost 298 radiomics features, which were classified into six categories: (1) HISTOGRAM (2) GRADIENT (3) RUN LENGTH MATRIX (4) CO-OCCURRENCE MATRIX (5) AUTOREGRESSIVE MODEL (6) HAAR WAVELET. The list of radiomics features is summarized in Supplementary Table 1.
Feature selection and building radiomics score (Rad-score) were based on the training cohort. The least absolute shrinkage and selection operator (LASSO) logistic regression method using 10-fold cross-validation was applied to select the most useful predictive BRAF-related features from the training cohort (20). The Rad-score was generated using a linear combination of the selected features weighted by the LASSO algorithm.
Development of the US radiomics nomogram
Univariate analyses, consisting of Student’s independent t-test (continuous variables) and χ2 test (categorical variables), were used to select the risk indicators associated with BRAF mutation. A multivariate logistic regression analysis incorporating Rad-score and conventional US variables was performed, using the backward step-down selection procedure with a liberal P <0.05 as the retention criteria to select the final indicators for BRAF mutation. Then, a US radiomics nomogram was developed based on the multivariate analysis in the training cohort. For comparison, a conventional US model was developed using the independent conventional US features alone without Rad-score. The whole procedure of the patient enrollment and model development is illustrated in Figure 1.
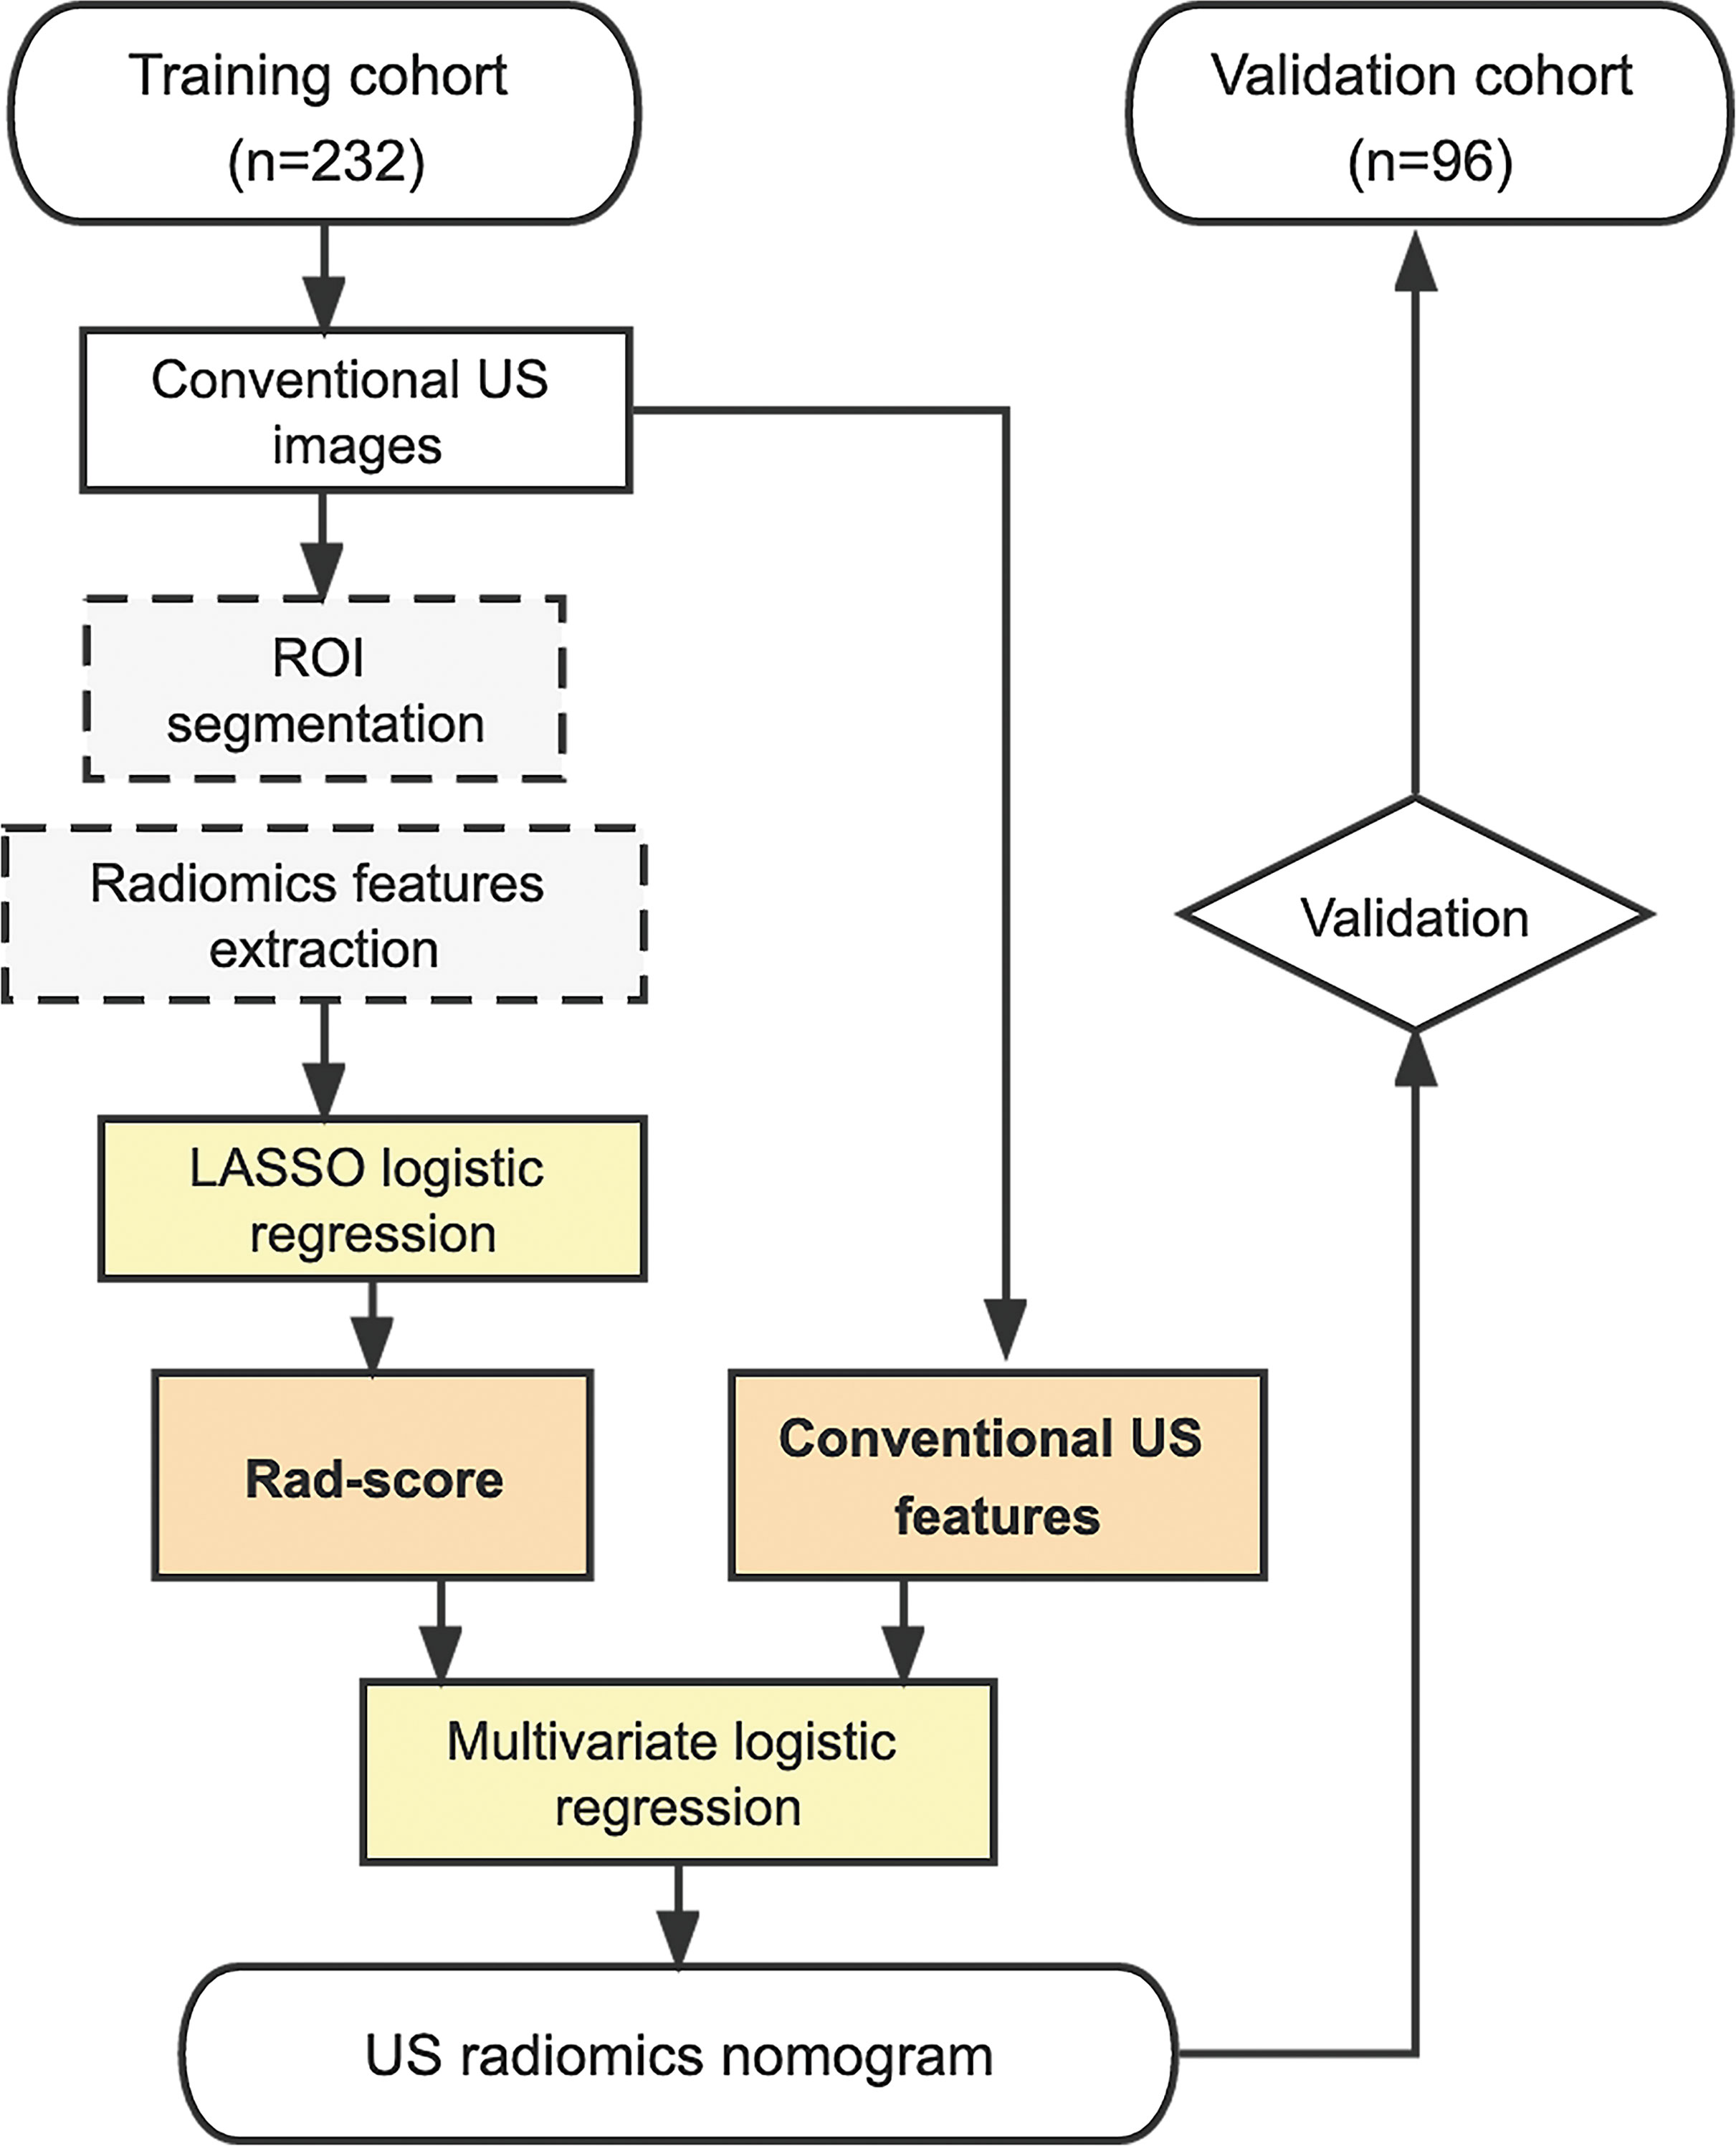
Figure 1 Procedure of patient selection and radiomics nomogram development. US, ultrasound; ROI, region of interest; LASSO, least absolute shrinkage and selection operator; Rad-score, radiomics score.
Predictive performance of the US radiomics nomogram
Calibration of the US radiomics nomogram was evaluated using the calibration curve. The discrimination performance of the nomogram was evaluated using the area under the receiver operating characteristic (ROC) curve (AUC). Decision curve analysis (DCA) was conducted to determine the clinical utility of the US radiomics nomogram by quantifying the net benefits at different threshold probabilities. The calibration, discrimination, and clinical utility of the nomogram were verified in the validation cohort. For clinical application, the predicted probability (defined as Nomo-score) of each patient was calculated according to the nomogram algorithm. Then, the optimal cutoff value was determined by maximizing the Youden index. The performance of the optimal cutoff value of the Nomo-score was assessed by the AUC, as well as sensitivity, specificity, positive predictive value (PPV), and negative predictive value (NPV).
Statistical analysis
Descriptive statistics are described as median (interquartile range, IQR) for categorical variables and frequency (%) for categorical variables. Pearson’s chi-square or Fisher’s exact test was used to compare differences for categorical characteristics. The independent sample t-test was performed for continuous factors with normal distribution, whereas the Mann–Whitney U test was used for continuous factors without normal distribution. Bonferroni-adjusted significance tests were applied for pairwise comparisons. All statistical analyses were performed with R 3.6.3 software (http://www.r-project.org). The statistical tests were two-sided, with statistical significance indicated by P-values lower than 0.05.
Results
Baseline characteristics
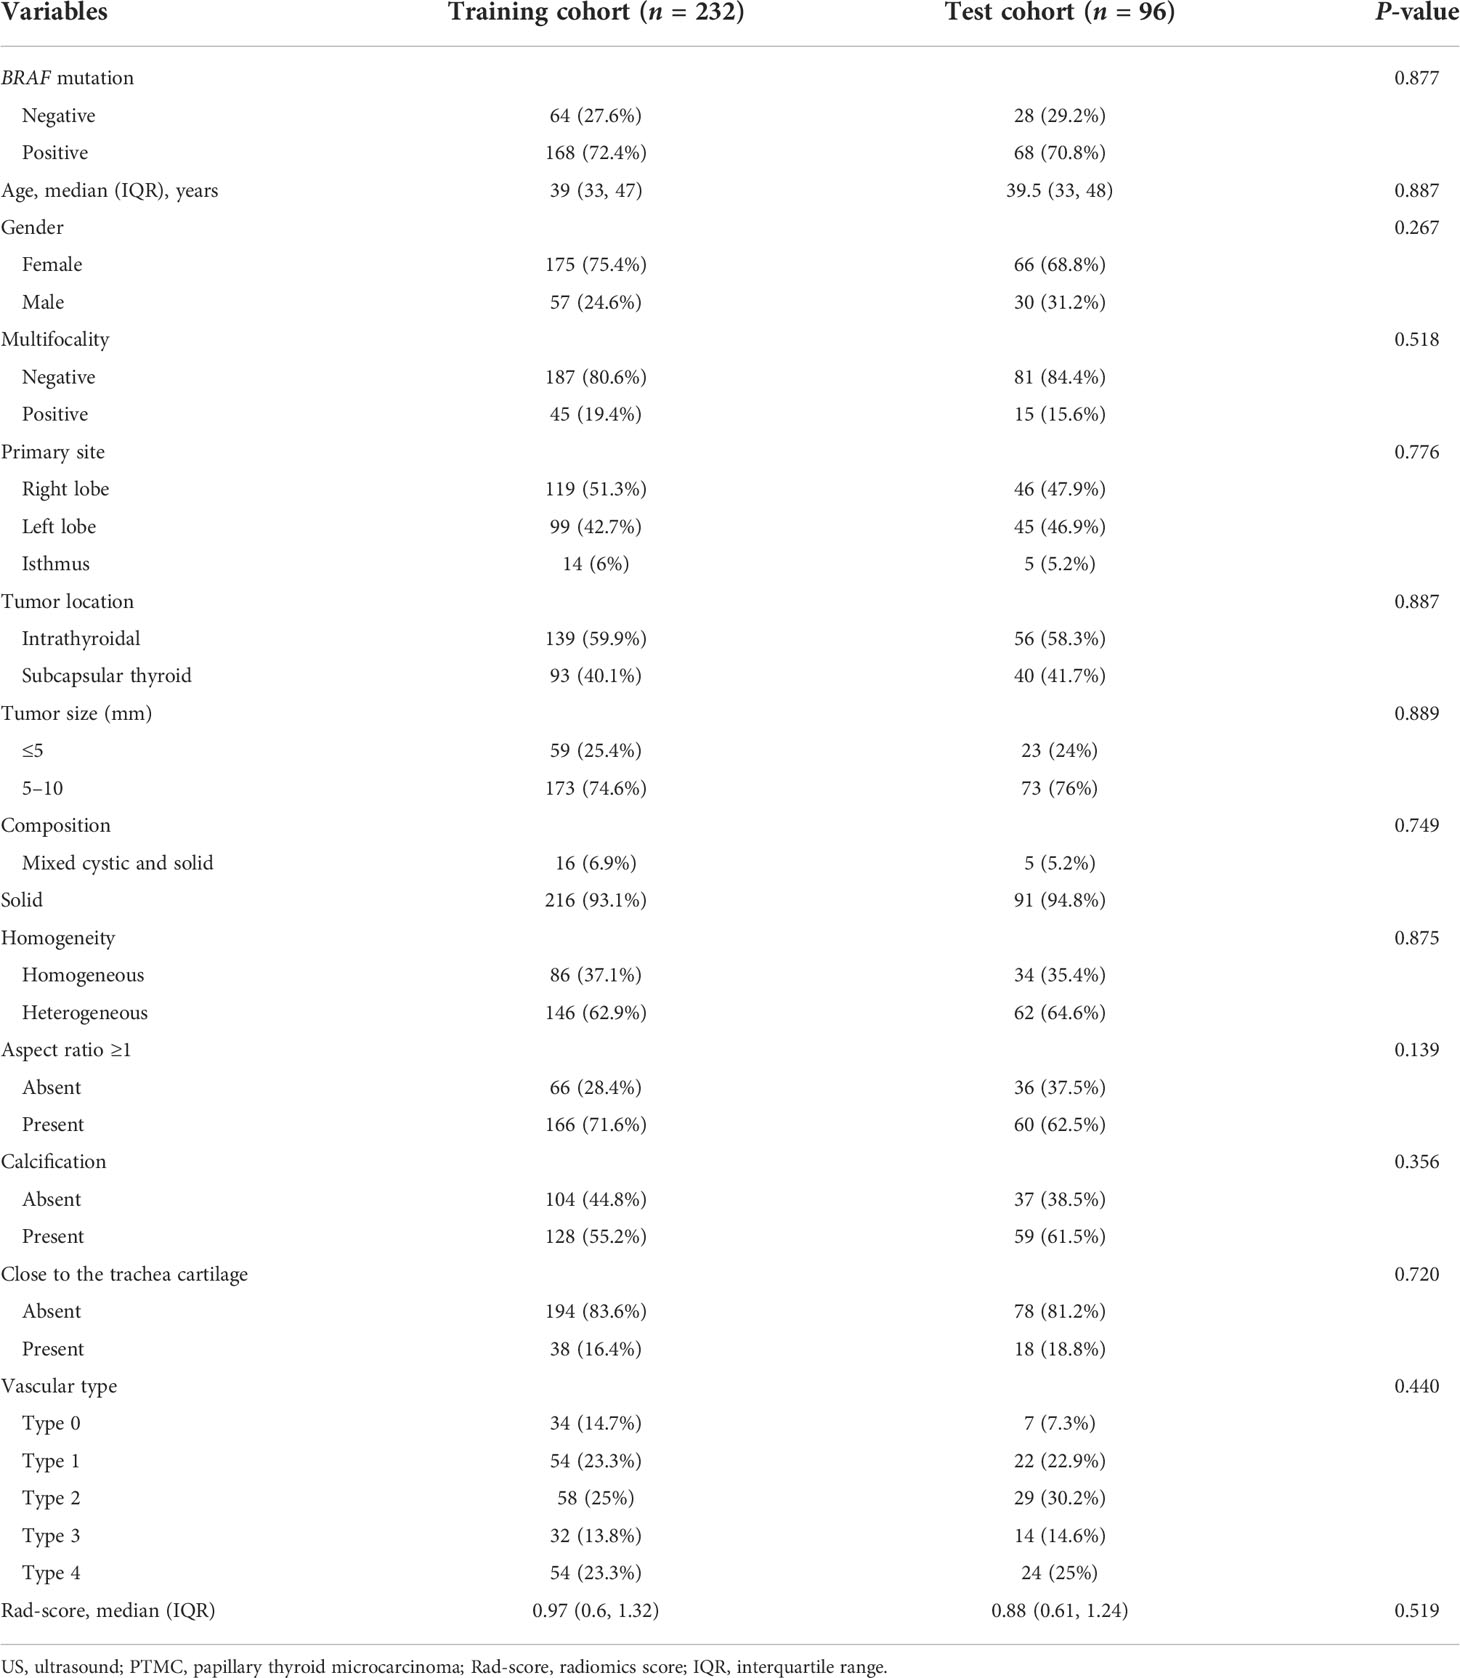
A total of 328 patients with PTMC were enrolled with an average age of 39 (IQR: 33 to 47) years and a male-to-female ratio of 87:241. Patients’ clinical and conventional US characteristics in the training and validation cohorts are summarized in Table 1. There were no differences in clinical and US characteristics between the two cohorts (P > 0.05). BRAF-positive [BRAF (+)] accounted for 72.4% and 70.8% of the training and validation cohorts, respectively. BRAF-negative [BRAF (−)] accounted for 27.6% and 29.2% of the training and validation cohorts, respectively. There were no differences in BRAF mutation status between the two cohorts (P = 0.877).
Establishment of the US radiomics score
The nodule under FNA and BRAF mutation was selected for analysis. For patients with more than one nodule, only the one under FNA and BRAF mutation was applied. The ROI was manually drawn using the MaZda software for all the target tumors. Favorable interobserver and intraobserver reproducibility of feature extraction was achieved, with intraobserver ICCs ranging from 0.783 to 0.997 and the interobserver ICCs ranging from 0.792 to 0.984. A total of 298 radiomics features were extracted from each US image. The LASSO logistic regression method using 10-fold cross-validation was applied to select the most useful predictive BRAF-related features from the training cohort. A total of 298 radiomics features were reduced to four potential predictors by the LASSO regression model (Figure 2). The Rad-score calculation formula was presented as follows. The detailed description of parameters in the formula is shown in Supplementary Table 1. The Rad-scores were much higher in the BRAF (+) group in both the training and validation sets than those in the BRAF (−) group (Table 2).
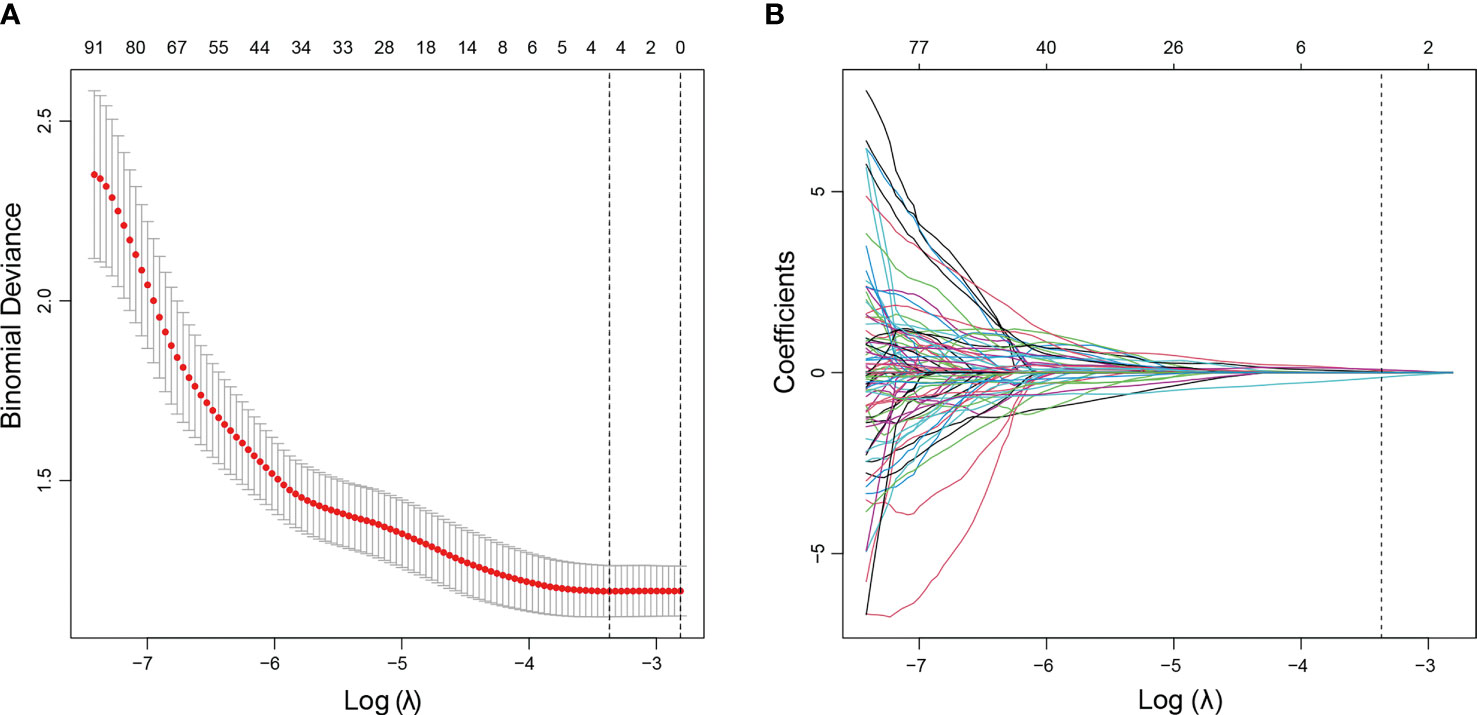
Figure 2 US radiomics feature selection using LASSO logistic regression model in the training cohort. (A) The tuning parameter (λ) was selected using 10-fold cross-validation via minimum criteria. Dotted vertical lines were drawn at the optimal values using the minimum criteria and 1 standard error of the minimum criteria (1−SE criteria). A λ value of 0.0273, with a log (λ) value of −3.601, was obtained. (B) The vertical line was drawn at the value selected using 10-fold cross-validation, where optimal λ resulted in four non-zero coefficients. LASSO, least absolute shrinkage and selection operator.
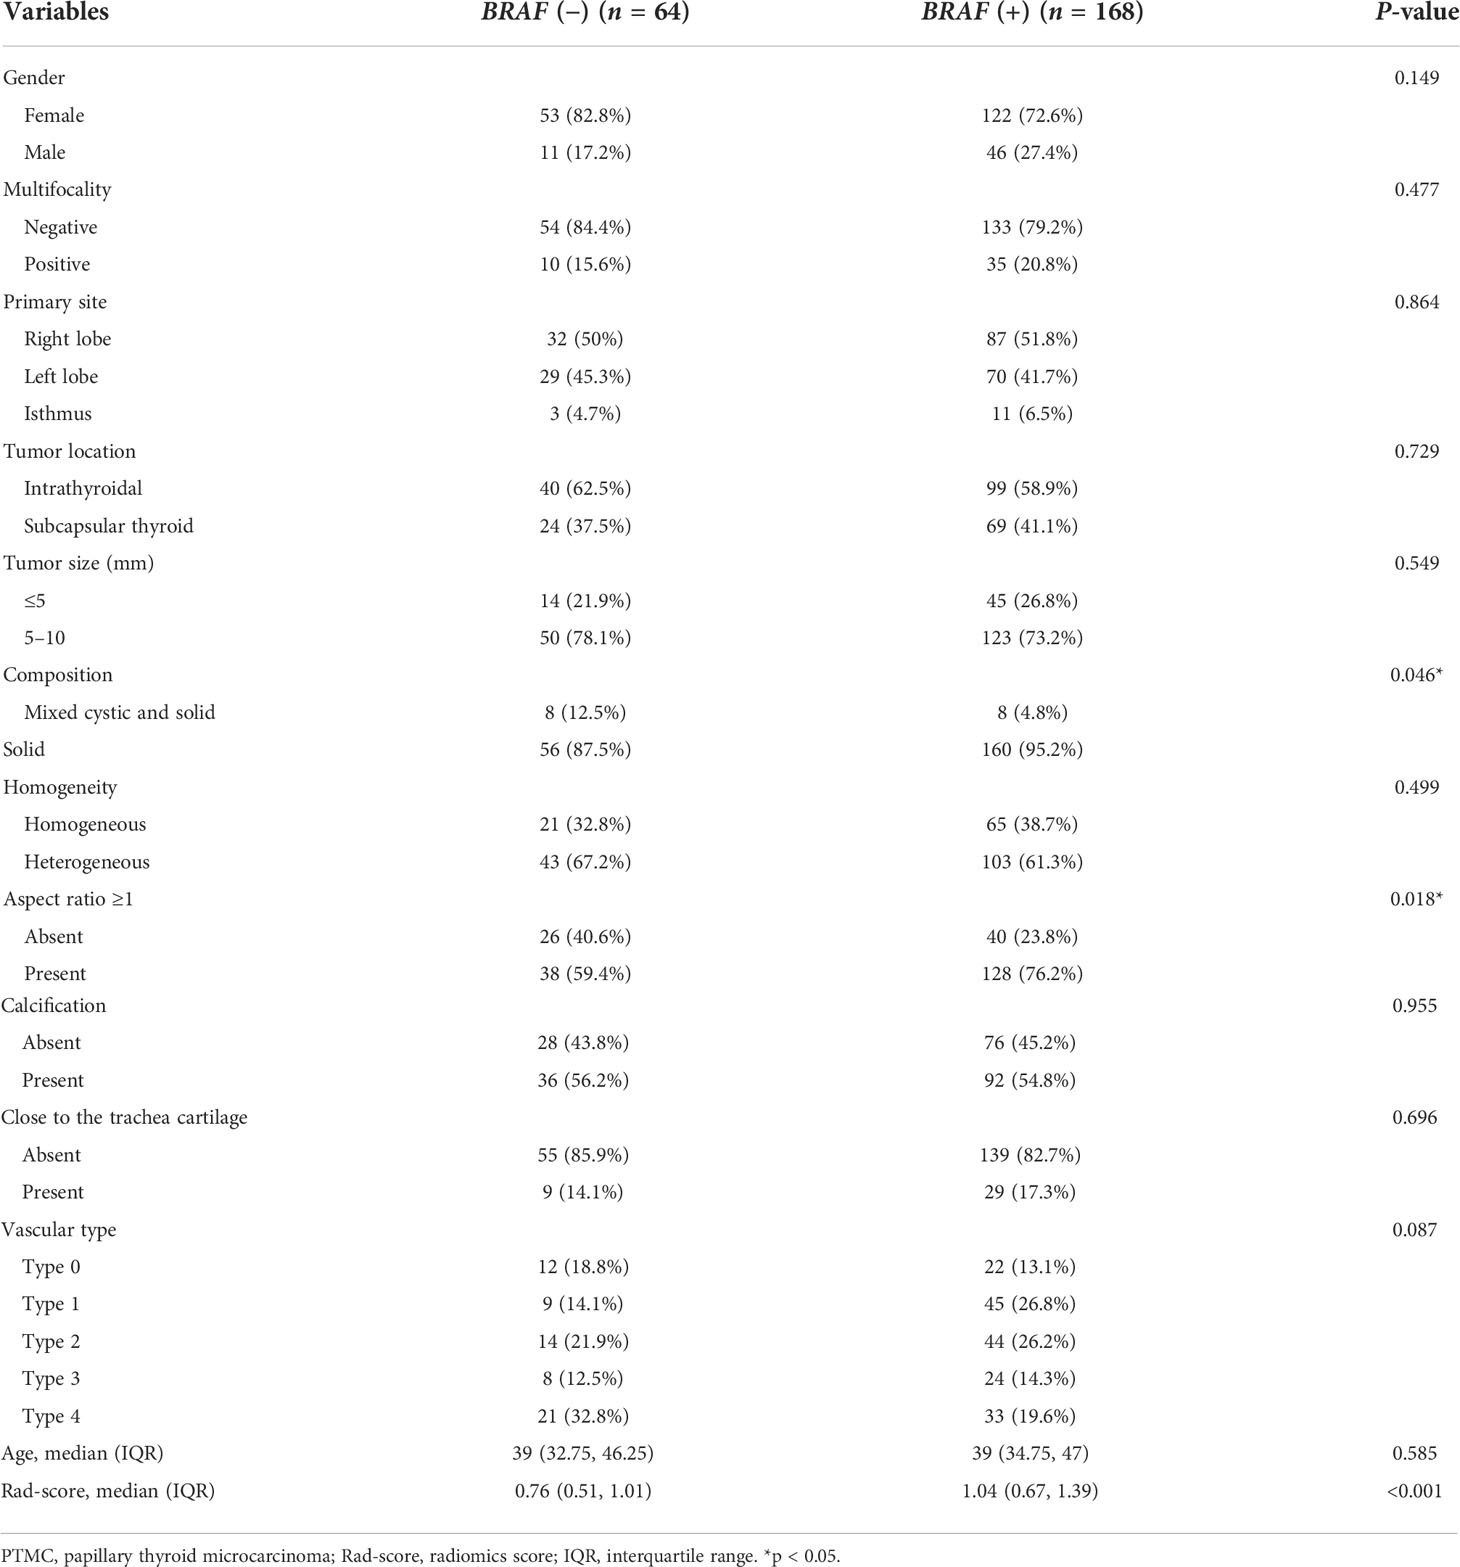
Table 2 Demographic and sonographic characteristics of PTMC patients by BRAF mutation status in the training cohort (n = 232).
Radiomics score (Rad-score) = 0.49815794 * Horzl_LngREmph + 0.32953014 * GrSkewness − 0.40707617 * Teta1 + 0.00094667 * Teta2 + 1.05750093.
Development and validation of the US radiomics nomogram
The Rad-score, composition, and aspect ratio ≥1 were identified as the three independent predictors of BRAF mutation in PTMC patients by a multivariate logistic regression model (Table 3). A nomogram for predicting BRAF mutation in PTMC was built on the basis of these three key factors (Figure 3). The AUCs confirmed a favorable discrimination performance of the nomogram both in the training cohort (AUC = 0.685, 95% CI: 0.610 to 0.760) and the validation cohort (AUC = 0.651, 95% CI: 0.532 to 0.770), which were higher than those of the conventional US model (AUC = 0.592 for the training set, AUC = 0.622 for the validation set). The calibration plots demonstrated optimal consistency between the bootstrap-predicted values and the actual observed values in the training and validation cohorts, indicating the appreciable reliability of the US radiomics nomogram (Figures 4A, B). The DCA results showed a wide field of threshold probability, supporting the favorable clinical applicability of the radiomics nomogram in predicting positive BRAF mutation for PTMC. Furthermore, the US radiomics nomogram obtained more clinical net benefits than the model based on conventional US features (Figures 4C, D).

Table 3 Independent predictive factors for BRAF mutation of PTMC based on multivariate logistic regression analysis.
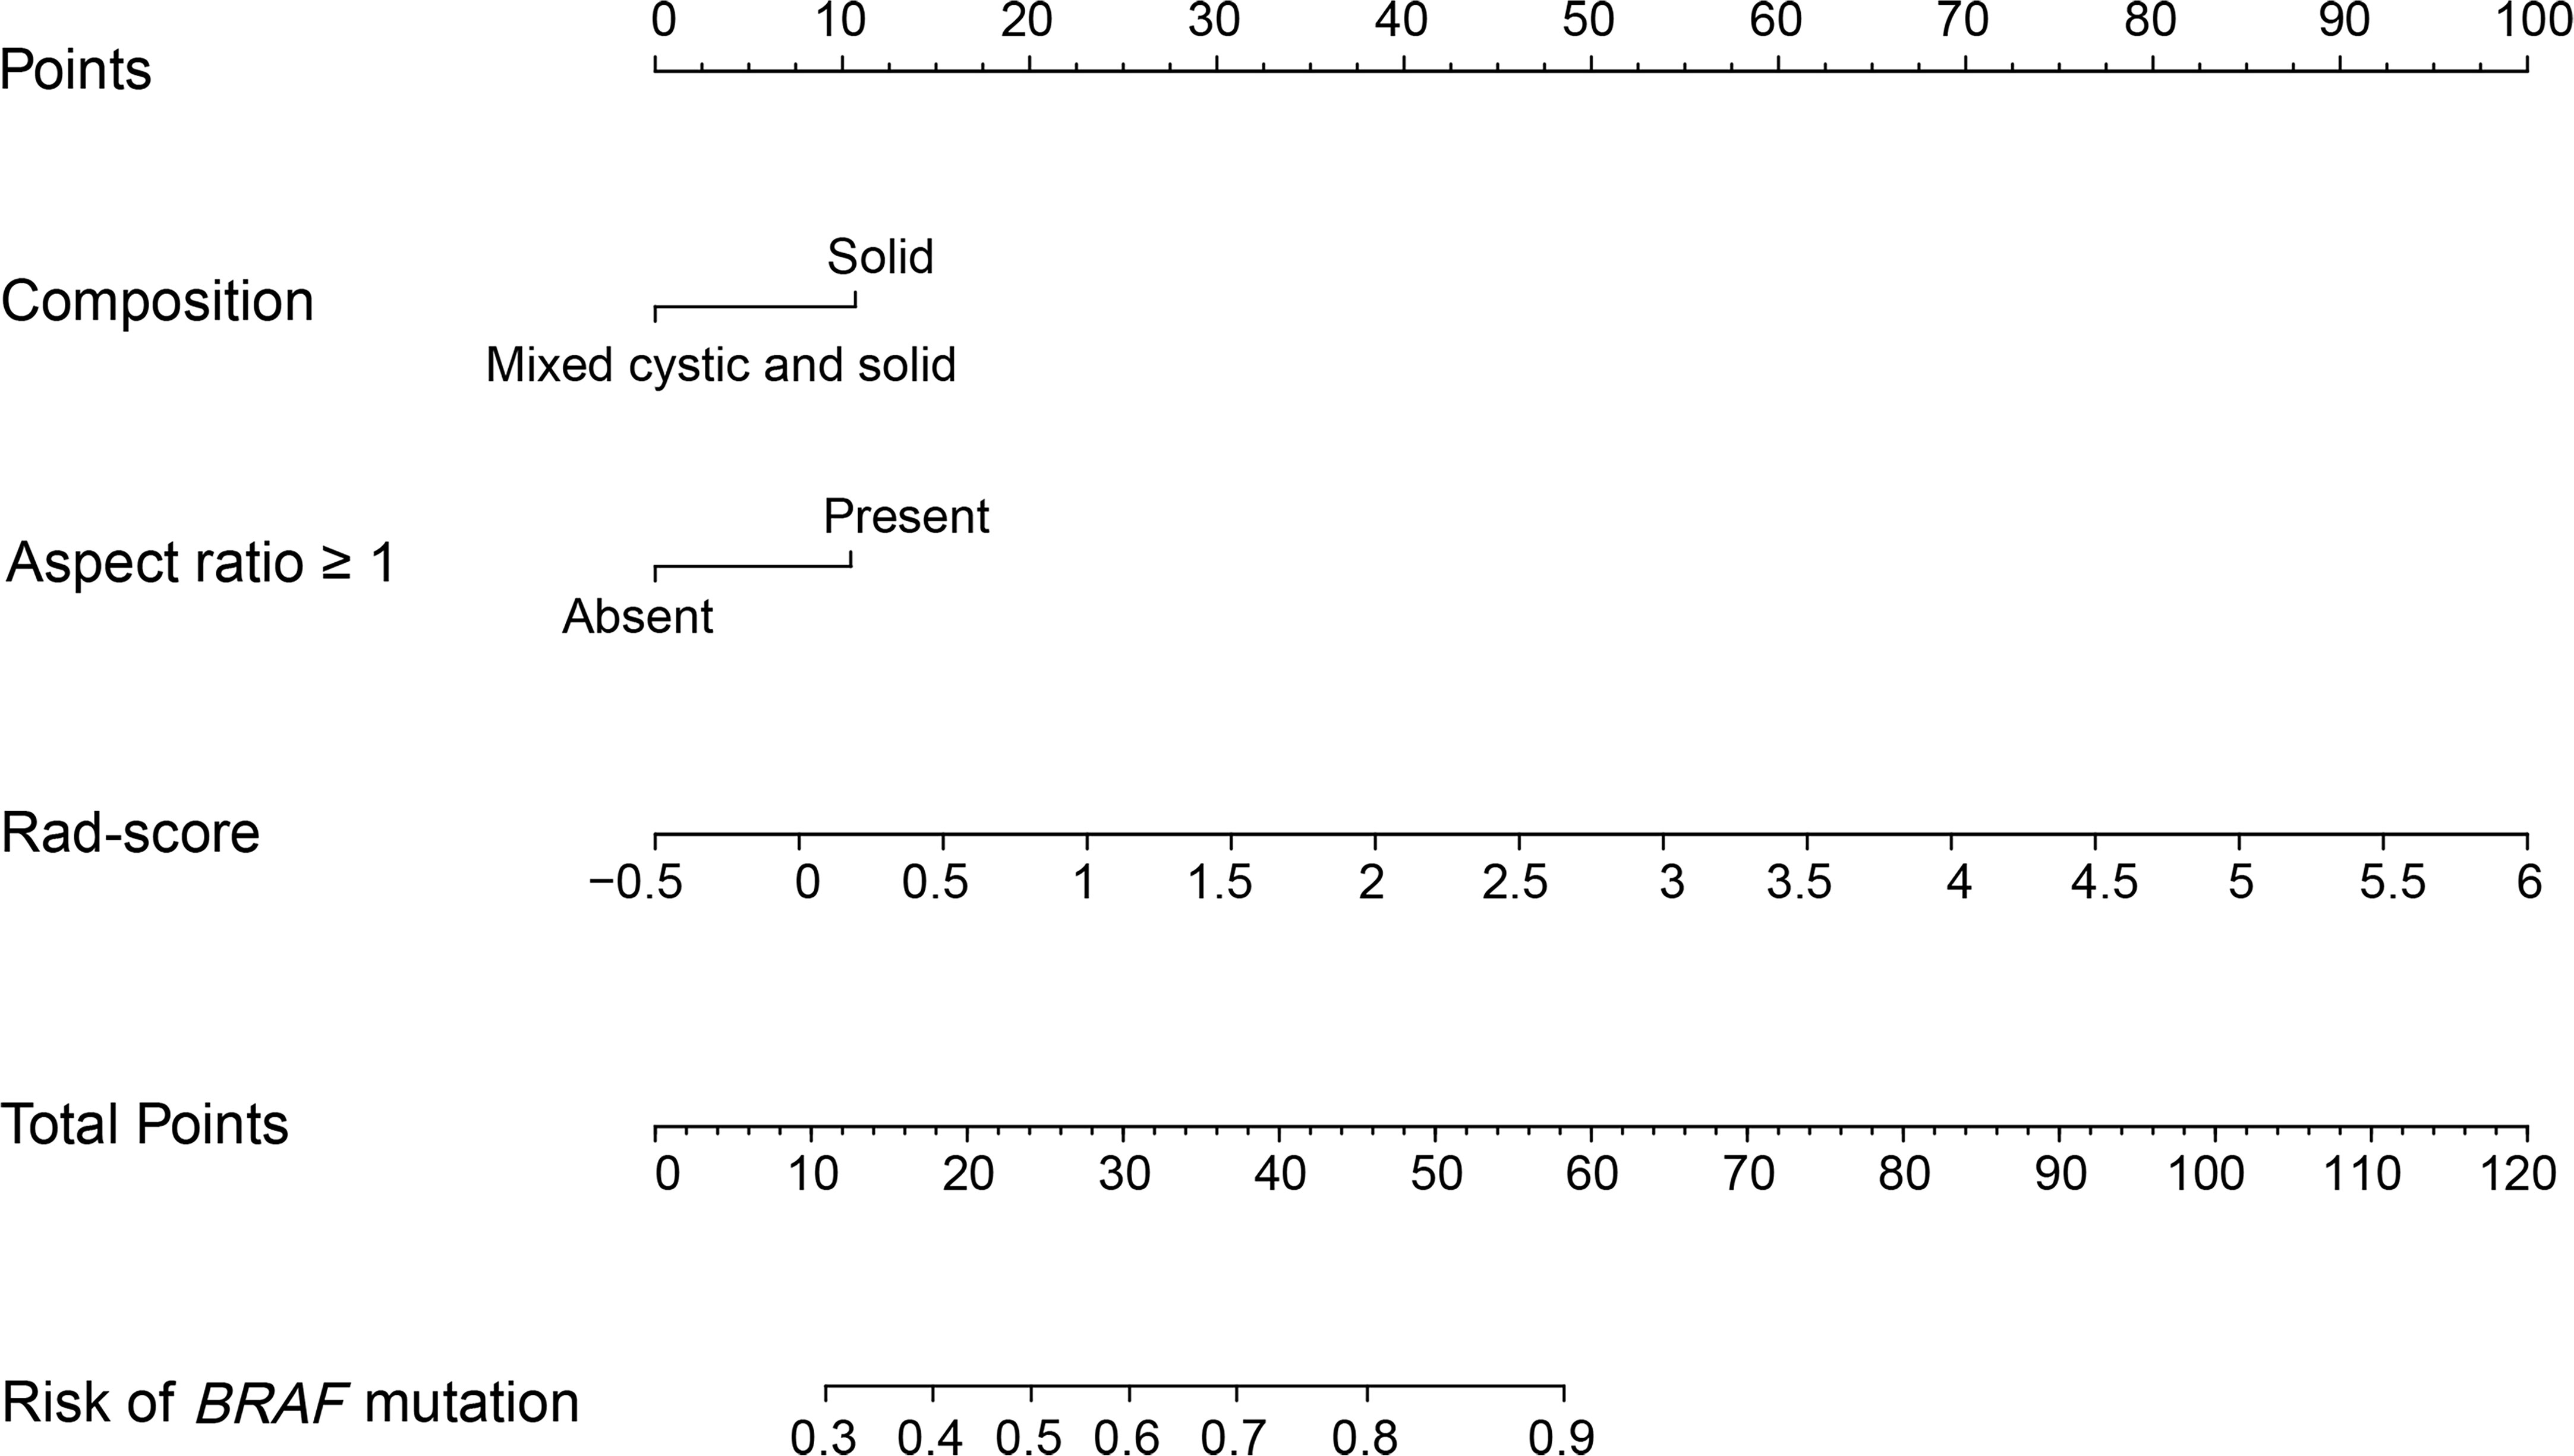
Figure 3 US radiomics nomogram to estimate the risk of BRAF mutation in PTMC. US, ultrasound; PTMC, papillary thyroid microcarcinoma; Rad-score, radiomics score.
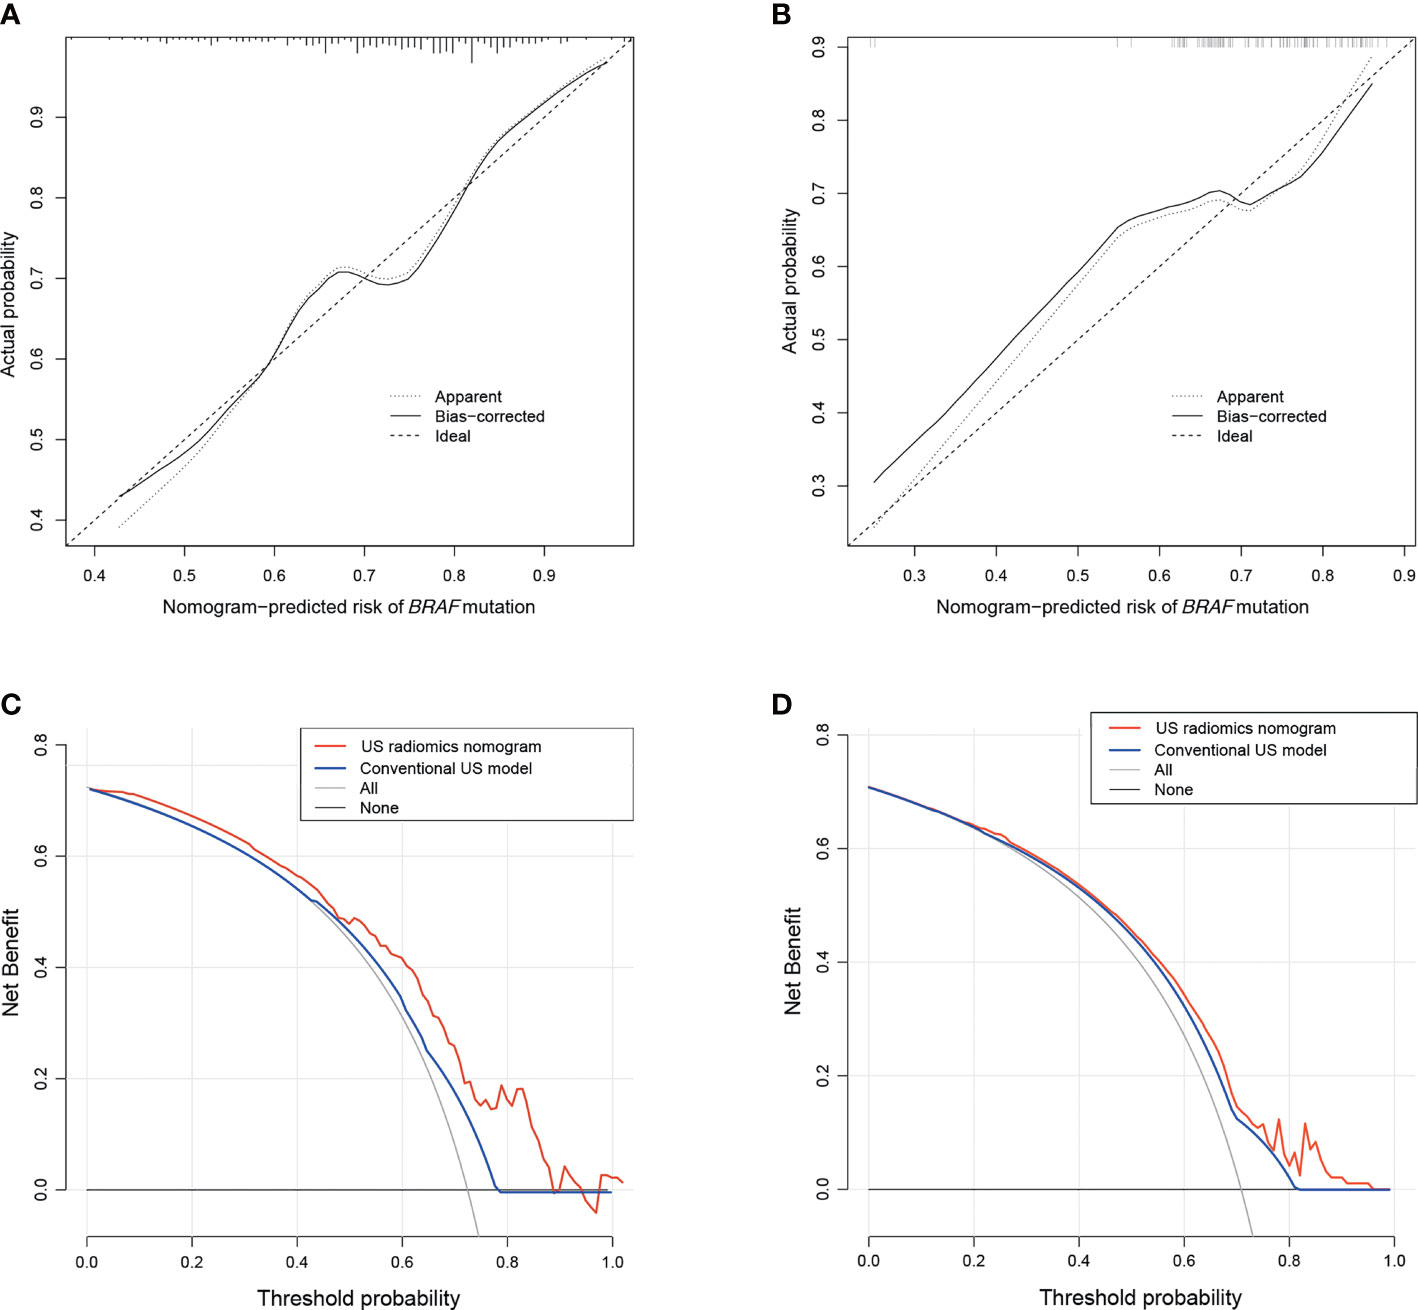
Figure 4 The calibration plots of the US radiomics nomogram for the training (A) and the validation cohorts (B). Decision curve analysis of the US radiomics nomogram and conventional US model in the training (C) and validation sets (D). US, ultrasound.
Predicting BRAF mutation based on the Nomo-score
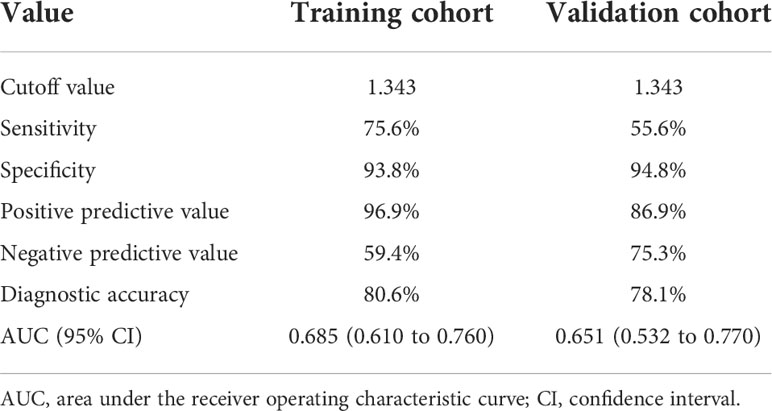
The optimal cutoff value of the Nomo-score was determined to be 1.343. The discrimination and AUC for differentiating the presence of BRAF mutation were 0.685 (95% CI: 0.610 to 0.760) in the training cohort and 0.651 (95% CI: 0.532 to 0.770) in the validation cohort, respectively. The performance of the optimal cutoff value of the Nomo-score is summarized in Table 4.
Discussion
Despite the excellent prognosis for most patients with PTMC, a small percentage of patients potentially experience a more aggressive course of the disease. Some of these patients might choose conservative surveillance rather than surgical treatment because the tumor size is small, and there are no other high-risk clinical manifestations (21). The BRAFV600E mutation has emerged as a promising diagnostic as well as a prognostic indicator of PTC since its initial discovery (6, 22). A close association of BRAFV600E mutation with extracapsular infiltration of PTMC, LN metastasis, and a subsequent higher capsular invasion rate has been reported (23, 24). In that case, preoperative determination of BRAF mutation will effectively assist to make more aggressive treatment strategies for high-risk PTMC patients. The cytological examination consisting of FNA and BRAF mutation detection was the preferred method to diagnose genotype. Nevertheless, recent guidelines do not recommend FNA and gene detection for patients with a thyroid nodule less than 10 mm (14).
The accurate preoperative identification of BRAF mutation could help plan the surgical approach and further improve the outcomes of PTMC patients. Nevertheless, it is difficult to identify BRAF mutation using non-invasive methods. Many previous studies have explored the association between US features and BRAF mutation status of PTC. Liu et al. found that BRAFV600E mutation was associated with microcalcifications and nodule size after the contrast-enhanced US in PTC (25). Another study showed that a higher ACR TI-RADS score was an independent risk factor for BRAFV600E mutation (26). The centripetal and no significant enhancement were predictive indicators for the presence of BRAF mutation (27). Concerning the characteristics of CEUS, one study demonstrated that arrival time and time to peak enhancement in CEUS were notably longer in the BRAF-positive group than in the BRAF-negative group (15). In summary, the relevant studies based on conventional US features are relatively few and all the conclusions are not consistent. However, due to the insufficiency of related studies and the inconsistent results of previous findings, the relationship between the US characteristics and BRAF mutation has not been clear. It is still difficult to predict BRAF mutation based on preoperative US features, which may be related to the high dependence on the examiners’ experience.
Radiomics, a recently emerged algorithm to extract quantitative data from image materials, has been utilized to predict the molecular characteristics of various tumors. Yang et al. found that the proposed CT-based radiomics signature was associated with KRAS/NRAS/BRAF mutations in colorectal cancer (16). A subsequent study showed that radiomics texture features could serve as potential biomarkers for determining BRAF mutation status and as predictors of 5-year prognostic outcome in patients with advanced-stage colorectal cancer (28). Concerning PTC, in two previous studies, the radiomics method has been proposed based on preoperative US images for evaluating BRAF mutation, which demonstrated the limited ability to apply a US radiomics analysis in PTC (29, 30). There are a few points to note about these two studies. Firstly, both of these studies focused on PTC patients and not only on PTMC. Some patients with a large diameter of PTC were originally indicated to undergo surgical resection, whose BRAF status did not have much clinical guiding significance. Meanwhile, the conventional US features were not included in these two studies. We believe that the qualitative US features were supposed to be included in the analysis along with quantitative radiomics parameters to improve the diagnostic yield of BRAF mutation.
This is the first study to incorporate the radiomics parameters and conventional US features to establish a novel model for predicting BRAF mutation in PTMC. The Rad-score, composition, and aspect ratio ≥1 were identified as the three independent predictors of BRAF mutation. It was indicated that PTMC patients with a higher Rad-score were more likely to have BRAF mutation. In terms of the nodules’ composition, BRAF alteration was more common in solid lesions. This may be due to the fact that, during the FNA procedure, obtaining satisfactory samples to have genetic testing is easier for solid nodules, especially for nodules less than 10 mm. We also found that PTMC with an aspect ratio ≥1 was a predictive sign of BRAF mutation. In BRAF-mutated PTC, active extracellular-regulated kinase and active AKT kinase proteins are able to stimulate multiple downstream signaling pathways, which ultimately result in increased proliferation (31). It is speculated that those changes can affect the growth pattern of the tumor, finally leading to the taller-than-wide shape. To provide an easy-to-use tool in clinical practice, we illustrated a US radiomics nomogram based on the three key factors. Our nomogram exhibited good discrimination and calibration in the training and validation sets. The AUC of the nomogram was 0.685 in the training set and achieved higher predictive efficacy than the prediction model involving the conventional US factors alone. DCA demonstrated that the US radiomics nomogram can improve patient BRAF prediction preoperatively.
Our study had several limitations. Firstly, this study was a retrospective analysis which might cause a case selection bias. A prospective well-designed study was needed for a more accurate assessment of the relation between the radiomics features and BRAF mutations. Secondly, the lack of external validation data was also a limitation of this study. Our results need to be further validated in multicenter investigations to better assess the potential clinical use of the nomogram. Finally, the AUCs of the US radiomics nomogram were relatively low. The reason might be that we only included grayscale US images in the analysis. We will add multimodal US images, including contrast-enhanced and elastography US, to extract more radiomics features in the subsequent study, aiming to improve the predictive ability of the radiomics model.
Conclusion
Our study indicates that PTMC patients with a higher Rad-score are more likely to present BRAF mutations. The nomogram which incorporated US radiomics and conventional US parameters might serve as a potential tool to predict BRAF mutation and could assist clinicians to develop individualized strategies for patients with PTMC.
Data availability statement
The raw data supporting the conclusions of this article will be made available by the authors, without undue reservation.
Ethics statement
The studies involving human participants were reviewed and approved by Institutional Review Board of China-Japan Friendship Hospital. The patients/participants provided their written informed consent to participate in this study.
Author contributions
Data curation and writing the original draft: JT. Formal analysis and methodology: SJ. Data curation and validation: JM and XX. Data project administration: HL and LW. Conceptualization, investigation, and funding acquisition: BZ. All authors contributed to the article and approved the submitted version.
Funding
This study was supported by the China-Japan Friendship Hospital Talent Introduction Project (No. 2019-RC-2) and the National Natural Science Foundation of China (No. 81971627).
Conflict of interest
The authors declare that the research was conducted in the absence of any commercial or financial relationships that could be construed as a potential conflict of interest.
The reviewer YW declared a shared affiliation, with no collaboration, with one of the authors, SJ, to the handling editor at the time of the review.
Publisher’s note
All claims expressed in this article are solely those of the authors and do not necessarily represent those of their affiliated organizations, or those of the publisher, the editors and the reviewers. Any product that may be evaluated in this article, or claim that may be made by its manufacturer, is not guaranteed or endorsed by the publisher.
Supplementary material
The Supplementary Material for this article can be found online at: https://www.frontiersin.org/articles/10.3389/fendo.2022.915135/full#supplementary-material
References
1. Miranda-Filho A, Lortet-Tieulent J, Bray F, Cao B, Franceschi S, Vaccarella S, et al. Thyroid cancer incidence trends by histology in 25 countries: a population-based study. Lancet Diabetes Endocrinol (2021) 9(4):225–34. doi: 10.1016/S2213-8587(21)00027-9
2. Seib CD, Sosa JA. Evolving understanding of the epidemiology of thyroid cancer. Endocrinol Metab Clin North Am (2019) 48(1):23–35. doi: 10.1016/j.ecl.2018.10.002
3. Pedrazzini L, Baroli A, Marzoli L, Guglielmi R, Papini E. Cancer recurrence in papillary thyroid microcarcinoma: a multivariate analysis on 231 patients with a 12-year follow-up. Minerva Endocrinol (2013) 38(3):269–79. doi: 10.1038/nutd.2013.31
4. Noone AM, Cronin KA, Altekruse SF, Howlader N, Lewis DR, Petkov VI, et al. Cancer incidence and survival trends by subtype using data from the surveillance epidemiology and end results program, 1992-2013. Cancer Epidemiol Biomarkers Prev (2017) 26(4):632–41. doi: 10.1158/1055-9965.EPI-16-0520
5. Zheng X, Wei S, Han Y, Li Y, Yu Y, Yun X, et al. Papillary microcarcinoma of the thyroid: clinical characteristics and BRAF(V600E) mutational status of 977 cases. Ann Surg Oncol (2013) 20(7):2266–73. doi: 10.1245/s10434-012-2851-z
6. Xing M, Alzahrani AS, Carson KA, Shong YK, Kim TY, Viola D, et al. Association between BRAF V600E mutation and recurrence of papillary thyroid cancer. J Clin Oncol (2015) 33(1):42–50. doi: 10.1200/JCO.2014.56.8253
7. Chen Y, Sadow PM, Suh H, Lee KE, Choi JY, Suh YJ, et al. BRAF(V600E) is correlated with recurrence of papillary thyroid microcarcinoma: A systematic review, multi-institutional primary data analysis, and meta-analysis. Thyroid (2016) 26(2):248–55. doi: 10.1089/thy.2015.0391
8. Walczyk A, Kowalska A, Kowalik A, Sygut J, Wypiórkiewicz E, Chodurska R, et al. The BRAF(V600E) mutation in papillary thyroid microcarcinoma: does the mutation have an impact on clinical outcome? Clin Endocrinol (Oxf) (2014) 80(6):899–904. doi: 10.1111/cen.12386
9. Kim KJ, Kim SG, Tan J, Shen X, Viola D, Elisei R, et al. BRAF V600E status may facilitate decision-making on active surveillance of low-risk papillary thyroid microcarcinoma. Eur J Cancer (2020) 124:161–9. doi: 10.1016/j.ejca.2019.10.017
10. Di Benedetto G, Fabozzi A, Rinaldi C, Rinaldi CR. BRAF test and cytological diagnosis with a single fine needle cytology sample. Acta Cytol (2013) 57(4):337–40. doi: 10.1159/000350618
11. Haugen BR, Alexander EK, Bible KC, Doherty GM, Mandel SJ, Nikiforov YE, et al. 2015 American thyroid association management guidelines for adult patients with thyroid nodules and differentiated thyroid cancer: The American thyroid association guidelines task force on thyroid nodules and differentiated thyroid cancer. Thyroid (2016) 26(1):1–133. doi: 10.1089/thy.2015.0020
12. Shin JH, Baek JH, Chung J, Ha EJ, Kim JH, Lee YH, et al. Ultrasonography diagnosis and imaging-based management of thyroid nodules: Revised Korean society of thyroid radiology consensus statement and recommendations. Korean J Radiol (2016) 17(3):370–95. doi: 10.3348/kjr.2016.17.3.370
13. Tessler FN, Middleton WD, Grant EG, Hoang JK, Berland LL, Teefey SA, et al. ACR thyroid imaging, reporting and data system (TI-RADS): White paper of the ACR TI-RADS committee. J Am Coll Radiol (2017) 14(5):587–95. doi: 10.1016/j.jacr.2017.01.046
14. Lee JY, Baek JH, Ha EJ, Sung JY, Shin JH, Kim JH, et al. 2020 imaging guidelines for thyroid nodules and differentiated thyroid cancer: Korean society of thyroid radiology. Korean J Radiol (2021) 22(5):840–60. doi: 10.3348/kjr.2020.0578
15. Chen L, Chen L, Liu J, Nong L, Zhang H. The association among quantitative contrast-enhanced ultrasonography features, thyroid imaging reporting and data system and BRAF V600E mutation status in patients with papillary thyroid microcarcinoma. Ultrasound Q (2019) 35(3):228–32. doi: 10.1097/RUQ.0000000000000406
16. Yang L, Dong D, Fang M, Zhu Y, Zang Y, Liu Z, et al. Can CT-based radiomics signature predict KRAS/NRAS/BRAF mutations in colorectal cancer? Eur Radiol (2018) 28(5):2058–67. doi: 10.1007/s00330-017-5146-8
17. Gevaert O, Echegaray S, Khuong A, Hoang CD, Shrager JB, Jensen KC, et al. Predictive radiogenomics modeling of EGFR mutation status in lung cancer. Sci Rep (2017) 7:41674. doi: 10.1038/srep41674
18. Frates MC, Benson CB, Doubilet PM, Cibas ES, Marqusee E. Can color Doppler sonography aid in the prediction of malignancy of thyroid nodules? J Ultrasound Med (2003) 22(2):127–31. quiz 132-124. doi: 10.7863/jum.2003.22.2.127
19. Szczypiński PM, Strzelecki M, Materka A, Klepaczko A. MaZda–a software package for image texture analysis. Comput Methods Programs BioMed (2009) 94(1):66–76. doi: 10.1016/j.cmpb.2008.08.005
20. Sauerbrei W, Royston P, Binder H. Selection of important variables and determination of functional form for continuous predictors in multivariable model building. Stat Med (2007) 26(30):5512–28. doi: 10.1002/sim.3148
21. Oh HS, Ha J, Kim HI, Kim TH, Kim WG, Lim DJ, et al. Active surveillance of low-risk papillary thyroid microcarcinoma: A multi-center cohort study in Korea. Thyroid (2018) 28(12):1587–94. doi: 10.1089/thy.2018.0263
22. Xing M, Alzahrani AS, Carson KA, Viola D, Elisei R, Bendlova B, et al. Association between BRAF V600E mutation and mortality in patients with papillary thyroid cancer. Jama (2013) 309(14):1493–501. doi: 10.1001/jama.2013.3190
23. Li F, Chen G, Sheng C, Gusdon AM, Huang Y, Lv Z, et al. BRAFV600E mutation in papillary thyroid microcarcinoma: a meta-analysis. Endocr Relat Cancer (2015) 22(2):159–68. doi: 10.1530/ERC-14-0531
24. Guo L, Ma YQ, Yao Y, Wu M, Deng ZH, Zhu FW, et al. Role of ultrasonographic features and quantified BRAFV600E mutation in lymph node metastasis in Chinese patients with papillary thyroid carcinoma. Sci Rep (2019) 9(1):75. doi: 10.1038/s41598-018-36171-z
25. Liu Y, He L, Yin G, Cheng L, Zeng B, Cheng J, et al. Association analysis and the clinical significance of BRAF gene mutations and ultrasound features in papillary thyroid carcinoma. Oncol Lett (2019) 18(3):2995–3002. doi: 10.3892/ol.2019.10641
26. Shangguan R, Hu YP, Huang J, Yang SJ, Ye L, Lin RX, et al. Association between BRAF(V600E) mutation and the American college of radiology thyroid imaging, reporting and data system in solitary papillary thyroid carcinoma. Acad Radiol (2019) 26(2):154–60. doi: 10.1016/j.acra.2018.05.010
27. Lin ZM, Yan CX, Song Y, Hong YR, Wen Q, Xu YY, et al. The features of contrast enhanced ultrasound and BRAF V600E in papillary thyroid carcinoma. J Thorac Dis (2019) 11(12):5071–8. doi: 10.21037/jtd.2019.11.78
28. Negreros-Osuna AA, Parakh A, Corcoran RB, Pourvaziri A, Kambadakone A, Ryan DP, et al. Radiomics texture features in advanced colorectal cancer: Correlation with BRAF mutation and 5-year overall survival. Radiol Imaging Cancer (2020) 2(5):e190084. doi: 10.1148/rycan.2020190084
29. Yoon JH, Han K, Lee E, Lee J, Kim EK, Moon HJ, et al. Radiomics in predicting mutation status for thyroid cancer: A preliminary study using radiomics features for predicting BRAFV600E mutations in papillary thyroid carcinoma. PloS One (2020) 15(2):e0228968. doi: 10.1371/journal.pone.0228968
30. Kwon MR, Shin JH, Park H, Cho H, Hahn SY, Park KW. Radiomics study of thyroid ultrasound for predicting BRAF mutation in papillary thyroid carcinoma: Preliminary results. AJNR Am J Neuroradiol (2020) 41(4):700–5. doi: 10.3174/ajnr.A6505
Keywords: Nomogram, ultrasound (US), radiomics, BRAF mutation, papillary thyroid microcarcinoma (PTMC)
Citation: Tang J, Jiang S, Ma J, Xi X, Li H, Wang L and Zhang B (2022) Nomogram based on radiomics analysis of ultrasound images can improve preoperative BRAF mutation diagnosis for papillary thyroid microcarcinoma. Front. Endocrinol. 13:915135. doi: 10.3389/fendo.2022.915135
Received: 07 April 2022; Accepted: 01 August 2022;
Published: 19 August 2022.
Edited by:
Chiara Martinelli, Politecnico di Milano, ItalyReviewed by:
Tao Zhang, Sichuan University, ChinaYukun Luo, People’s Liberation Army General Hospital, China
Ping Zhou, Third Xiangya Hospital, Central South University, China
Yong Wang, National Cancer Center, Cancer Hospital, Chinese Academy of Medical Sciences and Peking Union Medical College, China
Copyright © 2022 Tang, Jiang, Ma, Xi, Li, Wang and Zhang. This is an open-access article distributed under the terms of the Creative Commons Attribution License (CC BY). The use, distribution or reproduction in other forums is permitted, provided the original author(s) and the copyright owner(s) are credited and that the original publication in this journal is cited, in accordance with accepted academic practice. No use, distribution or reproduction is permitted which does not comply with these terms.
*Correspondence: Bo Zhang, thyroidus@163.com
 Jiajia Tang
 Shitao Jiang
 Jiaojiao Ma
 Xuehua Xi
 Huilin Li
 Liangkai Wang
 Bo Zhang