 Rafiou Agoro1
 Intawat Nookaew2
 Megan L. Noonan1
 Yamil G. Marambio1
 Sheng Liu1
 Wennan Chang1,3Hongyu Gao1,4Lainey M. Hibbard1Corinne E. Metzger5Daniel Horan5
 William R. Thompson5
 Xiaoling Xuei1
 Yunlong Liu1,4
 Chi Zhang1,3
 Alexander G. Robling5
 Lynda F. Bonewald5,6
 Jun Wan1Kenneth E. White1,7*
- 1Department of Medical and Molecular Genetics, Indiana University School of Medicine, Indianapolis, IN, United States
- 2Department of Biomedical Informatics, University of Arkansas for Medical Sciences, Little Rock, United States
- 3Department of Electrical and Computer Engineering, Purdue University, Indianapolis, IN, United States
- 4Center for Medical Genomics, Indiana University School of Medicine, Indianapolis, IN, United States
- 5Department of Anatomy, Cell Biology and Physiology, Indiana University School of Medicine, Indianapolis, IN, United States
- 6Indiana Center for Musculoskeletal Health, Indiana University, Indianapolis, IN, United States
- 7Department of Medicine/Nephrology, Indiana University School of Medicine, Indianapolis, IN, United States
Introduction: Due to a lack of spatial-temporal resolution at the single cell level, the etiologies of the bone dysfunction caused by diseases such as normal aging, osteoporosis, and the metabolic bone disease associated with chronic kidney disease (CKD) remain largely unknown.
Methods: To this end, flow cytometry and scRNAseq were performed on long bone cells from Sost-cre/Ai9+ mice, and pure osteolineage transcriptomes were identified, including novel osteocyte-specific gene sets.
Results: Clustering analysis isolated osteoblast precursors that expressed Tnc, Mmp13, and Spp1, and a mature osteoblast population defined by Smpd3, Col1a1, and Col11a1. Osteocytes were demarcated by Cd109, Ptprz1, Ramp1, Bambi, Adamts14, Spns2, Bmp2, WasI, and Phex. We validated our in vivo scRNAseq using integrative in vitro promoter occupancy via ATACseq coupled with transcriptomic analyses of a conditional, temporally differentiated MSC cell line. Further, trajectory analyses predicted osteoblast-to-osteocyte transitions via defined pathways associated with a distinct metabolic shift as determined by single-cell flux estimation analysis (scFEA). Using the adenine mouse model of CKD, at a time point prior to major skeletal alterations, we found that gene expression within all stages of the osteolineage was disturbed.
Conclusion: In sum, distinct populations of osteoblasts/osteocytes were defined at the single cell level. Using this roadmap of gene assembly, we demonstrated unrealized molecular defects across multiple bone cell populations in a mouse model of CKD, and our collective results suggest a potentially earlier and more broad bone pathology in this disease than previously recognized.
Introduction
Osteocytes are derived from osteoblasts through a dynamic, spatio-temporal process regulated within cortical bone (1). The exposure of these cells to the bloodstream through dendrites allows osteocytes to play key endocrine functions, including sending and receiving signals to vascularized organs such as the kidney, among others. A complete identification of the osteocyte and osteocyte precursor transcriptomes is a critical need towards understanding the molecular pathways of osteolineage differentiation, as well as to specify the contributions of osteoblast/osteocyte genes to musculoskeletal disease.
Common bone pathologies are associated with osteocyte dysfunction, including aging (2), osteoporosis (3), and chronic kidney disease (CKD) (4). CKD is a worldwide public health problem with an estimated 5-10 million lives lost each year (5). Endocrine changes due to loss of renal function lead to increased bone production of fibroblast growth factor-23 (FGF23), which acts on the kidney to reduce circulating 1,25(OH)2 vitamin D (1,25D) concentrations. These actions in turn cause hypocalcemia-mediated compensatory elevations in PTH and subsequent bone loss due to increased osteoclastic activity (6). Indeed, fracture is the most important clinical outcome of the CKD bone disorder, with an estimation that CKD patient hip and spine fracture rates range between 2- to 4- fold greater than the general population (7), markedly increasing patient morbidity and mortality (8).
Several studies have provided initial insight into novel bone cell bioactivity using the analysis of bulk sequencing of cortical bone (9) and single cell analyses of combined cortical bone and calvaria cells (10). These approaches have led to an increased understanding of transitional states of the skeletal cell populations in diseases typically associated with progressive loss of bone mass, including osteoporosis and aging (11). Additionally, the previous studies identified novel osteoblast and osteocyte genes, providing key insight into new roles of these loci for a potentially broader set of bone diseases. However, the full spectrum of osteoblast and osteocyte genes in bone cell populations specifically affected during CKD remain understudied, hampering the ability to target cell lineages towards improved bone health and patient outcomes. Thus, the nature of osteolineage cells affected during CKD, as well as the molecular mechanisms and spatial transcriptional reprogramming that contribute to bone loss remain to be determined.
Herein, we developed a successful workflow to enrich cortical bone osteoblast and osteocyte cell populations using flow cytometry followed by single cell RNAseq (scRNAseq). Our transcriptomic data detected two osteoblast populations, as well as novel osteocyte-specific genes, and also revealed cell-specific metabolic profiles. This approach identified previously unrecognized transcriptional reprogramming prior to major bone ultrastructural changes in a mouse model of CKD. Our collective results suggest that the endocrine bone disease arising from CKD affects multiple cell populations in parallel and thus emerging treatments for CKD may be more effective by targeting a broader set of cell lineages.
Methods
Sost-CreERT2-Cre+/Ai9 mice
Animal protocols and studies were approved by the Indiana University Institutional Animal Care Committee and conform to NIH guidelines (12). Male and female Sost-CreERT2-Cre+ mice were crossed with the ‘Ai9’ mouse in which the recombination event causes activation of tdTomato fluorescent protein to generate Sost-CreERT2 Cre+/Ai9 (13). Both males and females were included in the scRNAseq study. For the sequencing experiments, with the goal to isolate cells in their native state without confounding effects on bone, due to the presence of basal Cre activation in Sost-CreERT2-Cre+ mice (13), six Sost-CreERT2/Ai9 mice at eight weeks of age were directly sacrificed without tamoxifen injection, and long bones (femurs, tibiae, and humeri) were collected and pooled, followed by a sequential bone digestion (see below).
Preparation of mouse long bones for osteoblast/osteocyte isolation
Isolated long bones were placed in 100 mm petri dishes containing αMEM with 10% penicillin and streptomycin. Any remaining muscle and connective tissue from the bones were removed and the periosteum was scraped away using a scalpel. The bones were then washed, epiphyses removed, and the marrow flushed using a 27G syringe. The flushed bones were then cut in half lengthwise and into 1 to 2 mm lengths using a scalpel and briefly washed with Hank’s Balanced Salt Solution (HBSS; Hyclone).
Bone digestion and isolation of osteoblasts and osteocytes
The long bone pieces were digested as previously described (14). In brief, bones were alternately immersed in warmed collagenase type IA (2 mg/mL; Sigma) and EDTA (5 mM), then incubated at 37°C for 25 min on a rotating shaker (~200 rpm). A total of 9 digestions was performed. The extracted bone cells were then centrifuged at 600 rpm for 15 minutes at 4°C, washed 3 times in αMEM supplemented with 10% FBS and the pellet resuspended in αMEM supplemented with 10% FBS. TdTomato+ cells were then sorted using Fluorescence-activated cell sorting (FACS) Aria Fusion (BD Biosciences) with standard Phycoerythrin (PE) Texas Red gating. After cell isolation, cell viability was assessed using Trypan Blue staining; more than 90% of sorted cells were viable and these cells were immediately processed for scRNAseq.
CKD mouse models
Male and female C57BL/6J mice were purchased from the Jackson Laboratory and housed at least one week in the Indiana University School of Medicine Laboratory Animal Resource Center (LARC) for acclimatization prior to the start of experiments, according to previous protocols (15). The adenine diet model was used to induce CKD in male and female mice. At 8 weeks of age, mice were fed a control casein-based diet (0.9% phosphate and 0.6% calcium, TD.150303 Envigo) for 2 weeks, or CKD-causing diet with 0.2% added adenine (TD.160020; Envigo) for 2 or 4 weeks. Diets and water were provided ad libitum.
Osteocyte and osteoblast cell counting in cortical and trabecular bone
Femurs from mice fed with the casein control or adenine-CKD diets for 2 or 4 weeks were fixed in 4% paraformaldehyde for 24 hours. The samples were then decalcified in a solution that contains 1.2% neutral buffered formalin and 10% EDTA for 12-days at 4°C on a rocker platform. The decalcified solution was changed three times over the decalcification period. The femurs were then washed in water and stored in 70% ethanol at 4°C. For histological analysis, the femurs were dehydrated overnight and embedded in paraffin. Sections of 5 µm of each sample were stained with hematoxylin eosin (H&E) for light microscopy. For counting osteocytes in cortical bone, a blinded experiment was conducted and an area of cortical bone of approximately ~550 mm2 in the midshaft was analyzed for cell numbers followed with a normalization to bone surface. Analyses were performed using BIOQUANT imaging (BIOQUANT Image Analysis, Nashville, TN). Trabecular osteocytes were analyzed and normalized to trabecular bone area in the distal femur excluding endocortical surfaces and primary spongiosa. Osteoblast numbers were normalized to trabecular bone surface. Three mice per condition were used for these experiments.
Micro-computed tomography (μCT)
Paraformaldehyde fixed femora from CKD and healthy mice were scanned, reconstructed, and analyzed as previously described (16). Femurs were scanned at 10‐μm resolution, 55‐kV peak tube potential and 8W. Standard output parameters related to cortical bone mass, geometry, and architecture were measured as reported (17).
Single cell library preparation
We applied a single cell master mix with lysis buffer and reverse transcription reagents according to the Chromium Single Cell 3’ Reagent Kits V3 User Guide, CG000183 Rev A (10X Genomics, Inc.). This was followed with cDNA synthesis and library preparation according to standard 10X Genomics methods; all libraries were sequenced on an Illumina NovaSeq6000 platform in paired-end mode (28bp + 91bp).
Data processing/bioinformatic analyses
The 10x Genomics Cellranger (v. 6.0.0) pipeline was used to demultiplex raw base call files to FASTQ files and reads were aligned to the mm10 murine genome using STAR (18). The Cellranger computational output was then analyzed in R (v 4.0.2) using the Seurat package v. 4.1.0 4 (19). Seurat objects were created, and the top principal components were used to perform unsupervised clustering analysis and visualized using UMAP dimensionality reduction. Using the Seurat package, annotation and grouping of clusters by cell type was performed manually by inspection of differentially expressed genes using the MAST method (20) for each cluster, based on canonical marker genes in the literature. The selected markers were visualized on UMAP coordinates as gene expression density using the R package Nebulosa (21). To perform the pseudotime analysis on the integrated Seurat object, cells were divided into individual gene expression data files organized by previously defined cell types. R package Monocle v3 (22) was used for dataset analysis and outputs were obtained detailing the pseudotime cell distributions for each cell type. Positional information for the Monocle plot was used to subset and color cells for downstream analyses (22). Ingenuity Pathway Analysis (IPA) was used to predict the statistically significant canonical pathways regulated in osteolineage cells (pre-osteoblasts, osteoblasts and osteocytes).
scFEA
The python package v1.2 of single cell flux estimation analysis (scFEA) was applied to estimate cell-wise metabolic flux rate against the whole human metabolic map using the generated mouse scRNAseq data (23). Default parameters were utilized and statistical significance of the differences in metabolic flux between cell groups was assessed by Mann-Whitney test.
Culture of the MPC cell line
A conditionally immortalized mesenchymal stem cell line, Murine progenitor cells clone 2 (MPC2) (24), was cultured in αMEM (Invitrogen, Thermo-Fisher Scientific) supplemented with 10% fetal bovine serum (FBS; Hyclone), 25 mM L-glutamine, and 25 mM penicillin-streptomycin (Sigma-Aldrich, St. Louis, MO, USA) at 33°C and 5% CO2 to proliferate. Cells were plated at a density of 1.0x10⁵ cells per well in 6-well plates and incubated overnight before being transferred to a 37°C incubator for osteogenic differentiation by culturing in maintenance media supplemented with 4 mM beta-glycerophosphate and 50 μg/mL ascorbic acid. Cells were differentiated for 0-4 weeks with this ‘osteogenic media’, which was changed every 2-3 days.
Bulk mRNA sequencing
MPC2 cells were differentiated for 3 weeks in osteogenic media or plated in an undifferentiated state at 33°C (see cell culture methods above). Total RNA was extracted and evaluated for its quantity and quality using an Agilent Bioanalyzer 2100; 100 ng of total RNA was used for the cDNA libraries. Library preparation included mRNA purification/enrichment, RNA fragmentation, cDNA synthesis, ligation of index adaptors, and amplification, following the KAPA mRNA Hyper Prep Kit Technical Data Sheet, KR1352 – v4.17 (Roche Corporate). Each resulting indexed library was quantified, and its quality accessed by Qubit and Agilent Bioanalyzers; multiple libraries were pooled in equal molarity. The pooled libraries were denatured and neutralized before loading on a NovaSeq 6000 sequencer at 300 pM final concentration for 100b paired-end sequencing (Illumina, Inc.). Approximately 30-40M reads per library were generated. A Phred quality score (Q score) was used to measure the quality of sequencing. More than 90% of the sequencing reads reached Q30 (99.9% base call accuracy). The sequencing data were first assessed using FastQC (Babraham Bioinformatics, Cambridge, UK) for quality control. The sequencing reads were mapped to the mouse genome mm10 using STAR (v2.7.2a) with the following parameter: ‘–outSAMmapqUnique 60’ (18). Uniquely mapped sequencing reads were assigned to Gencode M22 gene using featureCounts (v1.6.2) (25) with the following parameters: “–p –Q 10 -O”. The genes were kept for further analysis if their read counts > 10 in at least 3 of the samples, followed by the normalization using TMM (trimmed mean of M values) method and subjected to differential expression analysis using edgeR (v3.24.3) (26). Gene Ontology and KEGG pathway functional enrichment analysis was performed on selected gene sets, e.g., genes undergoing both significant differential expressions and notable changes of open chromatin accessibilities, with the cut-off of false discovery rate (FDR) < 0.05 using DAVID (27). Canonical pathways from RNAseq data were generated through the use of IPA (QIAGEN Inc., https://www.qiagenbioinformatics.com/products/ingenuity-pathway-analysis) (28); n=3 samples per condition.
Assay for Transposase-Accessible Chromatin sequencing (ATACseq)
Cells tested in ATACseq were plated and differentiated to osteoblast/osteocyte-like cells at the same time as those for RNAseq (3 weeks, see above). After differentiation, osteoblast/osteocyte and undifferentiated MSC (control) cells were washed twice in 1X PBS, then dissociated with trypsin (Hyclone) for 5 minutes. Cells were resuspended in ice cold 1X PBS, dead cells were removed, and live cells were processed for nuclei isolation and ATAC sequencing according to published protocols (29). Briefly, cells were collected in cold PBS and cell membranes were disrupted in cold lysis buffer (10 mM Tris–HCl, pH 7.4, 10 mM NaCl, 3 mM MgCl2 and 0.1% IGEPAL CA-630). The nuclei were pelleted and resuspended in Tn5 enzyme and transposase buffer (Illumina Nextera® DNA library preparation kit, FC-121-1030). The Nextera libraries were amplified using the Nextera® PCR master mix and KAPA biosystems HiFi hotstart readymix successively. AMPure XP beads (Beckman Coulter) were used to purify the transposed DNA and the amplified PCR products. The resulting ATACseq libraries were sequenced on Illumina NovaSeq 6000 and paired-end 50 bp reads were generated. Illumina adapter sequences and low-quality base calls were trimmed off the paired-end reads with Trim Galore v0.4.3. Bowtie2 (30) was used for ATACseq read alignments on the mouse genome (mm10). Duplicated reads were removed using Picard developed by the Broad Institute https://broadinstitute.github.io/picard/ (Accessed: 2018/02/21; version 2.17.8)]. Low mapping quality reads and mitochondrial reads were discarded in further analysis. Peak calling of mapped ATACseq reads were performed by MACS2 (31) with a Bonferroni adjusted cutoff of p-value less than 0.01. Peaks called from multiple samples were merged, after removing peaks overlapping with ENCODE blacklist regions (32, 33). Reads locating within merged regions in different samples were counted by pyDNase (34). The data was filtered using at least 10 cut counts in more than one of the samples, then normalized using TMM (trimmed mean of M values) method and subjected to differential analysis using edgeR (v3.24.3) (26, 35). Motif enrichment of differential accessibility peaks with a false discovery rate cut-off of 0.05 was performed using Homer (36).
RNA isolation and qPCR
To isolate total bone RNA, one femur and one tibia per mouse were harvested, the bone marrow flushed using a 27G syringe, and the epiphyses removed, similar to the approach undertaken to prepare the bones prior to collagenase digestion for the scRNAseq studies. The remaining bones (femur and tibia) were harvested and homogenized in 1 ml of TRIzol reagent (Invitrogen) according to the manufacturer’s protocol using a Bullet Blender (Next Advance, Inc.), then further purified using the RNeasy Kit (Qiagen). Mouse β-actin was used as an internal control for RT-qPCR. The qPCR primers were purchased as pre-optimized reagents (Applied Biosystems/Life Technologies, Inc.) and the TaqMan One-Step RT-PCR kit was used to perform all reactions. PCR conditions were: 30 minutes 48°C, 10 minutes 95°C, followed by 40 cycles of 15 seconds 95°C and 1 minute 60°C. The data were collected and analyzed by a StepOne Plus system (Applied Biosystems/Life Technologies, Inc.). The expression levels of mRNAs were calculated relative to appropriate controls, and the 2-ΔΔCT method described by Livak was used to analyze the data (37). The primers used in the study were: Fgf23, Mm00445621_m1; Mmp13, Mm00439491_m1; Tnc, Mm00495662_m1; Gdpd2, Mm00469948_m1; Spp1, Mm00436767_m1; Col1a1, Mm00801666_g1; Bglap, Mm03413826_mH; Cthrc1, Mm01163611_m1; Smpd3, Mm00491359_m1; Dmp1, Mm01208363_m1; Sost, Mm04208528_m1; Pdpn, Mm01348912_g1; Phex, Mm00448119_m1; Ptprz1, Mm00478486_m1; Pdpn(E11), Mm01348912_g1; Actin, Mm02619580_g1; Aldoa, Mm00833172_g1; Adpgk, Mm00511302_m1; Pgam1, Mm02526975_g1; Acadm, Mm01323360_g1; Acp5, Mm00475698_m1; Mmp9, Mm00442991_m1; and Tnfrsf11a, Mm00437132_m1 (Thermo Fisher, Inc).
Statistical analyses
The most recent updated R software packages with robust affiliated statistics were used to analyze the scRNAseq datasets. The cutoffs used for integration of RNA-seq and ATAC-seq were: peaks within 10kb upstream of gene, differential peak cutoff FDR < 0.05, differential expression cutoff FDR < 0.05, log2FC > 1 (up-regulation) or < -1 (down-regulation). Statistical analyses of the in vivo data presented were performed by two-way ANOVA to assess the differences between the same gender in response to adenine diet and to assess the differences between genders and treatments. Significant changes were considered when at p<0.05.
Results
Mouse osteoblast/osteocyte transcriptomic profiling at single cell resolution
The osteocyte transcriptome at the single cell level derived solely from long bones remains uncharacterized. To identify cortical bone cells and enrich our cell sample preparation, we used Sclerostin (Sost)-Cre/Ai9 ‘Tomato’ reporter mice at 8 weeks of age to isolate fluorescently-labeled osteoblasts/osteocytes. Consistent with previous characterization (13), SOST-Cre/Ai9 (‘tdTomato’ reporter) mice had detectable basal Cre activation in osteocytes as evidenced by the presence of red fluorescence in mouse tail vertebrae (Figure 1A), and were thus harvested in their native state to avoid confounders due to delivery of tamoxifen. Following cortical bone digestion using collagenase/EDTA, the cells were sorted, and the Ai9/tdTomato+ fraction represented approximately 1.5% of total cells (Figure 1B). As determined by qPCR, the Ai9/tdTomato+ cells were highly enriched for osteocyte marker mRNAs Fgf23 (40-fold), Phex (102-fold), Dmp1 (172-fold), and Pdpn (12-fold), compared to the Ai9/tdTomato- population (Figure 1B).
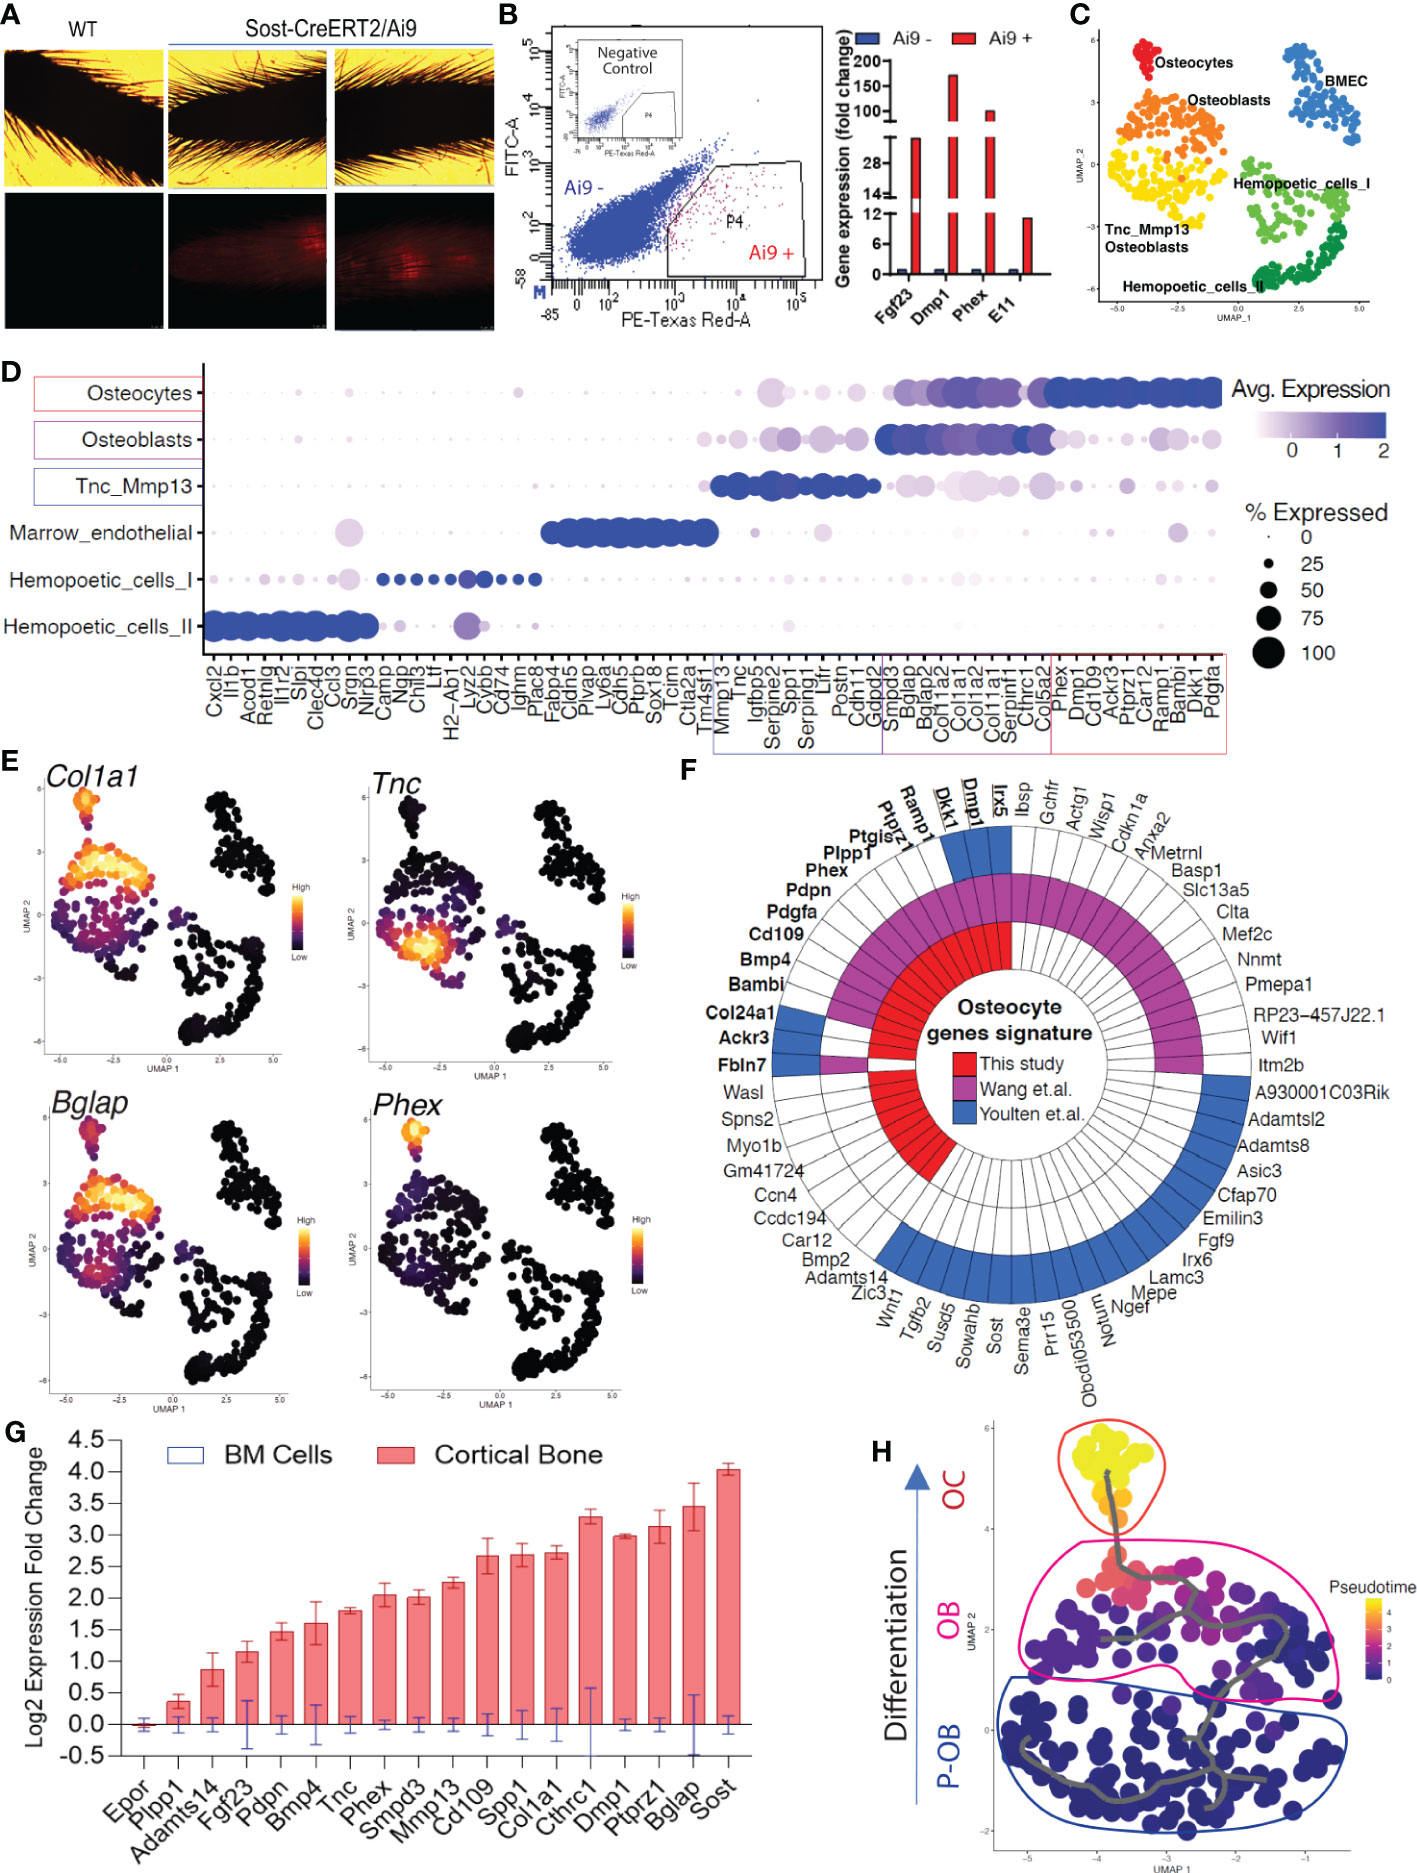
Figure 1 Single-cell transcriptomic profiling of bone cells identified osteolineage heterogeneity. (A, B). Long bones (femur, tibia, and humeri) were subjected to serial collagenase/EDTA digestions (see Methods), and cells from fractions 4-9 were collected for FACS sorting to isolate tdTomato-positive cells, followed by single-cell RNAseq library construction. Analysis by qPCR confirmed high mRNA expression of osteocyte genes Fgf23, Dmp1, Phex, and Pdpn in Ai9 positive cells versus Ai9 negative cells. (C). Bioinformatic analysis was performed to cluster the cells by UMAP. Each dot represents a single cell, and cells sharing the same color code indicate discrete populations of transcriptionally similar cells. (D). Defining cortical bone cell types. Tnc/Mmp13 osteoblast cells were distinctly marked by Tnc and Mmp13. Osteoblast cells showed high expression of Smpd3 and Bglap. Osteocytes had the highest expression of Dmp1 and Phex. (E). Expression density plots indicated cells with high transcription of Col1a1, Tnc, Bglap, and Phex. (F). The polar figure highlights the osteocyte markers isolated from our dataset (long bone cell scRNAseq), Wang et al. (long bone and calvaria cell scRNAseq (10);) and Youlten et al. (long bone bulk RNAseq (9);). (G). Canonical and non-canonical osteolineage genes were validated as being highly expressed in cortical bone when compared to the expression detected in bone marrow. (H). Pseudotime analysis revealed Tnc/Mmp13 Osteoblasts as an osteoblast precursor cell (P-OB), and shows their differentiation to osteoblasts (OB) and then osteocytes (OC).
To identify the transcriptome of the Ai9/tdTomato+ population, scRNAseq was performed on this isolated cell population. Approximately 1,200 cells were successfully recovered after sequencing with an estimation of 130,000 reads per cell and 97% valid barcodes. Further stringent bioinformatic analyses were performed to exclude low-quality cells; for downstream analysis, cells that had more than 3500 genes were excluded to reduce doublet nuclei, and less than 15% of mitochondrial genes to exclude potentially dead cells (Figure S1A). To aggregate cells based on their similarities, principal component analysis (PCA) was performed on highly variable genes and the result was used as input for clustering using the Louvain algorithm with multilevel refinement and Uniform Manifold Approximation and Projection (UMAP) for dimension reduction (Figure 1C). To identify gene specific markers in each cluster, we used the function FindMarkersAll from the MAST method algorithm. The quality of clustering was assessed by dot plot of the most significant marker genes obtained from an individual cluster (Figure 1D). The full list of markers that identified each cell type is provided in Supplementary Data 1.
The transcriptomic profiling of Ai9/tdTomato+ cortical bone cells identified a total of six cell populations, including two osteoblast clusters and one osteocyte cluster (Figures 1C, D). The sequenced cells were grouped into three partitions: hematopoietic cells that are Cd45 (Ptprc) positive, endothelial cells that highly express Cdh5, and osteolineage that express the pan mesenchymal lineage cell marker Pdgfra, which was found to be present in pre-osteoblasts, osteoblasts and osteocytes (Figures S1B–D). Marker analysis revealed that within the osteoblast population, one cell type was characterized by higher expression of Smpd3, Bglap, Col1a1, and Col11a1 mRNAs. The second, referred to as “Tnc/Mmp13 osteoblasts,” was defined by high expression of Tnc, Mmp13, Serping1 and Spp1, which was consistent with previous subpopulation analyses (10). Osteocytes were associated with a cluster showing the highest expression of Phex and Dmp1. Other genes that defined osteocytes were Cd109, Dkk1, and Ptprz1 (Figure 1D, and osteolineage markers listed in Supplementary Table 1). Our analyses also identified two distinct populations of hematopoietic cells. The first population annotated “Hematopoietic I” showed high expression of Cybb, Chil3, and Ltf whereas the “Hematopoietic II” cells were characterized by expression of Clec4d, Il1r2, and Cxcl2. Bone marrow derived endothelial cells (‘BMEC’) were also identified and distinctly defined by Cdh5, Plvap, and Ptprb gene transcripts (Figure 1D). As expected, Col1a1 was identified only in osteolineage cells (Figure 1E), underscoring the ability to identify transcripts that may be uniquely associated with ossification.
Our UMAP analysis confirmed that the Tnc/Mmp13 osteoblast population with high Tnc, Mmp13 and Spp1 expression (Figure 1E and Figures S1E, F) clustered farther from osteocytes when compared to the dimensional separation between the defined more mature osteoblasts [high Bglap expression (Figure 1E)] and osteocytes (high Phex expression (Figure 1E). These data suggest that the Tnc-Mmp13 osteoblasts likely represented a precursor osteoblast population. Importantly, we isolated 25-highly and preferentially expressed genes in osteocytes, with some overlap of genes in a proposed osteocyte transcriptome (9). The polar plot comparison of recently reported osteocyte transcriptome highlights the genes in common such as Dkk1, Dmp1, Irx5, Col24a1, Ackr3 from our dataset (scRNAseq of long bone), Wang and colleagues (scRNAseq on long bone and calvaria) (10) and Youlten and colleagues (bulk RNAseq on long bone) (9) (Figure 1F).
To further test whether the genes identified as highly expressed in osteolineage cells in our scRNAseq analyses were not derived from bone marrow cells, we compared the mRNA expression of these candidate genes in mouse cortical long bone (osteoblast/osteocyte-enriched fraction) versus bone marrow using qPCR. In this regard, Mmp13, Cthrc1, Smpd3, Ptprz1, and Cd109 were tested, and these genes were highly expressed in cortical bone suggesting that they were preferentially expressed in osteolineage cells (Figure 1G). The erythropoietin receptor (Epor) mRNA, tested as a marrow positive control, was not increased in cortical bone when compared to bone marrow expression levels, whereas defined osteocyte genes Phex, Pdpn, Dmp1, Fgf23, and Sost were all increased in cortical bone samples (Figure 1G). To determine the cellular differentiation patterns that govern the maturation of osteoblasts to osteocytes, we performed pseudotime analysis. This algorithm was first performed on the partition of cells based on the UMAP (Figure 1C) in three main compartments (p1, osteolineage; p2, hematopoietic cells; and p3, marrow endothelial cells) as indicated in Figure S1G. After the initial analyses, Monocle3 simultaneously performed pseudotime analysis over the individual partitions. Trajectory analyses from the partition p1, an osteogenic lineage (Figure 1H), hematopoietic cells (Figure S1H), and endothelial cells (Figure S1I) were next generated. Interestingly, a global cellular interaction pattern was conserved with almost the same UMAP projection as for all cell populations (as in Figure 1C). These analyses confirmed that the osteocyte cluster of cells identified from our dataset derived from the osteoblast subset, with the Tnc/Mmp13 osteoblast as a likely precursor population (Figure 1H).
scRNAseq identifies pathways involved in the osteoblast to osteocyte transition
To identify the molecular pathways involved in the transition from osteoblasts to osteocytes at single cell resolution, we analyzed differentially expressed osteoblast/osteocyte genes using Ingenuity Pathway Analysis (IPA). Further, a comparison analysis was performed to identify signaling pathways in osteoblasts versus osteocytes. In this regard, we found an enrichment of “GP6 Signaling”, a major signaling receptor for collagen in osteoblasts, which was almost completely shut down in osteocytes (Figure 2A). In contrast, the “Axonal guidance”, the “Differentiation via BMP receptors”, “TGFβ signaling” and the “Iron homeostasis signaling” pathways that were not highly enriched in osteoblasts were significantly increased in osteocytes (Figure 2A). Consistent with osteocyte morphology, among the genes predicted to drive “Axonal guidance” were Adamts14, Bmp2, Bmp4, and Wasl. Furthermore, IPA analysis predicted EGFR among the top upstream regulators of osteoblastic pathways whereas FGF2 was predicted to be a primary upstream regulator associated with the osteocyte maturation pathway (Figure S2A). Additionally, our in-silico analysis identified an enriched cell activation in osteoblasts, associated with genes such as Col11a1, Col11a2, and Col1a1 which were significantly attenuated in osteocytes (Figure 2A). Overall, these data support that osteoblasts and osteocytes can be defined by unique pathways associated with their individual homeostatic functions.
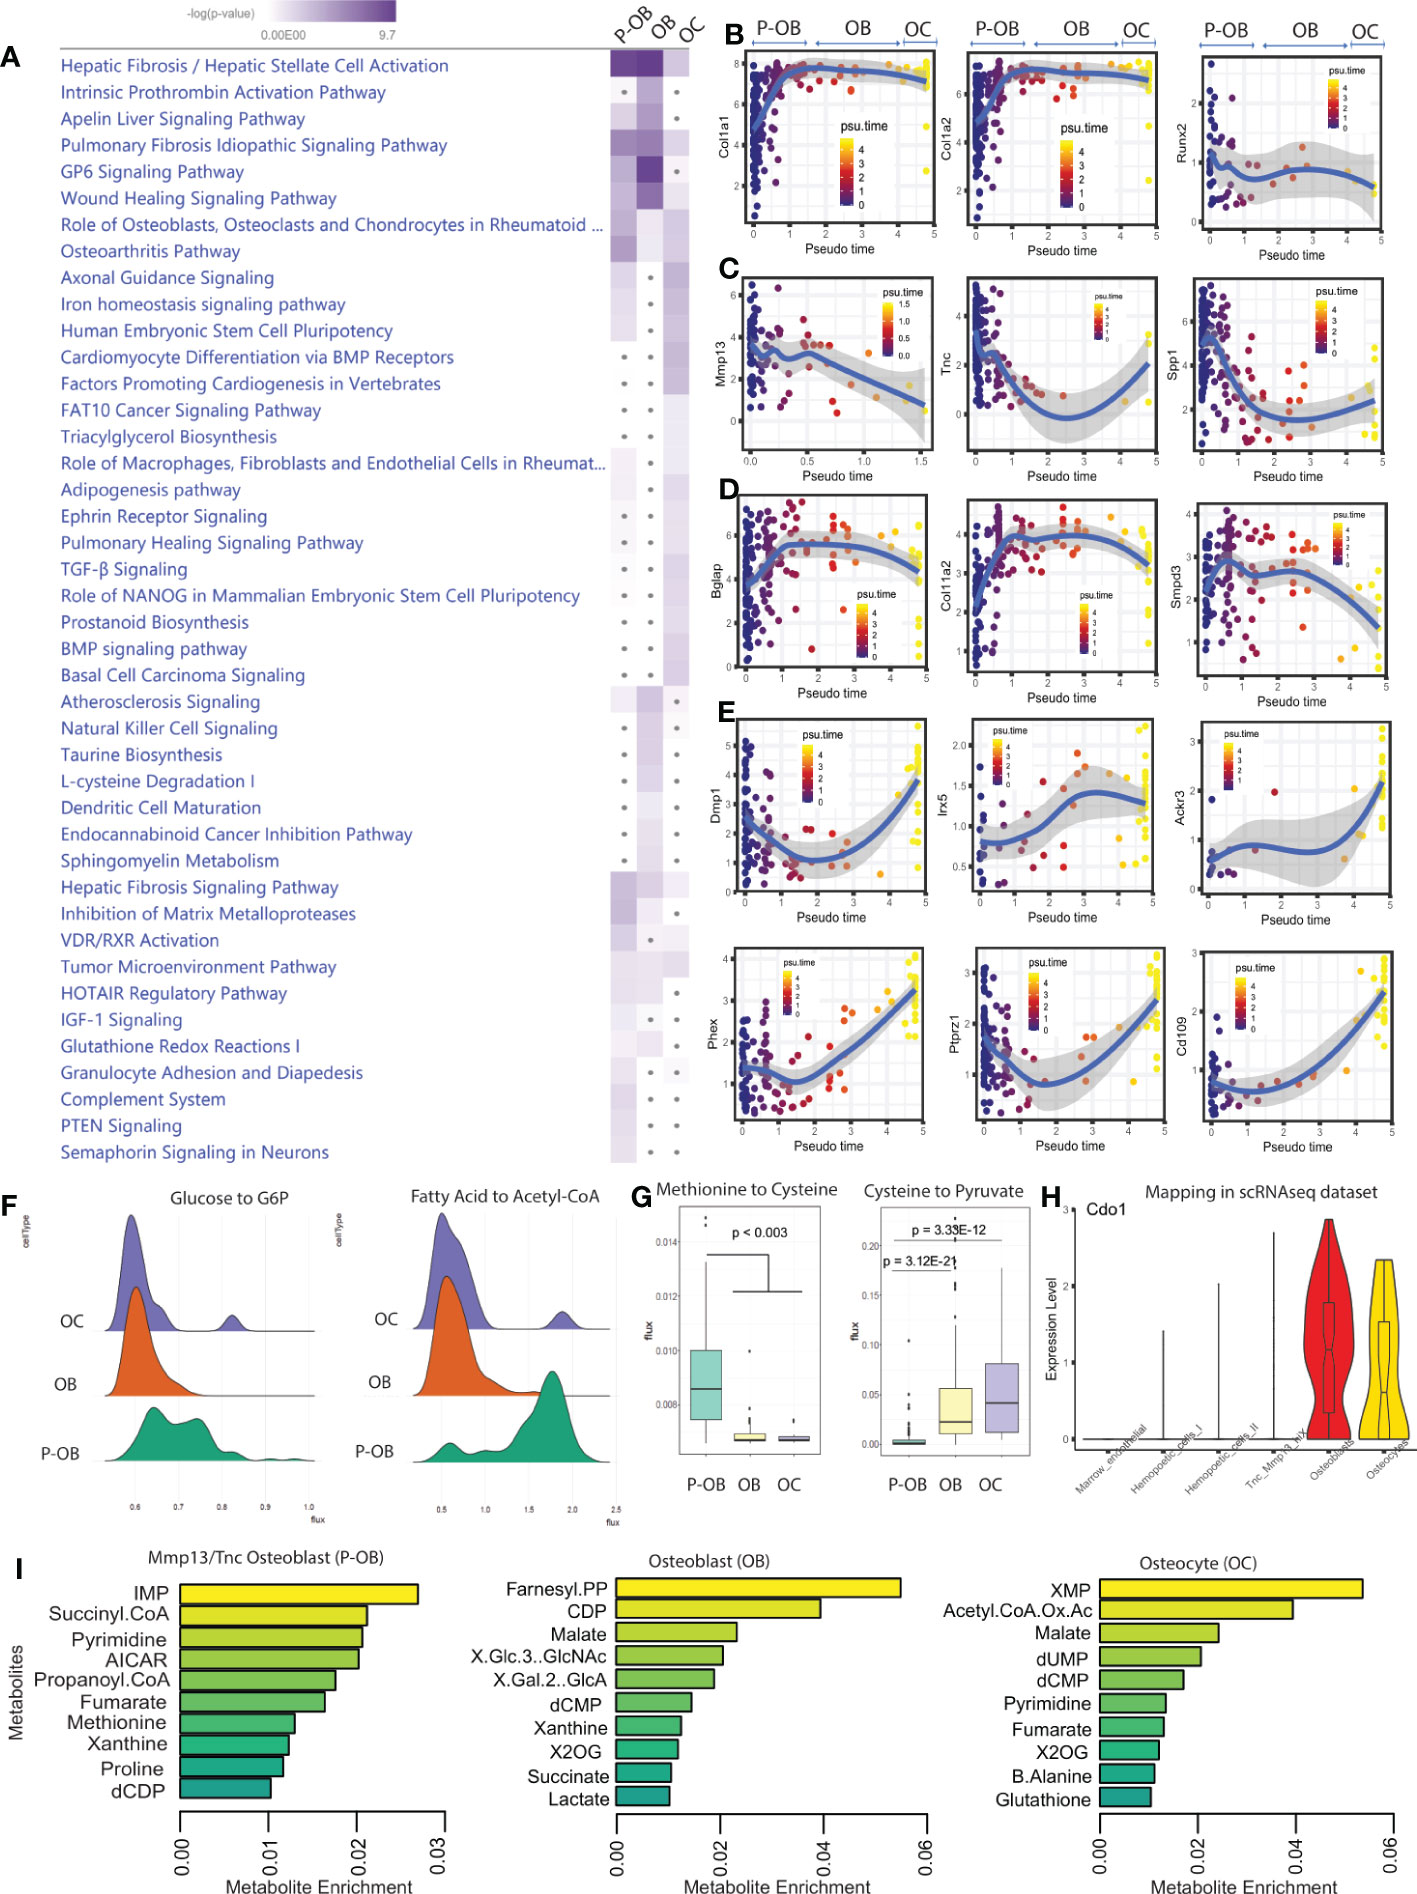
Figure 2 Differential signaling pathways in osteoblasts versus osteocytes. (A). Ingenuity Pathway Analysis (IPA) software was used to predict the statistically significant canonical pathways upregulated in Tnc/Mmp13 osteoblasts (P-OB), osteoblasts (OB) and osteocytes (OC) from the scRNAseq data based upon a calculated probability score of ≥2 and a p-value of <0.05. Further, a comparative analysis between osteolineage cells was performed to generate the heatmap. The increase of blue intensity reflects the more significant pathways within cell types. The gray dots indicate non-significant pathways. (B–E). Monocle analysis shows pseudotime trajectory mapping of osteolineage gene sets Col1a1, Col1a2, Runx2; pre-osteoblast gene sets Mmp13, Tnc, Spp1; osteoblast gene sets Bglap, Col11a2, Smpd3; and osteocyte gene sets Dmp1, Irx5, Ackr3, Phex, Ptprz1, and Cd109. (F). The computational method scFEA was used to infer cell-wise fluxome from the scRNAseq data to predict the metabolic profiling as well as the differential metabolite conversion rate in cells that correspond to a metabolic flux value. Ridgeline plots indicate the distribution values of metabolic flux in Tnc/Mmp13 osteoblasts (P-OB), osteoblasts (OB), and osteocytes (OC). Each ridgeline represents the flux between two metabolites, shown on the x-axis, for different osteolineage cells, shown on the y-axis. (G). Violin plot displaying Cdo1 expression in scRNAseq dataset. (I). The boxplots indicate the predictive value of the conversion of methionine to cysteine and to pyruvate in P-OB, OB, and OC. (H). The bar plots show the top 10 different metabolites enriched in P-OB, OB, and OC.
To predict the transcriptional profiles of osteocyte genes across the osteolineage, we used pseudotime analysis to track the computational-derived kinetics of gene expression during differentiation. We found that “pan-osteolineage” markers Col1a1, Col1a2 and Runx2 showed relatively stable expression during osteoblast to osteocyte differentiation (Figure 2B). In contrast, Mmp13, Tnc, and Spp1 pseudotemporal progression were predicted to decrease during differentiation from Tnc/Mmp13 osteoblasts to osteocytes (Figure 2C). Further, Bglap, Col11a2, and Smpd3 expression increased from the Tnc/Mmp13 precursor osteoblasts to osteoblasts, but decreased when the osteoblast population transitioned to osteocytes (Figure 2D). In osteocytes, the kinetic profiling of Dmp1, Irx5, Ackr3, Phex, Ptprz1, and Cd109 showed progressive positive regulation during differentiation (Figure 2E, Figure S2B, and Supplementary Table 1). These data confirmed the dynamic differentiation of canonical genes during the transcriptional reprogramming required for osteoblast transition to osteocytes, as well as identified new genes associated with the cortical bone osteolineage.
To distinguish the metabolic heterogeneity between osteoblasts and osteocytes, we applied the recently developed computational method single-cell flux estimation analysis (scFEA) (23) that uses a systematically reconstructed human metabolic map to infer the cell-wise cascade from the transcriptome to metabolome. This approach applies multilayer neural networks to capitulate the nonlinear dependency between enzymatic gene expression and reaction rate fluxome from scRNAseq datasets. By reconducting the cell clustering analysis using the original UMAP labeling (Figure 1C), scFEA identified high metabolic reactions including glycolytic, TCA, and fatty acid metabolic reactions in Tnc/Mmp13 osteoblasts (Figure S2C-S2E) consistent with an overall increased cell activation (Figure 2A). The most prominent change of metabolic route predicted was the conversion of Fatty acid to Acetyl co-A during the transition from pre-osteoblasts to osteoblasts/osteocytes with two distinct cell populations (Figure 2F). The gene Acadm (Acyl-CoA Dehydrogenase Medium Chain) was the top predicted gene to drive this process. Whereas the conversion of serine to cysteine decreased with osteoblast differentiation, the transformation of cysteine to pyruvate increased when Tnc/Mmp13 osteoblasts transitioned to osteoblasts/osteocytes, a potential alternative metabolic route to supply cells with pyruvate (Figure 2G). This cysteine metabolism change predicted by scFEA correlated with differential regulation of Cdo1 (Cysteine Dioxygenase Type 1), a gene that was highly expressed in osteoblasts (Figure 2H). Based on the scRNAseq dataset, the top predicted metabolites in osteolineage cells were the inosine monophosphate (IMP), succinyl coenzyme A, and pyrimidine in pre-osteoblasts; the farnesyl pyrophosphate (FPP), cytidine-5’-diphosphate (CDP), and malate in osteoblasts; whereas the xanthosine monophosphate (XMP), acetyl CoA oxaloacetate, and malate were enriched in osteocytes (Figure 2I). Collectively, the transcriptional profile across cortical bone cell types predicted differential metabolic states between the osteoblast cell population subsets and osteocytes.
Identification of genes during staged osteolineage differentiation
To validate the osteoblast/osteocyte genes identified from our in vivo scRNAseq experiments, the mRNA expression of these genes was tested in mesenchymal progenitor cell (‘MPC2’) cells in vitro. MPC2 cells were recently characterized as harboring the ability to derive osteoblast- and osteocyte-like cells when cultured in osteogenic media (24). After 1-4 weeks of culture, the differentiated cells can be stained by alizarin red reflecting the ability of the mature cells to mineralize (24). Our in vitro molecular analyses demonstrated temporal changes of canonical and non-canonical osteolineage genes. Col1a1 mRNA increased during cell differentiation with the highest level observed at 4 weeks. Runx2 gene expression reached an early and maximal expression 1-week after differentiation and remained stable until 4 weeks. The expression of Tnc significantly increased 1-week after differentiation, although Cthrc1, identified as an enriched osteoblast gene based upon our scRNAseq dataset began increasing with MPC2 cell differentiation at 3 weeks (maximal time point) before being significantly downregulated at 4 weeks (Figure 3A). Osteocyte genes, including Pdpn, Phex, Sost and Ptprz1, had high expression at 3 and 4 weeks of osteocyte differentiation, confirming our finding of Ptprz1 as a likely late osteoblast/osteocyte gene. Further, genes associated with predictive glycolytic and β-oxidation pathways identified by scFEA from the in vivo studies (Figure 2F) were assessed during in vitro MPC2-osteoblast differentiation. We found that glycolytic genes increased during osteoblast differentiation including Adpgk (ADP-Dependent Glucokinase), Aldoa (Aldolase A), and Pgam1 (Phosphoglycerate Mutase 1) reaching ~3-fold increases at 3 at 4 weeks. In contrast, Acadm (Acyl-CoA Dehydrogenase Medium Chain), a gene associated with the conversion of fatty acid to acetyl co-A remained stable during the first three weeks of differentiation before being downregulated at 4 weeks (Figure 3A), consistent with the predicted osteocyte metabolic transition in vivo (Figure 2F).
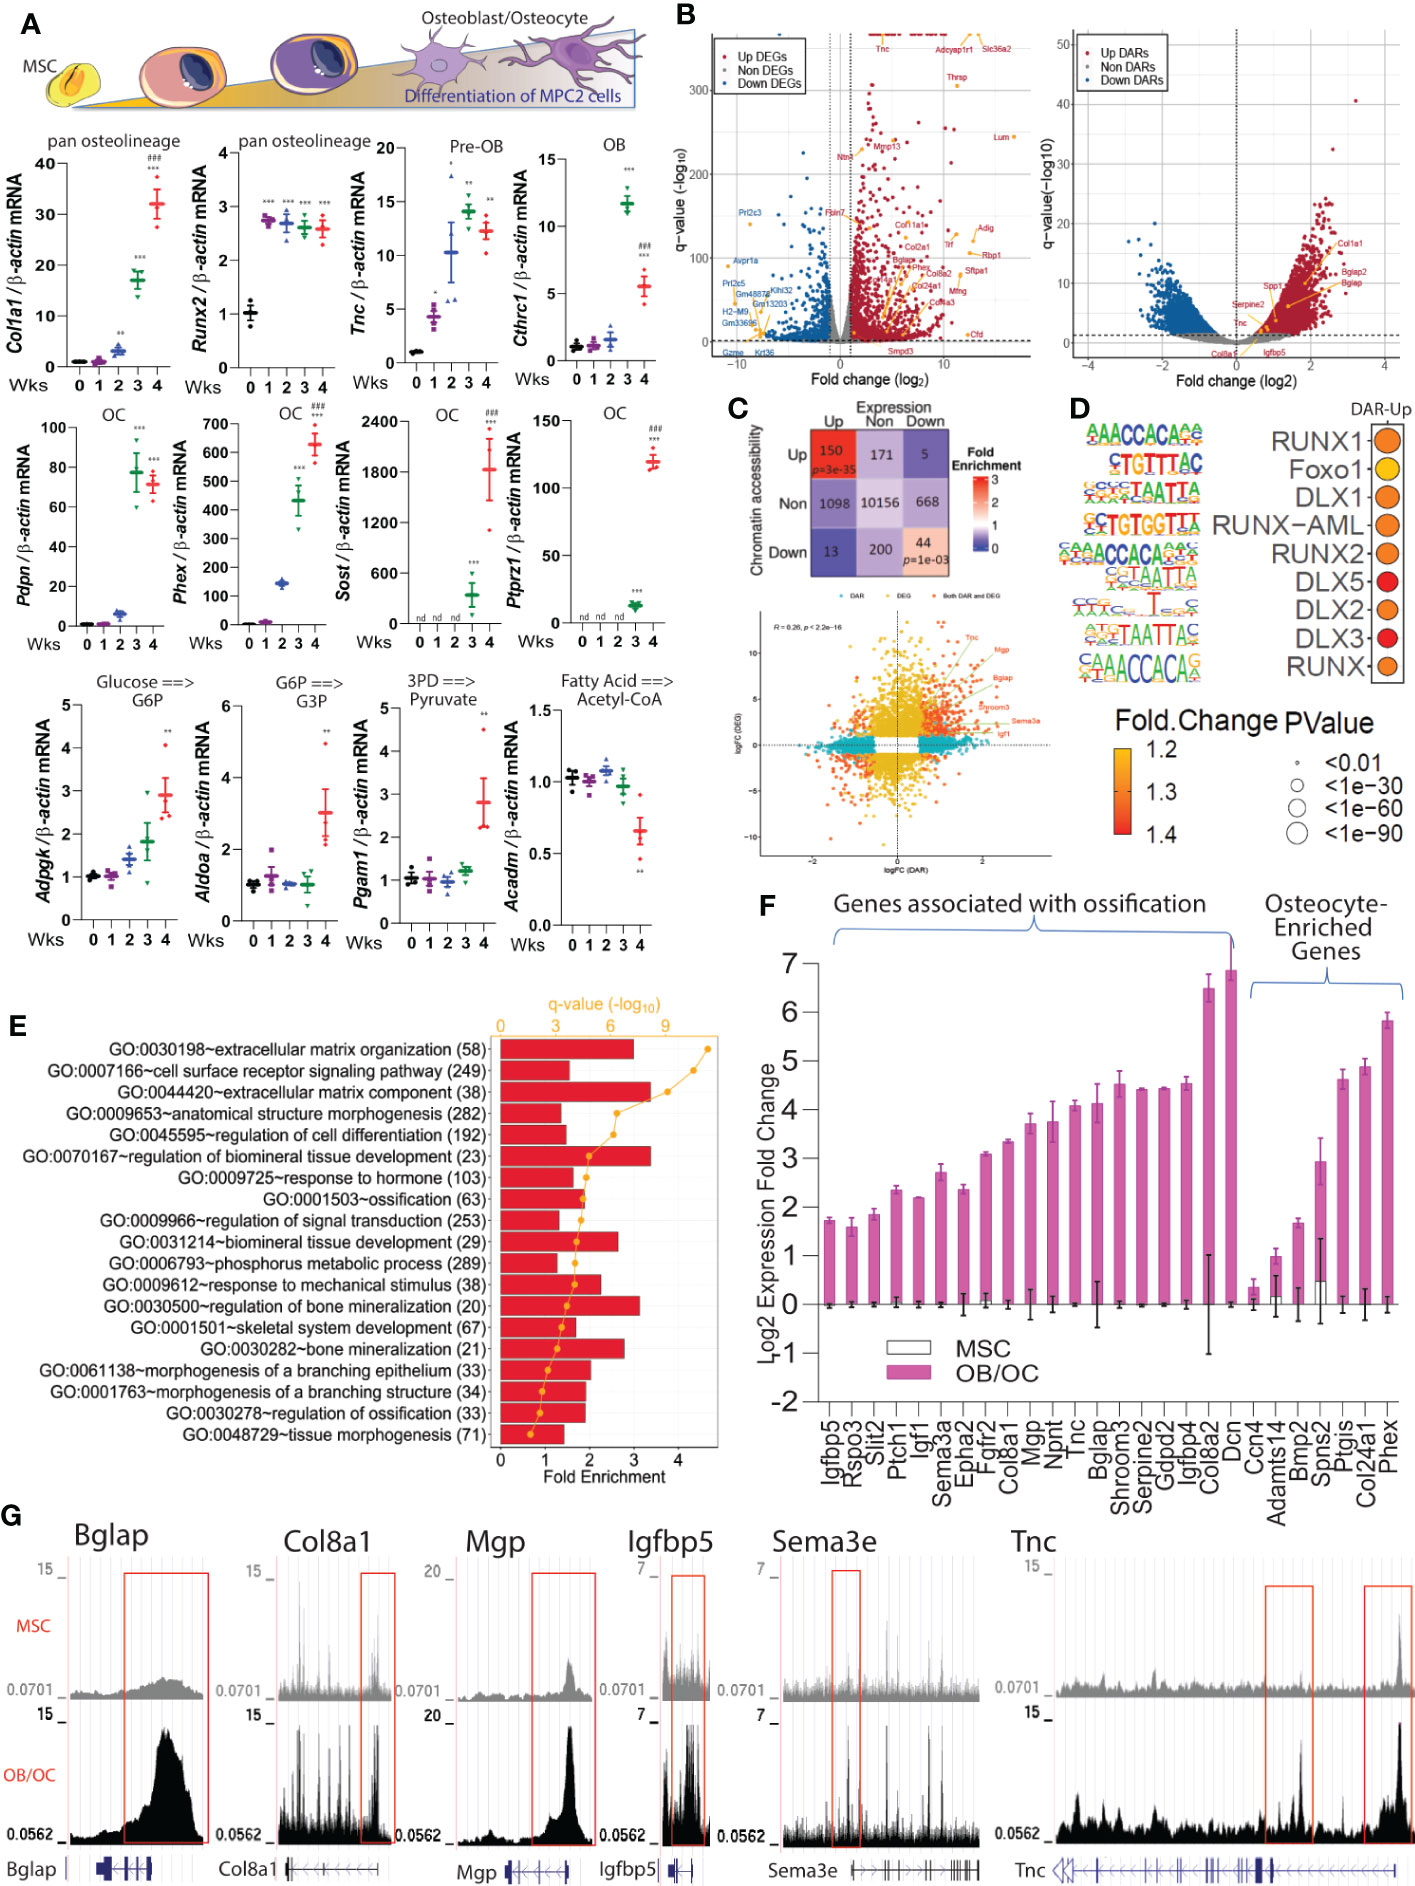
Figure 3 Molecular markers associated with osteoblast/osteocyte differentiation. (A)-top. Schematic representing cell differentiation from MSCs to osteoblasts/osteocytes. (A)-lower. Col1a1, Runx2, Tnc, Cthrc1, Pdpn, Phex, Sost, Ptprz1, Adpgk, Pgam1, Aldoa, and Acadm mRNAs were analyzed in MPC2 cells during osteogenic differentiation over the course of 1-4 weeks and normalized to β-actin. Data are represented as mean +/- standard deviation. *p<0.05, **p<0.01, and ***p<0.001 compared to Control (0 Wks). ###p<0.001 compared to 3 Wks. nd, not detected. (B) Volcano plots derived from the bulk RNAseq (left) and ATACseq datasets (right) show the significant alterations of gene expression and chromatin accessibility detected in differentiated 3 x 3 matrix heatmap highlights the number of genes with differentially accessible regions (DARs), or differentially expressed genes (DEGs), or both DARs and DEGs when compared differentiated versus undifferentiated cells. (C) lower. Integration of ATACseq and RNAseq data exhibited a higher correlation between genome-wide chromatin accessibility changes (x-axis) and gene expression alterations (y-axis). (D) Selected motifs of more open regions of the genome in differentiated cells versus undifferentiated cells using the ATACseq. (E) Functional enrichment analysis using the Database for Annotation, Visualization and Integrated Discovery (DAVID) on upregulated DEGs with more open DARs identified biological pathways that were induced during osteogenic differentiation (numbers in parenthesis are gene counts). (F) Representative mRNA expression of upregulated genes in differentiated versus undifferentiated cells enriched in cell morphogenesis and ossification. All the genes shown were significantly upregulated (false discovery rate, FDR < 0.05). The osteocyte genes identified from the scRNAseq dataset in Figure 1J were confirmed to be significantly upregulated in osteoblasts/osteocytes cells versus control undifferentiated MPC2 cells. (G) Representative ATACseq peaks of undifferentiated cells (top track in gray) compared to differentiated cells (osteoblasts/osteocytes bottom track in black) are shown.
To identify the molecular events associated with osteolineage differentiation, a comprehensive genomic and transcriptomic analyses using RNAseq and ATACseq was employed using MPC2 cells (38). Based on the kinetic profile performed in Figure 3A, a time point of 3 weeks of MSC to osteocyte-like cell differentiation was chosen for RNAseq and ATACseq to capture differentially regulated genes in osteoblasts and osteocytes. Our unbiased approach identified several genes with increased chromatin accessibility and/or gene expression during MPC2 differentiation including osteocalcin (Bglap), osteopontin (Spp1), Col11a1, and Col11a2 (Figure 3B and Figures S3A-F). By performing integrative and correlative analyses of the ATACseq and RNAseq, we confirmed our observed changes in mRNA expression and chromatin accessibility in the ATAC-seq dataset. Using this approach, 150 genes were identified with significantly more open chromatin status and higher gene expression levels after differentiation (Figure 3C), whereas 44 genes were downregulated with notably less DNA accessibility (Figure 3C). The gene sets with both upregulated differential chromatin accessible regions (DAR) and differential expressed genes (DGE), as well as downregulated DAR and DE showed a significantly high fold-enrichment compared to the random selections. However, all other combinations did not demonstrate significance versus the random selections (Figure 3C). Further, a significant Jaccard index score was noted when gene expression and chromatin accessibility increased or decreased simultaneously (FDR < 0.05, see Supplementary Table 2), suggesting that the chromatin changes reflected by DARs, tended to be positively correlated with the DEGs. HOMER transcription factor motif analysis of the ATACseq data detected an enrichment of several motifs that are known to influence bone differentiation (Supplementary Data 2) including an increased enrichment of Runx1, Runx2, Foxo1, and DLX1/5/2 (Figure 3D).
The upregulated genes identified from differential expression analysis associated with changes in chromatin accessibility (Figure 3D) were then subdivided by gene ontology (GO). Among the GO terms that were increased during osteoblast/osteocyte differentiation were functions related to bone mineralization, as well as cellular morphology changes including membrane branching (Figure 3E). Genes that reflected pathways associated with “Cell Morphology” and “Ossification” are shown in Figure 3F. Importantly, osteocyte genes identified from the scRNAseq analysis including Ccn4, Adamts14, Spns2, and Bmp2 were significantly upregulated in osteocyte-like MPC2 cells when compared with parent undifferentiated MSC cells (Figure 3F). Ptgis identified in our dataset and the Wang, et al. dataset (10) was also significantly increased with differentiation. Col24a1 found in our dataset and the Youlten, et al. dataset (9) was also increased (Figure 3F). These mRNA expression levels detected during the cell transitions were robustly and positively associated with their corresponding genomic changes (Figure 3G). For example, the DNA promoter regions at Bglap, Col8a1, Mgp, Igfbp5, Sema3a and Tnc genes were more accessible with cell maturation (Figure 3G).
Next, we tested the chromatin accessibility of a set of osteolineage genes identified in the scRNAseq. For instance, among the Tnc/Mmp13 osteoblast signature genes, we detected increased chromatin accessibility at the Mmp13, Serpine2, and Lifr promoter regions in differentiated cells versus MSC control cells (Figures S4A-C). We also observed high chromatin accessibility at the promoters of Serpinf1 and Cthrc1 (Figures S4D, E), that were defined as expressed by fully differentiated osteoblasts based upon our in vivo scRNAseq data (see Figure 1D). For osteocyte genes, increased chromatin accessibility for the promoter regions of Ackr3, Cd109, Ptgis, Spns2, and Bmp2 was observed (Figures S4F-J). Taken together, these results identified genomic regions of interest associated with osteoblast differentiation that may play critical roles in cellular transcriptional reprogramming.
Impairment of osteoblast/osteocyte genes prior to cortical bone deterioration in CKD
We next assessed the dynamic transcriptional profile of the identified osteoblast and osteocyte genes within cortical bone prior to the development of cortical porosity in CKD, a severe outcome that leads to bone fracture. We used a mouse model in which CKD is induced by providing an adenine-containing diet, which causes a progressive loss of kidney function (39). This model reflects the phenotype observed in humans, characterized by progressive tubular atrophy, immune cell infiltration, and fibrosis (39), and has been extensively characterized as a reliable model to investigate CKD-mineral and bone disorder (15). In comparison to healthy controls, previous studies showed that mice fed a 0.2% adenine diet exhibited biochemistries typical to CKD such as hyperphosphatemia, hypocalcemia, secondary hyperparathyroidism, increased blood urea nitrogen (BUN), and FGF23 induction, which are enhanced with the duration of treatment, as well as associated with bone porosity during chronic adenine administration (15).
With a focus on testing osteoblast/osteocyte gene regulation in cortical bone at a timepoint prior to major ultrastructural changes, cohorts of C57BL/6 mice were placed on control diet or a 0.2% adenine-containing diet for 2 or 4 weeks. At 2 weeks, serum phosphate, alkaline phosphatase, and calcium were not significantly changed compared to controls (Figure 4A). Blood urea nitrogen (BUN) was monitored for declines in renal function, and as expected, the mice receiving the adenine diet had significantly increased BUN (Figure 4A). The cortical porosity and bone volume remained unchanged at 2 or 4 weeks in male or female CKD mice (Figures 4B, C). However, plasma bioactive iFGF23 concentrations were markedly elevated in the mice with CKD (Figure 4D).
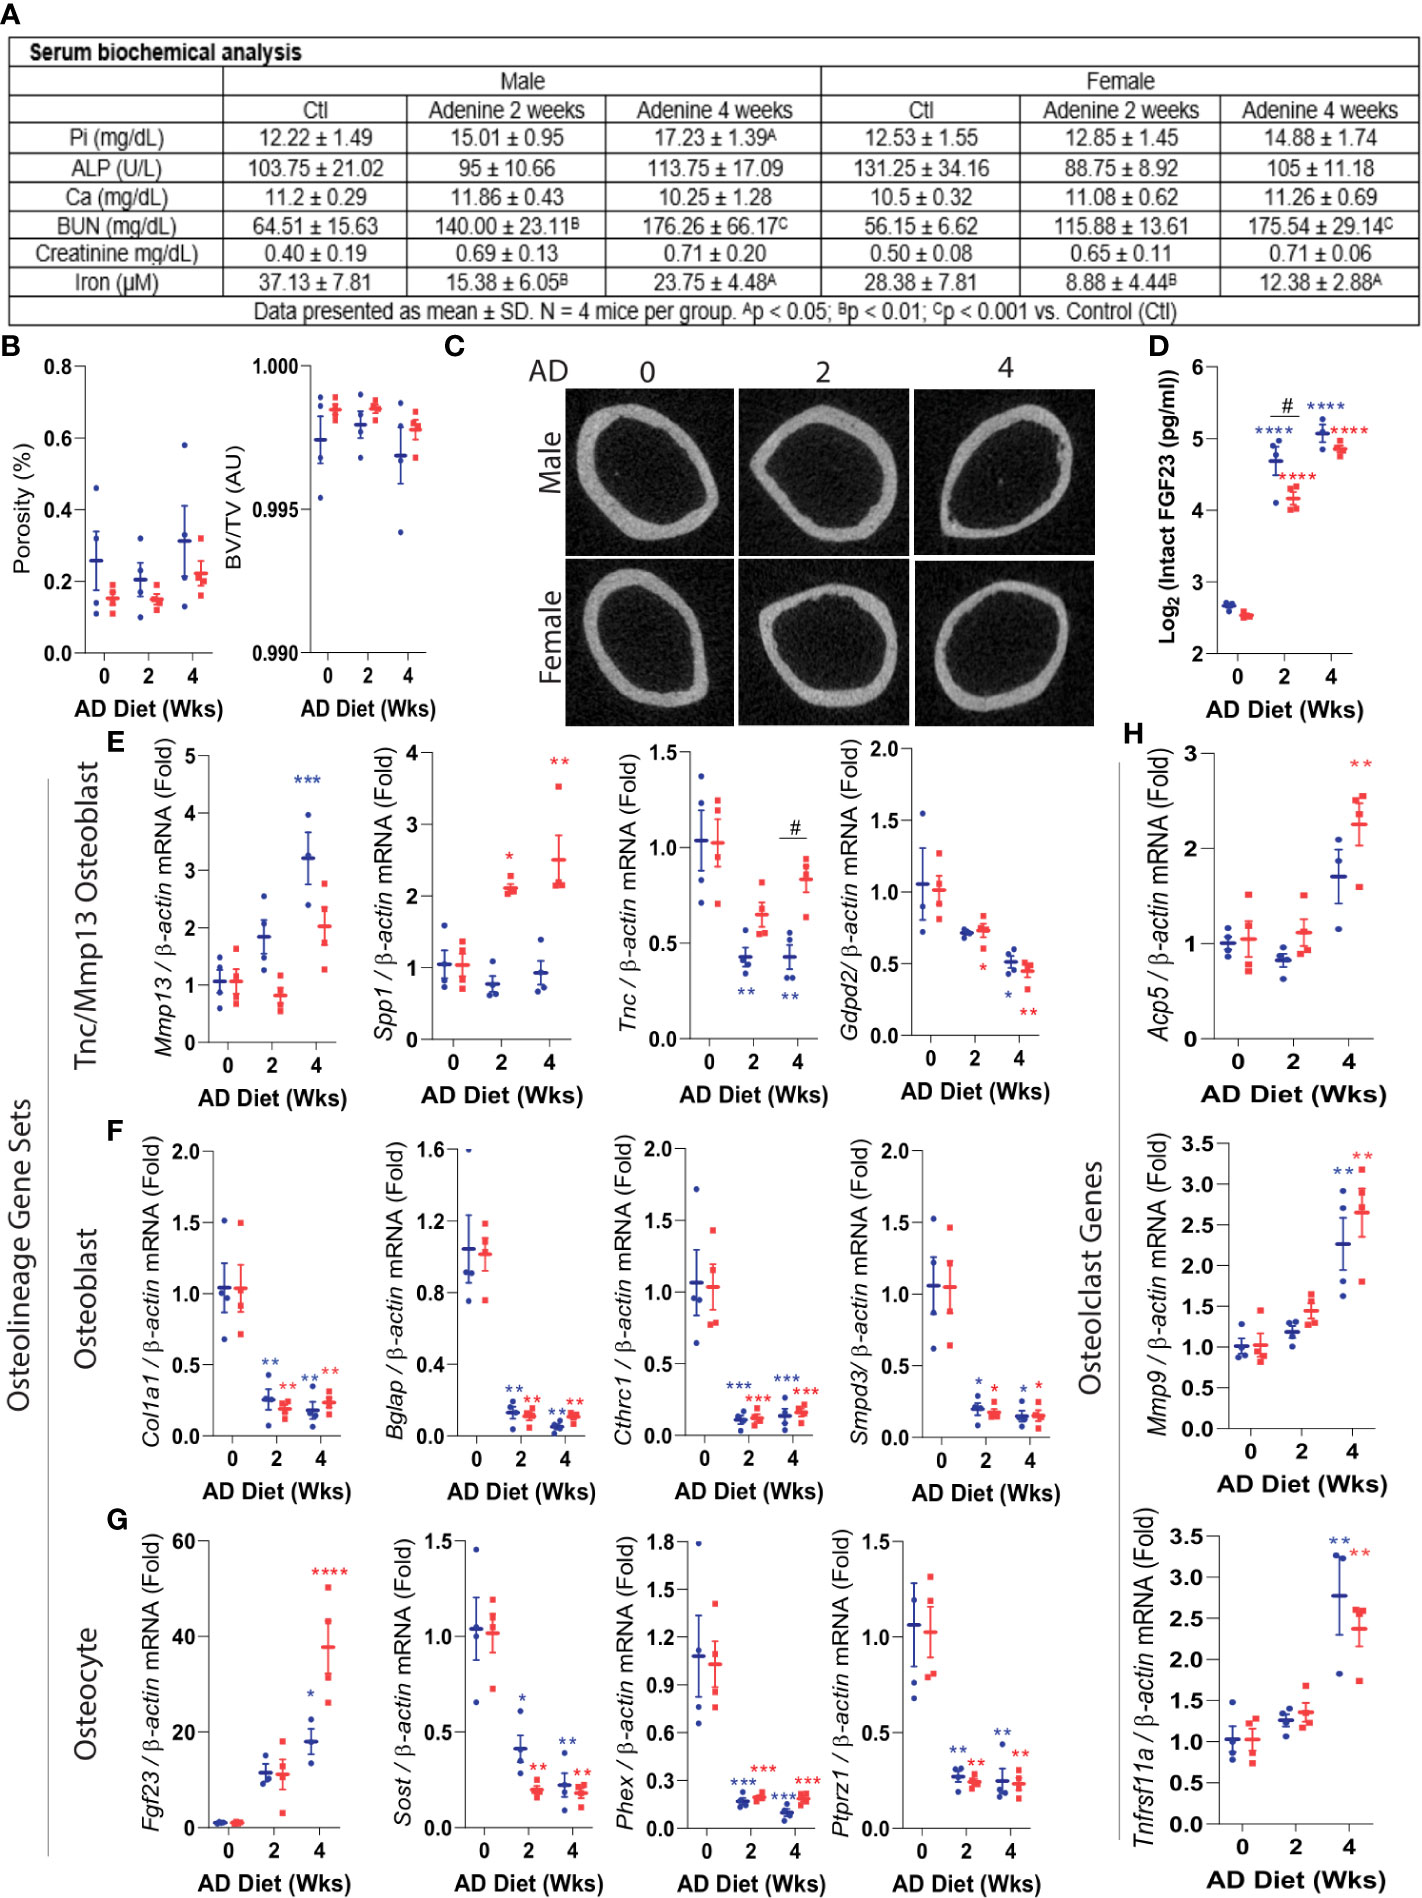
Figure 4 Precocious misregulation of osteoblast/osteocyte genes in CKD. Eight-week old wild type C57BL/6 male (shown in blue) and female (represented in red) mice were fed an adenine diet (AD) to induce CKD for 2, or 4 weeks. Mice fed the casein diet for 2 weeks were used as controls. (A) Key serum biochemical analyses: phosphate, alkaline phosphatase, calcium, blood urea nitrogen, creatinine, and iron are shown. (B) Cortical porosity (left) and trabecular bone volume (right) were measured using micro computed tomography (μCT). (C) Representative images of cortical bone μCT. (D) Circulating FGF23 was assessed by ELISA. (E-H). Real-time qPCR was used to measure the mRNA expression of Tnc/Mmp13 osteoblast (pre-osteoblast), osteoblast and osteocyte gene sets, as well as osteoclast genes. Data are shown as fold change (2-ΔΔCt) relative to the housekeeping gene β-Actin and normalized to the experimental control (‘AD0’). The ‘AD 0’ mice were fed with a control diet (Casein) and sacrificed at 2 weeks; ‘AD 2’ mice were fed with a CKD diet (adenine) and sacrificed at 2 weeks; and the ‘AD 4’ were mice fed with the adenine diet and sacrificed at 4 weeks. Data are represented as mean +/- standard deviation. *p<0.05, **p<0.01, ***p<0.001, ****p<0.001 compared to Control.
We next determined the effects of CKD on highly expressed osteoblast and osteocyte genes in cortical bone samples. During early CKD, Mmp13, and Spp1 identified in the osteoblast precursor population, remained stable or increased with CKD (Figure 4E). In contrast, other precursor osteoblast genes such as Tnc, and Gdpd2, were decreased during CKD progression. The expression of the osteolineage gene Col1a1, as well as osteoblast-specific genes Bglap, Cthrc1, Smpd3 and osteoblast/osteocyte marker Dmp1, were strongly impaired in the mice with CKD (Figure 4F). Increased circulating FGF23 was associated with significant upregulation of cortical bone Fgf23 mRNA at 4 weeks (Figure 4G). In a similar pattern to that of osteoblast genes, osteocyte genes including Sost, Phex, and Ptprz1 were dramatically downregulated early in CKD (Figure 4G). To test whether the change of osteocyte genes in early CKD resulted from an overall decrease of cell numbers, the osteocytes were counted in cortical and trabecular bone using histological analysis. Osteocytes were found within lacunae, and their cell numbers were not different between controls and mice with CKD (Figures S5A, B), suggesting that the observed changes in gene expression in cortical bone were not due to the decrease of overall cell numbers but rather a profound change at cellular level. Of note, empty lacunae were not observed. The osteocyte numbers in trabecular bones were also unchanged, however the number of osteoblasts in trabecular bone was increased in the mice with CKD (Figures S5A, B).
To assess whether changes in bone forming genes at CKD onset occur concurrently with changes in osteoclast markers, we measured gene expression of Acp5 (Tartrate-resistant acid phosphatase), Mmp9 (Matrix metallopeptidase 9), and Tnfrsf11a (Rank) by qPCR. At 2 weeks, a time point where serum phosphate remained unchanged and the cortical bone unaltered as tested by µCT, the mRNA expression of these osteoclast markers was not different from controls (Figure 4H). However, by 4 weeks, these genes were upregulated, consistent with an onset of metabolic bone disease. These findings suggest that at the early stage of the disease, the misregulation of bone-forming osteolineage genes may be independent from loss of cortical bone or increased osteoclast function.
In sum, this work demonstrated that scRNAseq can identify sub-populations of osteoblasts, and together with metabolic profiling, predict differentiation to mature osteoblasts and osteocytes. In addition, we identified genes not previously associated with cortical bone expression, and confirmed their presence in osteoblast/osteocytes via corresponding changes in genomic accessibility and expression using in vitro differentiation studies. These genes were then shown to be misregulated in a mouse model of CKD. Our collective findings support that the molecular changes observed in cortical bone associated with the severe musculoskeletal phenotypes in CKD may occur more rapidly than recognized, and can now be pinpointed to specific cell types within the osteolineage.
Discussion
There is an urgent need to understand bone-forming cell heterogeneity as well as isolate key gene networks that impact skeletal homeostasis. This is especially apparent in diseases such as CKD, where due to the progressive nature and specific calcium- and phosphate-related endocrine disturbances, there are currently very little treatment options (40, 41). Our cortical bone single cell RNAseq analysis identified two osteoblast populations as well as a distinct osteocyte cluster. The genes demarcating each cell type were confirmed as highly enriched in cortical bone as well as being upregulated during osteoblast differentiation in vitro. Interestingly and unexpectedly, at early-stage CKD onset in mice, there was a dramatic misregulation of gene expression in cortical bone cell types prior to major bone ultrastructural changes.
Recent studies using bulk RNA sequencing developed an osteocyte-defining transcriptome which was comprised of 28 genes (9), and we observed partial overlap of genes within the transcriptomes reported by Youlten et al. (9), as well as from analysis we performed using the publicly available scRNAseq dataset of Wang et al. (10). Our scRNAseq analysis also identified additional genes which were highly enriched in osteocytes (see Figure 1F). It is likely that some of the observed differences in osteocyte gene profiling between our studies and those of others are due to the fact that we exclusively used long bones for cell isolation whereas the previous studies sequenced a mix of long bone and calvariae, or used bulk total cortical bone RNA as a starting material (9, 10). Future studies will be needed to further sub-set these gene profiles and expand cell-specific targets as more cortical bone datasets become publicly available for multi-study integration. This is especially the case for osteolineage genes in light of the idea that these cells are derived from precursors that have distinct and overlapping gene expression.
Our bone scRNAseq analyses identified a population of Tnc/Mmp13 mRNA-containing osteoblasts as potential precursors of a mature osteoblast population of cells. Mmp13, the most highly expressed gene in this cell type has been described as a direct target of osteoblast-specific transcription factor osterix (Sp7) in osteoblasts (42) and known to be activated by Runx2, the master transcription factor for osteoblastogenesis (43). A recent study defined the molecular mechanisms driven by Sp7 to control osteocyte dendrite formation (10). Whether directly targeting Mmp13 could influence osteoblast differentiation and osteocyte maturation remains to be investigated. Further analyses integrating our bone cell data sets with other published scRNAseq data by including stem cells and osteoprogenitors may complement the work described herein to predict a full osteogenic trajectory, and to precisely position the Tnc-Mmp13 osteoblast population in the osteogenic commitment lineage. Although we identified osteolineage genes in common with previous studies (9, 10) in addition to unique markers, we cannot exclude that using a system of basal state SOST-Cre/Ai9 and cell sorting (with no tamoxifen induction) identified a specific set of cortical bone cells. It will be important to continue to characterize additional bone cell populations identified through multiple approaches. As new tools such as mouse reporter genes for studying osteoblasts/osteocytes continue to emerge in concert with evolving approaches for testing the single cell transcriptome and genomic accessibility with more sensitivity, it will be important to continue to refine bone cell classification to fully understand osteolineage heterogeneity.
Our work in modeled CKD identified a general misregulation of mature osteoblast and osteocyte genes prior to major bone structural changes. This analysis detected a downregulation of multiple osteoblast and osteocyte mRNAs except for bone Fgf23 that increased in CKD, or remained stable or were moderately induced, such as Mmp13 and Spp1. The pre-osteoblast gene sets tested in CKD suggested a step-wise decrease in progenitor alterations. Further, our histological analyses found that the number of osteocytes in cortical and trabecular bone are unchanged at the early stage of modeled CKD, suggesting that diminishing cell numbers with disease progression was not responsible for the altered gene expression (Figures S5A, B). These findings are consistent with previous studies that quantified osteocytes in healthy controls, pre-dialysis CKD patients, and pediatric dialysis patients. This report found that the osteocyte cell numbers in bone biopsies did not differ between CKD patients when compared to the healthy group (44). In support of our findings, it is possible that the maturation mechanisms of osteocytes may instead be affected (44). Thus, the genes tested herein may serve as early onset markers for CKD bone disease and set the stage for studies that could determine their function during osteolineage differentiation in CKD. These studies also imply that targeting one bone cell type in CKD bone disease will likely not be fully effective since damage may be done in early precursor cells, with these cells potentially carrying these gene expression changes through differentiation where they may impact mature cells. We also found a decrease in cortical bone Sclerostin (Sost) expression at an early stage of CKD in mice (Figure 4G). In a paracrine signaling manner, rapid decreases of osteocyte genes Sost and likely Dkk1 may represent an adaptive mechanism to maintain effective Wnt signaling as an attempt to delay the initial development of renal osteodystrophy. Whether the decrease in cortical bone Sost stimulates trabecular osteoblast differentiation in a paracrine manner to attempt to sustain bone formation at CKD onset remains to be determined.
It was demonstrated in previous studies that mice fed an adenine-containing diet over a chronic 10-week period developed deficits in cortical bone properties associated with an increase of osteoclast surface and a higher bone formation rate (45). Another adenine study conducted over a 56-day protocol found that the bone resorption marker carboxy-terminal collagen crosslinks (CTX) was decreased and the bone formation marker the N-terminal propeptide of type I procollagen (P1NP) had a trend towards increasing (p=0.06) (46). These chronic CKD models suggested a high bone turnover phenotype when mice were fed with an adenine diet over a long-term period. In our studies, mice exposed to adenine diet for only 2 weeks did not exhibit cortical porosity, and osteoclast gene markers were unchanged at 2 weeks of dietary treatment although osteoblast and osteocyte markers assessed in cortical bone were already downregulated (Figures 4F–H). These results suggest that misregulation of genes within the osteolineage may precede the up-regulation osteoclast genes.
The skeleton is an important regulator of systemic glucose homeostasis, with osteocalcin and insulin thought to represent prime mediators of the interplay between bone and energy metabolism (47, 48). Using the recently developed computational tool single-cell flux estimation analysis (scFEA) (23) that calculates the cell metabolomic state in scRNAseq datasets, our data predicted in vivo metabolic transitions during osteoblast differentiation. At the single cell level, our data supported high glycolysis and glutamine metabolic states in osteoblast precursors versus more mature osteoblasts and osteocytes (Figure 2F and Figure S2G). The metabolic flux analysis suggested that metabolomic transition between pre-osteoblasts to osteoblasts was more pronounced than between osteoblasts to osteocytes. This was correlated with the extent of differentially expressed genes between osteolineage cells. Indeed, 198 genes were differentially expressed when comparing pre-osteoblasts and osteoblasts versus 77 genes between osteoblasts and osteocytes (logFC>0.5 and p<0.05; Figure S2G). The conversion of arginine to ornithine was similar across all osteolineage cells (Figure S2H), and pathways including the conversion of citrulline/aspartate to arginosuccinate or acetyl glucosamine to hyaluronic acid were also predicted to be conserved regardless of cell differentiation status or cell type (Figure S2H). In our analyses, we provided validation in a distinct cell system for the regulation of key genes associated with these metabolic flux predictive data. However, it will be important to build upon these findings to provide genetic evidence that specific osteoblast precursor genes assorted with metabolism may be critical in supporting osteoblast differentiation, as well as influencing global energy metabolism in normal states and in skeletal disease.
Although this study provided an extensive gene profile analysis of osteolineage cells, some established osteocyte genes such as Sost and Fgf23 were not detected under baseline conditions. It is likely that current single cell sequencing technologies using the short coverage length along each mRNA from the 3’UTR end (which is based on 28 bp of cell barcode and UMI sequences and 91 bp RNA reads generated) have sensitivity limitations for detecting low, yet specific gene expression in less prevalent cell populations. Overall, genes with lower expression (mainly with a detection at the latest quarter threshold cycle using real time qPCR) were minimally detected at single cell resolution using the current 10X Genomics mRNA expression profiling pipeline. However, our approach of combining FACS sorting with cell isolation from the Sost-Cre/Ai9 mice to develop an enriched population of cortical bone cells identified potentially new sets of osteocyte genes which were validated in an independent mesenchymal cell line in vitro and in RNA from cortical bone ex vivo.
In summary, by combining genomic, transcriptomic, and predictive metabolic profiling approaches, we identified osteolineage genes associated with distinct cell populations of osteoblast precursors, mature osteoblasts and osteocytes. Genes within these three cortical bone cell populations were misregulated in a mouse model of CKD prior to the development of cortical porosity. Thus, our findings support that the molecular events occurring during the bone disease associated with CKD appear early and manifest more widely across the osteolineage cell population.
Data availability statement
The scRNAseq data presented in the study are deposited in the GEO repository, accession number GSE208152. The RNAseq and ATACseq data presented in the study are deposited in the GEO repository, accession number GSE205792. The replicates of ATACseq are: undifferentiated (MSC) conditions (GSM6222138 – GSM6222140), differentiated (OB/OC) conditions (GSM6222144 – GSM6222145). The replicates of RNAseq are: undifferentiated (MSC) conditions (GSM6229476 – GSM6229478), differentiated conditions (OB/OC) (GSM6229482 – GSM6229484).
Ethics statement
The animal study was reviewed and approved by Indiana University School of Medicine Institutional Animal Care and Use Committee (IACUC) Animal Protocol Form.
Author contributions
RA and KW designed and conceived the experiments. RA, YM, MN, LH and XX performed the in vivo, in vitro and sequencing experiments. IN, SL, WC, HG, CZ, and RA performed bioinformatics analysis and interpreted the data with advice from KW, YL, and JW. DH performed the Micro-computed tomography analysis. CM performed osteoblasts and osteocyte counting. WT, AR, and LB provided critical reagents for the project. RA and KW drafted and wrote the manuscript. All authors contributed to the article and approved the submitted version.
Funding
The authors would like to acknowledge NIH grants K99-DK129705 (RA), R21-AR059278 (KW), R01-DK112958 (KW), P20GM125503 (NIGMS to IN), and the David Weaver Professorship (KW). The Indiana University Melvin and Bren Simon Comprehensive Cancer Center Flow Cytometry Resource Facility (FCRF) is funded in part by NIH, National Cancer Institute (NCI) grant P30 CA082709 and National Institute of Diabetes and Digestive and Kidney Diseases (NIDDK) grant U54 DK106846. The FCRF is supported in part by NIH instrumentation grant 1S10D012270.
Acknowledgments
The authors thank the members of the Indiana University Melvin and Bren Simon Cancer Center Flow Cytometry Resource Facility for their outstanding technical support.
Conflict of interest
KEW receives royalties for licensing FGF23 to Kyowa Hakko Kirin Co., Ltd; had previous funding from Akebia, and current funding from Calico Labs; KEW also owns equity interest in FGF Therapeutics.
The remaining authors declare that the research was conducted in the absence of any commercial or financial relationships that could be construed as a potential conflict of interest.
Publisher’s note
All claims expressed in this article are solely those of the authors and do not necessarily represent those of their affiliated organizations, or those of the publisher, the editors and the reviewers. Any product that may be evaluated in this article, or claim that may be made by its manufacturer, is not guaranteed or endorsed by the publisher.
Supplementary material
The Supplementary Material for this article can be found online at: https://www.frontiersin.org/articles/10.3389/fendo.2023.1063083/full#supplementary-material
Supplementary Figure 1 | (A). Percentage of mitochondrial genes in scRNAseq dataset. (B–F). Expression density plots indicated cells with high transcription of Ptprc (Cd45), Cdh5, Pdgfra, Mmp13, and Spp1. (G). The Monocle algorithm divided the cells based upon the original UMAP into three partitions, as indicated by each color. The partition ‘p1’ identified the osteolineage cells, ‘p2’ corresponded to hematopoietic cells and ‘p3’ represented endothelial cells. (H–I). Examples of trajectory analysis performed on hematopoietic and marrow endothelial cells.
Supplementary Figure 2 | (A). Predictive upstream regulators in Tnc/Mmp13 osteoblast (pre-osteoblasts), osteoblast and osteocyte. (B). Dmp1 expression in different cell types (C). scFEA UMAP. (D). Heatmap indicates the distribution of predicted cell-wise flux of glycolytic, TCA, serine metabolism, fatty acid metabolism and glutamate metabolism relative to pre-osteoblast (Tnc/Mmp13) values. The heatmap uses a column Z-score to show significant differences between pre-osteoblasts (Tnc/Mmp13), osteoblasts, and osteocytes. (E–F). Ridgeline plots indicate the distribution values of metabolic flux in pre-osteoblasts (P-OB), osteoblasts (OB), and osteocytes (OC). Each ridgeline represents the flux between two metabolites (x-axis) for different cells that are plotted on the y-axis. (G). Venn diagram shows the number of differentially expressed genes for Tnc_mmp13_osteoblasts vs osteoblasts, and osteocytes vs osteoblasts. H. Ridgeline plots indicate the distribution values of metabolic flux in pre-osteoblasts (Tnc/Mmp13), osteoblasts (OB), osteocytes (OC), hematopoietic cells (Hem I and Hem II), and bone marrow endothelial cells (BMEC).
Supplementary Figure 3 | (A–F). Chromatin accessibilities with corresponding gene expression of Spp1 (p = 0.00933495), Col11a1 (p = 1.9363E-05), and Col11a2 (p = 7.2591E-06) in differentiated (OB/OC) versus undifferentiated (MSC) cells.
Supplementary Figure 4 | (A–C). Assessment of chromatin accessibilities at Mmp13 (p = 0.01025011), Serpine2 (p = 3.4093E-09), and Lifr (p = 1.2547E-07) genomic regions. These genes were detected as highly enriched in pre-osteoblasts. (D–E). Assessment of chromatin accessibilities at Serpinf1 (p = 0.00099491), and Cthrc1 (p = 0.013) genomic loci. These genes were predicted to be highly enriched in osteoblasts. (D–E). Assessment of chromatin accessibilities at Ackr3 (p = 2.503E-06), Cd109 (p = 0.00179923), Ptgis (p = 6.8707E-06), Spns2 (p = 0.00521604), and Bmp2 (p = 0.00540629) genomic regions. These genes were detected primarily in osteocytes. Top tracks (gray) corresponded to undifferentiated cells (MSC) and lower tracks (black) corresponded to differentiated cells (OB/OC).
Supplementary Figure 5 | Osteocyte and osteoblast cell numbers in cortical and trabecular bone. (A). The image shows osteocytes in the lacunae from femurs that were stained with hematoxylin and eosin. (B). Osteocyte numbers from cortical bone were counted in the midshaft of bone and normalized to bone area. For counting of osteocytes in trabecular bone, cells were counted in distal femur excluding endocortical surfaces and primary spongiosa, then normalized to trabecular bone area. Osteoblasts were counted in distal femur in the same trabecular region as where osteocytes were counted and normalized to trabecular bone surface.
References
1. Dallas SL, Bonewald LF. Dynamics of the transition from osteoblast to osteocyte. Ann NY Acad Sci 2010 (1192) p:437–43. doi: 10.1111/j.1749-6632.2009.05246.x
2. Martin B. Aging and strength of bone as a structural material. Calcif Tissue Int (1993) 53 Suppl 1:S34–9. doi: 10.1007/BF01673400
3. Seeman E. Age- and menopause-related bone loss compromise cortical and trabecular microstructure. J Gerontol A Biol Sci Med Sci (2013) 68(10):1218–25. doi: 10.1093/gerona/glt071
4. Nickolas TL, Stein EM, Dworakowski E, Nishiyama KK, Komandah-Kosseh M, Zhang CA, et al. Rapid cortical bone loss in patients with chronic kidney disease. J Bone Miner Res (2013) 28(8):1811–20. doi: 10.1002/jbmr.1916
5. Luyckx VA, Tonelli M, Stanifer JW. The global burden of kidney disease and the sustainable development goals. Bull World Health Organ (2018) 96(6):414–422D. doi: 10.2471/BLT.17.206441
6. John GB, Cheng CY, Kuro-o M. Role of klotho in aging, phosphate metabolism, and CKD. Am J Kidney Dis (2011) 58(1):127–34. doi: 10.1053/j.ajkd.2010.12.027
7. Nitsch D, Mylne A, Roderick PJ, Smeeth L, Hubbard R, Fletcher A, et al. Chronic kidney disease and hip fracture-related mortality in older people in the UK. Nephrol Dial Transplant (2009) 24(5):1539–44. doi: 10.1093/ndt/gfn678
8. Robertson L, Black C, Fluck N, Gordon S, Hollick R, Nguyen H, et al. Hip fracture incidence and mortality in chronic kidney disease: the GLOMMS-II record linkage cohort study. BMJ Open (2018) 8(4):e020312. doi: 10.1136/bmjopen-2017-020312
9. Youlten SE, Kemp JP, Logan JG, Ghirardello EJ, Sergio CM, Dack MRG, et al. Osteocyte transcriptome mapping identifies a molecular landscape controlling skeletal homeostasis and susceptibility to skeletal disease. Nat Commun (2021) 12(1):2444. doi: 10.1038/s41467-021-22517-1
10. Wang JS, Kamath T, Mazur CM, Mirzamohammadi F, Rotter D, Hojo H, et al. Control of osteocyte dendrite formation by Sp7 and its target gene osteocrin. Nat Commun (2021) 12(1):6271. doi: 10.1038/s41467-021-26571-7
11. Lane NE. Epidemiology, etiology, and diagnosis of osteoporosis. Am J Obstet Gynecol (2006) 194(2 Suppl). doi: 10.1016/j.ajog.2005.08.047
12. Guide for the care and use of laboratory animals. Washington (DC): The national academies press (2011).
13. Maurel DB, Matsumoto T, Vallejo JA, Johnson ML, Dallas SL, Kitase Y, et al. Characterization of a novel murine sost ER(T2) cre model targeting osteocytes. Bone Res (2019) 7:6. doi: 10.1038/s41413-018-0037-4
14. Stern AR, Stern MM, Van Dyke ME, Jähn K, Prideaux M, Bonewald LF, et al. Isolation and culture of primary osteocytes from the long bones of skeletally mature and aged mice. Biotechniques (2012) 52(6):361–73. doi: 10.2144/0000113876
15. Clinkenbeard EL, Noonan ML, Thomas JC, Ni P, Hum JM, Aref M, et al. Increased FGF23 protects against detrimental cardio-renal consequences during elevated blood phosphate in CKD. JCI Insight (2019) 4(4). doi: 10.1172/jci.insight.123817
16. Kedlaya R, Veera S, Horan DJ, Moss RE, Ayturk UM, Jacobsen CM, et al. Sclerostin inhibition reverses skeletal fragility in an Lrp5-deficient mouse model of OPPG syndrome. Sci Transl Med (2013) 5(211):211ra158. doi: 10.1126/scitranslmed.3006627
17. Bouxsein ML, Boyd SK, Christiansen BA, Guldberg RE, Jepsen KJ, Müller R, et al. Guidelines for assessment of bone microstructure in rodents using micro-computed tomography. J Bone Miner Res (2010) 25(7):1468–86. doi: 10.1002/jbmr.141
18. Dobin A, Davis CA, Schlesinger F, Drenkow J, Zaleski C, Jha S, et al. STAR: ultrafast universal RNA-seq aligner. Bioinformatics (2013) 29(1):15–21. doi: 10.1093/bioinformatics/bts635
19. Stuart T, Butler A, Hoffman P, Hafemeister C, Papalexi E, Mauck WM, et al. Comprehensive integration of single-cell data. Cell (2019) 177(7):1888–1902.e21. doi: 10.1016/j.cell.2019.05.031
20. Finak G, McDavid A, Yajima M, Deng J, Gersuk V, Shalek AK, et al. MAST: a flexible statistical framework for assessing transcriptional changes and characterizing heterogeneity in single-cell RNA sequencing data. Genome Biol (2015) 16:278. doi: 10.1186/s13059-015-0844-5
21. Alquicira-Hernandez J, Powell JE. Nebulosa recovers single cell gene expression signals by kernel density estimation. Bioinformatics (2021). doi: 10.1101/2020.09.29.315879
22. Trapnell C, Cacchiarelli D, Grimsby J, Pokharel P, Li S, Morse M, et al. The dynamics and regulators of cell fate decisions are revealed by pseudotemporal ordering of single cells. Nat Biotechnol (2014) 32(4):381–6. doi: 10.1038/nbt.2859
23. Alghamdi N, Chang W, Dang P, Lu X, Wan C, Gampala S, et al. A graph neural network model to estimate cell-wise metabolic flux using single-cell RNA-seq data. Genome Res (2021) 31(10):1867–84. doi: 10.1101/gr.271205.120
24. Prideaux M, Wright CS, Noonan ML, Yi X, Clinkenbeard EL, Mevel E, et al. Generation of two multipotent mesenchymal progenitor cell lines capable of osteogenic, mature osteocyte, adipogenic, and chondrogenic differentiation. Sci Rep (2021) 11(1):22593. doi: 10.1038/s41598-021-02060-1
25. Liao Y, Smyth GK, Shi W. featureCounts: An efficient general purpose program for assigning sequence reads to genomic features. Bioinformatics (2014) 30(7):923–30. doi: 10.1093/bioinformatics/btt656
26. Robinson MD, McCarthy DJ, Smyth GK. edgeR: a bioconductor package for differential expression analysis of digital gene expression data. Bioinformatics (2010) 26(1):139–40. doi: 10.1093/bioinformatics/btp616
27. Dennis G Jr., Sherman BT, Hosack DA, Yang J, Gao W, Lane CH, et al. DAVID: Database for annotation, visualization, and integrated discovery. Genome Biol (2003) 4(5):P3. doi: 10.1186/gb-2003-4-5-p3
28. Kramer A, Green J, Pollard J Jr, Tugendreich S. Causal analysis approaches in ingenuity pathway analysis. Bioinformatics (2014) 30(4):523–30. doi: 10.1093/bioinformatics/btt703
29. Buenrostro JD, Giresi PG, Zaba LC, Chang HY, Greenleaf WJ. Transposition of native chromatin for fast and sensitive epigenomic profiling of open chromatin, DNA-binding proteins and nucleosome position. Nat Methods (2013) 10(12):1213–8. doi: 10.1038/nmeth.2688
30. Langmead B, Salzberg SL. Fast gapped-read alignment with bowtie 2. Nat Methods (2012) 9(4):357–9. doi: 10.1038/nmeth.1923
31. Zhang Y, Liu T, Meyer CA, Eeckhoute J, Johnson DS, Bernstein BE, et al. Model-based analysis of ChIP-seq (MACS). Genome Biol (2008) 9(9):R137. doi: 10.1186/gb-2008-9-9-r137
32. Consortium EP. An integrated encyclopedia of DNA elements in the human genome. Nature (2012) 489(7414):57–74. doi: 10.1038/nature11247
33. Amemiya HM, Kundaje A, Boyle AP. The ENCODE blacklist: Identification of problematic regions of the genome. Sci Rep (2019) 9(1):9354. doi: 10.1038/s41598-019-45839-z
34. Piper J, Elze MC, Cauchy P, Cockerill PN, Bonifer C, Ott S, et al. Wellington: a novel method for the accurate identification of digital genomic footprints from DNase-seq data. Nucleic Acids Res (2013) 41(21):e201. doi: 10.1093/nar/gkt850
35. McCarthy DJ, Chen Y, Smyth GK. Differential expression analysis of multifactor RNA-seq experiments with respect to biological variation. Nucleic Acids Res (2012) 40(10):4288–97. doi: 10.1093/nar/gks042
36. Heinz S, Benner C, Spann N, Bertolino E, Lin YC, Laslo P, et al. Simple combinations of lineage-determining transcription factors prime cis-regulatory elements required for macrophage and b cell identities. Mol Cell (2010) 38(4):576–89. doi: 10.1016/j.molcel.2010.05.004
37. Livak KJ, Schmittgen TD. Analysis of relative gene expression data using real-time quantitative PCR and the 2(-delta delta C(T)) method. Methods (2001) 25(4):402–8. doi: 10.1006/meth.2001.1262
38. Shashikant T, Ettensohn CA. Genome-wide analysis of chromatin accessibility using ATAC-seq. Methods Cell Biol (2019) 151:219–35. doi: 10.1016/bs.mcb.2018.11.002
39. Diwan V, Brown L, Gobe GC. Adenine-induced chronic kidney disease in rats. Nephrol (Carlton) (2018) 23(1):5–11. doi: 10.1111/nep.13180
40. Nickolas TL, Cremers S, Zhang A, Thomas V, Stein E, Cohen A, et al. Discriminants of prevalent fractures in chronic kidney disease. J Am Soc Nephrol (2011) 22(8):1560–72. doi: 10.1681/ASN.2010121275
41. Maravic M, Ostertag A, Torres PU, Cohen-Solal M. Incidence and risk factors for hip fractures in dialysis patients. Osteoporos Int (2014) 25(1):159–65. doi: 10.1007/s00198-013-2435-1
42. Zhang C, Tang W, Li Y. Matrix metalloproteinase 13 (MMP13) is a direct target of osteoblast-specific transcription factor osterix (Osx) in osteoblasts. PloS One (2012) 7(11):e50525. doi: 10.1371/journal.pone.0050525
43. Hecht J, Seitz V, Urban M, Wagner F, Robinson PN, Stiege A. Detection of novel skeletogenesis target genes by comprehensive analysis of a Runx2(-/-) mouse model. Gene Expr Patterns (2007) 7(1-2):102–12. doi: 10.1016/j.modgep.2006.05.014
44. Pereira RC, Salusky IB, Roschger P, Klaushofer K, Yadin O, Freymiller EG, et al. Impaired osteocyte maturation in the pathogenesis of renal osteodystrophy. Kidney Int (2018) 94(5):1002–12. doi: 10.1016/j.kint.2018.08.011
45. Metzger CE, Swallow EA, Stacy AJ, Allen MR. Adenine-induced chronic kidney disease induces a similar skeletal phenotype in male and female C57BL/6 mice with more severe deficits in cortical bone properties of male mice. PloS One (2021) 16(4):e0250438. doi: 10.1371/journal.pone.0250438
46. Jia T, Olauson H, Lindberg K, Amin R, Edvardsson K, Lindholm B, et al. A novel model of adenine-induced tubulointerstitial nephropathy in mice. BMC Nephrol (2013) 14:116. doi: 10.1186/1471-2369-14-116
47. Karsenty G, Ferron M. The contribution of bone to whole-organism physiology. Nature (2012) 481(7381):314–20. doi: 10.1038/nature10763
Keywords: bone, scRNAseq, osteoblasts, osteocytes, chronic kidney disease
Citation: Agoro R, Nookaew I, Noonan ML, Marambio YG, Liu S, Chang W, Gao H, Hibbard LM, Metzger CE, Horan D, Thompson WR, Xuei X, Liu Y, Zhang C, Robling AG, Bonewald LF, Wan J and White KE (2023) Single cell cortical bone transcriptomics define novel osteolineage gene sets altered in chronic kidney disease. Front. Endocrinol. 14:1063083. doi: 10.3389/fendo.2023.1063083
Received: 06 October 2022; Accepted: 04 January 2023;
Published: 26 January 2023.
Edited by:
Ryan C. Riddle, University of Maryland, Baltimore, United StatesReviewed by:
Alexander Rauch, University of Southern Denmark, DenmarkSatoru Otsuru, University of Maryland, Baltimore, United States
Copyright © 2023 Agoro, Nookaew, Noonan, Marambio, Liu, Chang, Gao, Hibbard, Metzger, Horan, Thompson, Xuei, Liu, Zhang, Robling, Bonewald, Wan and White. This is an open-access article distributed under the terms of the Creative Commons Attribution License (CC BY). The use, distribution or reproduction in other forums is permitted, provided the original author(s) and the copyright owner(s) are credited and that the original publication in this journal is cited, in accordance with accepted academic practice. No use, distribution or reproduction is permitted which does not comply with these terms.
*Correspondence: Kenneth E. White, a2VuZXdoaXRAaXUuZWR1