 Zhibin Wang
 Zhaojin Li
 Kunyue Li
 Yu Di
Yu Di- Department of Ophthalmology, Shengjing Hospital of China Medical University, Shenyang, China
Aims: To systematically evaluate the diagnostic value of an artificial intelligence (AI) algorithm model for various types of diabetic retinopathy (DR) in prospective studies over the previous five years, and to explore the factors affecting its diagnostic effectiveness.
Materials and methods: A search was conducted in Cochrane Library, Embase, Web of Science, PubMed, and IEEE databases to collect prospective studies on AI models for the diagnosis of DR from January 2017 to December 2022. We used QUADAS-2 to evaluate the risk of bias in the included studies. Meta-analysis was performed using MetaDiSc and STATA 14.0 software to calculate the combined sensitivity, specificity, positive likelihood ratio, and negative likelihood ratio of various types of DR. Diagnostic odds ratios, summary receiver operating characteristic (SROC) plots, coupled forest plots, and subgroup analysis were performed according to the DR categories, patient source, region of study, and quality of literature, image, and algorithm.
Results: Finally, 21 studies were included. Meta-analysis showed that the pooled sensitivity, specificity, pooled positive likelihood ratio, pooled negative likelihood ratio, area under the curve, Cochrane Q index, and pooled diagnostic odds ratio of AI model for the diagnosis of DR were 0.880 (0.875-0.884), 0.912 (0.99-0.913), 13.021 (10.738-15.789), 0.083 (0.061-0.112), 0.9798, 0.9388, and 206.80 (124.82-342.63), respectively. The DR categories, patient source, region of study, sample size, quality of literature, image, and algorithm may affect the diagnostic efficiency of AI for DR.
Conclusion: AI model has a clear diagnostic value for DR, but it is influenced by many factors that deserve further study.
Systematic review registration: https://www.crd.york.ac.uk/prospero/, identifier CRD42023389687.
1 Introduction
Diabetic retinopathy (DR) is one of the leading causes of blindness among middle-aged and older people worldwide (1, 2). According to international standards, DR is mainly divided into nonproliferative diabetic retinopathy (NPDR) and proliferative diabetic retinopathy (PDR) based on the condition of the fundus. As a common complication of diabetes, it is estimated that up to 30% of diabetic patients will eventually develop various types of DR (3), and 10% of diabetic patients are at risk of blindness (4).
Fundus color photography plays a key role in the screening of DR, which has traditionally relied on the clinical experience of ophthalmologists or retinal specialists who comprehensively evaluate the patient’s condition through routine ophthalmology examination, fundus scope, optical coherence tomography (OCT), and other methods. However, as DR is an insidious disease, most patients are not consciously aware of the existence of the disease, especially those living in areas with underdeveloped medical facilities, making it challenging for ophthalmologists to make an accurate and timely diagnosis of the patient’s condition from fundus color photography. In addition, ophthalmologists often adopt different intervention methods for DR patients with different disease states. Therefore, in order to delay the occurrence and development of DR, reduce the blinding rate, and improve the quality of life of patients, it is necessary to accurately distinguish the various types of DR at an early stage of the disease.
As deep learning technology has advanced in recent years, the application of artificial intelligence (AI) in the medical field is receiving increasing attention. It involves the analysis and evaluation of image-related data through the establishment of relevant databases and application models, and information processing (5). In the field of ophthalmology, AI is widely used in DR, age-related macular degeneration (AMD), glaucoma, cataract, and other diseases (6), and fully autonomous diagnostic systems have already been developed (7). As a potential method to assist clinical ophthalmologists in the diagnosis and treatment of DR, one of the obvious advantages of AI is its high diagnostic accuracy. Studies have shown that the accuracy of DR diagnosis can reach up to 90% by using a deep learning mode (8–10), and 80% or above with a machine learning model (11–13). Therefore, AI can effectively relieve the pressure on ophthalmologists by conducting mass image screening and improve their efficiency of ophthalmologists in the diagnosis and treatment of related diseases and complications, thus solving the problem of insufficient medical resources and promoting the comprehensive development of blindness prevention and treatment strategies. At present, diagnostic meta-analyses on the accuracy of DR detection by AI have mainly focused on a specific algorithm (14, 15). Additionally, most studies are based on the mining of publicly available datasets, which lack verification in the real world. Although these datasets are not updated in time, they are repeatedly cited in many meta-analyses. Moreover, in previous meta-analyses, most of the included studies were retrospective studies, which may cause bias in the real world setting. The present meta-analysis will be systematically investigated the performance and application status of AI in diagnosing DR based on fundus color photographs in the real world in the last five years. Furthermore, the factors that might affect the diagnostic effect of AI through subgroup analysis will be explored. Our results can further validate the role of AI in clinical decision making.
2 Materials and methods
2.1 Search strategy
Two reviewers (KL and SM) searched relevant prospective studies in the Cochrane Library, PubMed, Embase, Web of Science, and The Institute of Electrical and Electronics Engineers (IEEE) databases over the last 5 years. Each of the other reviewers re-evaluated whether the search strategy was appropriate and whether the included literature was consistent with the research purpose. The terms of our search were as follows: (“Diabetic Retinopathy” OR “Diabetic Retinopathies” OR “Retinopathies, Diabetic” OR “Retinopathy, Diabetic”, then combined these items using AND with “Artificial intelligence” OR “machine learning” OR “deep learning” OR “neural network”) AND (“diagnosis” OR “screen” OR “classification” OR “discriminate”) AND (“performance” OR “sensitivity” OR “specificity” OR “accuracy” OR “area under the curve” OR “auc”). The meta-analysis was conducted following the PRISMA (16) (Supplementary Table S4).
2.2 Study selection and eligibility criteria
Criteria for inclusion in the meta-analysis were: (1) the study was a diagnostic study; (2) the subjects were type 2 or type 1 diabetic patients with DR; (3) the diagnostic measure was AI technology, and DR was diagnosed from fundus color images; (4) the study was complete with available data on sensitivity (SE), specificity (SP), number of patients and controls, and other outcome indicators; (5) prospective research in the last 5 years. Exclusion criteria: (1) Diagnostic measures do not belong to AI technology and no AI-related algorithm was used; (2) studies with duplicate data and incomplete original data; (3) studies with incomplete or inaccessible outcome indicators. ZW and ZL selected the studies independently according to the inclusion and exclusion criteria above. If there was a difference of opinion among the reviewers, a joint consultation was held with a third reviewer (XZ) before making a decision. Here are populations, interventions, comparators, outcomes, and study designs (PICOS) in our study. Population of our research comes from type 2 or type 1 diabetic patients with DR; interventions: patients with DR are diagnosed by AI technology.; comparators: patients with DR are diagnosed by clinical doctors;.study design: the study was a diagnostic study.
2.3 Data extraction
After obtaining the full articles, two reviewers (ZW and ZL) independently summarized the features of the included studies and extracted outcome indicators related to the diagnostic efficacy of AI from each study. We addressed divergence between the two reviewers’ data extraction by discussion and consultation with a third investigator (KL). Reviewers directly extracted SE, SP, and number of DR patients and total participants from the included studies. These indicators were used to calculate the outcome variables for the diagnostic meta-analysis, namely true-positives (TP), false-positives (FP), false-negatives (FN), and true-negatives (TN), which were then entered into contingency tables, followed by subsequent meta-analysis. If a study contained different types of DR or different algorithms, and there were multiple contingency tables, we assumed that they were independent of each other.
2.4 Quality assessment
To assess the quality of the included Studies, two investigators (SM and XZ) used Quality Assessment of the Diagnostic Accuracy Studies 2 (QUADAS-2) (17) and RevMan 5.3. QUADAS-2 scale includes four bias risk assessment parts, namely patient selection, index test, reference standard, and flow and timing. Each part has two or three questions. If all the answers were “Yes”, that part was considered as low risk. Additionally, patient selection, index test, and reference standard were also evaluated in terms of the clinical applicability. If the answers to these assessment parts were “low risk”, it indicates that the included studies are less biased.
2.5 Data synthesis and analysis
We used MetaDiSc software (version 1.4) for the outcome variables (TP, FP, FN, TN). Summary receiver operating characteristic (SROC) plots and coupled forest plots were used to visualize the merger results. The I2 test and Cochrane-Q test were used to evaluate heterogeneity caused by possible non-threshold effects in this meta-analysis. If I2>50%, it was considered as significant heterogeneity. Subsequently, bivariate random effects model was used to calculate the pooled sensitivity, specificity, area under the curve (AUC), diagnostic odds ratio (DOR), positive and negative likelihood ratios (LR+ and LR-, respectively), among which area under the SROC curve indicates the diagnostic value of AI for DR. In order to explore how categories of DR, source of patients, sample size, country, quality of included studies and images, and different algorithms can influence the merged results, we performed subgroup analysis according to the above factors.
We used the midas package in STATA14.0 to conduct a sensitivity analysis of the included studies to explore the source of heterogeneity. Furthermore, the incidence rate of DR (30%) was taken as the prior probability, and the posterior probability was calculated according to the summarized LR+ and LR-. The results were visualized in STATA14.0 and displayed with fagan plots. We have assess publication bias by plotting Deek’s funnel plot. The funnel plot is asymmetric when significant publication bias is present. All statistical results were considered significant if the two-tailed p value<0.05.
3 Results
3.1 Selection and characteristics of the eligible studies
A flowchart of the literature search and study selection process is presented in Figure 1. Firstly, relevant studies were retrieved successively from the relevant databases according to the retrieval strategy, which yielded 2748 studies in total. Thereafter, duplicate studies, meta-analyses, reviews, conference files, studies whose full text could not be obtained, and studies whose title and abstract were inconsistent with the research content were eliminated. After the preliminary screening, we obtained 72 original studies. Next, we excluded studies that were not of interest, studies that were not prospective or cross-sectional, or had incomplete data for meta-analysis. Finally, 21 studies were used for quantitative synthesis of the meta-analysis (18–38). Table 1 summarizes the outcome variables included in the study. The population included in the study was selected from the real world from cross-sectional or prospective studies, thus avoiding bias due to case-control studies. Among them, seven, 17, five, and four studies evaluated any DR, referable DR (RDR), more-than-mild DR (mtmDR), and vision-threatening DR (VTDR), respectively. In addition, 19 studies included patients from the clinic, seven from the general community, and seven from the ordinary population. We explored the algorithm used by each study for diagnosing DR, image quality, region where the study was conducted, and sample size (Table 1). Table 2 summarized additional data about the patients, such as sex, age, type of diabetes, diabetes duration, co-morbidities and soon. The study was registered in the PROSPERO (CRD42023389687).
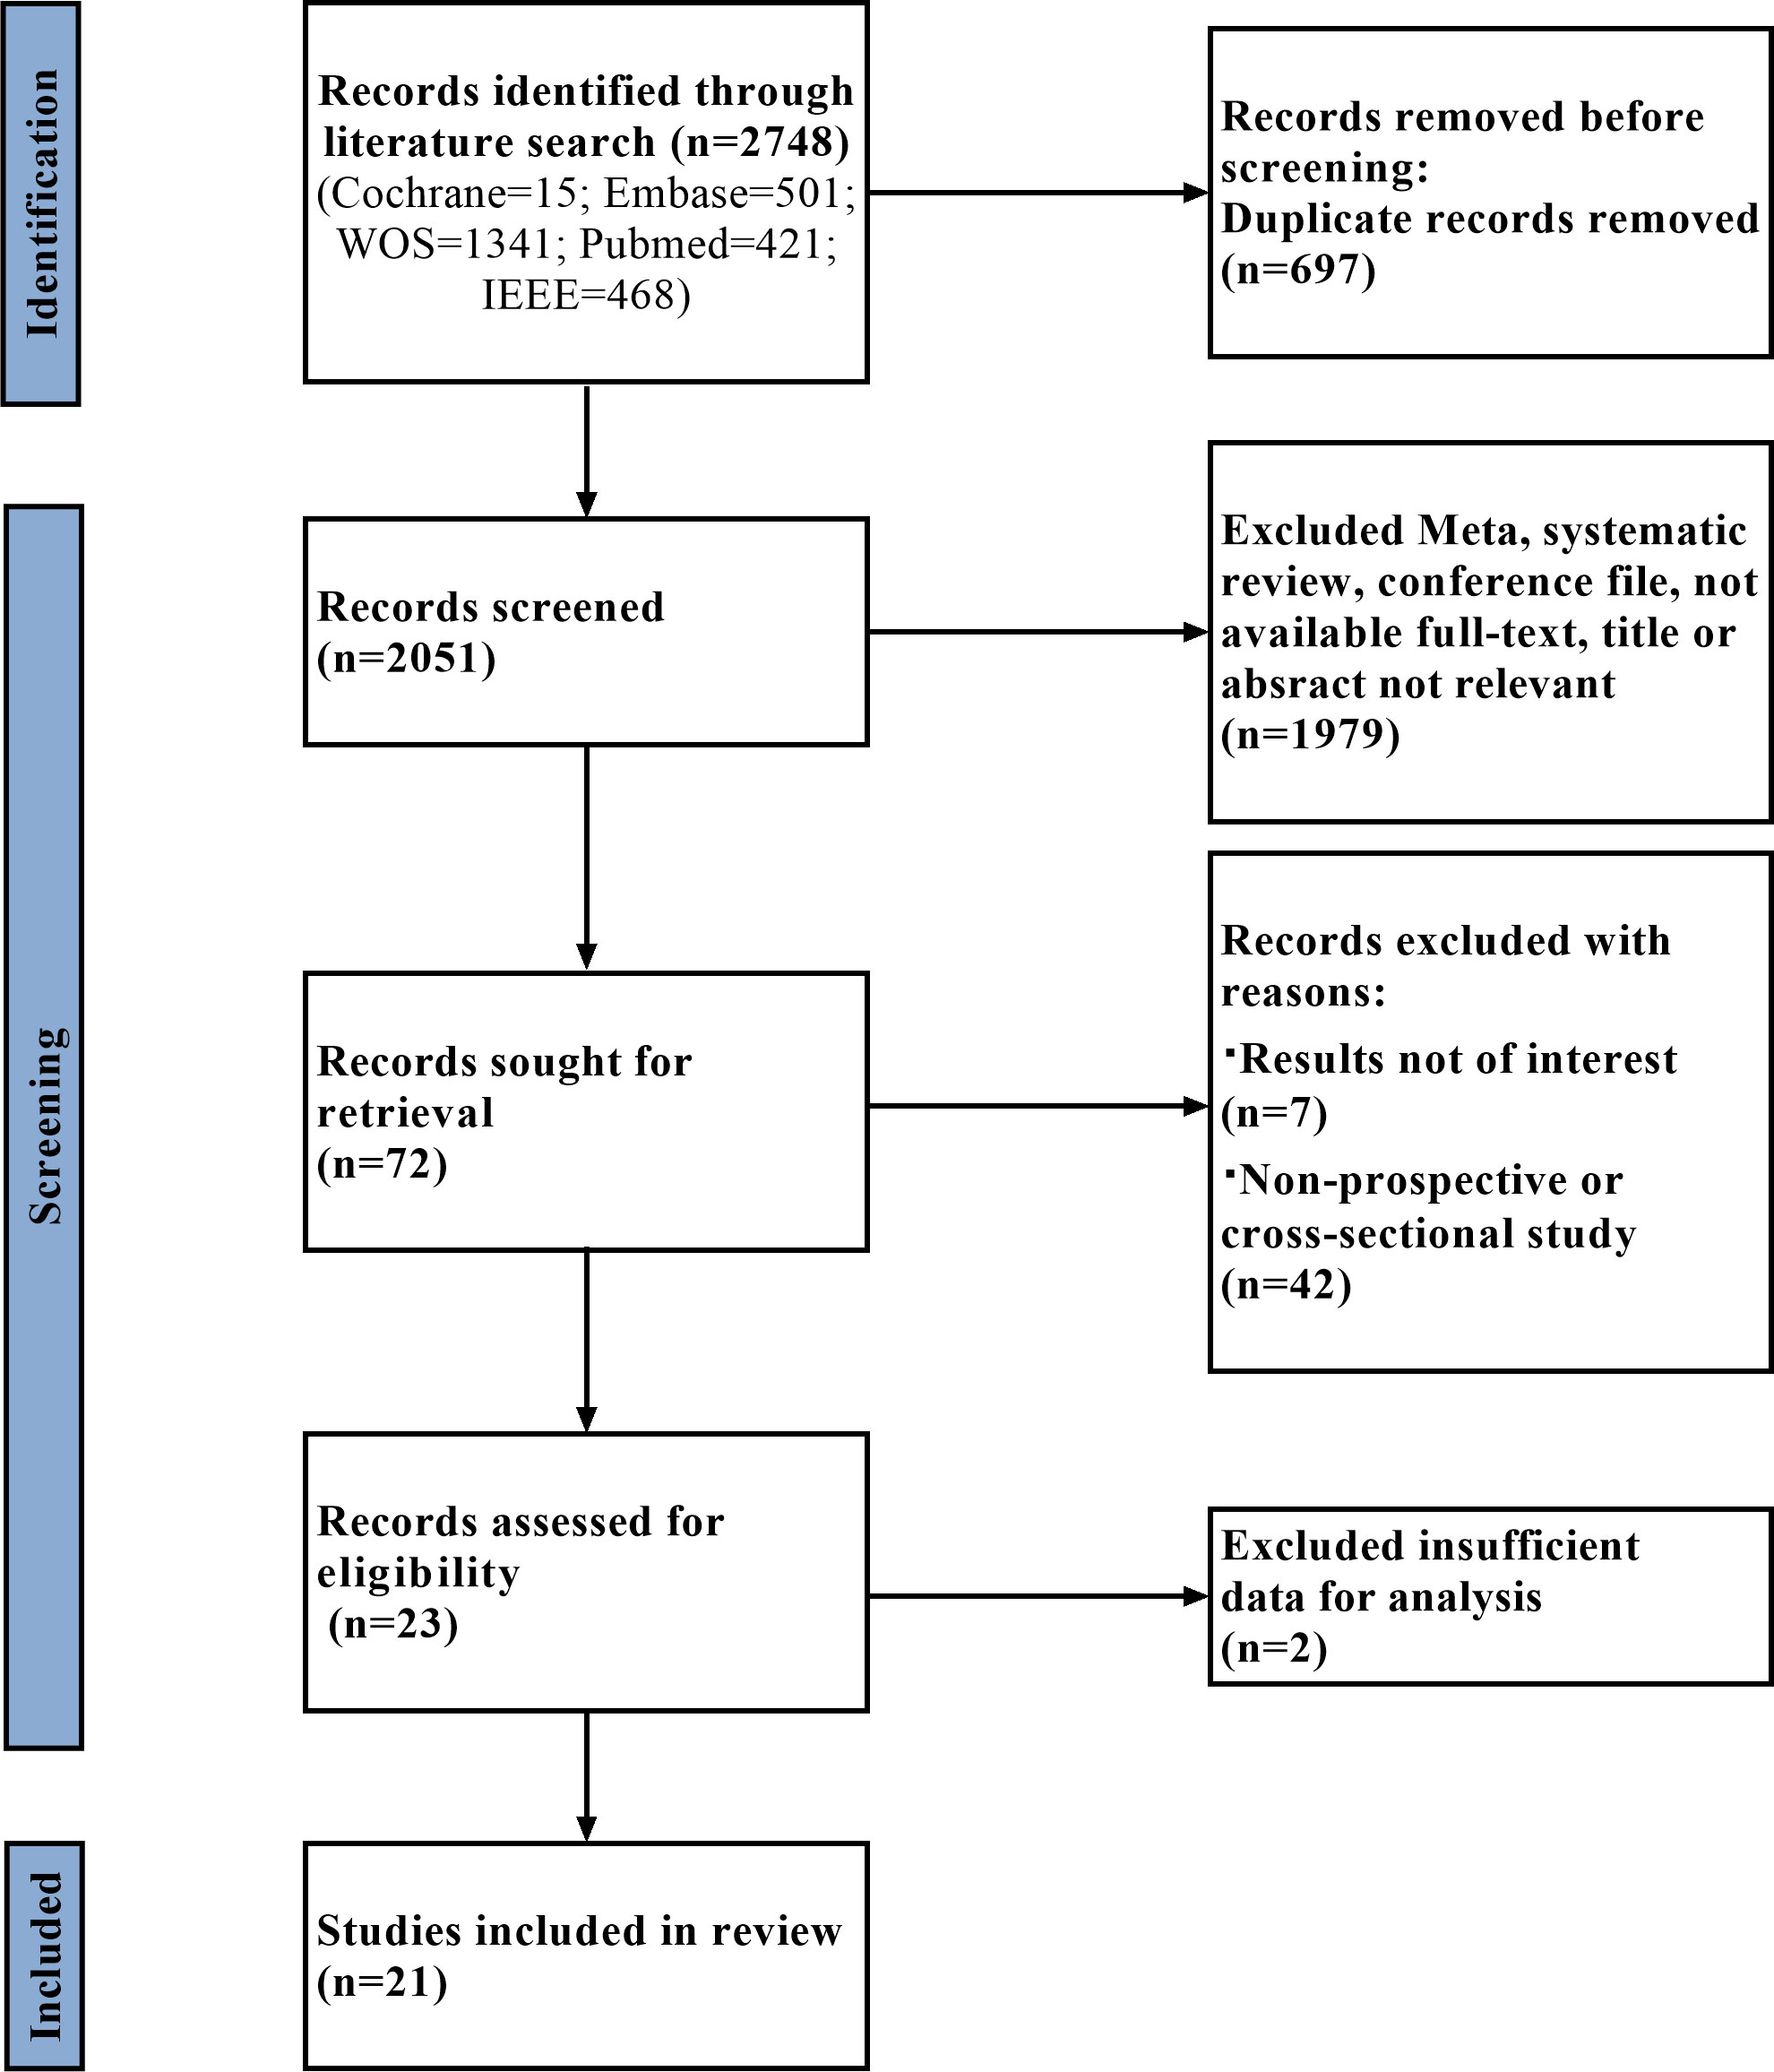
Figure 1 Flow diagram of literature selection.
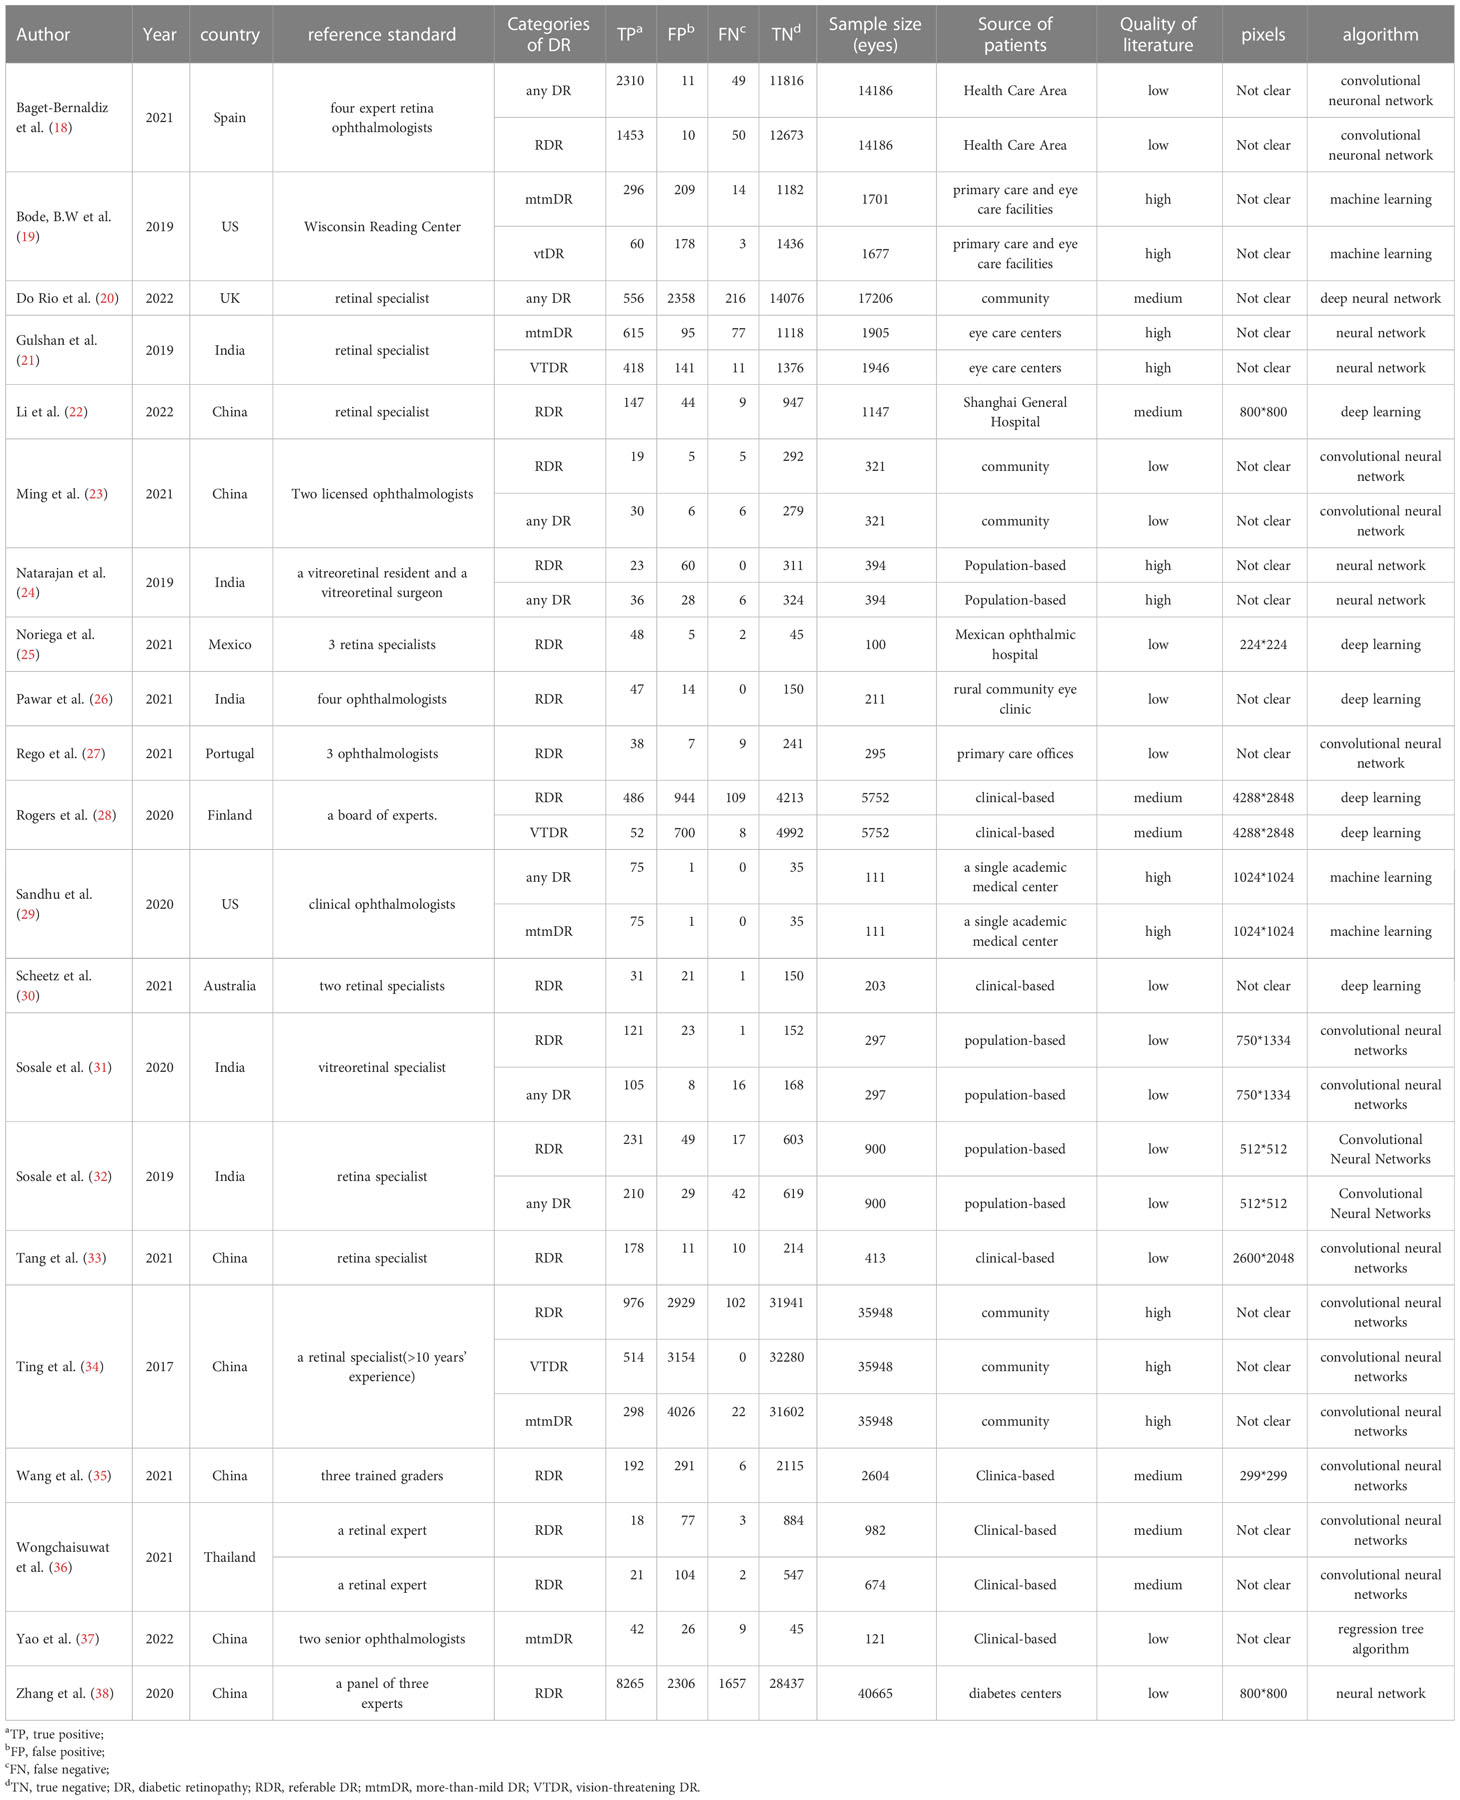
Table 1 Summary of the data obtained from the included studies.
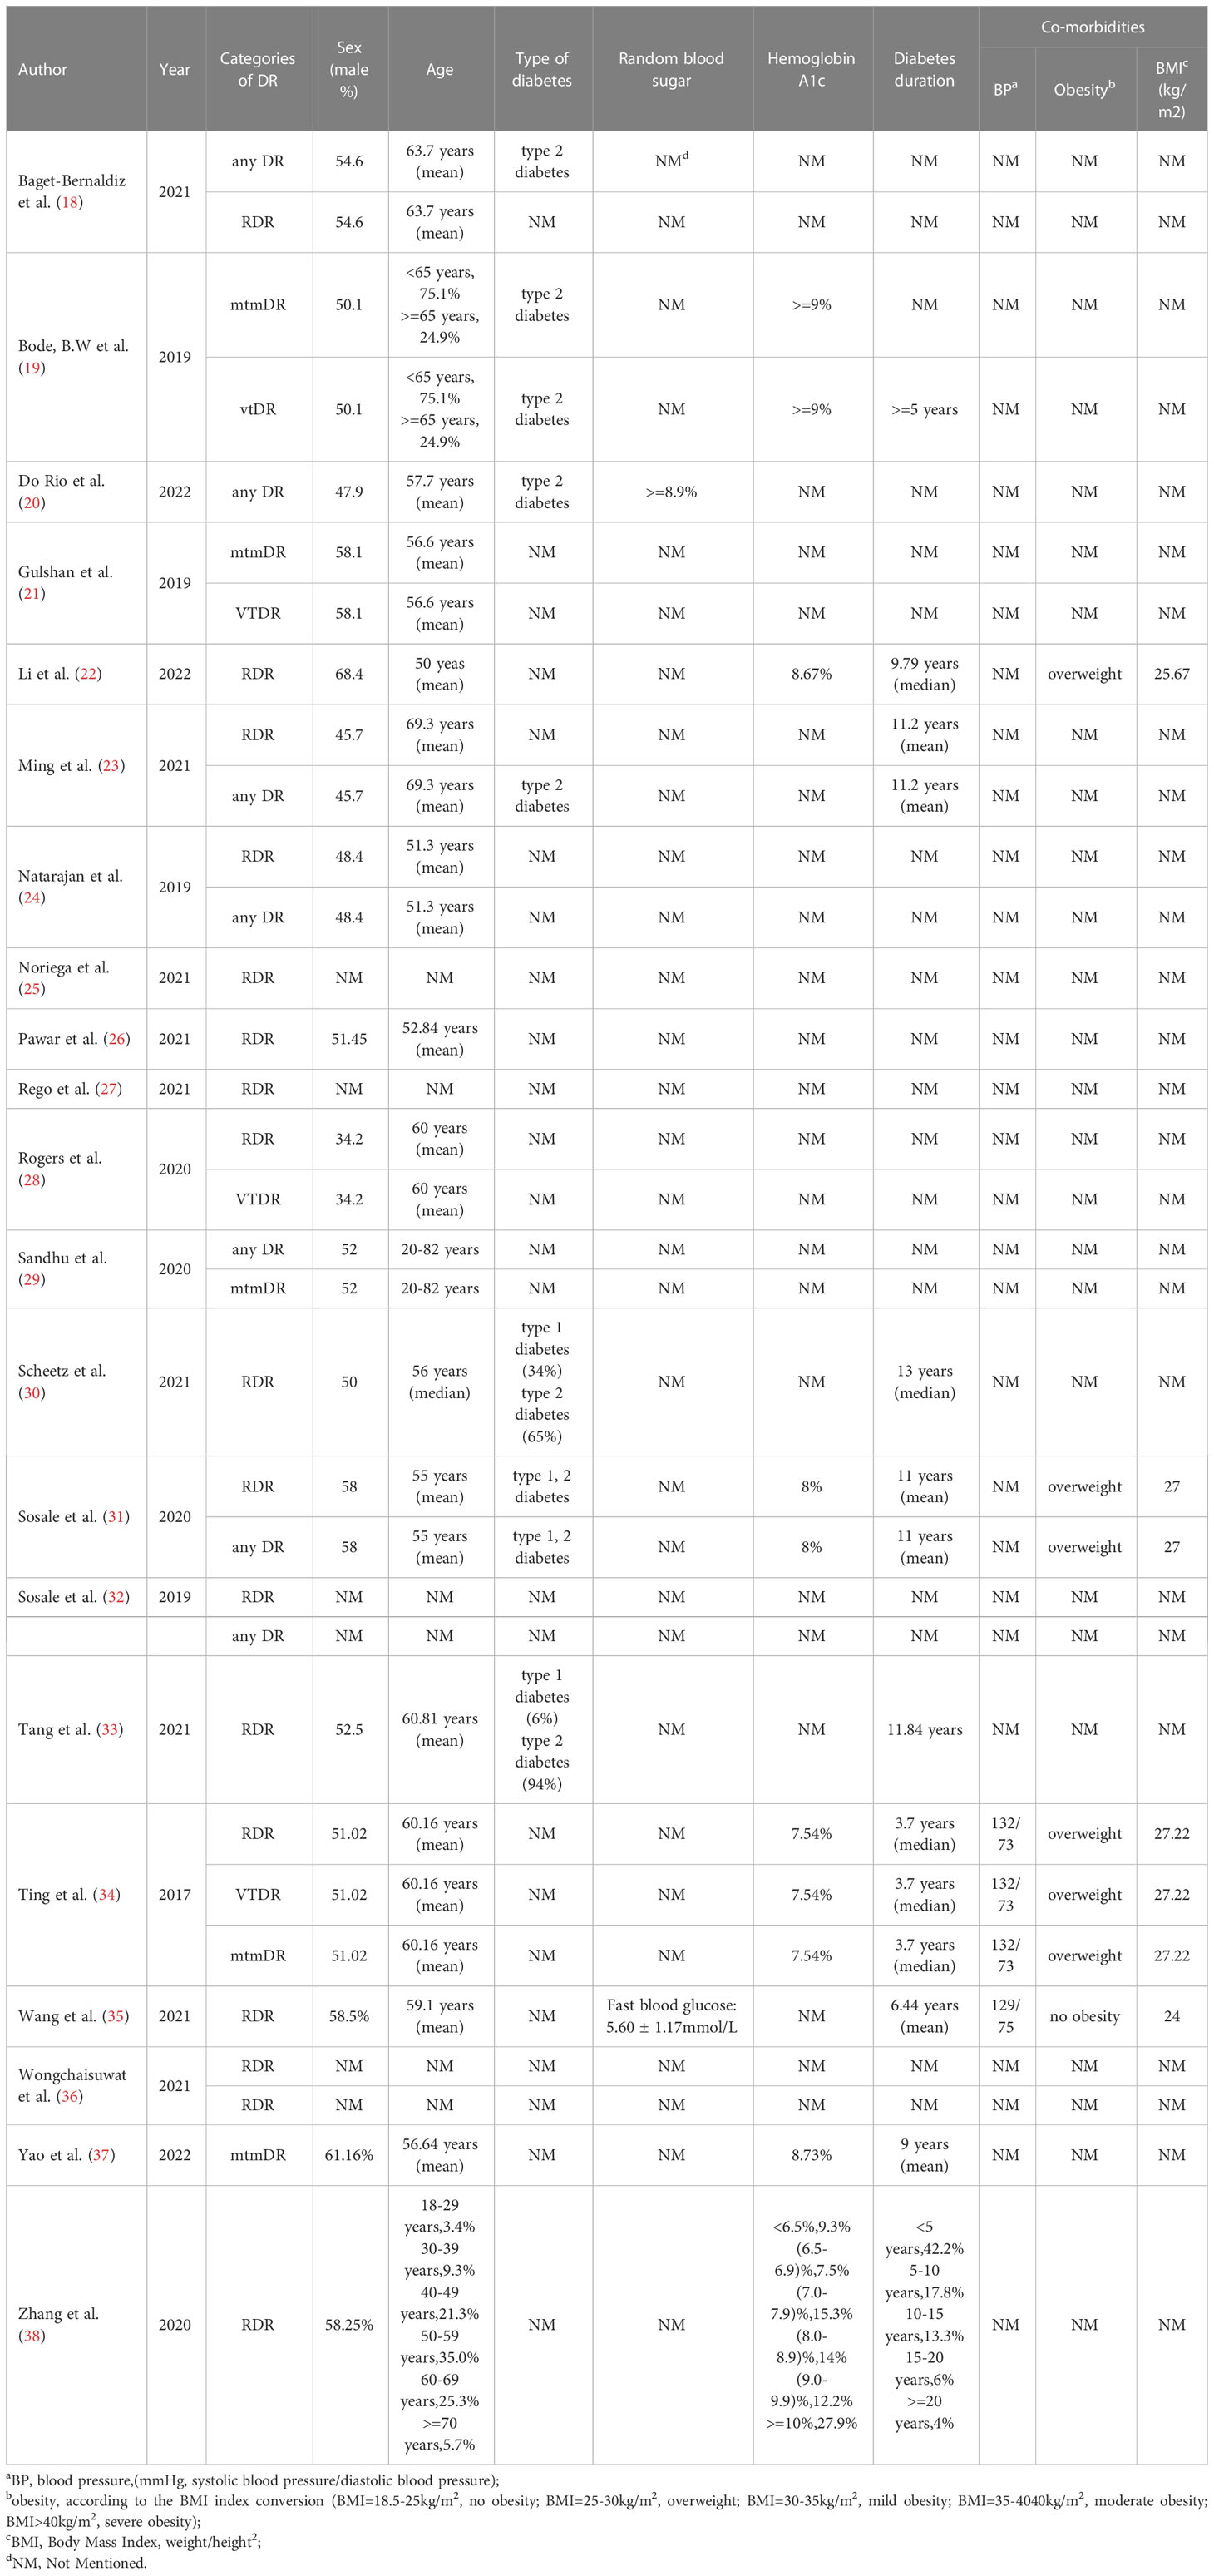
Table 2 Summary of additional characteristics of the included studies.
3.2 Quality assessment
Figures 2, 3 show the summary chart and bar chart, respectively, for quality evaluation of the included studies, and Supplementary Table S1 shows the process of quality evaluation using QUADAS-2. We found that seven studies answered no in patient selection, all studies performed well in the index test, and nine studies did not provide clear information for evaluating the reference standard. The included studies performed poorly in evaluating the flow and timing of patient selection; additionally, when evaluating patient selection, index test, and reference standard, all studies showed low risk with regard to clinical applicability concerns, indicating the high credibility of this meta-analysis.
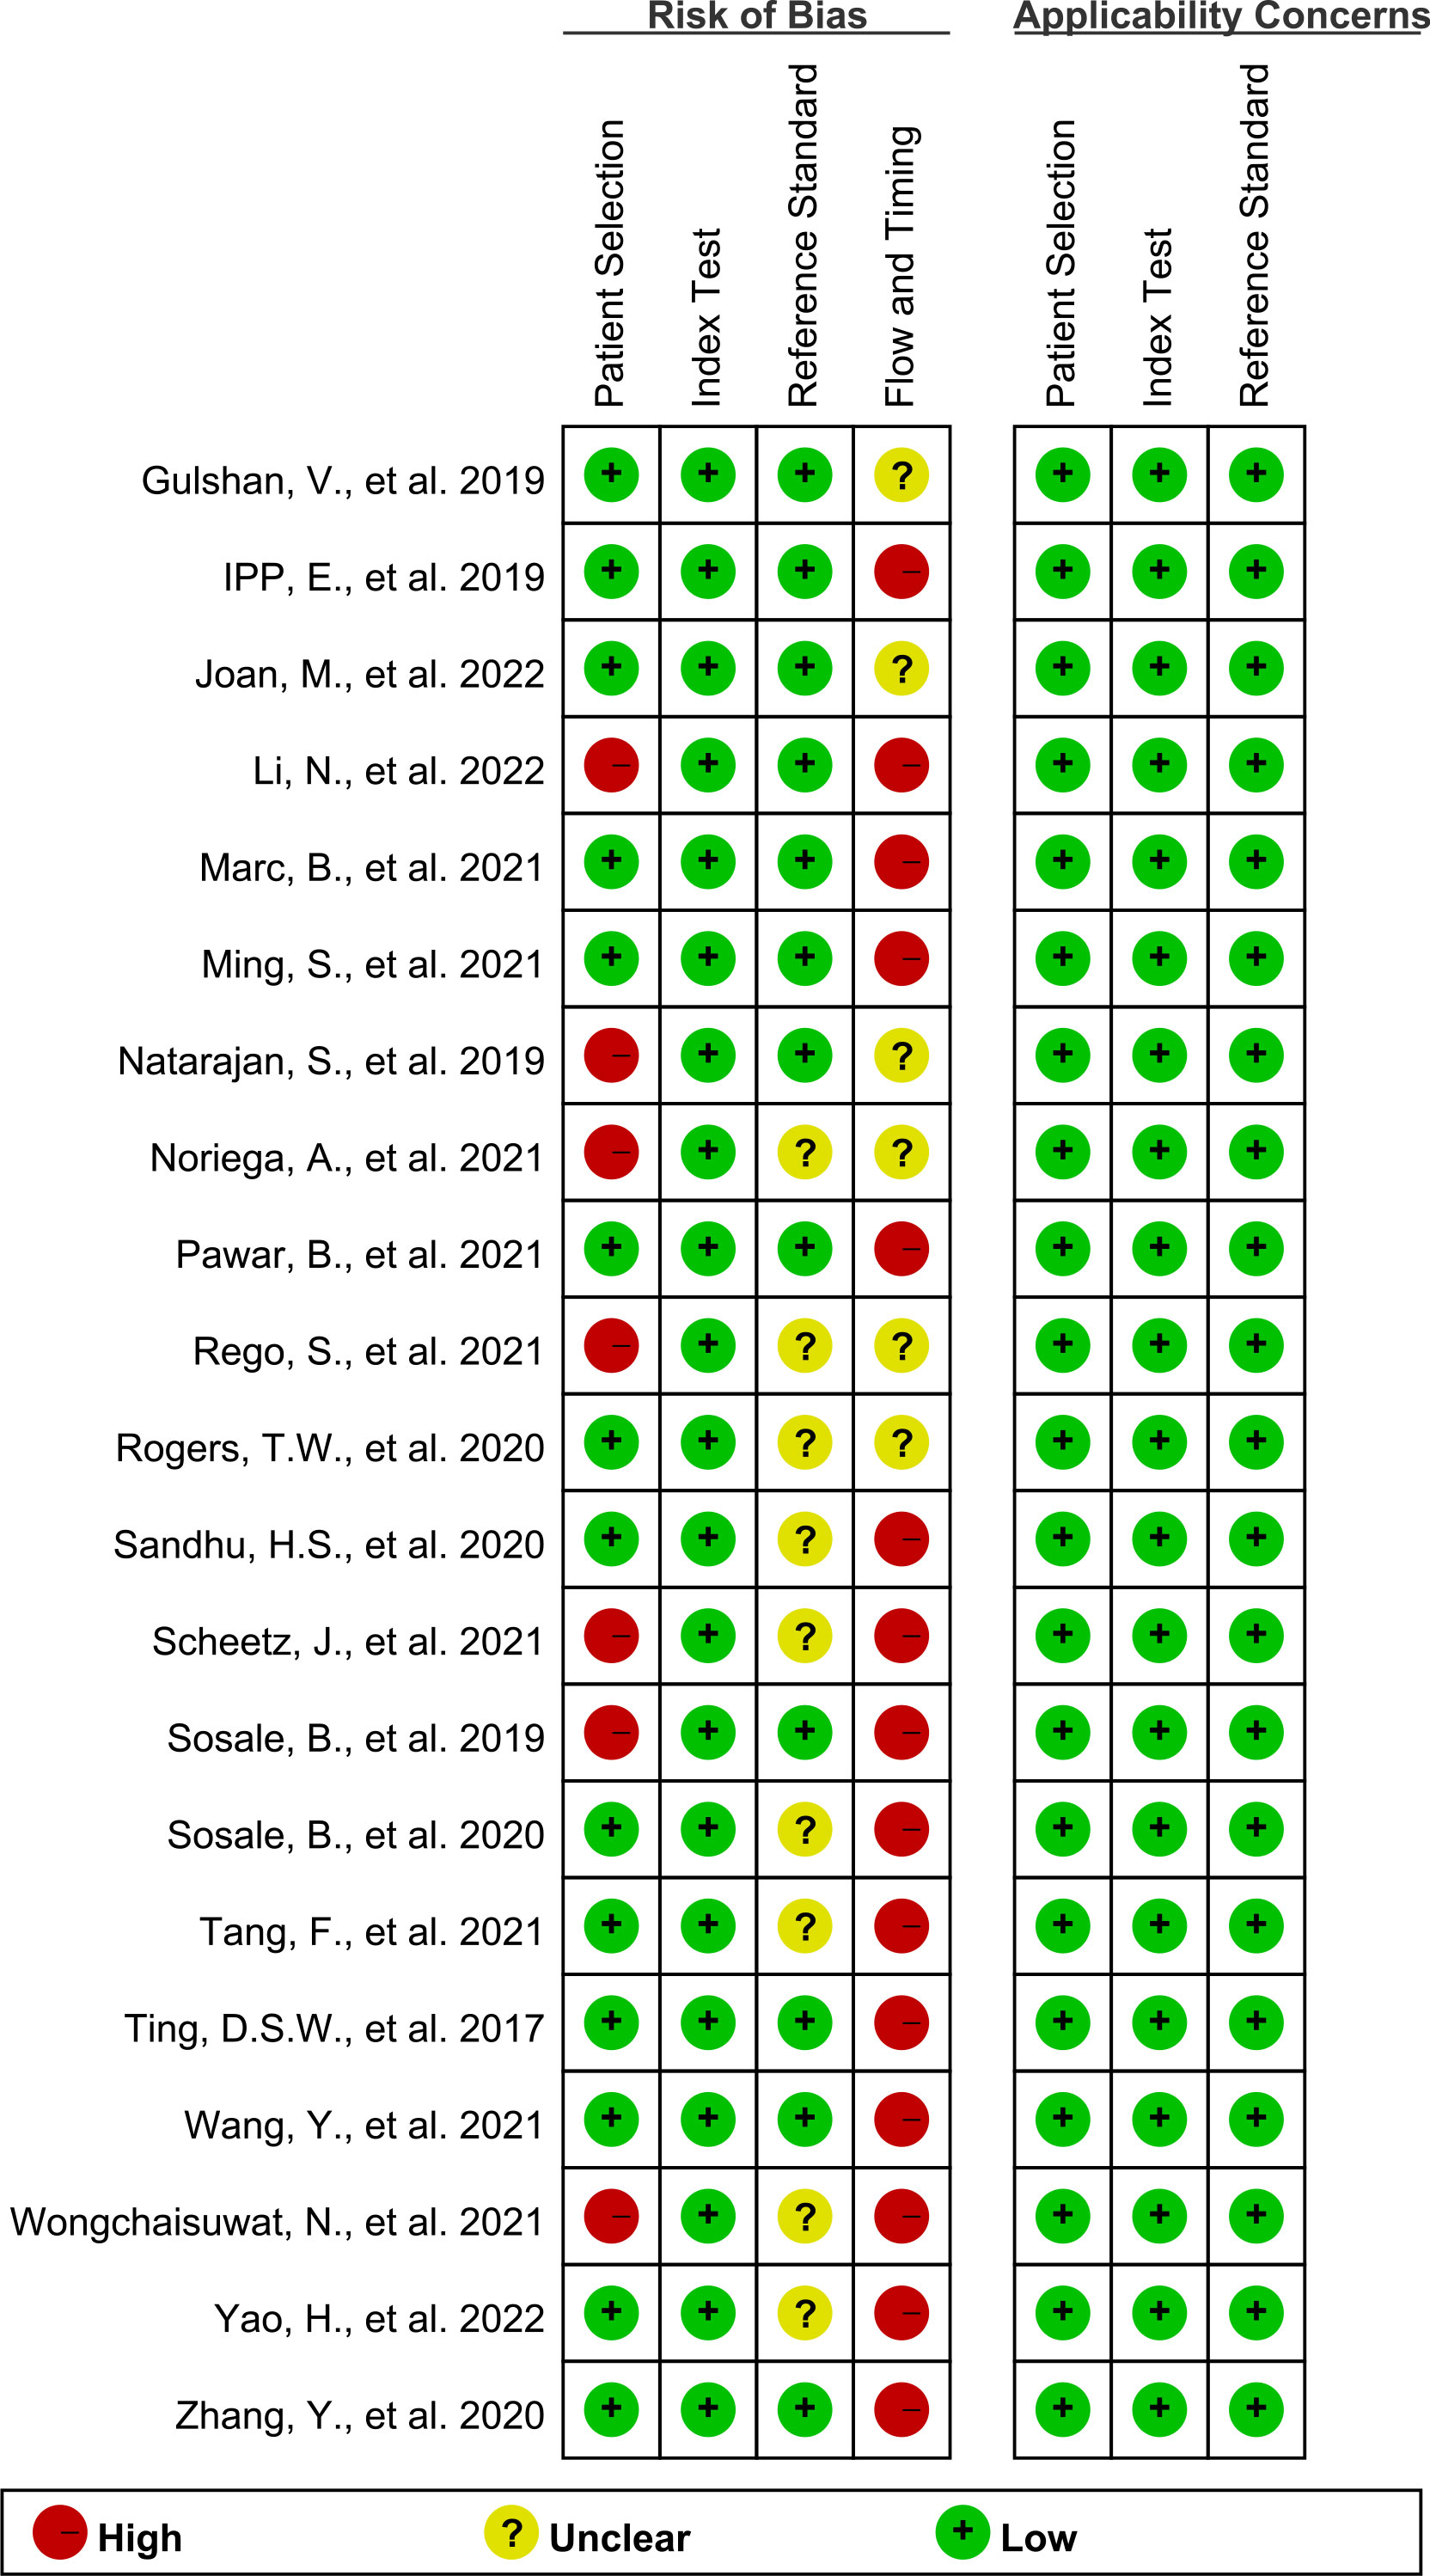
Figure 2 QUADAS-2 summary plot of bias risk assessment.
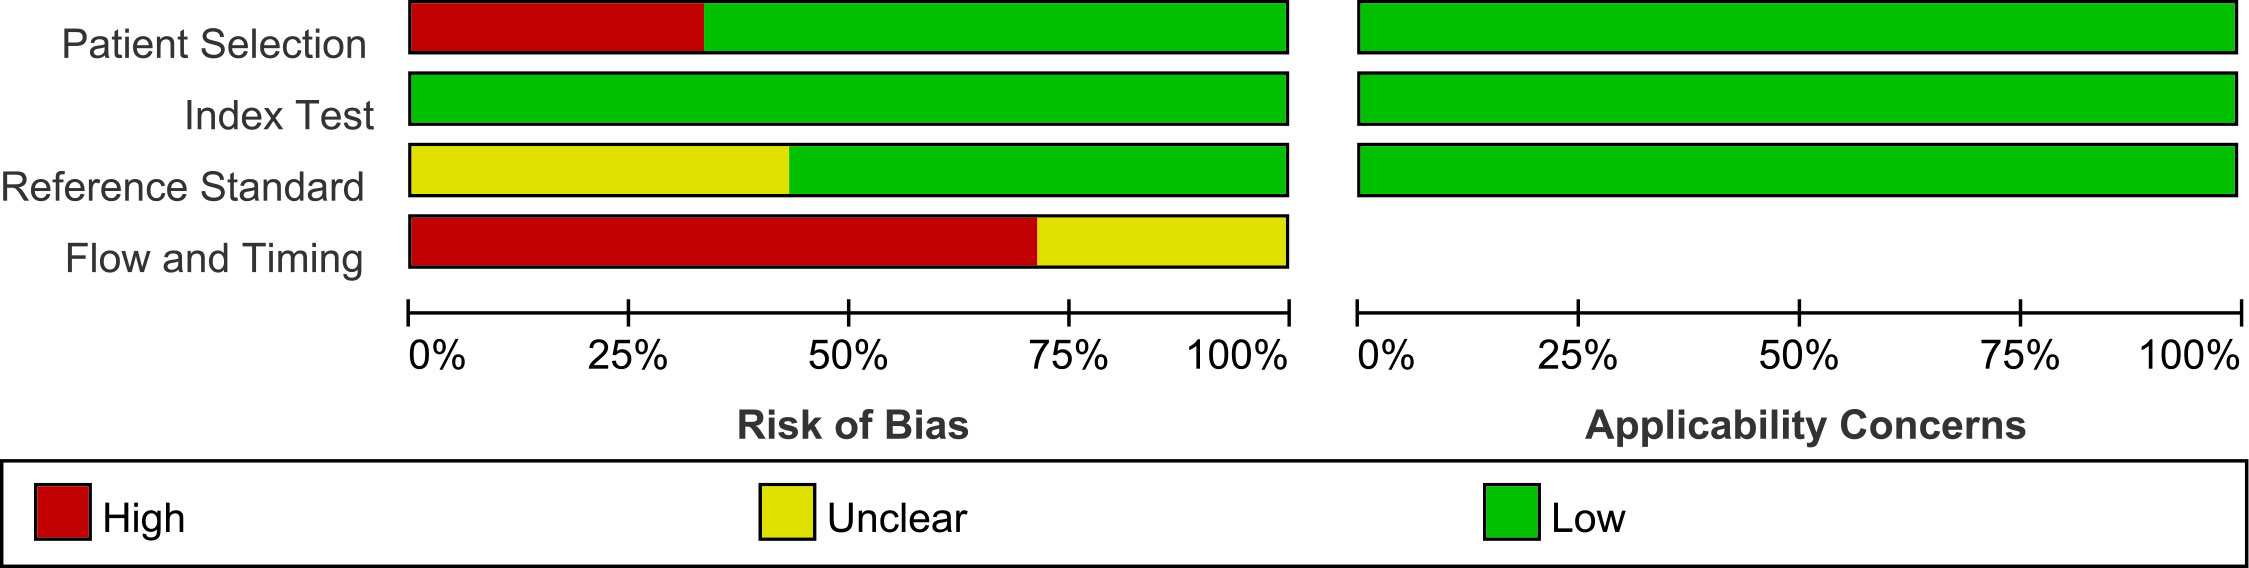
Figure 3 QUADAS-2 bar plot of bias risk assessment.
3.3 Threshold analysis and heterogeneity test
The data were imported into MetaDiSc software (version 1.4) for analysis. It was found that the spearman correlation coefficient between the sensitivity logarithm and (1-specificity) logarithm was 0.001 (p=0.996>0.05), which was not significant. Therefore, there was no threshold effect (Supplementary Table S2) in this study. We then combined the DOR of all studies, and the Cochrane-Q test showed Cochrane-Q=1437.57, P=0.000<0.01, indicating that heterogeneity was caused by the non-threshold effect in this study. Moreover, the SE, SP, LR+, LR-, and DOR were all greater than 50% (Table 3). The above results show that heterogeneity existed between the studies, and may be related to the population, age, algorithm, and literature quality. Consequently, a random effects model (REM, DerSimonian-Laird method) was adopted to synthesize the above five indicators.
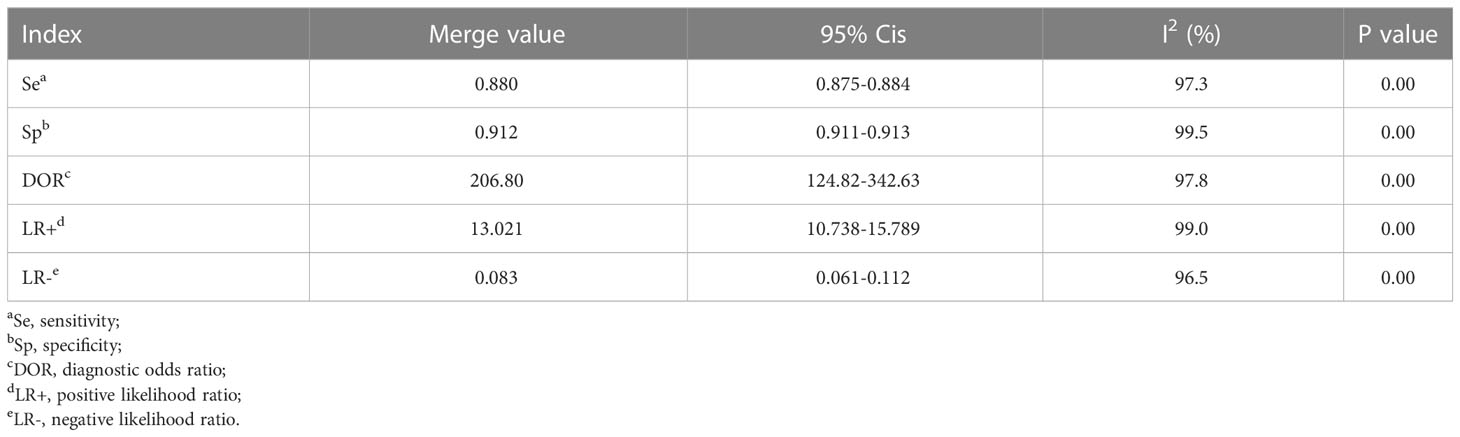
Table 3 The combined predictive value of all included studies.
3.4 Synthesis of results
MetaDiSc software was used to analyze the included data. The pooled SE was 0.880 (0.875-0.884), pooled SP was 0.912 (0.99-0.913), pooled LR+ was 13.021 (10.738-15.789), pooled LR- was 0.083 (0.061-0.112), combined AUC=0.9798, Q index =0.9388, and pooled DOR was 206.80 (124.82-342.63). Corresponding (SROC) plots and coupled forest plots are shown in Figure 4; Table 2, respectively. For further analyzing the diagnostic efficacy of AI in diagnosing any DR, 0.3 was set as the pretest probability. On drawing fagan nomogram (Figure 5), it was found that the positive post-test probability was 93% and negative post-test probability was 3%. Next, we grouped all included studies in accordance with categories of DR (any DR/RDR/mtmDR/VTDR), patient source (clinical-based/community-based/population-based), country (non-Asia/Asia), sample size (<5000 eyes/>5000 eyes), quality of literature (low quality/medium quality/high quality), image pixels (<1000*1000/>1000*1000), algorithm (convolutional neural network/machine learning/neural network/others [deep learning, regression tree algorithm]), and performed subgroup analysis. The results are shown in Table 4, and the SROC plot of each subgroup is shown in Supplementary Figures S1-S7.
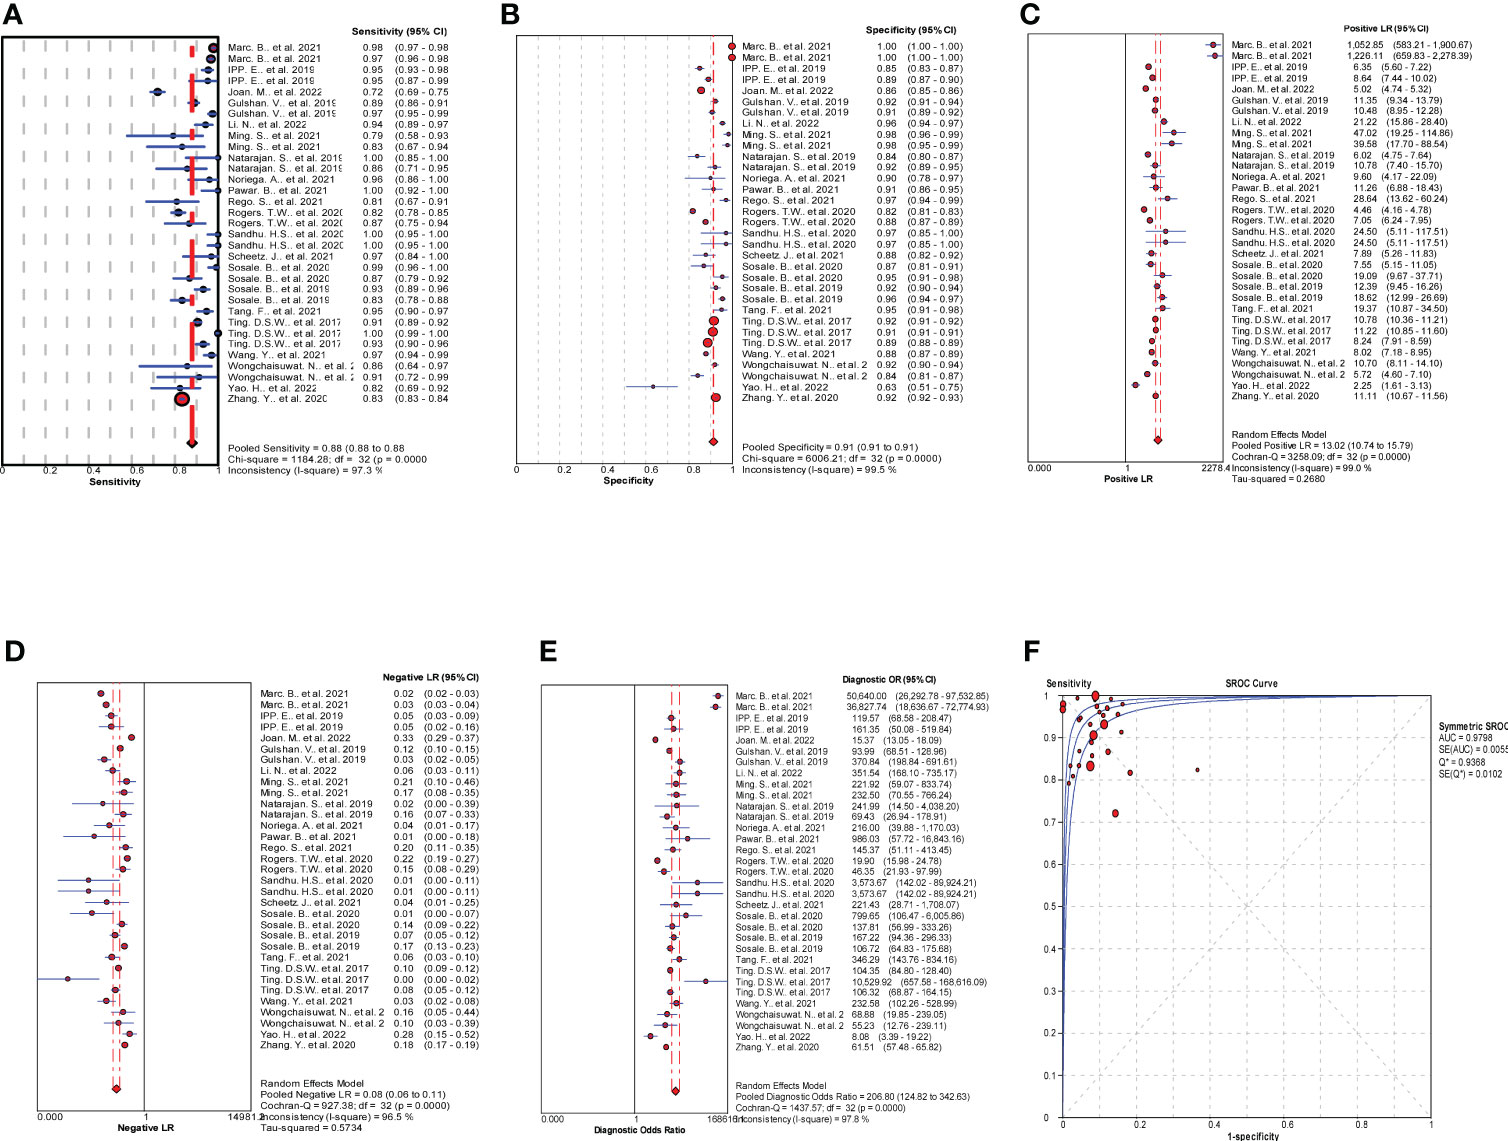
Figure 4 Results of meta-analysis and forest plots of all the included studies. (A) Forest plot of pooled Se. (B) Forest plot of pooled Sp. (C) Forest plot of pooled positive likelihood ratio (LR+). (D) Forest plot of pooled negative likelihood ratio (LR-). (E) Forest plot of pooled diagnostic odds ratio (DOR). (F) Summary receiver operating characteristic (SROC) plots.
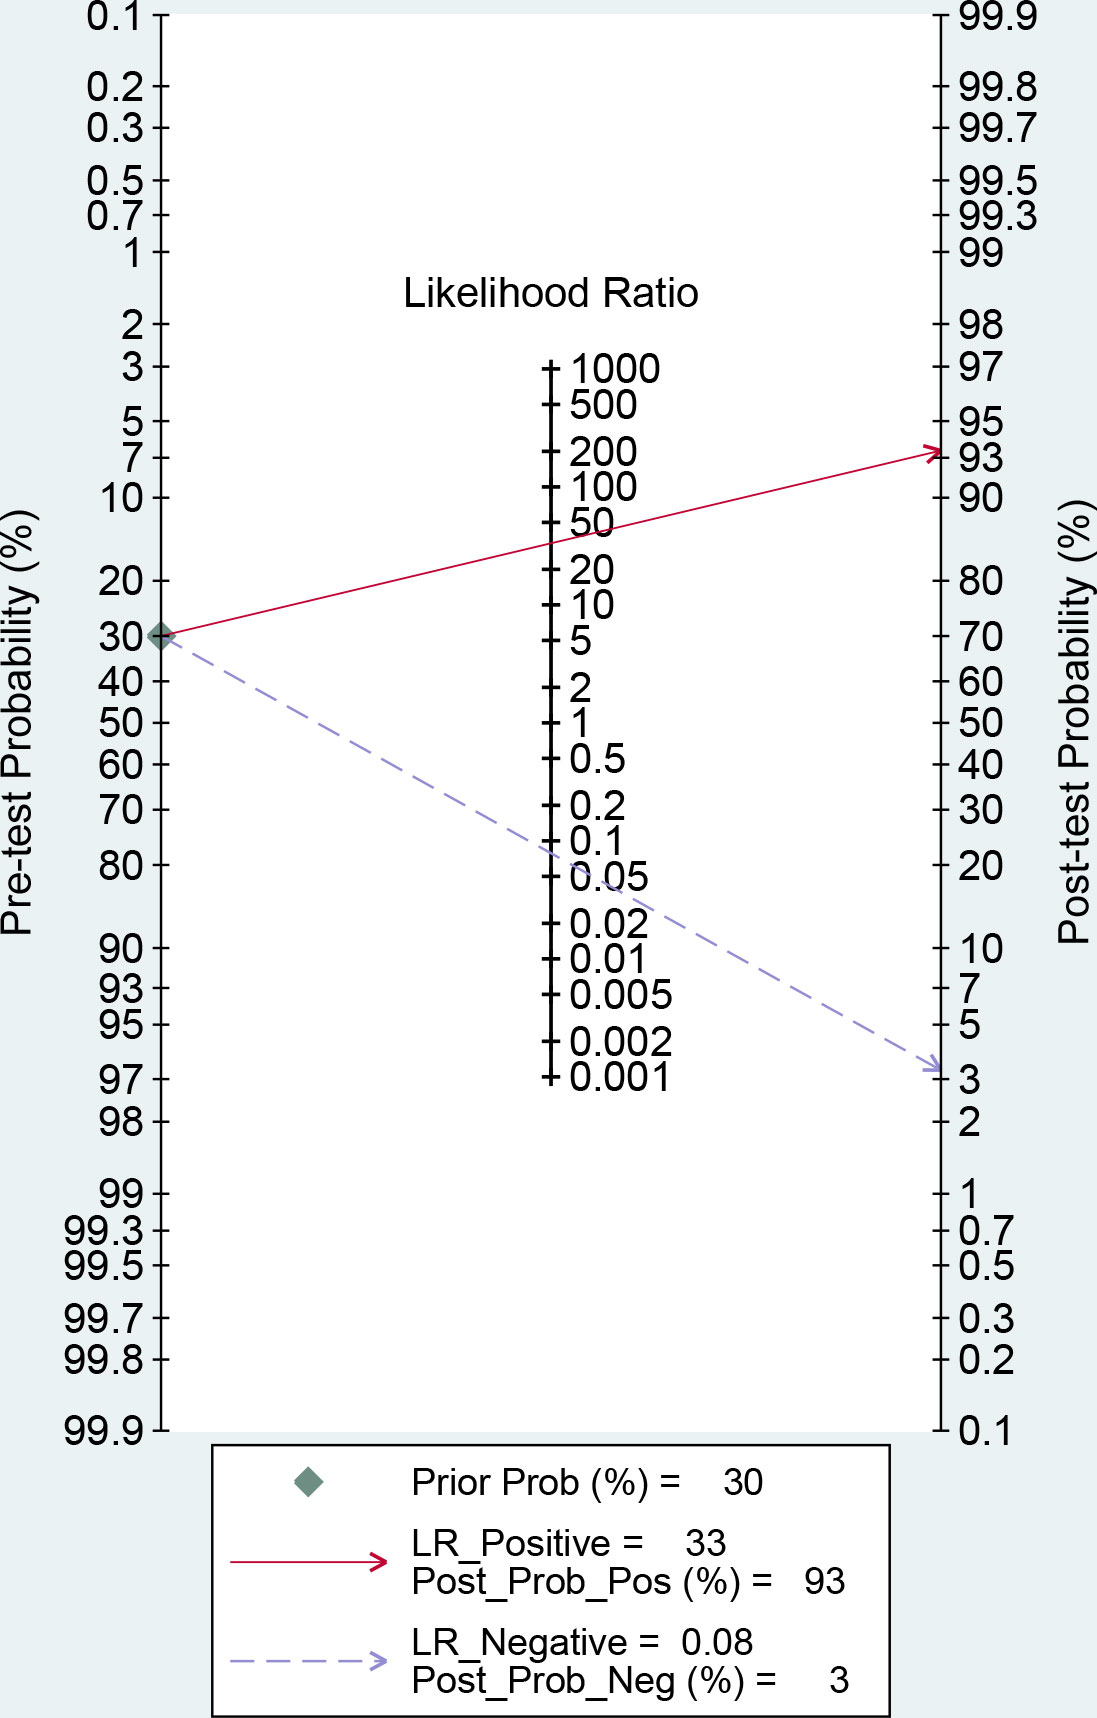
Figure 5 Fagan nomogram of artificial intelligence (AI) for the diagnosis of any diabetic retinopathy (DR).
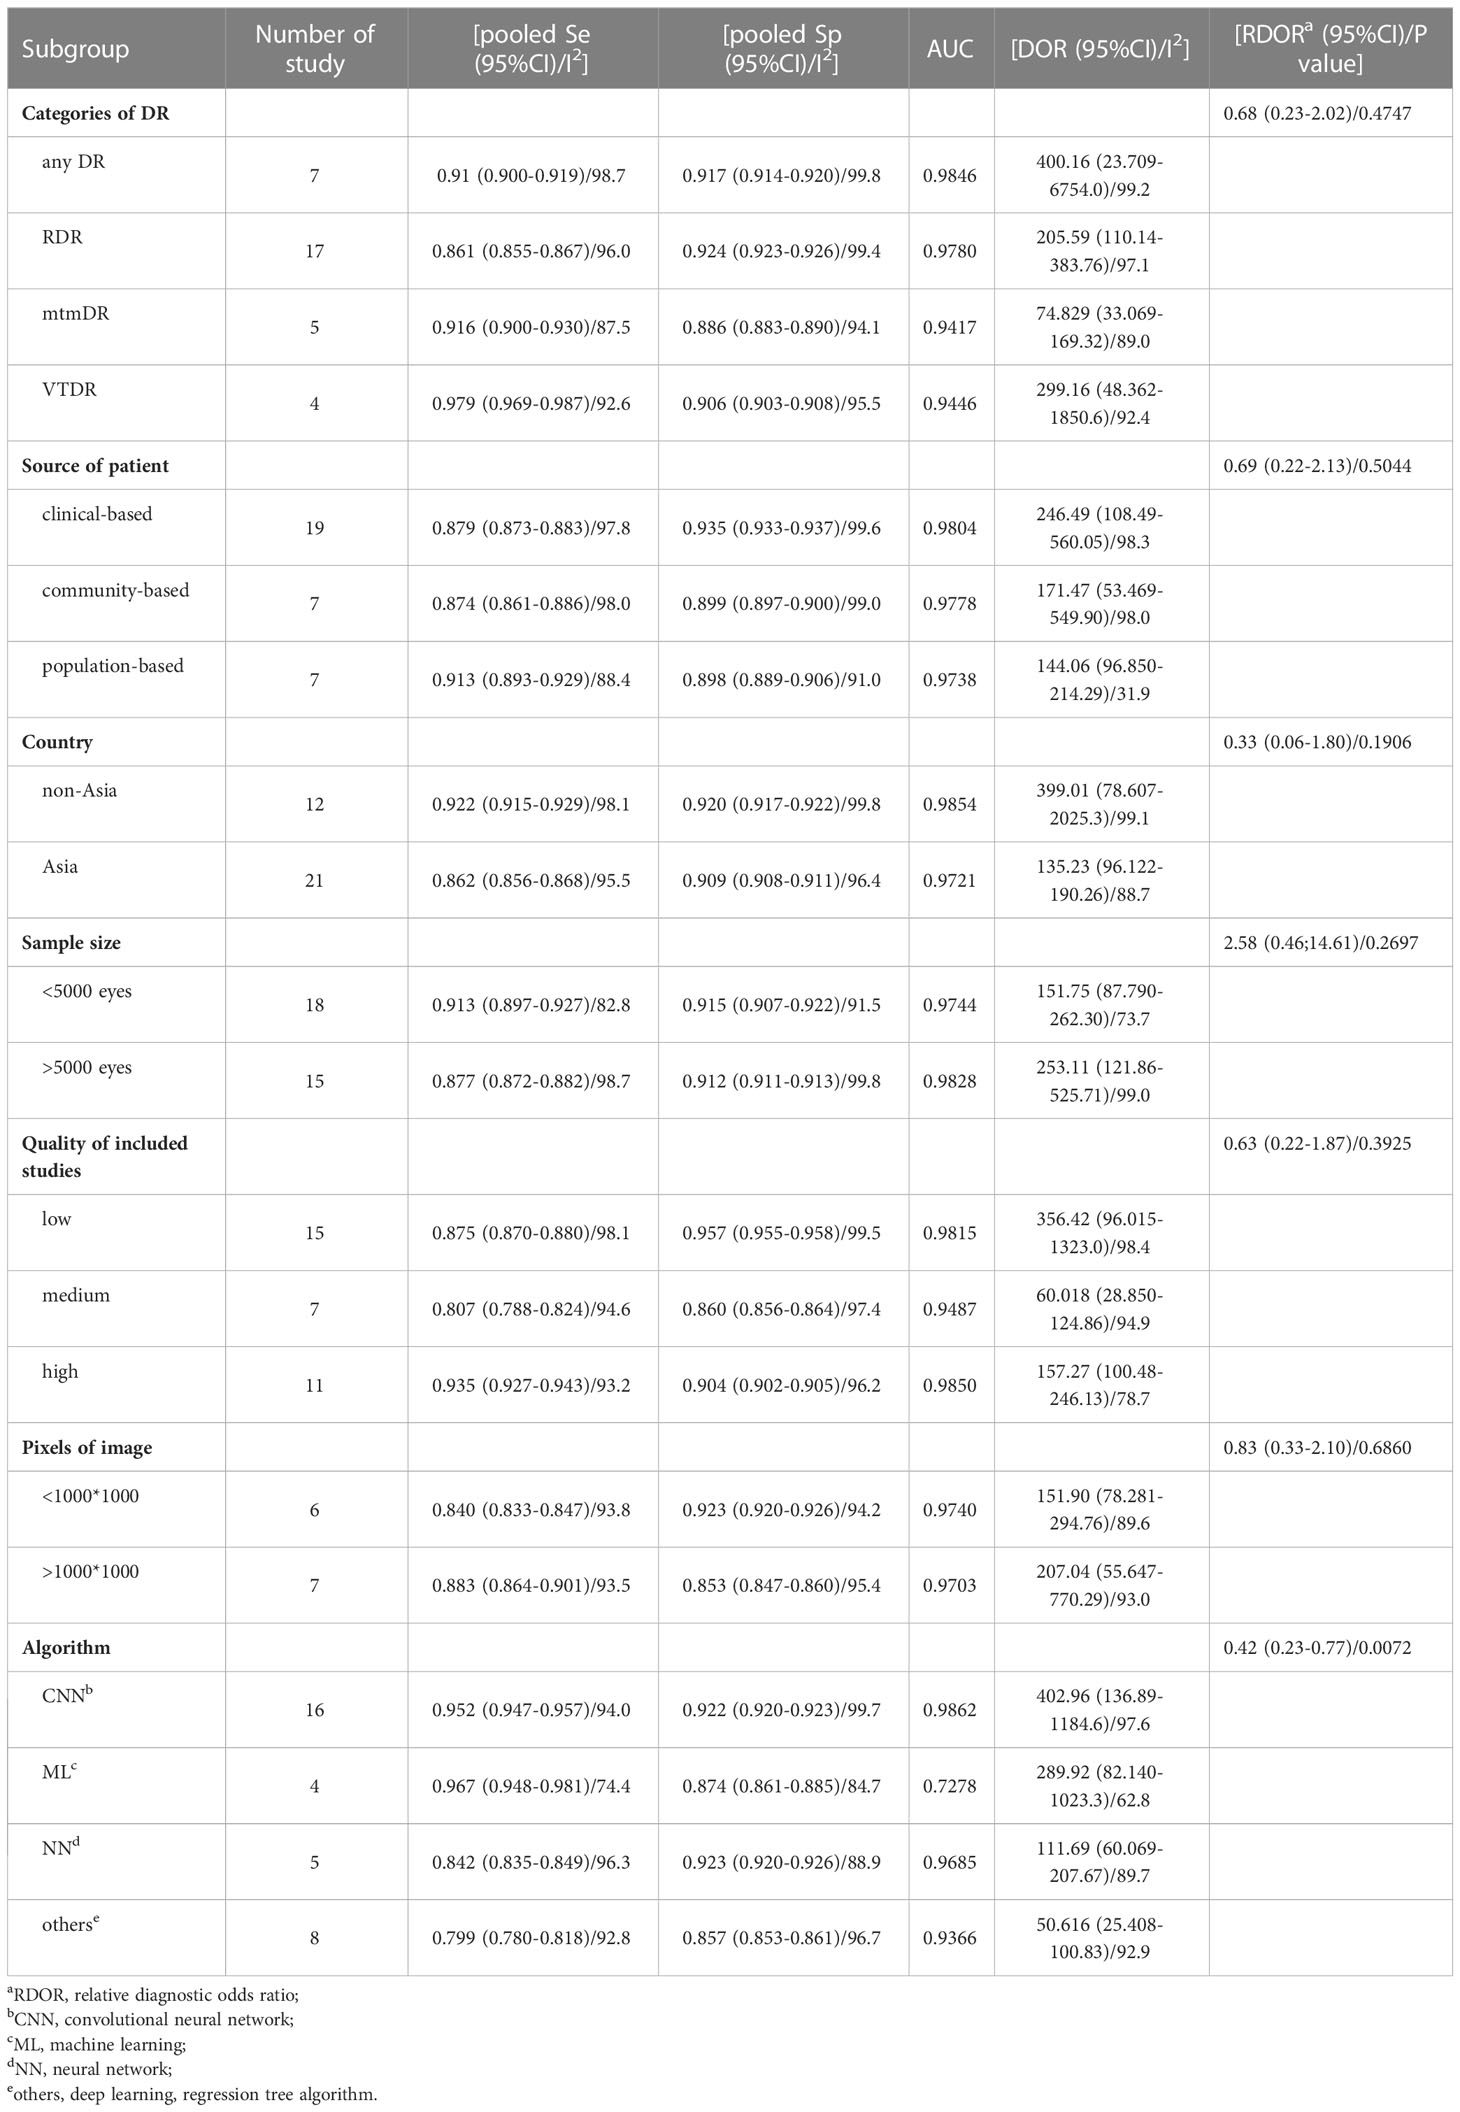
Table 4 Results of subgroup analysis.
3.5 Meta regression and sensitivity analysis
To explore the source of heterogeneity, we performed meta regression according to the conditions of subgroup analysis using MetaDiSc software. We found that the p value of the algorithm term was 0.033<0.05, indicating that when different AI models are uses to diagnose DR, the algorithms used by the different models may be the source of heterogeneity. The results are shown in Table 5. STATA 14.0 was selected for conducting the sensitivity analysis. It can be clearly seen in Supplementary Figure S9 that there were three original studies with strong sensitivity and the results did not differ significantly. The deleted results are shown in Supplementary Figure S8 and Supplementary Table S3. Other original studies did not demonstrate obvious sensitivity. Overall, the results of our study were stable.
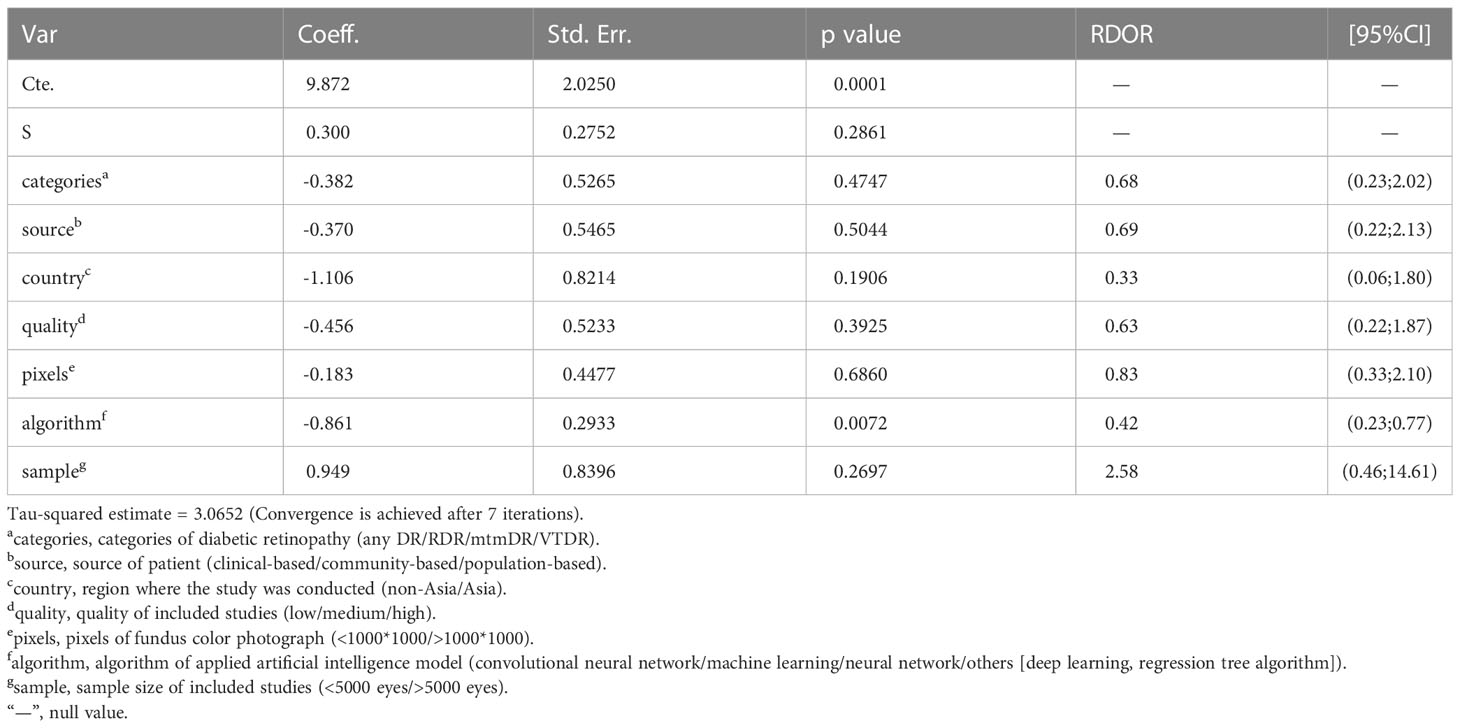
Table 5 Meta regression of included studies.
3.6 Publication bias
STATA 14.0 was used to first conduct a publication bias test for all data included in the study, followed by a publication bias test for different categories of DR. The results are shown in Supplementary Figure S10. For all the included studies, p value was 0.84>0.05, which means that there was no publication bias in this study, based on the symmetry of the funnel plot.
4 Discussion
In recent years, several studies have investigated the use of AI for the assessment of incidence and diagnostic accuracy of DR. Meanwhile, the application of AI in the medical field is being continuously developed and subdivided (39). However, due to the different image quality of fundus color photos, algorithms used by AI models, and performance of cameras used in different studies, the AI diagnostic effect varies significantly among different studies (40, 41). Our study is the first meta-analysis to include all prospective studies and use multiple algorithms to evaluate the diagnostic efficacy in DR, rather than only deep learning or machine learning. Firstly, relevant studies were retrieved from medical databases according to the retrieval strategy, and the retrieved studies was screened according to the existing guidelines for diagnostic reviews (42) to ensure the rigor of the study. In the final meta-analysis, we included a total of 21 original studies, involving 129,759 eyes. All studies were conducted in the real world, avoiding the bias caused by retrospective studies.
There was no threshold effect in this analysis, but the heterogeneity among studies was high. Therefore, the random effects model was used to combine all indicators. DOR and AUC were the main indicators to judge the relationship between the diagnostic results and DR. The pooled DOR=206.80 and AUC=0.9798 for all included studies indicated that AI had a high diagnostic performance for DR. In order to make the study results more clinically relevant, we drew fagan plots and concluded that if AI showed a positive result based on fundus color photography, the probability of the patient having DR was 93%. If the AI diagnosis was negative, the patient had a 3% chance of DR.
To explore the source of heterogeneity, we conducted meta regression, and found that the differences in AI algorithms may be the source of heterogeneity. To further explore the factors influencing the AI diagnosis of DR, we performed a subgroup analysis. We found that studies with patients from clinics, hospitals, or medical research centers had higher diagnostic efficacy than those with patients from other sources, and this may be because patients from hospitals or medical research centers are more representative, and retinopathy can be diagnosed more accurately by clinicians with a lower error rate; besides studies from non-Asian countries had higher diagnostic efficacy than studies from Asian countries, and we believed that this is because non-Asian countries have carried out artificial intelligence algorithm diagnosis DR for a long time, trained the algorithm more times, had a large data set, included more cases, and had relatively high data quality. Moreover, we have found that the greater the number of eyes included in the study, the higher the diagnostic efficacy. We hypothesized that the more cases included, the more times the algorithm would be trained, so the more accurate the diagnosis would be. When the image pixel was taken as the standard to judge the image quality, it was found that the higher the image quality, the higher the DOR value of the diagnostic result, which is similar to the findings of Yip et al. (43). When the algorithm was taken as a subgroup for analysis, the diagnostic effectiveness of the convolutional neural network (CNN) algorithm was significantly higher than that of other algorithms. CNN is the most widely used in the field of medical imaging, which approximates the work efficiency and reliability of experienced clinicians (44). We also found that when the included studies were of high quality, the heterogeneity was significantly lower than when studies were of lower quality. The high diagnostic performance of the above results maybe the result of the large number and high representativeness of the included studies. This may be because high-quality research used more training of AI models, and clinical trials are better arranged, scientific, and include more representative cases, so the results are more reliable.
Several studies have found that for screening, risk stratification, management, and prognosis of DR, the effect of AI cannot be ignored. Firstly, an AI-based automated system can improve the efficiency and coverage of DR diagnosis and treatment, since the traditional DR diagnosis and treatment process only relies on a pattern of manual identification, which is easily affected by the experience, skills, and other factors related to the ophthalmologist or relevant technical personnel; therefore, the efficiency of DR screening is relatively low (45). Secondly, DR Patients in remote areas can miss the opportunity to undergo timely treatment due to the lack of skilled ophthalmologists (46). The application of AI in telemedicine can solve this problem (41). Thirdly, it can help clinicians to develop appropriate treatment strategies based on the individual disease of the patients. Clinically, proliferative diabetic retinopathy (PDR) patients are usually treated with laser, intravitreous injection of anti-vascular endothelial growth factor (VEGF), or corticosteroid drugs (47). If the above treatment is given at an early stage to patients with non-proliferative diabetic retinopathy (NPDR) due to an incorrect diagnosis, it will not only waste medical resources, but may also cause serious complications (48). Moreover, studies have shown that AI-based DR screening is more cost-effective than manual grading, and may help in providing cost-effective, convenient, and effective medical services (49).
As a novel diagnostic tool, there are still many problems with AI: (1) Although AI is getting better at diagnosing eye diseases, in our study, the false negative rate (FNR) was 12% and false positive rate FPR was 8.8%, which cannot be ignored. Further exploration of imaging features, increasing the sample size of the training set and test set, or further improving the performance of the algorithm are all feasible methods to solve these problems (43). (2) At present, the models established by various AI algorithms are still considered “black box”. This model lacks “explanatory ability” for the diagnosed diseases, that is, it cannot provide the reasons for the diagnostic results to clinicians (50, 51). (3) Since most current studies have detected DR through fundus imaging, the results may not be applicable to other eye diseases and imaging methods.
The ophthalmologist will play an important role in judging the clinical value of emerging AI technologies, in addition to a guiding role in integrating complementary imaging information with clinical data to provide more complete diagnostic information (52). Even if AI can diagnose DR independently, the ophthalmologist will eventually have to issue a report and take legal risks (53); therefore, legislation is required to clarify the respective scope of responsibility between doctors and companies providing AI services, which may also promote the popularization of AI diagnostic services. What is satisfactory is that currently both doctors and patients have a positive attitude towards the diagnostic efficacy of AI (54, 55), which may lay a foundation for their subsequent cooperation.
This study has the following limitations: (1) the collected DR data lacked proliferative diabetic subtype or further classification of DR, which may affect the evaluation of the diagnostic value; (2) some studies lacked four-grid table data or contained a small number of samples; therefore, the diagnostic value of the representative algorithm may not be truly reflected; (3) In the meta regression, we did not further analyze patient information, such as age, sex, and duration of the disease, which may be a source of heterogeneity and need further study; (4) only English studies were included, which may cause a bias due to the lack of literature in other languages; (5) The gold standard is the decision made by an ophthalmologist or retinologist based on the fundus color image, which means that AI may not perform well on images that an ophthalmologist cannot recognize; (6) Most of the AI algorithm models used in studies are self-developed or debugged models. Since the researchers did not clarify the pre-training degree and learning amount of each model, we could not include these factors in the analysis; (7) there are problems with direct comparison of diagnostic accuracy. As can be seen from the high diagnostic accuracy of VTDR, the diagnostic accuracy differs between mild retinopathy and severe retinopathy. Therefore, the overall accuracy will change depending on the composition ratio of the disease stage of the image for accuracy verification. For example, if many of the accuracy verification images are of mild retinopathy, it is difficult to recognize the lesions, so false negatives increase and accuracy is predicted to decrease.
In conclusion, this meta-analysis suggests that AI-based fundus color imaging has a high predictive ability for DR. The diagnosis rate is much higher than the manual, method, which can contribute to the clinical development of the follow-up strategy or diagnosis and treatment plan and has a high practical application value. However, AI still has a certain rate of missed diagnosis and misdiagnosis, and is easily affected by the patient source, number and representativeness of sample, algorithm of the AI model, quality of images, use of cameras, and type of algorithm. Correspondingly, the performance of AI for diagnosis of DR can be further improved by obtaining more detailed patient data, collecting a large number of samples from multi-centers, deep mining of image features, optimizing AI algorithm architecture, and using high-resolution cameras for images. If the diagnosis and treatment strategies formulated by ophthalmologists are combined with AI, the work efficiency can be greatly improved and the utilization rate of medical resources can be increased, in addition to providing a more scientific and efficient way for early screening, diagnosis, and treatment of DR.
Data availability statement
The original contributions presented in the study are included in the article/Supplementary Material. Further inquiries can be directed to the corresponding author.
Author contributions
KL and SM were responsible for searching the studies in the databases. ZW and ZL designed the entire research idea, selected the appropriate studies after careful searching, and extracted the data from each study. SM and XZ completed the quality assessment. Final meta-analysis was completed by ZW. XZ and YD conceived the study and wrote the first draft. The four authors jointly revised the manuscript. All authors contributed to the article and approved the submitted version.
Funding
This study was supported by the National Natural Science Foundation of China (81600747), Project of Shenyang Science and Technology Department (21-173-9-52), Foundation of Liaoning Province Education Administration (QNZR2020010), and the 345 Talent Project of Shengjing Hospital of China Medical University.
Conflict of interest
The authors declare that the research was conducted in the absence of any commercial or financial relationships that could be construed as a potential conflict of interest.
Publisher’s note
All claims expressed in this article are solely those of the authors and do not necessarily represent those of their affiliated organizations, or those of the publisher, the editors and the reviewers. Any product that may be evaluated in this article, or claim that may be made by its manufacturer, is not guaranteed or endorsed by the publisher.
Supplementary material
The Supplementary Material for this article can be found online at: https://www.frontiersin.org/articles/10.3389/fendo.2023.1197783/full#supplementary-material
References
1. Tan TE, Wong TY. Diabetic retinopathy: looking forward to 2030. Front Endocrinol (2022) 13:1077669. doi: 10.3389/fendo.2022.1077669
2. Nebbioso M, Lambiase A, Armentano M, Tucciarone G, Sacchetti M, Greco A, et al. Diabetic retinopathy, oxidative stress, and sirtuins: an in depth look in enzymatic patterns and new therapeutic horizons. SURVEY OF Ophthalmol (2022) 67(1):168–83. doi: 10.1016/j.survophthal.2021.04.003
3. 10. microvascular complications and foot care: standards of medical care in diabetes-2018. Diabetes Care (2018) 41(Suppl 1):S105–18. doi: 10.2337/dc18-S010
4. Pradeepa R, Mohan V. Prevalence of type 2 diabetes and its complications in India and economic costs to the nation. Eur J Clin Nutr (2017) 71(7):816–24. doi: 10.1038/ejcn.2017.40
5. London AJ. Artificial intelligence in medicine: overcoming or recapitulating structural challenges to improving patient care? Cell Rep Med (2022) 3(5):100622. doi: 10.1016/j.xcrm.2022.100622
6. Benet D, Pellicer-Valero OJ. Artificial intelligence: the unstoppable revolution in ophthalmology. Surv Ophthalmol (2022) 67(1):252–70. doi: 10.1016/j.survophthal.2021.03.003
7. Abràmoff MD, Lavin PT, Birch M, Shah N, Folk JC. Pivotal trial of an autonomous ai-based diagnostic system for detection of diabetic retinopathy in primary care offices. NPJ Digital Med (2018) 1:395. doi: 10.1038/s41746-018-0040-6
8. Dai L, Wu L, Li H, Cai C, Wu Q, Kong H, et al. A deep learning system for detecting diabetic retinopathy across the disease spectrum. Nat Commun (2021) 12(1):3242. doi: 10.1038/s41467-021-23458-5
9. Dong L, He W, Zhang R, Ge Z, Wang YX, Zhou J, et al. Artificial intelligence for screening of multiple retinal and optic nerve diseases. JAMA Netw Open (2022) 5(5):e229960. doi: 10.1001/jamanetworkopen.2022.9960
10. Nadeem MW, Goh HG, Hussain M, Liew SY, Andonovic I, Khan MA. Deep learning for diabetic retinopathy analysis: a review, research challenges, and future directions. Sensors (2022) 22(18). doi: 10.3390/s22186780
11. Ogunyemi OI, Gandhi M, Lee M, Teklehaimanot S, Daskivich LP, Hindman D, et al. Detecting diabetic retinopathy through machine learning on electronic health record data from an urban, safety net healthcare system. JAMIA Open (2021) 4(3):b66. doi: 10.1093/jamiaopen/ooab066
12. Yang C, Liu Q, Guo H, Zhang M, Zhang L, Zhang G, et al. Usefulness of machine learning for identification of referable diabetic retinopathy in a Large-scale population-based study. Front Med (2021) 8:7738815. doi: 10.3389/fmed.2021.773881
13. Cao B, Zhang N, Zhang Y, Fu Y, Zhao D. Plasma cytokines for predicting diabetic retinopathy among type 2 diabetic patients via machine learning algorithms. Aging (Albany NY) (2020) 13(2):1972–88. doi: 10.18632/aging.202168
14. Wu JH, Liu TYA, Hsu WT, Ho JH, Lee CC. Performance and limitation of machine learning algorithms for diabetic retinopathy screening: meta-analysis. J Med Internet Res (2021) 23(7):e23863. doi: 10.2196/23863
15. Wewetzer L, Held LA, Steinhäuser J. Diagnostic performance of deep-Learning-Based screening methods for diabetic retinopathy in primary care-a meta-analysis. PloS One (2021) 16(8):e255034. doi: 10.1371/journal.pone.0255034
16. Page MJ, McKenzie JE, Bossuyt PM, Boutron I, Hoffmann TC, Mulrow CD, et al. The prisma 2020 statement: an updated guideline for reporting systematic reviews. BMJ-British Med J (2021) 372:n71. doi: 10.1136/bmj.n71
17. Whiting PF, Rutjes AW, Westwood ME, Mallett S, Deeks JJ, Reitsma JB, et al. Quadas-2: a revised tool for the quality assessment of diagnostic accuracy studies. Ann Intern Med (2011) 155(8):529–36. doi: 10.7326/0003-4819-155-8-201110180-00009
18. Baget-Bernaldiz M, Pedro RA, Santos-Blanco E, Navarro-Gil R, Valls A, Moreno A, et al. Testing a deep learning algorithm for detection of diabetic retinopathy in a Spanish diabetic population and with messidor database. Diagnostics (2021) 11(8). doi: 10.3390/diagnostics11081385
19. Bode BW, Ipp E, Shah VN, Sadda SR. Diabetic retinopathy (Dr) screening performance of an artificial intelligence (Ai) system: analysis from a pivotal multicenter prospective clinical trial. Diabetes (2019) 68. doi: 10.2337/db19-37-LB
20. Do Rio JNM, Nderitu P, Bergeles C, Sivaprasad S, Tan GSW, Raman R. Evaluating a deep learning diabetic retinopathy grading system developed on mydriatic retinal images when applied to non-mydriatic community screening. J Clin Med (2022) 11(3). doi: 10.3390/jcm11030614
21. Gulshan V, Rajan RP, Widner K, Wu D, Wubbels P, Rhodes T, et al. Performance of a deep-learning algorithm vs manual grading for detecting diabetic retinopathy in India. JAMA Ophthalmol (2019) 137(9):987–93. doi: 10.1001/jamaophthalmol.2019.2004
22. Li N, Ma M, Lai M, Gu L, Kang M, Wang Z, et al. A stratified analysis of a deep learning algorithm in the diagnosis of diabetic retinopathy in a real-world study. J Diabetes (2022) 14(2):111–20. doi: 10.1111/1753-0407.13241
23. Ming S, Xie K, Lei X, Yang Y, Zhao Z, Li S, et al. Evaluation of a novel artificial intelligence-based screening system for diabetic retinopathy in community of China: a real-world study. Int Ophthalmol (2021) 41(4):1291–99. doi: 10.1007/s10792-020-01685-x
24. Natarajan S, Jain A, Krishnan R, Rogye A, Sivaprasad S. Diagnostic accuracy of community-based diabetic retinopathy screening with an offline artificial intelligence system on a smartphone. JAMA Ophthalmol (2019) 137(10):1182–88. doi: 10.1001/jamaophthalmol.2019.2923
25. Noriega A, Meizner D, Camacho D, Enciso J, Quiroz-Mercado H, Morales-Canton V, et al. Screening diabetic retinopathy using an automated retinal image analysis system in independent and assistive use cases in Mexico: randomized controlled trial. JMIR Form Res (2021) 5(8). doi: 10.2196/preprints.25290
26. Pawar B, Lobo SN, Joseph M, Jegannathan S, Jayraj H. Validation of artificial intelligence algorithm in the detection and staging of diabetic retinopathy through fundus photography: an automated tool for detection and grading of diabetic retinopathy. Middle East Afr J Ophthalmol (2021) 28(2):81–6. doi: 10.4103/meajo.meajo_406_20
27. Rêgo S, Dutra-Medeiros M, Soares F, Monteiro-Soares M. Screening for diabetic retinopathy using an automated diagnostic system based on deep learning: diagnostic accuracy assessment. Ophthalmologica (2021) 244(3):250–57. doi: 10.1159/000512638
28. Rogers TW, Gonzalez-Bueno J, Franco RG, Star EL, Marin DM, Vassallo J, et al. Evaluation of an ai system for the detection of diabetic retinopathy from images captured with a handheld portable fundus camera: the mailor ai study. Eye (2021) 35(2):632–38. doi: 10.1038/s41433-020-0927-8
29. Sandhu HS, Elmogy M, Taher Sharafeldeen A, Elsharkawy M, El-Adawy N, Eltanboly A, et al. Automated diagnosis of diabetic retinopathy using clinical biomarkers, optical coherence tomography, and optical coherence tomography angiography. Am J Ophthalmol (2020) 216:201–065. doi: 10.1016/j.ajo.2020.01.016
30. Scheetz J, Koca D, McGuinness M, Holloway E, Tan Z, Zhu Z, et al. Real-World artificial intelligence-based opportunistic screening for diabetic retinopathy in endocrinology and indigenous healthcare settings in Australia. Sci Rep (2021) 11(1):15808. doi: 10.1038/s41598-021-94178-5
31. Sosale B, Sosale AR, Murthy H, Sengupta S, Naveenam M. Medios- an offline, smartphone-based artificial intelligence algorithm for the diagnosis of diabetic retinopathy. Indian J Ophthalmol (2020) 68(2):391–95. doi: 10.4103/ijo.IJO_1203_19
32. Sosale B, Sosale A, Murthy H, Naveenam M. Simple, mobile based artificial intelligence algorithm in the diagnosis of diabetic retinopathy. Diabetes Technol Ther (2019) 21:A27. doi: 10.1136/bmjdrc-2019-000892
33. Tang F, Luenam P, Ran AR, Quadeer AA, Raman R, Sen P, et al. Detection of diabetic retinopathy from ultra-widefield scanning laser ophthalmoscope images: a multicenter deep learning analysis. Ophthalmol Retina (2021) 5(11):1097–106. doi: 10.1016/j.oret.2021.01.013
34. Ting DSW, Cheung CY, Lim G, Tan GSW, Quang ND, Gan A, et al. Development and validation of a deep learning system for diabetic retinopathy and related eye diseases using retinal images from multiethnic populations with diabetes. JAMA-J Am Med Assoc (2017) 318(22):2211–23. doi: 10.1001/jama.2017.18152
35. Wang Y, Shi D, Tan Z, Niu Y, Jiang Y, Xiong R, et al. Screening referable diabetic retinopathy using a semi-automated deep learning algorithm assisted approach. Front Med (2021) 8. doi: 10.3389/fmed.2021.740987
36. Wongchaisuwat N, Trinavarat A, Rodanant N, Thoongsuwan S, Phasukkijwatana N, Prakhunhungsit S, et al. In-person verification of deep learning algorithm for diabetic retinopathy screening using different techniques across fundus image devices. Trans Vision Sci Technol (2021) 10(13):17. doi: 10.1167/tvst.10.13.17
37. Yao HY, Wu SJ, Zhan ZY, Li ZJ. A classification tree model with optical coherence tomography angiography variables to screen early-stage diabetic retinopathy in diabetic patients. J Ophthalmol (2022) 2022. doi: 10.1155/2022/9681034
38. Zhang Y, Shi J, Peng Y, Zhao Z, Zheng Q, Wang Z, et al. Artificial intelligence-enabled screening for diabetic retinopathy: a real-world, multicenter and prospective study. BMJ Open Diabetes Res Care (2020) 8(1). doi: 10.1136/bmjdrc-2020-001596
39. Quazi S. Artificial intelligence and machine learning in precision and genomic medicine. Med Oncol (2022) 39(8):120. doi: 10.1007/s12032-022-01711-1
40. Ting DSW, Pasquale LR, Peng L, Campbell JP, Lee AY, Raman R, et al. Artificial intelligence and deep learning in ophthalmology. Br J Ophthalmol (2019) 103(2):167–75. doi: 10.1136/bjophthalmol-2018-313173
41. Grauslund J. Diabetic retinopathy screening in the emerging era of artificial intelligence. Diabetologia (2022) 65(9):1415–23. doi: 10.1007/s00125-022-05727-0
42. McGrath TA, Alabousi M, Skidmore B, Korevaar DA, Bossuyt PMM, Moher D, et al. Recommendations for reporting of systematic reviews and meta-analyses of diagnostic test accuracy: a systematic review. Systematic Rev (2017) 6(1):194. doi: 10.1186/s13643-017-0590-8
43. Yip MYT, Lim G, Lim ZW, Nguyen QD, Chong CCY, Yu M, et al. Technical and imaging factors influencing performance of deep learning systems for diabetic retinopathy. NPJ Digital Med (2020) 3:405. doi: 10.1038/s41746-020-0247-1
44. Xie Y, Zaccagna F, Rundo L, Testa C, Agati R, Lodi R, et al. Convolutional neural network techniques for brain tumor classification (From 2015 to 2022): review, challenges, and future perspectives. Diagnostics (2022) 12(8). doi: 10.3390/diagnostics12081850
45. Gunasekeran DV, Ting DSW, Tan GSW, Wong TY. Artificial intelligence for diabetic retinopathy screening, prediction and management. Curr Opin Ophthalmol (2020) 31(5):357–65. doi: 10.1097/ICU.0000000000000693
46. Teo ZL, Tham YC, Yu M, Cheng CY, Wong TY, Sabanayagam C. Do we have enough ophthalmologists to manage vision-threatening diabetic retinopathy? a global perspective. Eye (2020) 34(7):1255–61. doi: 10.1038/s41433-020-0776-5
47. Le NT, Kroeger ZA, Lin WV, Khanani AM, Weng CY. Novel treatments for diabetic macular edema and proliferative diabetic retinopathy. Curr Diabetes Rep (2021) 21(10):43. doi: 10.1007/s11892-021-01412-5
48. Jeong SH, Han JI, Cho SW, Lee DW, Kim CG, Lee TG, et al. Effect of focal laser photocoagulation in eyes with mild to moderate non-proliferative diabetic retinopathy. Int J Ophthalmol (2016) 9(10):1439–43. doi: 10.18240/ijo.2016.10.12
49. Gomez, Rossi J, Rojas-Perilla N, Krois J, Schwendicke F. Cost-effectiveness of artificial intelligence as a decision-support system applied to the detection and grading of melanoma, dental caries, and diabetic retinopathy. JAMA Netw Open (2022) 5(3):e220269. doi: 10.1001/jamanetworkopen.2022.0269
50. Xu J, Xue K, Zhang K. Current status and future trends of clinical diagnoses via image-based deep learning. Theranostics (2019) 9(25):7556–65. doi: 10.7150/thno.38065
51. Duarte-Rojo A, Sejdic E. Artificial intelligence and the risk for intuition decline in clinical medicine. Am J Gastroenterol (2022) 117(3):401–02. doi: 10.14309/ajg.0000000000001618
52. Wong TY, Sabanayagam C. Strategies to tackle the global burden of diabetic retinopathy: from epidemiology to artificial intelligence. Ophthalmologica (2020) 243(1):9–20. doi: 10.1159/000502387
53. Neri E, Coppola F, Miele V, Bibbolino C, Grassi R. Artificial intelligence: who is responsible for the diagnosis? Radiol Med (2020) 125(6):517–21. doi: 10.1007/s11547-020-01135-9
54. Stai B, Heller N, McSweeney S, Rickman J, Blake P, Vasdev R, et al. Public perceptions of artificial intelligence and robotics in medicine. J Endourol (2020) 34(10):1041–48. doi: 10.1089/end.2020.0137
Keywords: artificial intelligence, diabetic retinopathy, meta-analysis, diagnostic accuracy, prospective study
Citation: Wang Z, Li Z, Li K, Mu S, Zhou X and Di Y (2023) Performance of artificial intelligence in diabetic retinopathy screening: a systematic review and meta-analysis of prospective studies. Front. Endocrinol. 14:1197783. doi: 10.3389/fendo.2023.1197783
Received: 31 March 2023; Accepted: 23 May 2023;
Published: 13 June 2023.
Edited by:
Pranav Kumar Prabhakar, Lovely Professional University, IndiaReviewed by:
Ozra Tabatabaei-Malazy, Tehran University of Medical Sciences, IranYifan Xiang, Sun Yat-sen University, China
Copyright © 2023 Wang, Li, Li, Mu, Zhou and Di. This is an open-access article distributed under the terms of the Creative Commons Attribution License (CC BY). The use, distribution or reproduction in other forums is permitted, provided the original author(s) and the copyright owner(s) are credited and that the original publication in this journal is cited, in accordance with accepted academic practice. No use, distribution or reproduction is permitted which does not comply with these terms.
*Correspondence: Yu Di, ZGl5dWpzZHh0QDE2My5jb20=