 Youqian Zhang1
 Yang Wang
 Lin Li
- 1Department of Endocrinology, The First Affiliated Hospital of Yangtze University, Jingzhou, Hubei, China
- 2Law School, Yangtze University, Jingzhou, Hubei, China
- 3Department of Neurology, Second Affiliated Hospital of Zhengzhou University, Zhengzhou, China
Background: Previous observational studies have indicated an association between serum uric acid (SUA) and diabetic neuropathy (DN), but confounding factors and reverse causality have left the causality of this relationship uncertain.
Methods: Univariate Mendelian randomization (MR), multivariate MR and linkage disequilibrium score (LDSC) regression analysis were utilized to assess the causal link between SUA and DN. Summary-level data for SUA were drawn from the CKDGen consortium, comprising 288,648 individuals, while DN data were obtained from the FinnGen consortium, with 2,843 cases and 271,817 controls. Causal effects were estimated primarily using inverse variance weighted (IVW) analysis, supplemented by four validation methods, with additional sensitivity analyses to evaluate pleiotropy, heterogeneity, and result robustness.
Results: The LDSC analysis revealed a significant genetic correlation between SUA and DN (genetic correlation = 0.293, P = 2.60 × 10⁻⁵). The primary methodology IVW indicated that each increase of 1 mg/dL in SUA would increase DN risk by 17% (OR = 1.17, 95% CI 1.02-1.34, P = 0.02), while no causal relationship was found in reverse analysis (OR = 1.00, 95% CI 0.98~1.01, P = 0.97). Multivariate MR further identified that the partial effect of SUA on DN may be mediated by physical activity, low density lipoprotein cholesterol (LDL-C), insulin resistance (IR), and alcohol use.
Conclusion: The study establishes a causal link between elevated SUA levels and an increased risk of DN, with no evidence for a reverse association. This underscores the need for a comprehensive strategy in DN management, integrating urate-lowering interventions with modulations of the aforementioned mediators.
Introduction
Diabetes mellitus (DM), a prominent metabolic disorder characterized by chronic hyperglycemia (1, 2), is increasingly widespread, with the World Health Organization (WHO) estimating over 422 million global cases. By the year 2045, this figure is projected to rise to 629 million (3, 4). As the paramount complication arising from DM, Diabetic Neuropathy (DN) demonstrates an elevated prevalence, exceeding 50%, in the populace diagnosed with this metabolic condition (5, 6). Diabetic polyneuropathy (DPN) and Peripheral Diabetic Neuropathy (PDN) are the most prevalent manifestations of DN (7). People living with DN experience a significant economic loss in addition to the medical costs of the disease due to missed opportunities at work and lost pay. According to a U.S. study on the financial consequences of diabetic neuropathy, the yearly immediate expense for each people is $4,841, and the quarterly supplementary expense is $9,730 (8). According to a study, the annual cost of healthcare for persons with painful DN is about three times higher than the cost for comparable control populations (9). Despite the clinical and financial costs associated with DN, there is no cure. Thus, the exploration of additional modifiable risk factors for DN is critical to enhance clinical management and prevent DN onset and progression.
Serum urate acid (SUA), which is the terminal product of purine metabolism, is under the regulatory influence of the enzyme xanthine oxidase. High SUA levels have been associated with vascular dysfunction and irreversible damage, potentially leading to tissue ischemia and compromised peripheral nerve function (10). Numerous investigations propose an associative relationship between augmented serum urate concentrations and the escalated incidence of DN (11–14). However, the evidence supporting this association is debatable. Contrasting investigations have found inconsistent associations between levels of SUA and DN. One study using data from the National Health and Nutrition Examination Survey (NHANES) discerned no consequential correlation between moderately increased urate levels and the peril of PDN, after adjustments for multivariate factors (15). Meanwhile, another study engaging 1,784 male and 1,025 female participants established that escalated SUA concentration constituted an autonomous risk determinant for non-alcoholic fatty liver disease and diabetic nephropathy. Nevertheless, no association was discernible with DPN (16).
Antecedent scholarly exploration failed to unequivocally substantiate the causal liaison between exposure constituents and outcome variables, due to the intricate scenarios engendered by confounding elements and the phenomenon of reverse causality. In light of these inconsistencies and the limitations of observational studies in determining causality, genetic research methods such as Mendelian randomization (MR) can offer valuable insights. Experiments utilizing MR apply genetic variations, identified via genome-wide association analyses, as instrumental variables (IVs). These IVs aid in estimating the cause-and-effect relationship between environmental exposure and the intended outcome. This methodology allows for causality inference under certain circumstances, using the genetic variants as stand-ins for environmental exposure (17). Conceptualized as a natural randomized controlled trial, MR operates on Mendelian laws of inheritance, assigning parental alleles to progeny. This method delivers a higher degree of evidence and a lower susceptibility to confounding factors. Compared to observational epidemiological research, MR has a greater level of evidence. Therefore, conducting a bidirectional MR study could play a pivotal role in uncovering the elusive causal relationships between SUA and DN, potentially leading to more effective preventative measures and treatments.
Materials and methods
Study design
To investigate the potential causal relationships between SUA concentrations and the risk of DN, bidirectional univariate MR (UVMR) and multivariable MR (MVMR) analyses were developed. (Figure 1). This study posited SUA as the exposure, DN as the outcome variable. The choice of IVs for serum urate levels hinged on three crucial assumptions: (i) the selected genetic variant, acting as the instrumental variable, demonstrates a robust association with the exposure; (ii) the genetic variant maintains no connection with potential confounders; and (iii) the influence of genetic variants on the outcome is mediated exclusively via the exposure, eliminating the possibility of alternate pathways (18). Conversely, we probed the reciprocal impact of DN on SUA, acknowledging the potential for reverse causation. Consequently, to ensure a robust correlation between all instrumental variables and the exposure, only SNPs demonstrating a genome-wide significance with SUA levels were considered. Furthermore, these genetic variants needed to display independence and avoid linkage disequilibrium, signifying their random allocation at conception. Given the potential for horizontal pleiotropy, additional analyses leveraging alternative statistical methodologies were conducted. In addition, as body mass index (BMI), alcohol use, smoking, education attainment (EA), and physical activity may play confounding roles in the exposure to outcome pathway, further bidirectional MVMR analyses were conducted to estimate the direct causal effect of exposure on outcome. Compared with the UVMR hypothesis, assumption 1 of the MVMR refers to genetic variation linked with one or more exposures, and the remaining assumptions are aligned with the UVMR (19).
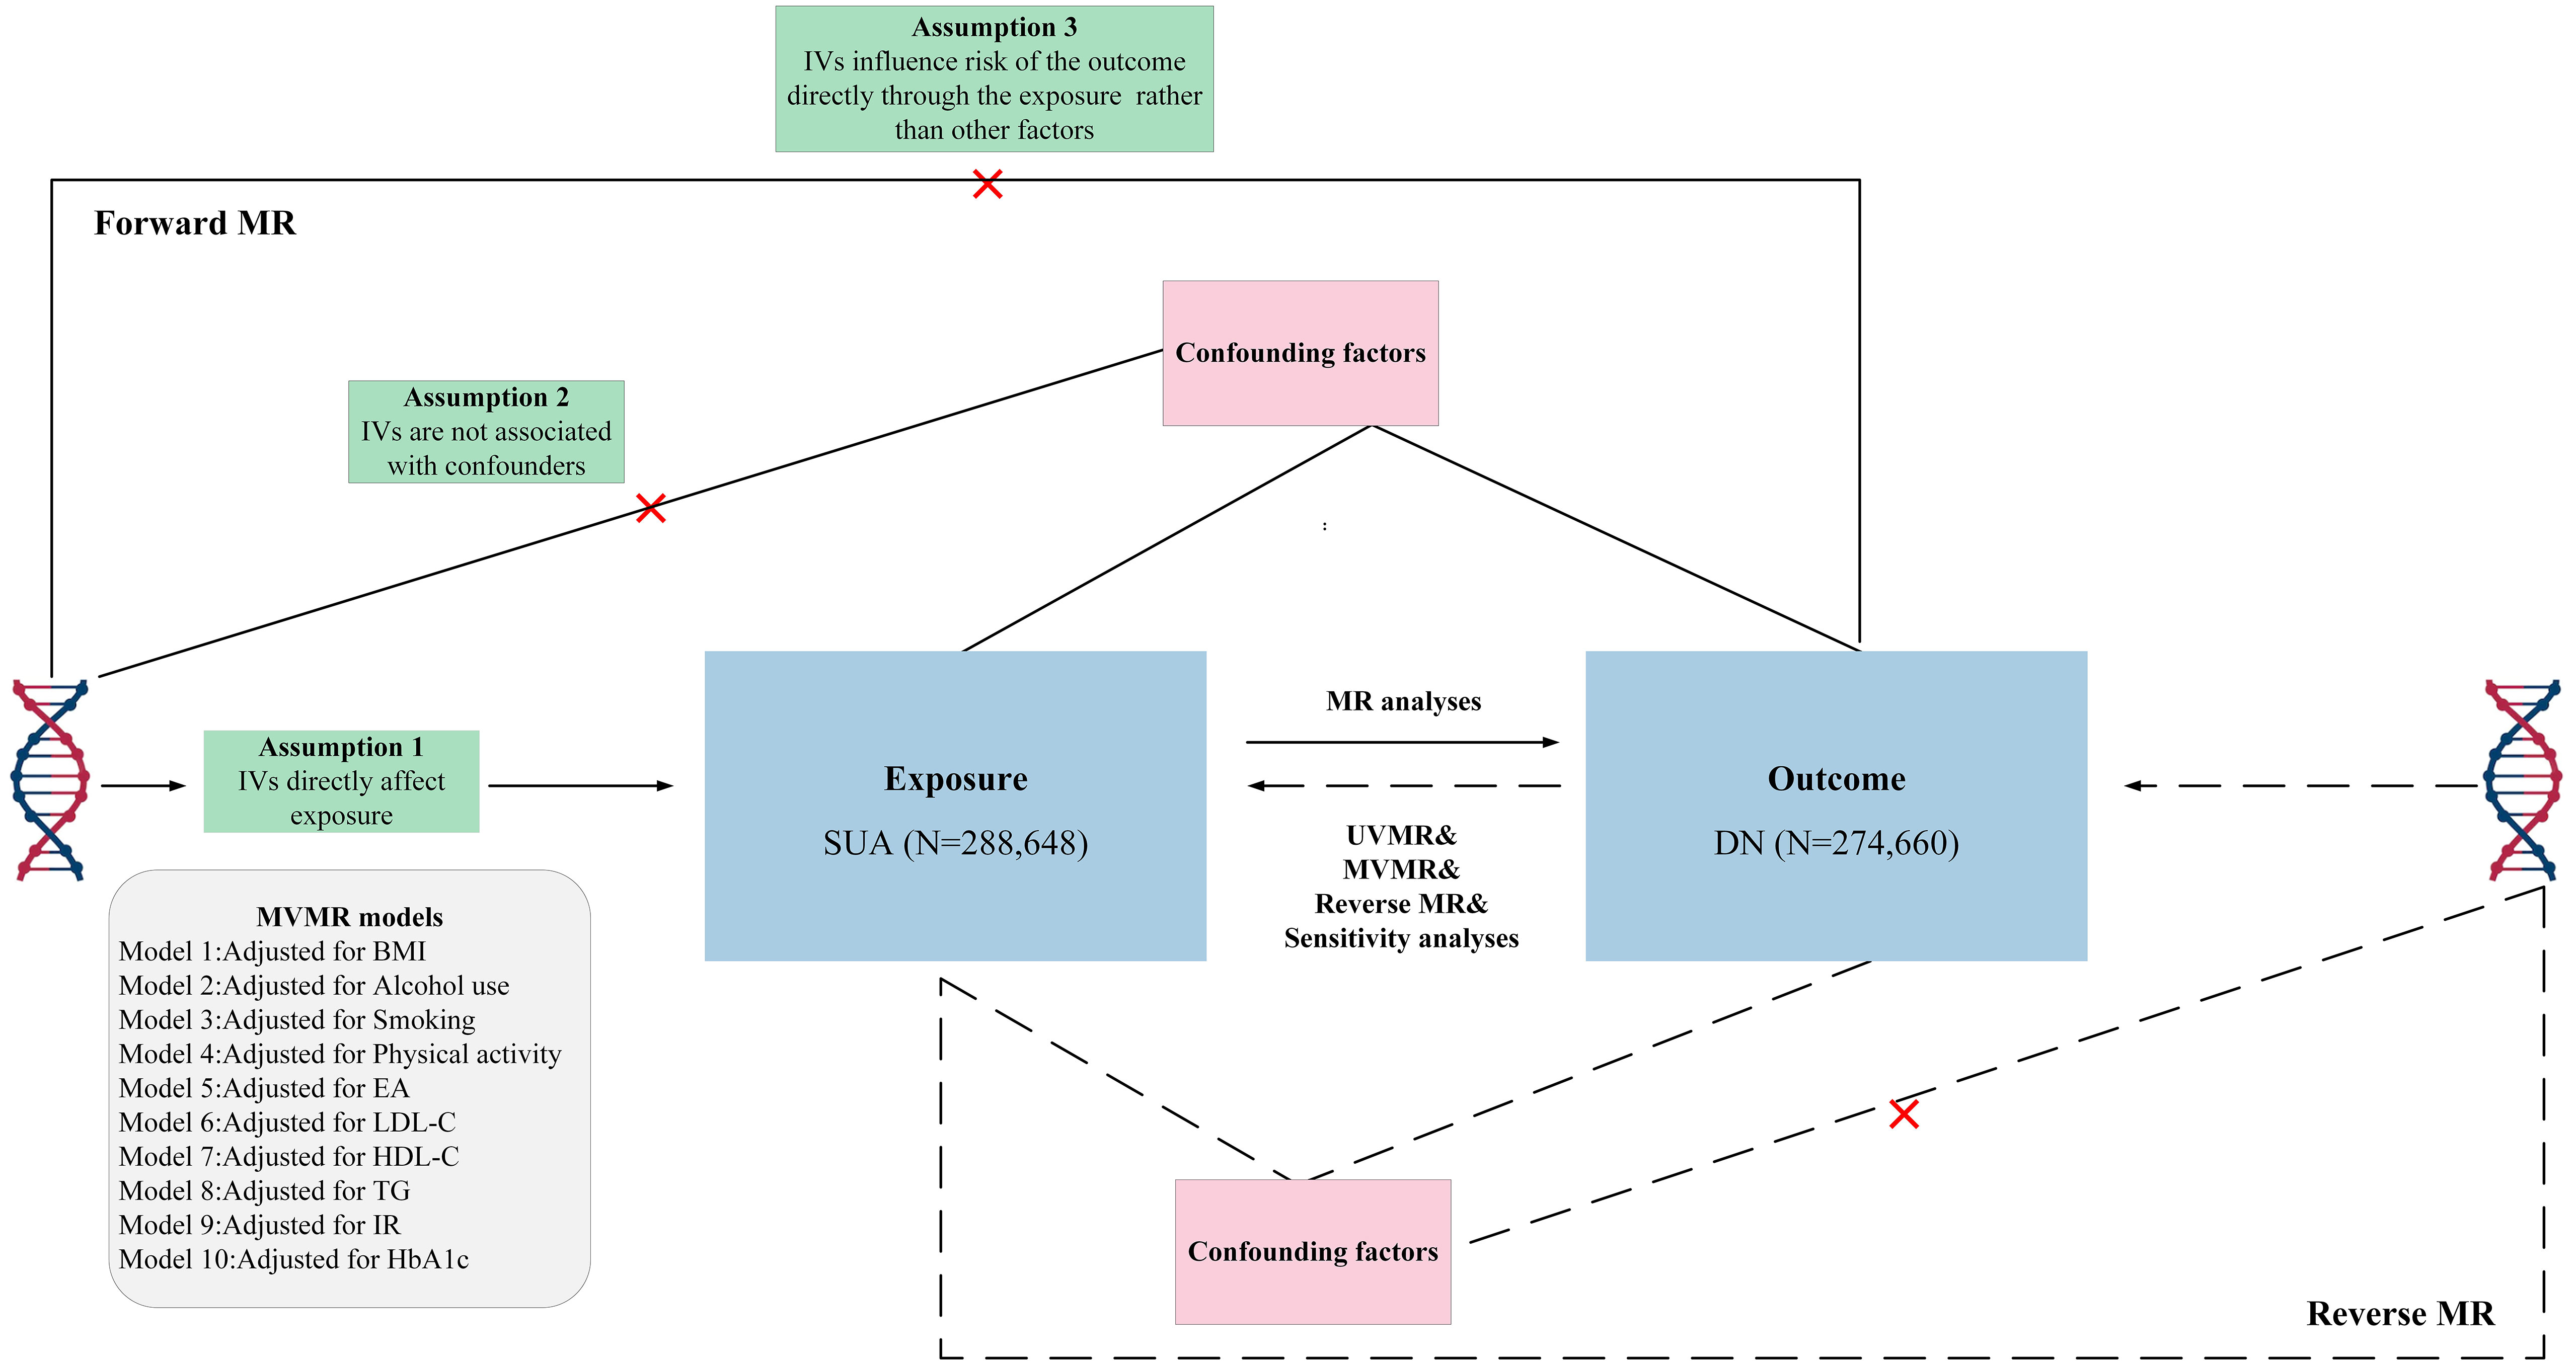
Figure 1 Overview of research design and analysis strategy. Overview of the research design. Exposures come from SUA, with outcomes including DN. The MR framework is based on three fundamental MR assumptions, with MVMR analyses adjusting for ten mediating factors for positive results. MVMR, multivariate Mendelian randomization; UVMR, Univariate Mendelian randomization; BMI, body mass index; EA, education attainment; DN, diabetic neuropathy; SUA, Serum urate acid; HbA1c, Glycated Hemoglobin A1c; LDL-C, Low Density Lipoprotein Cholesterol; HDL-C, High Density Lipoprotein Cholesterol; TG, Triglyceride; IR, insulin resistance.
Data sources
DN (2,843 ncase and 271,817 ncontrol) data were obtained from the FinnGen consortium. The DN were defined by ICD-10 codes, with the phenotype adjusted for age, sex, and up to 20 genetic principal components. Instituted in Finland in 2017, the FinnGen study embarked on an expedition to collate and scrutinize genomic and health-related data from an expansive cohort of approximately half a million Finnish individuals (https://www.finngen.fi/en).
The data for SUA was sourced from the CKDGen consortium. The aggregated statistical data used in this study encompassed a total of 74 cross-ethnic studies involving 457,690 individuals, of which 288,649 were of European ancestry (20). The study adjusted for key components such as age, gender, and ancestry in the Genome-wide association studies (GWAS) meta-analysis and identified 183 urate-related genetic loci, with 147 being novel discoveries. Concurrently, the research designated a genetic urate risk score and significantly enhanced the prediction of gout risk for 334,880 participants.
Furthermore, we obtained genetic associations for BMI from the Genetic Investigation of Anthropometric Traits (GIANT) consortium (21), low density lipoprotein cholesterol (LDL-C), high density lipoprotein cholesterol (HDL-C), triglyceride (TG) from the Global Lipids Genetics Consortium (GLGC) (22), glycated hemoglobin A1c (HbA1c) from the Meta-Analyses of Glucose and Insulin-related traits Consortium (MAGIC) (23), insulin resistance (IR) from the Dupuis J et al (24), alcohol use from the Psychiatric Genomics Consortium (PGC) (25), EA from the GWAS of 1.1 million individuals conducted by the Social Science Genetic Association Consortium (SSGAC) (26), physical activity from the family GWAS consortium (27) and smoking were identified from the GWAS and Sequencing Consortium of Alcohol and Nicotine use (GSCAN), involving 1.2 million individuals (28).
A detailed presentation of the summary statistics from the data sources is available in Table 1; Supplementary File 1. Each investigation incorporated within the GWAS framework was sanctioned by the relevant ethical review panels. Written informed consent was procured from every participant involved. The data utilized in the present study maintain public accessibility.
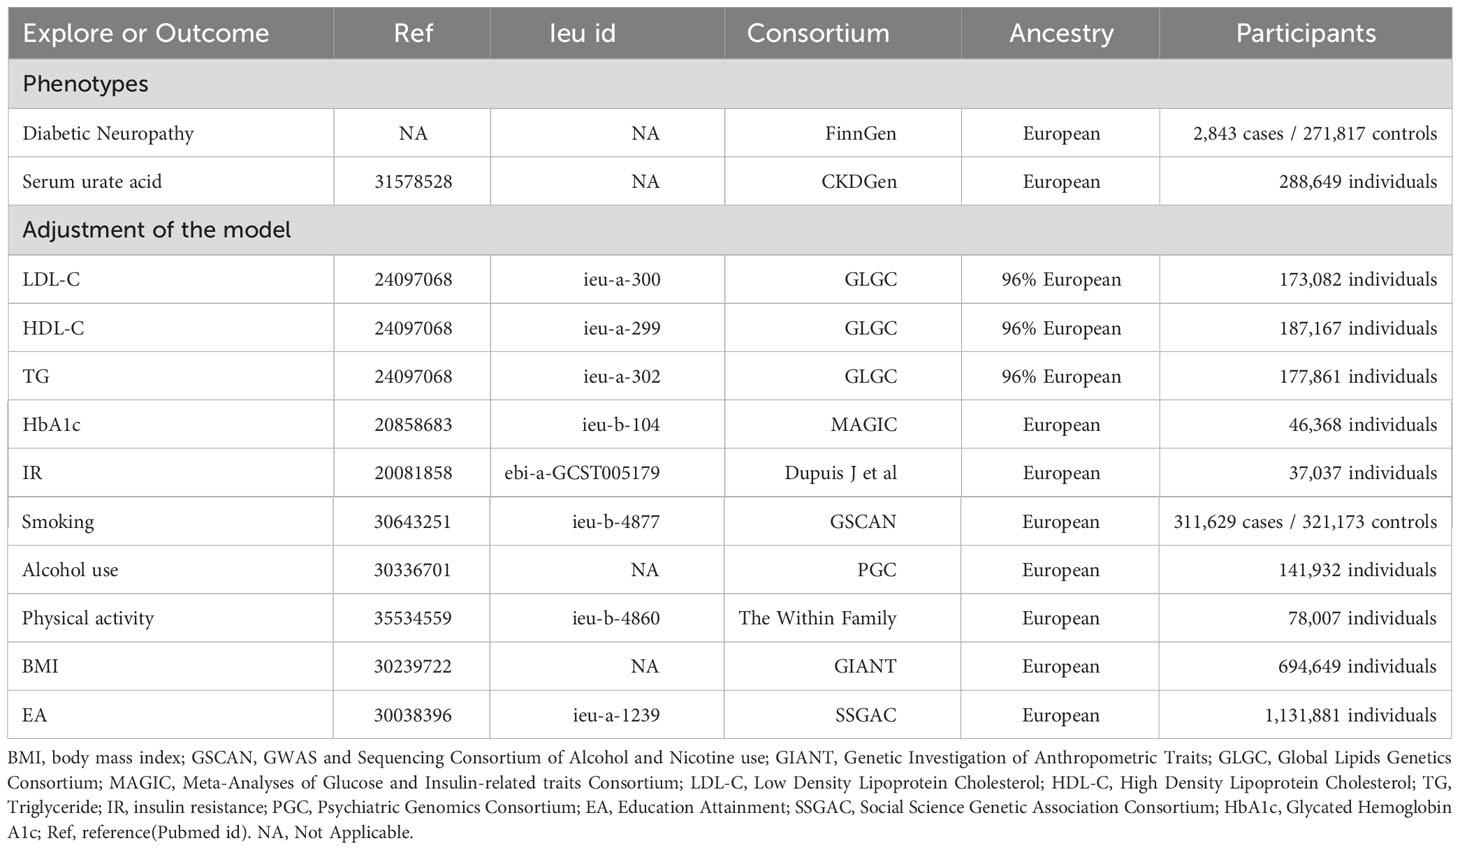
Table 1 Detailed information of data sources.
Genetic instrument selection
Within the framework of our MR studies, we treated the included SNPs as genetic IVs. To ensure the accuracy of the MR estimates, these SNPs were required to satisfy specific criteria:
(1) All SNPs chosen as IVs manifested a correlation with the respective exposure at a genome-wide significance threshold (P<5×10⁻⁸). (2) SNPs were ensured to be unassociated with any potential confounders and independent of one another to prevent biases stemming from linkage disequilibrium (r2 < 0.001, clumping distance = 10,000 kb); (3) F-statistics were employed to test for weak instrumental variables, and all of the F-statistics of the incorporated SNPs exceeded 10. A larger F-statistic indicates stronger instrument strength. We calculated an F-statistic (F=beta2/se2; beta for the SNP-exposure association (beta); variance (se)) for each SNP (29). (4) To maintain the robustness of the results, proxy SNPs were not used and MR-Steiger filtering was employed to eliminate variations demonstrating stronger correlations with outcomes than with exposures (30).(5) The effect of an SNP on exposure and the effect of that SNP on outcome must each correspond to the same allele. (6) If an SNP is absent in the outcome dataset, we employ the SNiPa online tool (http://snipa.helmholtz-muenchen.de/snipa3/) to locate the respective SNP. We calculated the variance explained by each assay SNP. This tool utilizes European population genotype data derived from Phase 3 of the 1000 Genomes Project. Subsequently, another SNP exhibiting linkage disequilibrium (r2 > 0.8) with the initial SNP is identified as a proxy SNP.
LDSC regression analysis
The linkage disequilibrium score (LDSC) regression analyses was applied to summary-level GWAS data to ascertain genetic correlations between the two distinct phenotypes. Initial stages of analysis involved employing munge_sumstats.py (https://github.com/bulik/ldsc/blob/master/munge_sumstats.py) to restructure summary statistics, and to eliminate variants that do not align with SNPs, such as indels, ambiguous strand SNPs, and duplicated SNPs. As a subsequent step, aligning with the methodology proposed by the original developers, we used the 1000 Genomes Project as the linkage disequilibrium (LD) reference panel to compute the LD score. In the final stage, the LDSC tool (https://github.com/bulik/ldsc) facilitated the assessment of genetic correlation between SUA, DN, and DPN.
Statistical analysis
In the process of UVMR analysis, the Wald ratio test was meticulously employed to scrutinize individual IVs. Subsequently, causal relationships involving multiple IVs (≥2) were systematically explored using the multiplicative random-effects inverse-variance-weighted (IVW) method. A fixed-effects model was implemented when the heterogeneity index I2 was less than 50%, further enhanced by the integration of both MR-Egger and weighted median approaches. In this framework, the IVW weighting has a direct correlation with the Wald ratio estimate for each SNP and an inverse relationship with the variance estimate of the Wald ratio for the specific SNP (31). In scenarios where all genetic variations are classified as valid, IVW yields both dependable and efficient estimations. Conversely, the weighted median method proves superior when a minimum of half of the genetic variations are evaluated as invalid, and the MR-Egger method is called upon when all genetic variations are considered invalid (32). Finally weighted mode and simple mode are used as complementary methods to increase the confidence of the results.
To ensure reliable MR estimates, a series of sensitivity analyses were conducted. Cochran’s Q test was utilized to evaluate the heterogeneity of each genetic variant, with a P-value under 0.05 indicating significant heterogeneity among the selected SNPs (33). Directional pleiotropy in our MR study was scrutinized using MR-Egger regression (34), and a P-value below the 0.05 threshold concerning the MR-Egger’s intercept may suggest significant directional pleiotropy. Although the MR-Egger method has relatively lower accuracy, its intercept can indicate the presence of directional pleiotropy (35). The MR-PRESSO method was employed to identify potential outliers and investigate horizontal pleiotropy, which is presumed if the global P-value falls below 0.05 (36). Any outliers would be removed to enhance the accuracy of the correction. Lastly, a leave-one-out analysis was conducted to evaluate the impact of individual SNPs on the overall results (37).
The study calculated R2 = 2×MAF×(1-MAF)×beta2, where MAF indicates minor allele frequency, of each instrumented SNP and summed the values for the coefficient necessary for the power calculator (38). We calculated the statistical power using the mRnd website (https://shiny.cnsgenomics.com/mRnd/) (39).
Results
Genetic instrument selection and genetic correlation between phenotypes
The research report indicates that the F-statistics for all IVs exceeded 100, signifying a substantial reduction in bias due to weak instruments. In both forward and reverse MR analyses, 89 (Supplementary File 2-Table 1) and 7 (Supplementary File 2-Table 2) SNPs were selected as IVs, accounting for 7.92% and 27.93% of the explained variance, respectively. We possess 75% statistical power to detect a correlation between SUA and DN, with an OR of 1.17.
LDSC analysis revealed a significant genetic correlation between SUA and DN (rg = 0.293, P = 2.60×10⁻⁵), and the SNP-based heritability (h²) for SUA and DN were found to be 9.64% and 1.05%, respectively.
Association of genetically predicted SUA with DN
In the forward MR analysis, scatter plots vividly displayed a positive correlation between SUA and DN (Supplementary File 1-Figure 1). Since an I2 of 42% (less than 50%) was detected, a fixed-effects model was also chosen to estimate the causal effect. The main method, IVW (fixed effects model), indicated that each increase of 1 mg/dL in SUA would increase the risk of DN by 17% (OR = 1.17, 95% CI 1.02~1.34, P = 0.02) (Figure 2). A random-effects result did not detect a causal relationship (OR = 1.17, 95% CI 0.971.39, P = 0.09). Further, the weighted median estimate was consistent with the primary method (OR = 1.27, 95% CI 1.02~1.57, P = 0.03), considering the main results robust, albeit with a wide 95%CI.
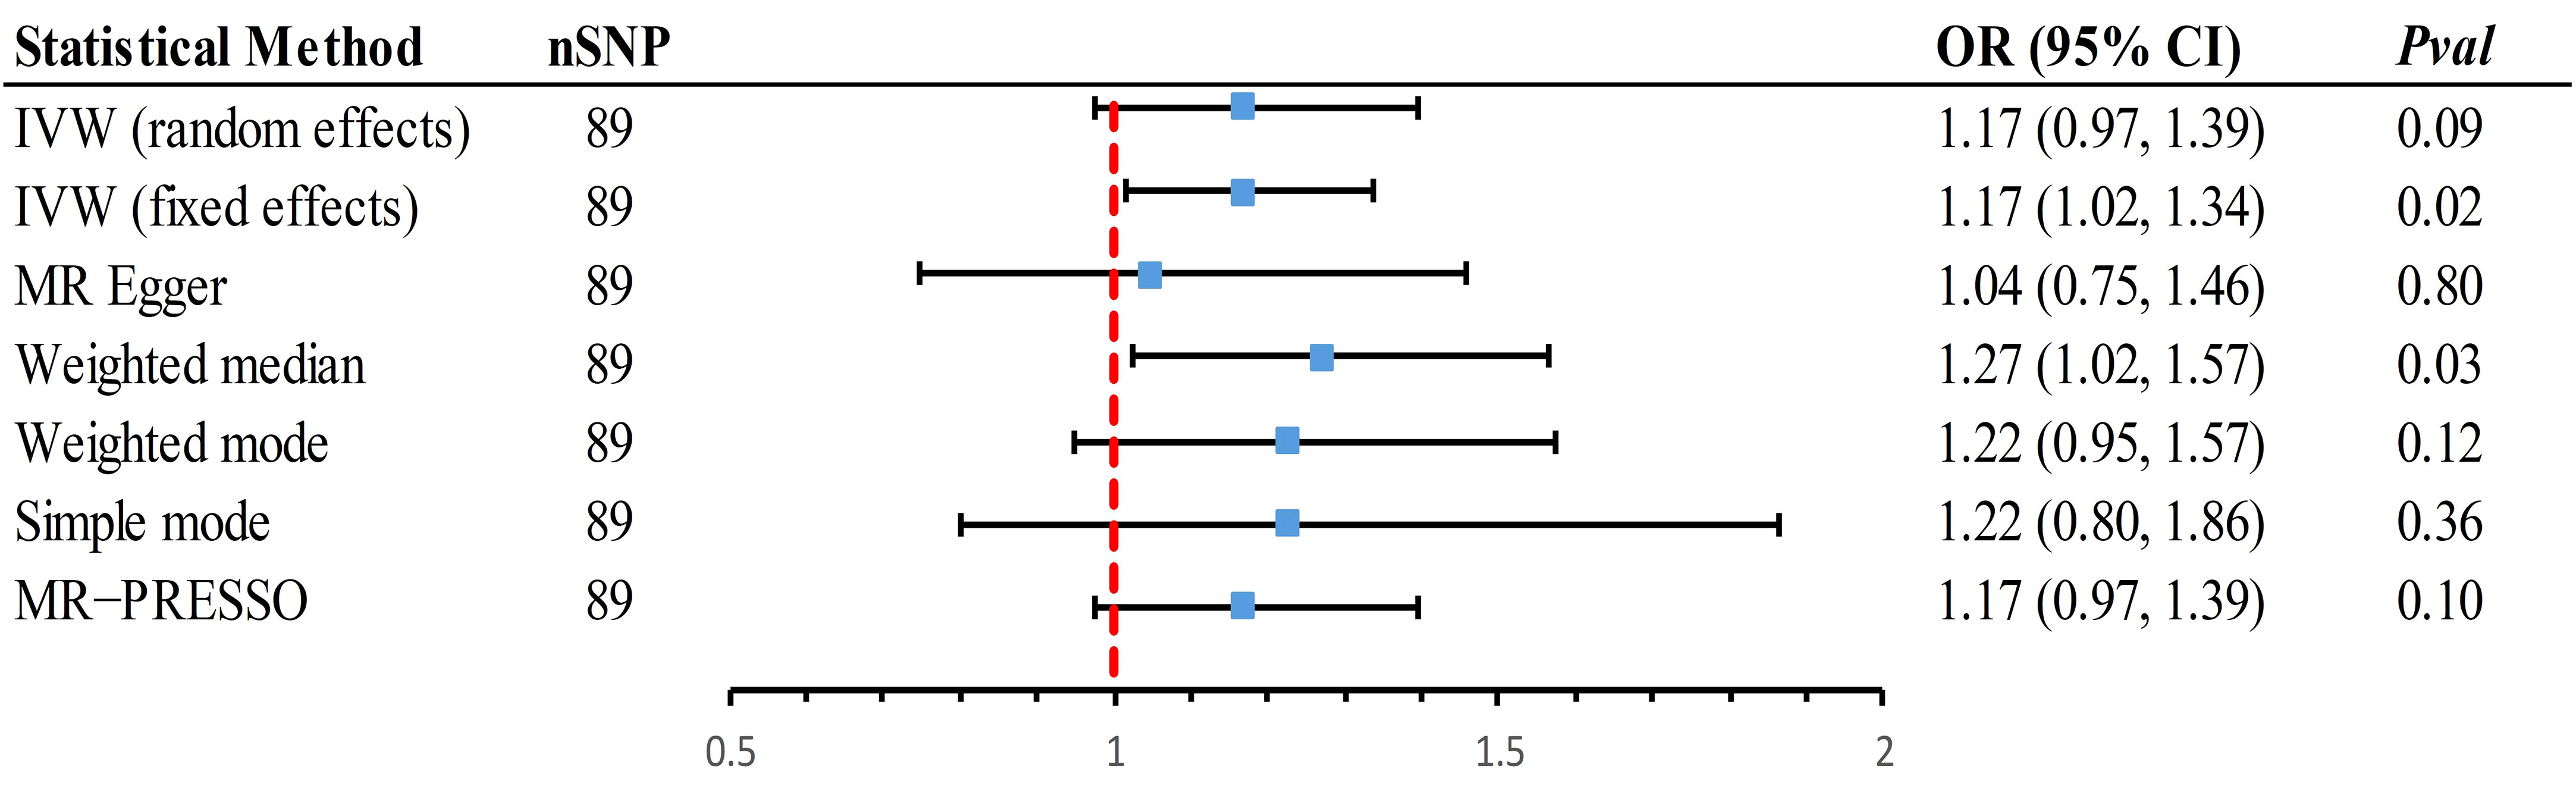
Figure 2 Mendelian randomization association of genetically predicted SUA with DN using different statistical models. Odds ratios are scaled per 1 mg/dL increase in the genetically predicted serum urate level. IVW, inverse-variance-weighted method; MR, Mendelian randomization; MR-PRESSO, MR-pleiotropy residual sum and outlier; OR, odds ratio; CI, confidence interval; SUA, Serum urate acid; DN, Diabetic Neuropathy.
Sensitivity analyses confirmed the robustness of these results (Supplementary File 2-Table 3). MR-PRESSO did not find any outliers, but there was unavoidable horizontal pleiotropy (P < 0.05). Leave-one-out analysis further substantiated that the causal relationship was not influenced by any individual SNP. The symmetry of the funnel plot was maintained, and after performing the steiger test, the causal relationship remained significant, bolstering the stability of our findings (Supplementary File 1-Figure 1).
In the reverse MR analysis (Supplementary File 1-Figure 2), the primary analytical method indicated that there was no causal association between genetically predicted DN and SUA (OR = 1.00, 95% CI 0.98~1.01, P = 0.97) (Supplementary File 2-Table 4). The estimates from Supplemental Methods were consistent with this finding. A series of sensitivity analyses revealed no outliers, pleiotropy, or heterogeneity, and the results were not distorted by any individual SNP. Thus, the findings are robust (Supplementary File 2-Table 3).
MVMR analysis adjusted for ten confounders
In the MVMR analysis (Figure 3), after adjusting for potential confounders such as LDL-C, physical activity, IR, and alcohol use, the causal association between SUA and DN was no longer significant (P > 0.05). This suggests that the partial causal relationship of SUA on DN might be mediated through these phenotypes.
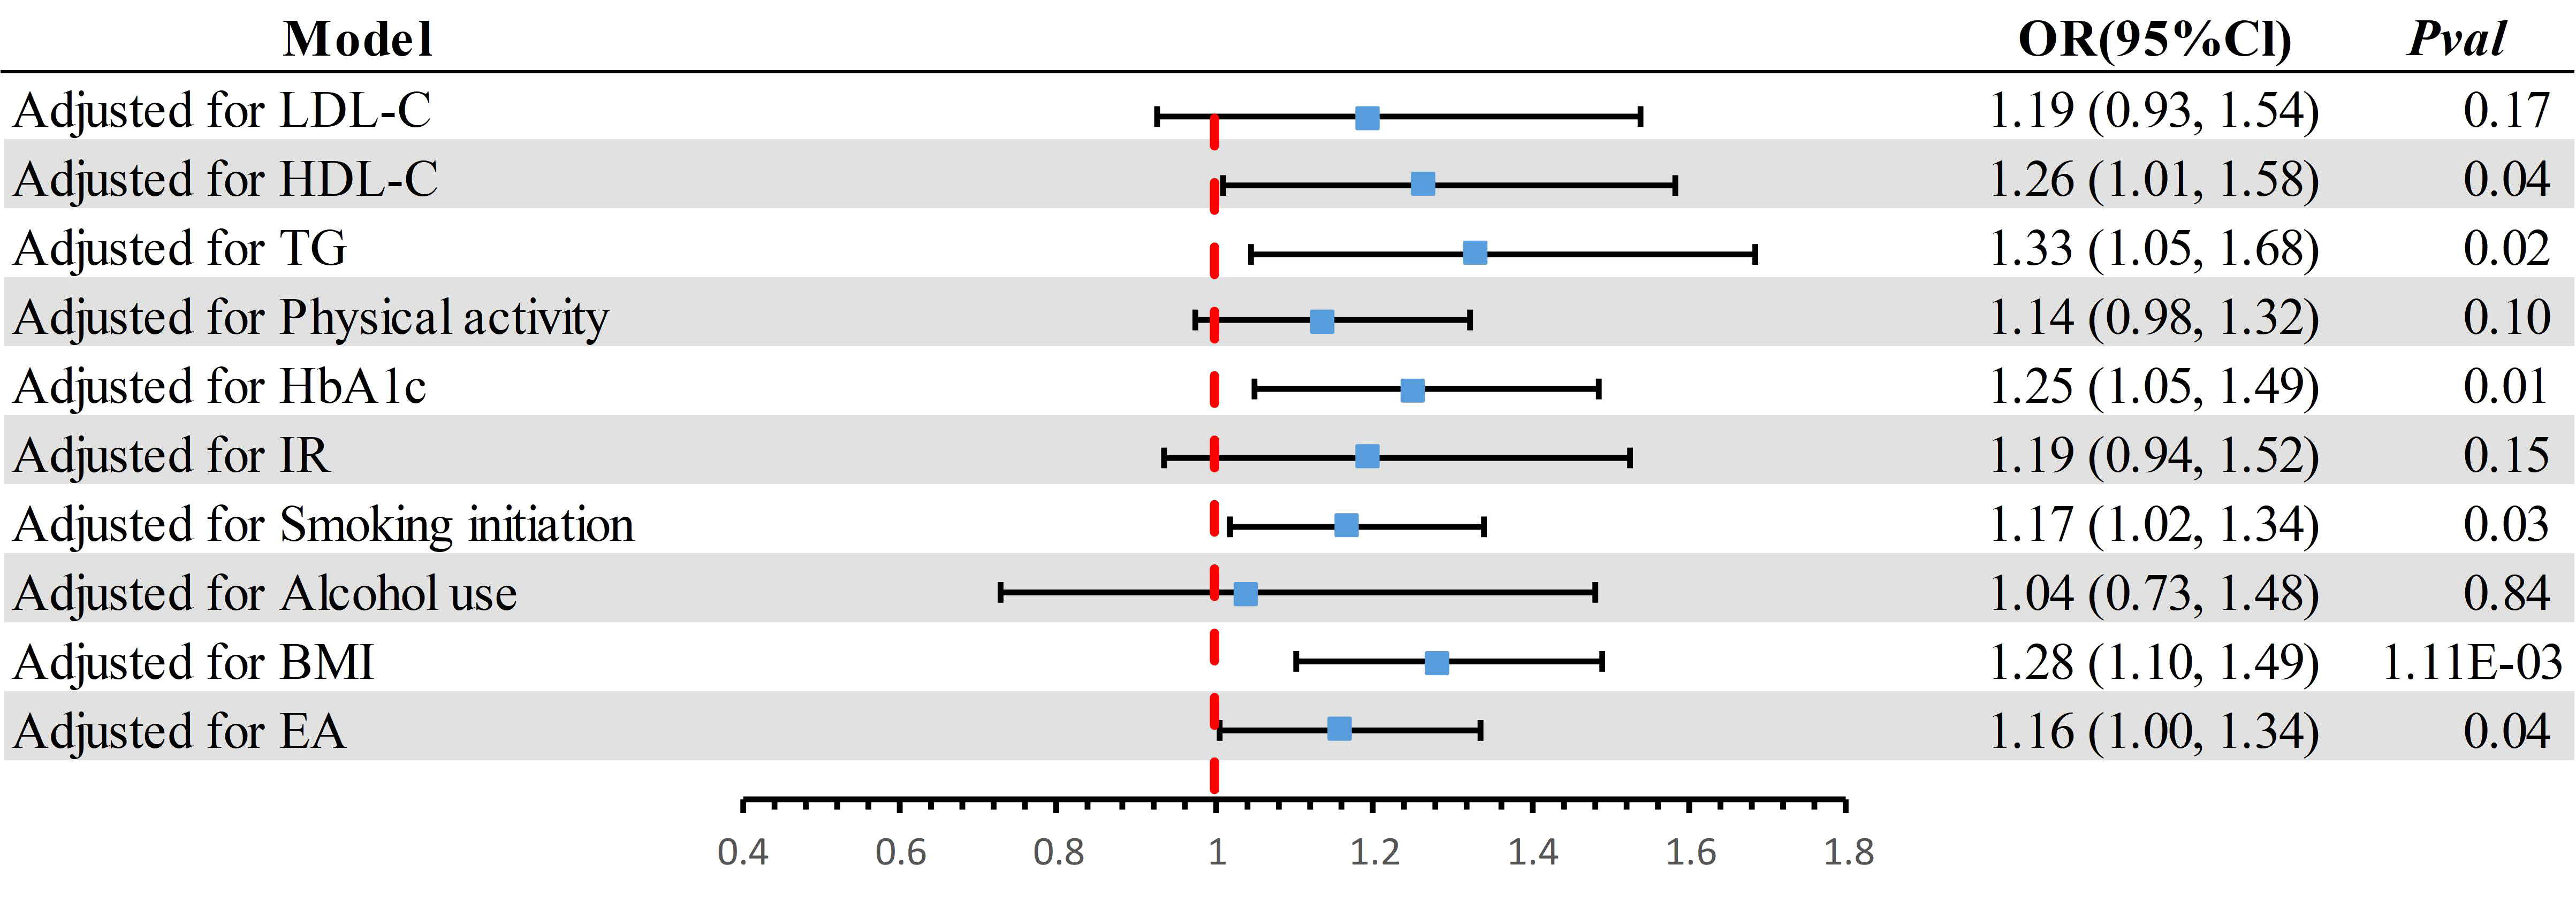
Figure 3 The effect of potential confounders was adjusted individually. BMI, body mass index; CI, confidence interval; LDL-C, Low Density Lipoprotein Cholesterol; HDL-C, High Density Lipoprotein Cholesterol; TG, Triglyceride; IR, insulin resistance; EA, Education Attainment; HbA1c, Glycated Hemoglobin A1c.
Discussion
This study conducted a comprehensive MR analysis to delve into the relationship between genetic predisposition to SUA levels and DN. The MR findings corroborate prior epidemiological studies (11–14), establishing a causal link between elevated SUA levels and an increased risk of DN. Additionally, no reverse causal association was identified between DN and SUA. Further MVMR analysis indicated that physical activity, LDL-C, IR, and alcohol use may mediate a portion of this causal relationship.
Previous research has suggested a connection between SUA and DN, with findings indicating an association between SUA and a heightened risk of DN (40–43). A meta-analysis involving 12 studies with 6,134 patients supported that hyperuricemia independently correlates with an elevated risk of peripheral neuropathy amongst patients diagnosed with type 2 diabetes (44). However, prior studies have reported conflicting findings regarding the connection between generalized SUA and DN (15, 16). Specifically, a cross-sectional study found no association between hyperuricemia and diabetic polyneuropathy (45). Moreover, SUA is a recognized risk factor for diverse conditions such as Alzheimer’s disease, sudden cardiac death, and gout.
SUA acts as a surrogate marker for oxidative stress, where environments with elevated uric acid can trigger oxidative stress, intimately tied with inflammation (46, 47). Oxidative stress epitomizes a disparity between reactive oxygen species (ROS) and the body’s inherent antioxidant defense mechanism (48). Chronic hyperglycemic disorders can incite protein glycation and stimulate an increase in free radicals, including ROS. At the same time, the antioxidant defense system suffers impairment in these hyperglycemic conditions (49, 50). Additionally, SUA promotes inflammatory responses and activates inflammatory pathways (51). A specific study revealed that uric acid innately incites inflammation by direct activation of the NLRP3 inflammasome, resulting in an upsurge in IL-1β and IL-18 expression within lung macrophages (52). Uric acid can penetrate the blood-brain barrier and initiate an inflammatory response through the activation of the NFκB-mediated inflammation pathway (53). High uric acid levels might aggravate these conditions, leading to nerve cell damage and inflammatory responses that could precipitate DN. Meanwhile, Uric acid is observed to interfere with nitric oxide (NO) synthesis, inciting vascular endothelial dysfunction (54). NO is known to dilate blood vessels and enhance local tissue perfusion (55). NO deficiency may contribute to nerve ischemia and hypoxia, further intensifying the progression of diabetic neuropathy. Recent findings have demonstrated uric acid’s role in influencing insulin secretion by escalating oxidative stress in β cells (56), thereby triggering insulin resistance. This insulin resistance is closely associated with the development of neuropathy and could deteriorate glycemic control further, exacerbating oxidative stress and inflammatory responses.
Considering the intrinsic limitations of observational studies, these investigations might not eliminate the influence of unobserved confounding factors and reverse causality. Observational studies typically emphasize correlation over causation. Despite some data suggesting a link, the causal relationship between SUA and DN is yet to be definitively established. We employed MR analysis to explore the genetic basis of the causal relationship between SUA and DN, aiming to negate these biases and confounders. The results of this analysis support that SUA is a risk factor for DN. As blood uric acid levels can be modified, uric acid-lowering therapy may offer preventive or therapeutic advantages in patients with DN.
Further MVMR analyses underscored the significance of physical activity, LDL-C, IR, and alcohol use. Firstly, physical activity impacts metabolic health and systemic inflammatory responses. Regular exercise has been shown to enhance insulin sensitivity, a notion that’s also supported by a NHANES study conducted by Yajuan Lin et al. (57). Secondly, Hui Zhang and colleagues have demonstrated that elevated LDL-C can instigate endothelial dysfunction and inflammation, exacerbating the pathophysiology of diabetic neuropathy (58). Additionally, a meta-analysis by Dovell et al. has pointed out a link between increased SUA and heightened IR (59), which further amplifies the risk of DN. Lastly, chronic alcohol consumption not only elevates serum urate levels but can also directly impact glucose metabolism and intensify the risk of neuropathic complications (60, 61). Hence, this suggests a multifaceted approach to the management of diabetic neuropathy, considering these factors collectively.
Our study possesses several strengths. This MR study is the first to establish a causal relationship between SUA and DN. All the SNPs set as IVs were derived from the European population, thereby reducing the likelihood of population stratification bias and enhancing the validity of the bidirectional MR assumption. Our robust tools employed in this study (e.g., an F statistic significantly exceeding 10) should mitigate potential bias from sample overlap. However, our study is not without its constraints. Some of the first selected exposures originated from the UKB cohort and the lack of other GWAS studies prevented a positive control analysis. Finally, due to the availability of only summary-level GWAS data, further subgroup analyses were precluded.
Conclusion
To encapsulate, our MR study establishes a causal link between elevated SUA levels and increased risk of DN, with no evidence for a reverse association. The potential therapeutic role of urate-lowering strategies in DN management warrants further investigation.
Data availability statement
The original contributions presented in the study are included in the article/Supplementary Material. Further inquiries can be directed to the corresponding author.
Ethics statement
Ethical approval was not required for the study involving humans in accordance with the local legislation and institutional requirements. Written informed consent to participate in this study was not required from the participants or the participants’ legal guardians/next of kin in accordance with the national legislation and the institutional requirements.
Author contributions
YZ: Writing – review & editing, Writing – original draft. ZT: Writing – review & editing. LT: Conceptualization, Writing – original draft. YW: Writing – original draft, Validation. LL: Writing – review & editing.
Funding
The author(s) declare that no financial support was received for the research, authorship, and/or publication of this article.
Acknowledgments
We thank all GWAS participants and investigators for publicly making the summary statistics data available.
Conflict of interest
The authors declare that the research was conducted in the absence of any commercial or financial relationships that could be construed as a potential conflict of interest.
Publisher’s note
All claims expressed in this article are solely those of the authors and do not necessarily represent those of their affiliated organizations, or those of the publisher, the editors and the reviewers. Any product that may be evaluated in this article, or claim that may be made by its manufacturer, is not guaranteed or endorsed by the publisher.
Supplementary material
The Supplementary Material for this article can be found online at: https://www.frontiersin.org/articles/10.3389/fendo.2023.1277984/full#supplementary-material
References
1. Chokki M, Cudălbeanu M, Zongo C, Dah-Nouvlessounon D, Ghinea IO, Furdui B, et al. Exploring Antioxidant and Enzymes (A-Amylase and B-Glucosidase) Inhibitory Activity of Morinda lucida and Momordica charantia Leaves from Benin. Foods (2020) 9:434. doi: 10.3390/foods9040434
2. Yang J, Fang W, Wu W, Tian Z, Gao R, Yu L, et al. A novel diagnostic biomarker, PZP, for detecting colorectal cancer in type 2 diabetes mellitus patients identified by serum-based mass spectrometry. Front Mol Biosci (2021) 8:736272. doi: 10.3389/fmolb.2021.736272
3. Saeed A, Lambojon K, Saeed H, Saleem Z, Anwer N, Aziz MM, et al. Access to insulin products in Pakistan: A national scale cross-sectional survey on prices, availability, and affordability. Front Pharmacol (2022) 13:820621. doi: 10.3389/fphar.2022.820621
4. Muralidhara S, Lucieri A, Dengel A, Ahmed S. Holistic multi-class classification & grading of diabetic foot ulcerations from plantar thermal images using deep learning. Health Inf Sci Syst (2022) 101:21. doi: 10.1007/s13755-022-00194-8
5. Ślęczkowska M, Almomani R, Marchi M, de Greef BTA, Sopacua M, Hoeijmakers JGJ, et al. Peripheral ion channel gene screening in painful- and painless-diabetic neuropathy. Int J Mol Sci (2022) 23:7190. doi: 10.3390/ijms23137190
6. Kou Z-Z, Wan F-P, Bai Y, Li C-Y, Hu J-C, Zhang G-T, et al. Decreased endomorphin-2 and μ-opioid receptor in the spinal cord are associated with painful diabetic neuropathy. Front Mol Neurosci (2016) 9:80. doi: 10.3389/fnmol.2016.00080
7. Ng YT, Phang SCW, Tan GCJ, Ng EY, Botross Henien NP, M. Palanisamy UD, et al. The effects of tocotrienol-rich vitamin E (Tocovid) on diabetic neuropathy: A phase II randomized controlled trial. Nutrients (2020) 12:1522. doi: 10.3390/nu12051522
8. Sadosky A, Schaefer C, Mann R, Bergstrom F, Baik R, Parsons B, et al. Burden of illness associated with painful diabetic peripheral neuropathy among adults seeking treatment in the US: results from a retrospective chart review and cross-sectional survey. Diabetes Metab Syndr Obes (2013) 6:79–92. doi: 10.2147/DMSO.S37415
9. Knauf MT, Koltyn KF. Exercise-induced modulation of pain in adults with and without painful diabetic neuropathy. J Pain (2014) 15:656–63. doi: 10.1016/j.jpain.2014.02.008
10. Kırça M, Oğuz N, Çetin A, Uzuner F, Yeşilkaya A. Uric acid stimulates proliferative pathways in vascular smooth muscle cells through the activation of p38 MAPK, p44/42 MAPK and PDGFRβ. J Receptors Signal Transduction (2017) 37:167–73. doi: 10.1080/10799893.2016.1203941
11. Kiani J, Habibi Z, Tajziehchi A, Moghimbeigi A, Dehghan A, Azizkhani H. Association between serum uric acid level and diabetic peripheral neuropathy (A case control study). Caspian J Intern Med (2014) 5:17–21.
12. Lin X, Xu L, Zhao D, Luo Z, Pan S. Correlation between serum uric acid and diabetic peripheral neuropathy in T2DM patients. J Neurol Sci (2018) 385:78–82. doi: 10.1016/j.jns.2017.11.034
13. Papanas N, Katsiki N, Papatheodorou K, Demetriou M, Papazoglou D, Gioka T, et al. Peripheral neuropathy is associated with increased serum levels of uric acid in type 2 diabetes mellitus. Angiology (2011) 62:291–5. doi: 10.1177/0003319710394164
14. Zhuang Y, Huang H, Hu X, Zhang J, Cai Q. Serum uric acid and diabetic peripheral neuropathy: a double-edged sword. Acta Neurol Belg (2023) 123:857–63. doi: 10.1007/s13760-022-01978-1
15. Han Y, Wang S, Zhao H, Cao Y, Han X, Di H, et al. Lower serum uric acid levels may lower the incidence of diabetic chronic complications in U.S. adults aged 40 and over. J Clin Med (2023) 12:725. doi: 10.3390/jcm12020725
16. Bell DSH. Correlation between serum uric acid and diabetic peripheral neuropathy – association rather than causation. J Neurological Sci (2018) 390:208. doi: 10.1016/j.jns.2018.04.025
17. Lawlor DA. Commentary: Two-sample Mendelian randomization: opportunities and challenges. Int J Epidemiol (2016) 45:908–15. doi: 10.1093/ije/dyw127
18. Lawlor DA, Harbord RM, Sterne JAC, Timpson N, Davey Smith G. Mendelian randomization: Using genes as instruments for making causal inferences in epidemiology. Stat Med (2008) 27:1133–63. doi: 10.1002/sim.3034
19. Burgess S, Thompson SG. Multivariable Mendelian randomization: the use of pleiotropic genetic variants to estimate causal effects. Am J Epidemiol (2015) 181:251–60. doi: 10.1093/aje/kwu283
20. Tin A, Marten J, Halperin Kuhns VL, Li Y, Wuttke M, Kirsten H, et al. Target genes, variants, tissues and transcriptional pathways influencing human serum urate levels. Nat Genet (2019) 51:1459–74. doi: 10.1038/s41588-019-0504-x
21. Pulit SL, Stoneman C, Morris AP, Wood AR, Glastonbury CA, Tyrrell J, et al. Meta-analysis of genome-wide association studies for body fat distribution in 694 649 individuals of European ancestry. Hum Mol Genet (2019) 28:166–74. doi: 10.1093/hmg/ddy327
22. Willer CJ, Schmidt EM, Sengupta S, Peloso GM, Gustafsson S, Kanoni S, et al. Discovery and refinement of loci associated with lipid levels. Nat Genet (2013) 45:1274–83. doi: 10.1038/ng.2797
23. Soranzo N, Sanna S, Wheeler E, Gieger C, Radke D, Dupuis J, et al. Common variants at 10 genomic loci influence hemoglobin A1(C) levels via glycemic and nonglycemic pathways. Diabetes (2010) 59:3229–39. doi: 10.2337/db10-0502
24. Dupuis J, Langenberg C, Prokopenko I, Saxena R, Soranzo N, Jackson AU, et al. New genetic loci implicated in fasting glucose homeostasis and their impact on type 2 diabetes risk. Nat Genet (2010) 42:105–16. doi: 10.1038/ng.520
25. Sanchez-Roige S, Palmer AA, Fontanillas P, Elson SL, Adams MJ, Howard DM, et al. Genome-wide association study meta-analysis of the Alcohol Use Disorder Identification Test (AUDIT) in two population-based cohorts. Am J Psychiatry (2019) 176:107–18. doi: 10.1176/appi.ajp.2018.18040369
26. Lee JJ, Wedow R, Okbay A, Kong E, Maghzian O, Zacher M, et al. Gene discovery and polygenic prediction from a genome-wide association study of educational attainment in 1.1 million individuals. Nat Genet (2018) 50:1112–21. doi: 10.1038/s41588-018-0147-3
27. Trait: Physical activity - IEU OpenGWAS project. Available at: https://gwas.mrcieu.ac.uk/datasets/ieu-b-4860/ (Accessed June 30, 2023).
28. Liu M, Jiang Y, Wedow R, Li Y, Brazel DM, Chen F, et al. Association studies of up to 1.2 million individuals yield new insights into the genetic etiology of tobacco and alcohol use. Nat Genet (2019) 51:237–44. doi: 10.1038/s41588-018-0307-5
29. Bowden J, Del Greco MF, Minelli C, Davey Smith G, Sheehan NA, Thompson JR. Assessing the suitability of summary data for two-sample Mendelian randomization analyses using MR-Egger regression: the role of the I2 statistic. Int J Epidemiol (2016) 45:1961–74. doi: 10.1093/ije/dyw220
30. Hemani G, Tilling K, Davey Smith G. Orienting the causal relationship between imprecisely measured traits using GWAS summary data. PloS Genet (2017) 13:e1007081. doi: 10.1371/journal.pgen.1007081
31. Hemani G, Zheng J, Elsworth B, Wade KH, Haberland V, Baird D, et al. The MR-Base platform supports systematic causal inference across the human phenome. Elife (2018) 7:e34408. doi: 10.7554/eLife.34408
32. Bowden J, Davey Smith G, Haycock PC, Burgess S. Consistent estimation in Mendelian randomization with some invalid instruments using a weighted median estimator. Genet Epidemiol (2016) 40:304–14. doi: 10.1002/gepi.21965
33. Kulinskaya E, Dollinger MB, Bjørkestøl K. On the moments of Cochran’s Q statistic under the null hypothesis, with application to the meta-analysis of risk difference. Res Synth Methods (2020) 11:920. doi: 10.1002/jrsm.1446
34. Burgess S, Thompson SG. Interpreting findings from Mendelian randomization using the MR-Egger method. Eur J Epidemiol (2017) 32:377–89. doi: 10.1007/s10654-017-0255-x
35. Wu F, Huang Y, Hu J, Shao Z. Mendelian randomization study of inflammatory bowel disease and bone mineral density. BMC Med (2020) 18:312. doi: 10.1186/s12916-020-01778-5
36. Verbanck M, Chen C-Y, Neale B, Do R. Detection of widespread horizontal pleiotropy in causal relationships inferred from Mendelian randomization between complex traits and diseases. Nat Genet (2018) 50:693–8. doi: 10.1038/s41588-018-0099-7
37. Cheng H, Garrick DJ, Fernando RL. Efficient strategies for leave-one-out cross validation for genomic best linear unbiased prediction. J Anim Sci Biotechnol (2017) 8:38. doi: 10.1186/s40104-017-0164-6
38. Guan W, Steffen BT, Lemaitre RN, Wu JHY, Tanaka T, Manichaikul A, et al. Genome-wide association study of plasma N6 polyunsaturated fatty acids within the CHARGE consortium. Circ Cardiovasc Genet (2014) 7:321–31. doi: 10.1161/CIRCGENETICS.113.000208
39. Brion M-JA, Shakhbazov K, Visscher PM. Calculating statistical power in Mendelian randomization studies. Int J Epidemiol (2013) 42:1497–501. doi: 10.1093/ije/dyt179
40. Abraham A, Breiner A, Barnett C, Katzberg HD, Lovblom LE, Perkins BA, et al. Uric acid levels correlate with the severity of diabetic sensorimotor polyneuropathy. J Neurol Sci (2017) 379:94–8. doi: 10.1016/j.jns.2017.05.053
41. Fayazi HS, Yaseri M, Mortazavi SS, Sharifhassan Z, Assadinia A-S. The relation between serum uric acid levels and diabetic peripheral neuropathy in type 2 diabetes in Guilan, north of Iran. BMC Endocr Disord (2022) 22:39. doi: 10.1186/s12902-022-00952-5
42. Kaewput W, Thongprayoon C, Rangsin R, Jindarat S, Narindrarangkura P, Bathini T, et al. The association between serum uric acid and peripheral neuropathy in patients with type 2 diabetes mellitus: A multicenter nationwide cross sectional study. Korean J Fam Med (2020) 41:189–94. doi: 10.4082/kjfm.18.0205
43. Pafili K, Katsiki N, Mikhailidis DP, Papanas N. Serum uric acid as a predictor of vascular complications in diabetes: an additional case for neuropathy. Acta Diabetol (2014) 51:893–4. doi: 10.1007/s00592-014-0631-x
44. Yu S, Chen Y, Hou X, Xu D, Che K, Li C, et al. Serum uric acid levels and diabetic peripheral neuropathy in type 2 diabetes: a systematic review and meta-analysis. Mol Neurobiol (2016) 53:1045–51. doi: 10.1007/s12035-014-9075-0
45. Gaita L, Timar R, Lupascu N, Roman D, Albai A, Potre O, et al. The impact of hyperuricemia on cardiometabolic risk factors in patients with diabetes mellitus: A cross-sectional study. Diabetes Metab Syndr Obes (2019) 12:2003–10. doi: 10.2147/DMSO.S222570
46. Laukkanen JA, Zaccardi F, Karppi J, Ronkainen K, Kurl S. Reduced kidney function is a risk factor for atrial fibrillation. Nephrol (Carlton) (2016) 21:717–20. doi: 10.1111/nep.12727
47. Liu L, Jiang S, Liu X, Tang Q, Chen Y, Qu J, et al. Inflammatory Response and Oxidative Stress as Mechanism of Reducing Hyperuricemia of Gardenia jasminoides-Poria cocos with Network Pharmacology. Oxid Med Cell Longev (2021) 2021:8031319. doi: 10.1155/2021/8031319
48. Zhang J, Zhou L, Cui L, Liu Z, Wei J, Kang W. Antioxidant and α-glucosidase inhibitiory activity of Cercis chinensis flowers. Food Sci Hum Wellness (2020) 9:313–9. doi: 10.1016/j.fshw.2020.04.003
49. Abas R, Othman F, Thent ZC. Protective effect of momordica charantia fruit extract on hyperglycaemia-induced cardiac fibrosis. Oxid Med Cell Longev (2014) 2014:429060. doi: 10.1155/2014/429060
50. Penckofer S, Schwertz D, Florczak K. Oxidative stress and cardiovascular disease in type 2 diabetes: the role of antioxidants and pro-oxidants. J Cardiovasc Nurs (2002) 16:68–85. doi: 10.1097/00005082-200201000-00007
51. Park H-C, Park J-K, Choi SI, Kim S-G, Kim MK, Choi BY, et al. Prevalence of atrial fibrillation and relation to echocardiographic parameters in a healthy asymptomatic rural Korean population. J Korean Med Sci (2015) 30:1078–84. doi: 10.3346/jkms.2015.30.8.1078
52. Fini MA, Gaydos J, McNally A, Karoor V, Burnham EL. Alcohol abuse is associated with enhanced pulmonary and systemic xanthine oxidoreductase activity. Am J Physiol Lung Cell Mol Physiol (2017) 313:L1047–57. doi: 10.1152/ajplung.00570.2016
53. Lu W, Xu Y, Shao X, Gao F, Li Y, Hu J, et al. Uric acid produces an inflammatory response through activation of NF-κB in the hypothalamus: implications for the pathogenesis of metabolic disorders. Sci Rep (2015) 5:12144. doi: 10.1038/srep12144
54. Choi Y-J, Yoon Y, Lee K-Y, Hien TT, Kang KW, Kim K-C, et al. Uric acid induces endothelial dysfunction by vascular insulin resistance associated with the impairment of nitric oxide synthesis. FASEB J (2014) 28:3197–204. doi: 10.1096/fj.13-247148
55. Struys T, Govaerts K, Oosterlinck W, Casteels C, Bronckaers A, Koole M, et al. In vivo evidence for long-term vascular remodeling resulting from chronic cerebral hypoperfusion in mice. J Cereb Blood Flow Metab (2017) 37:726–39. doi: 10.1177/0271678X16638349
56. Jia L, Xing J, Ding Y, Shen Y, Shi X, Ren W, et al. Hyperuricemia causes pancreatic β-cell death and dysfunction through NF-κB signaling pathway. PloS One (2013) 8:e78284. doi: 10.1371/journal.pone.0078284
57. Lin Y, Fan R, Hao Z, Li J, Yang X, Zhang Y, et al. The association between physical activity and insulin level under different levels of lipid indices and serum uric acid(2022) (Accessed October 7, 2023).
58. Zhang H, Chen Y, Zhu W, Niu T, Song B, Wang H, et al. The mediating role of HbA1c in the association between elevated low-density lipoprotein cholesterol levels and diabetic peripheral neuropathy in patients with type 2 diabetes mellitus. Lipids Health Dis (2023) 22:102. doi: 10.1186/s12944-023-01865-5
59. Dovell F, Boffetta P. Serum uric acid and cancer mortality and incidence: a systematic review and meta-analysis. Eur J Cancer Prev (2018) 27:399. doi: 10.1097/CEJ.0000000000000440
60. Nieradko-Iwanicka B. The role of alcohol consumption in pathogenesis of gout. Crit Rev Food Sci Nutr (2022) 62:7129–37. doi: 10.1080/10408398.2021.1911928
Keywords: diabetic neuropathy, serum urate acid, Mendelian randomization study, linkage disequilibrium score regression (LDSC), genetic correlation
Citation: Zhang Y, Tang Z, Tong L, Wang Y and Li L (2023) Serum uric acid and risk of diabetic neuropathy: a genetic correlation and mendelian randomization study. Front. Endocrinol. 14:1277984. doi: 10.3389/fendo.2023.1277984
Received: 15 August 2023; Accepted: 25 October 2023;
Published: 15 November 2023.
Edited by:
Qi Pan, Peking University, ChinaReviewed by:
Takahisa Deguchi, Kagoshima University, JapanRizaldy Taslim Pinzon, Duta Wacana Christian University, Indonesia
Copyright © 2023 Zhang, Tang, Tong, Wang and Li. This is an open-access article distributed under the terms of the Creative Commons Attribution License (CC BY). The use, distribution or reproduction in other forums is permitted, provided the original author(s) and the copyright owner(s) are credited and that the original publication in this journal is cited, in accordance with accepted academic practice. No use, distribution or reproduction is permitted which does not comply with these terms.
*Correspondence: Lin Li, MjAyMjcyMTA0NkB5YW5ndHpldS5lZHUuY24=