 Xiao-Fang Wang1†
 Xiao-Wen Zhang2†
 Ya-Jun Liu1Xin-Yu Zheng1
 Meng-Ru Su1*‡
 Xing-Hong Sun1*‡Feng Jiang1*‡Zhi-Nan Liu3*‡
- 1Department of Ophthalmology, Nanjing Drum Tower Hospital, The Affiliated Hospital of Nanjing University Medical School, Nanjing, China
- 2Department of Endocrinology, Nanjing Drum Tower Hospital, The Affiliated Hospital of Nanjing University Medical School, Nanjing, China
- 3Department of Ophthalmology, Changzhou Third People’s Hospital, Changzhou Medical Center, Nanjing Medical University, Changzhou, China
Background: Previous research has indicated a vital association between hypertension, intraocular pressure (IOP), and diabetic retinopathy (DR); however, the relationship has not been elucidated. In this study, we aim to investigate the causal association of hypertension, IOP, and DR.
Methods: The genome-wide association study (GWAS) IDs for DR, hypertension, and IOP were identified from the Integrative Epidemiology Unit (IEU) Open GWAS database. There were 33,519,037 single-nucleotide polymorphisms (SNPs) and a sample size of 1,030,836 for DR. There were 16,380,466 SNPs and 218,754 participants in the hypertension experiment. There were 9,851,867 SNPs and a sample size of 97,465 for IOP. Univariable, multivariable, and bidirectional Mendelian randomization (MR) studies were conducted to estimate the risk of hypertension and IOP in DR. Moreover, causality was examined using the inverse variance weighted method, and MR results were verified by numerous sensitivity analyses.
Results: A total of 62 SNPs at the genome-wide significance level were selected as instrumental variables (IVs) for hypertension-DR. The results of univariable MR analysis suggested a causal relationship between hypertension and DR and regarded hypertension as a risk factor for DR [p = 0.006, odds ratio (OR) = 1.080]. A total of 95 SNPs at the genome-wide significance level were selected as IVs for IOP-DR. Similarly, IOP was causally associated with DR and was a risk factor for DR (p = 0.029, OR = 1.090). The results of reverse MR analysis showed that DR was a risk factor for hypertension (p = 1.27×10⁻¹⁰, OR = 1.119), but there was no causal relationship between DR and IOP (p > 0.05). The results of multivariate MR analysis revealed that hypertension and IOP were risk factors for DR, which exhibited higher risk scores (p = 0.001, OR = 1.121 and p = 0.030, OR = 1.124, respectively) than those in univariable MR analysis. Therefore, hypertension remained a risk factor for DR after excluding the interference of IOP, and IOP was still a risk factor for DR after excluding the interference of hypertension.
Conclusion: This study validated the potential causal relationship between hypertension, IOP, and DR using MR analysis, providing a reference for the targeted prevention of DR.
1 Introduction
According to the report of the International Diabetes Federation, approximately 400 million people have diabetes currently, and the prevalence rate of diabetes will be close to 600 million by 2035 (1, 2). Among the microvascular complications of diabetes, diabetic retinopathy (DR) is reported to be the most common cause of visual impairment in adults of working age (3). Additionally, some patients with diabetes mellitus type 2 (T2DM) still acquire javascript:;DR after 6.5–13.3 years even if blood sugar is strictly controlled (4, 5). Identifying the risk factors of DR is an important part of implementing preventive interventions to deal with the growing threat.
Since hypertension is a condition that can be controlled, an increasing number of observational epidemiological studies are focusing on how it impacts DR. Based on the existing research, the relationship between the outcomes of hypertension-related factors and the emergence of DR is controversial and inconsistent. Based on the findings of the Large Prospective UK Prospective Diabetes Study, DR is associated with systolic blood pressure (SBP) in patients with T2DM (6). However, the onset and progression of DR in patients with T2DM were not correlated with baseline systolic and diastolic blood pressure in the same study (7). Some studies have reported that SBP and hypertensive retinopathy are the primary predictors of DR in patients with T1DM solely and have no impact on T2DM (8). In a community-based DR screening study of Chinese adults with T2DM, it is necessary to reduce SBP (<140 mmHg) and glycosylated hemoglobin (HbA1c) (<7.0%) levels in combination rather than alone, which is believed to be related to a significant reduction in the possibility of DR (9).
An increasing number of studies are focusing on the relationship between DM/DR/intraocular pressure (IOP). DM is believed to easily damage the optic nerve via retinal vascular destruction and imbalance and various neurodegenerative mechanisms and destroy the trabecular meshwork route of water outflow, further causing high IOP and optic nerve injury (10–12). A cohort study has revealed that among patients with diabetes, patients with glaucoma and/or high IOP were more likely to develop DR within 5 years (13). However, Gangwani et al. conducted a cross-sectional study on 470 patients with DR and demonstrated that there was no correlation between DR and glaucoma (14). Nevertheless, there may be a longitudinal association between DR, glaucoma, and/or high IOP in the DR population.
To recapitulate, the causal relationship between IOP and DR remains elusive. Although the potential confounding factors are strictly controlled, residual unmeasured confounding factors can still affect the analysis of observational studies. Both the causal relationship between potential risk factors and the risk of DR and the suggestion for preventive treatment cannot be established solely based on observational data. Mendelian randomization (MR) analysis used genetic predictors as instrumental variables (IVs) to examine the causal relationship between risk factors and diseases. Since genetic variation is randomly distributed at conception, each IV is considered an alternative to randomized controlled trials (RCTs), which can prevent various deviations present in traditional observational studies.
MR analysis of DR exhibits that intestinal flora and adiponectin are also reported to have a direct causal relationship with DR in addition to traditional unhealthy habits such as smoking and drinking (15–18). However, whether there is a direct causal relationship between hypertension, IOP, and DR remains elusive. Our study for the first time provides direct evidence of the causal relationship between hypertension and IOP as independent risk factors and their combined effects on the risk of DR via MR analysis.
2 Materials and methods
2.1 Outcome source and data pre-processing
Our study was a bidirectional MR analysis. The DR dataset was gathered from the genome-wide association studies (GWAS) database (https://gwas.mrcieu.ac.uk/). There were 33,519,037 single-nucleotide polymorphisms (SNPs) and a sample size of 1,030,836 for DR. There were 16,380,466 SNPs and a sample size of 218,754 for hypertension. There were 9,851,867 SNPs and a sample size of 97,465 for IOP. Genetic variants for hypertension and IOP were derived from GWAS datasets with 408,442 and 307,638 individuals each, respectively. The overview of this study’s design is presented in Figure 1. Since the data we used were based on published studies and public databases, no additional ethical approval from an institutional review board was required.
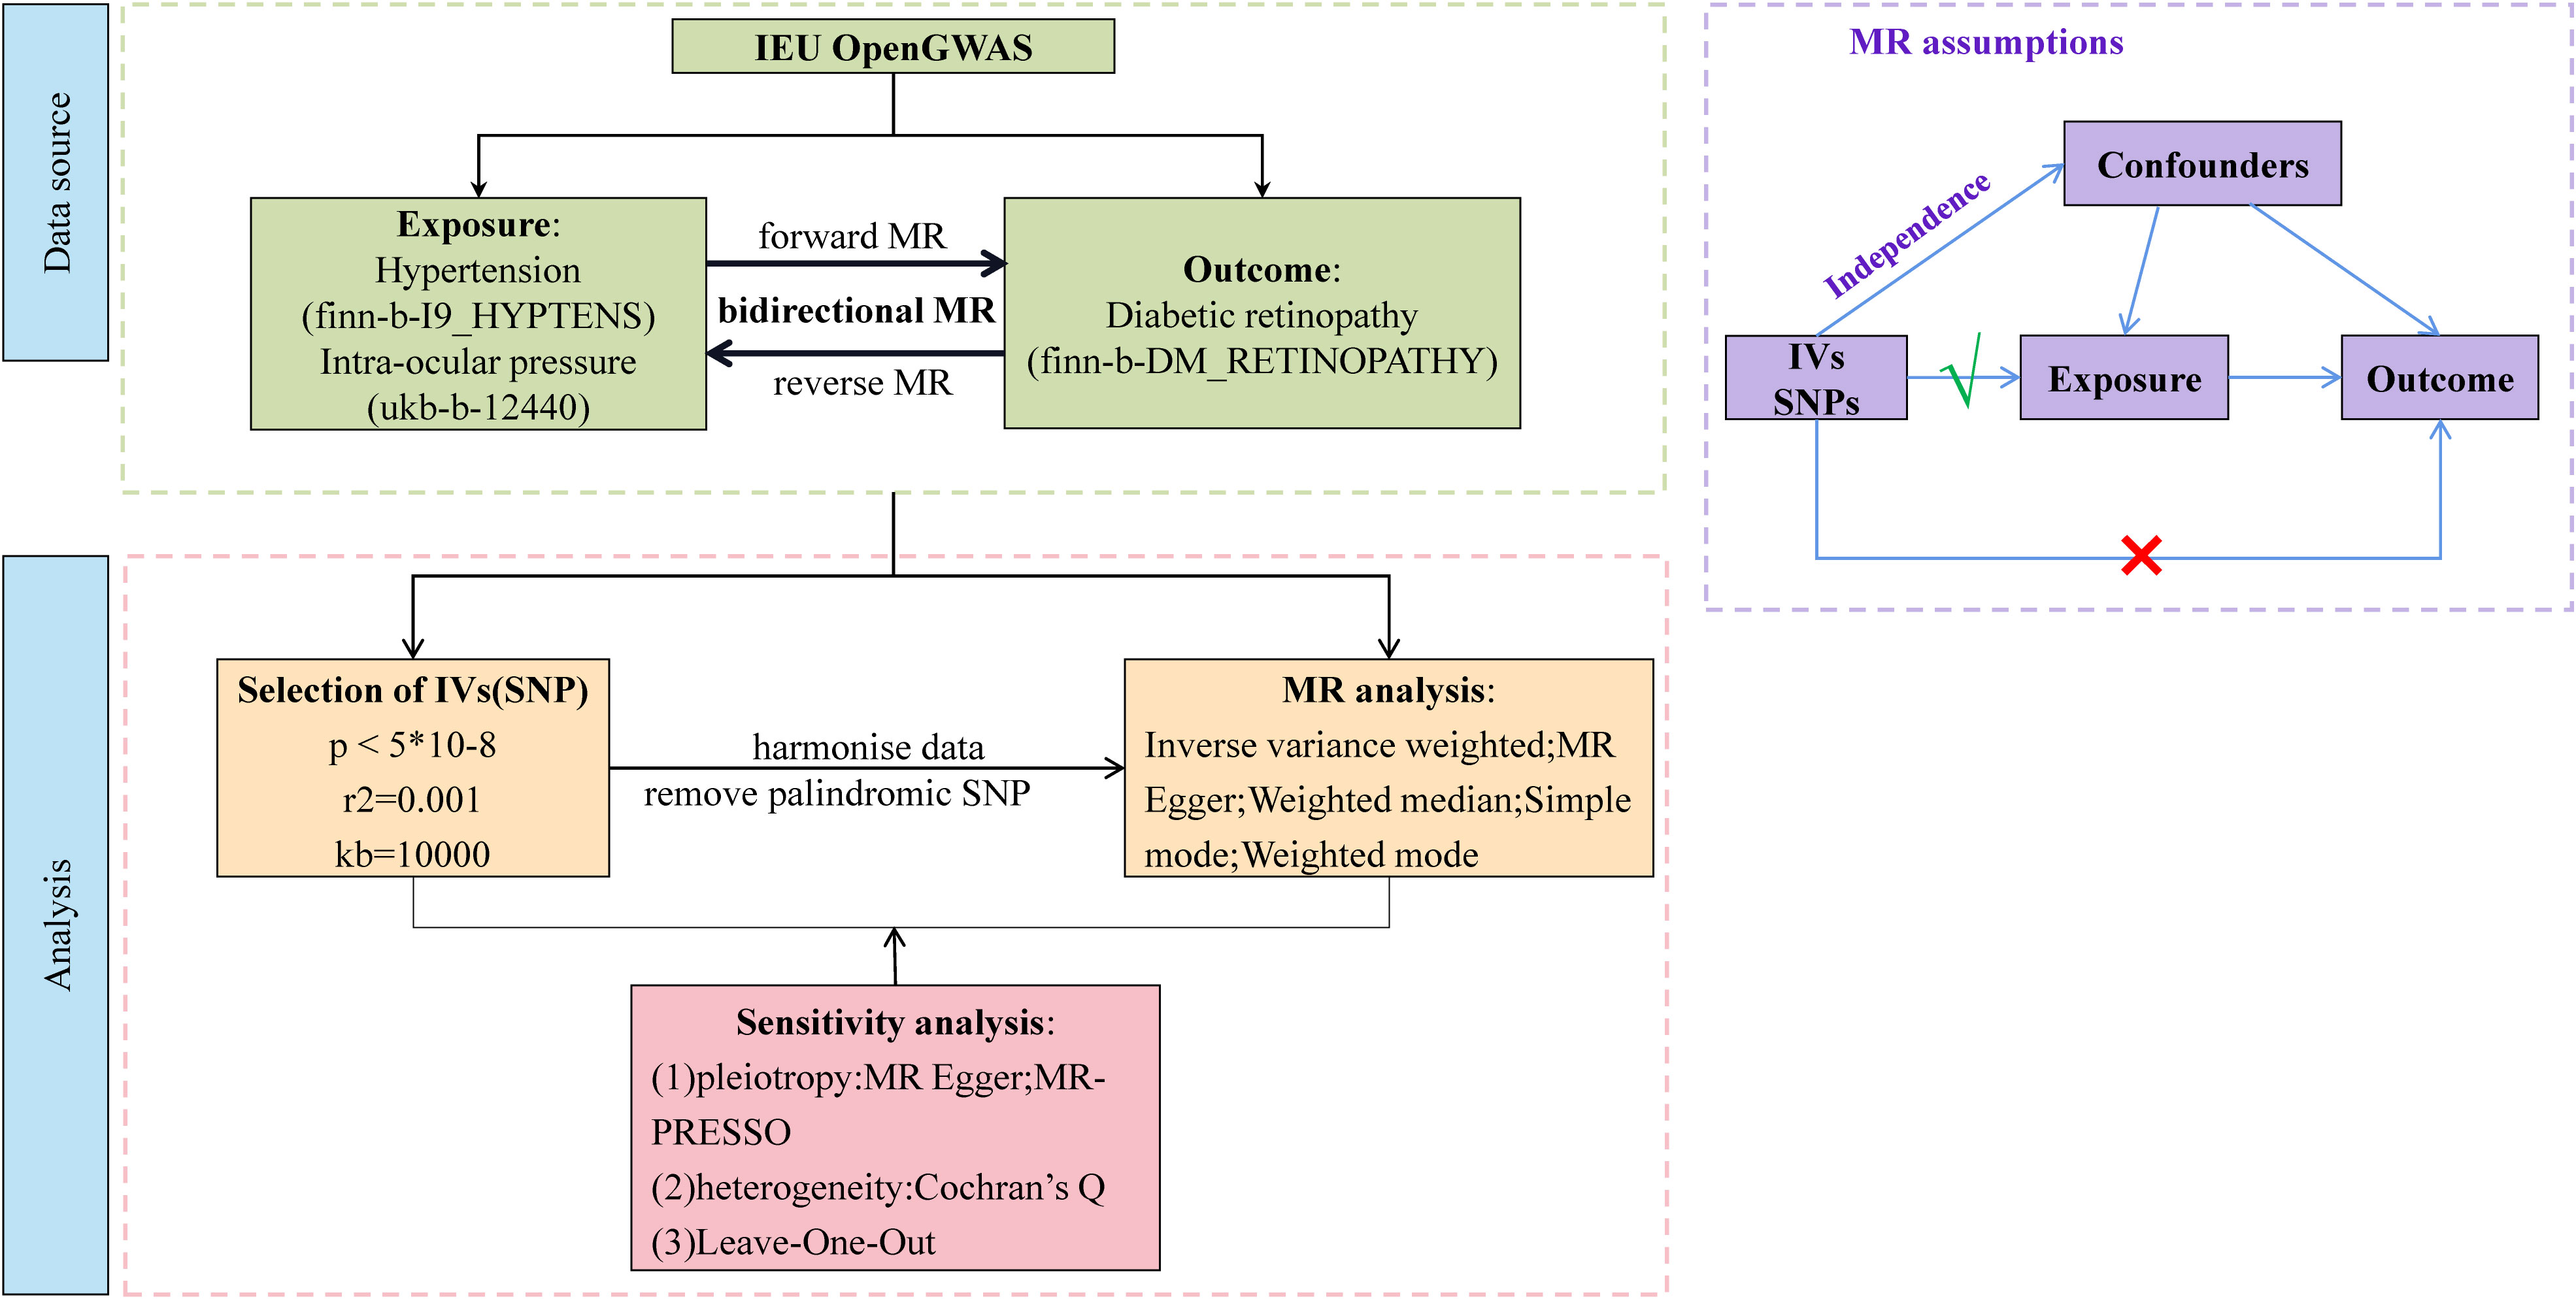
Figure 1 Overview of Mendelian randomization (MR) analyses process and basic assumptions.
2.2 Selection of eligible instrumental variable
This MR study was based on the following three core assumptions: (1) there is a robust association between IVs and exposure; (2) the IVs are independent of confounders; and (3) the IVs can only affect the outcome via exposure without other pathways. Therefore, to meet the first assumption, the SNP set was restricted to be directly associated with the exposure at the genome-wide significant p-value threshold at p< 5 × 10⁻⁸ as potential instruments. Reading of exposure factors and filtering of IVs were done using the two-SampleMR R package (version 0.5.6) and the extract instrument function (19). The strength of IVs was assessed by calculating the F-statistic using the formula , where R2 represents the proportion of variance in the exposure explained by the genetic variants, N represents sample size, and K represents the number of instruments. If the corresponding F-statistic was > 10, it was considered that there was no significant weak instrumental bias (20).
2.3 MR analysis
Independent SNPs were clumped at a threshold of linkage disequilibrium (LD) at r2 = 0.001 within the window of 10 megabase pairs; eligible IVs were selected to prevent double counting and biased causal effect estimates. Furthermore, the IVs were extracted from the outcome trait and harmonized in both exposure and outcome GWAS. In this step, palindromic SNPs with intermediate allele frequency were removed.
We performed a total of two univariable MR analyses using summary statistics from a GWAS to investigate the bidirectional association between hypertension, IOP, and DR. The forward MR analyses considered hypertension and IOP as the exposure and DR as the outcome, while the reverse MR analyses considered DR as the exposure and hypertension and IOP as the outcome. Five methods—MR Egger, weighted median, inverse variance weighted (IVW), simple mode, and weighted mode—were used to complete the univariable MR analysis. IVW was utilized as the primary MR analysis method, which yielded reliable results if there was no horizontal pleiotropy, with the other methods serving as secondary methods. We used multivariable MR analysis, an extension of univariable MR that enables concurrent detection of causative effects of multiple risk factors, to investigate the direct effects of hypertension and IOP on DR. The IVW method was used for MR analysis, which provided a consistent estimate of the relationship between exposure and the risk of outcomes when IVs were not pleiotropic. The SNPs used to conduct multivariable MR were combinations of IVs of each exposure. Cochran’s Q statistics was performed to assess the heterogeneity across individual SNPs.
Sensitivity testing was performed using the following three methods: (1) the heterogeneity test mr_heterogeneity, where a Q value >0.05 indicates that there is no heterogeneity; (2) the horizontal pleiotropy test Horizontal pleiotropy, where a p-value >0.05 indicates that there is no horizontal pleiotropy; (3) the Leave-One-Out method, which aims at determining whether there are outlier values for the effect of each SNP.
3 Results
3.1 Forward univariable MR analysis of hypertension, IOP, and DR
In the primary analysis, a total of 62 SNPs at the genome-wide significance level were selected as IVs for hypertension-DR (Supplementary Table 1). The results of univariable MR analyses suggested a causal relationship between hypertension and DR and hypertension as a risk factor for DR (p = 0.006, OR = 1.080). The weighted median method result was similar to that of IVW (p = 0.022, OR = 1.090, Figure 2). The scatter plot suggested that the slope of the lines for all five methods was positive, indicating that hypertension is a risk factor for DR (Figure 3A). The results of the forest plot implied that the SNP points for both MR Egger and IVW methods were on the right, supporting the notion that hypertension is a risk factor for DR (Figure 3B). The funnel plot depicted that MR is consistent with Mendel’s second law of random grouping (Figure 3C). The results of sensitivity analysis demonstrated that the Q value of this analysis was 0.057, which was greater than 0.05 without heterogeneity, and the p-value of horizontal pleiotropy was 0.621, indicating that there was no horizontal multi-effect. The forest plot of the leave-one-out method indicated that all error lines were to the right of 0, indicating that there were no points of deviation and that hypertension was a risk factor for DR (Figure 3D).
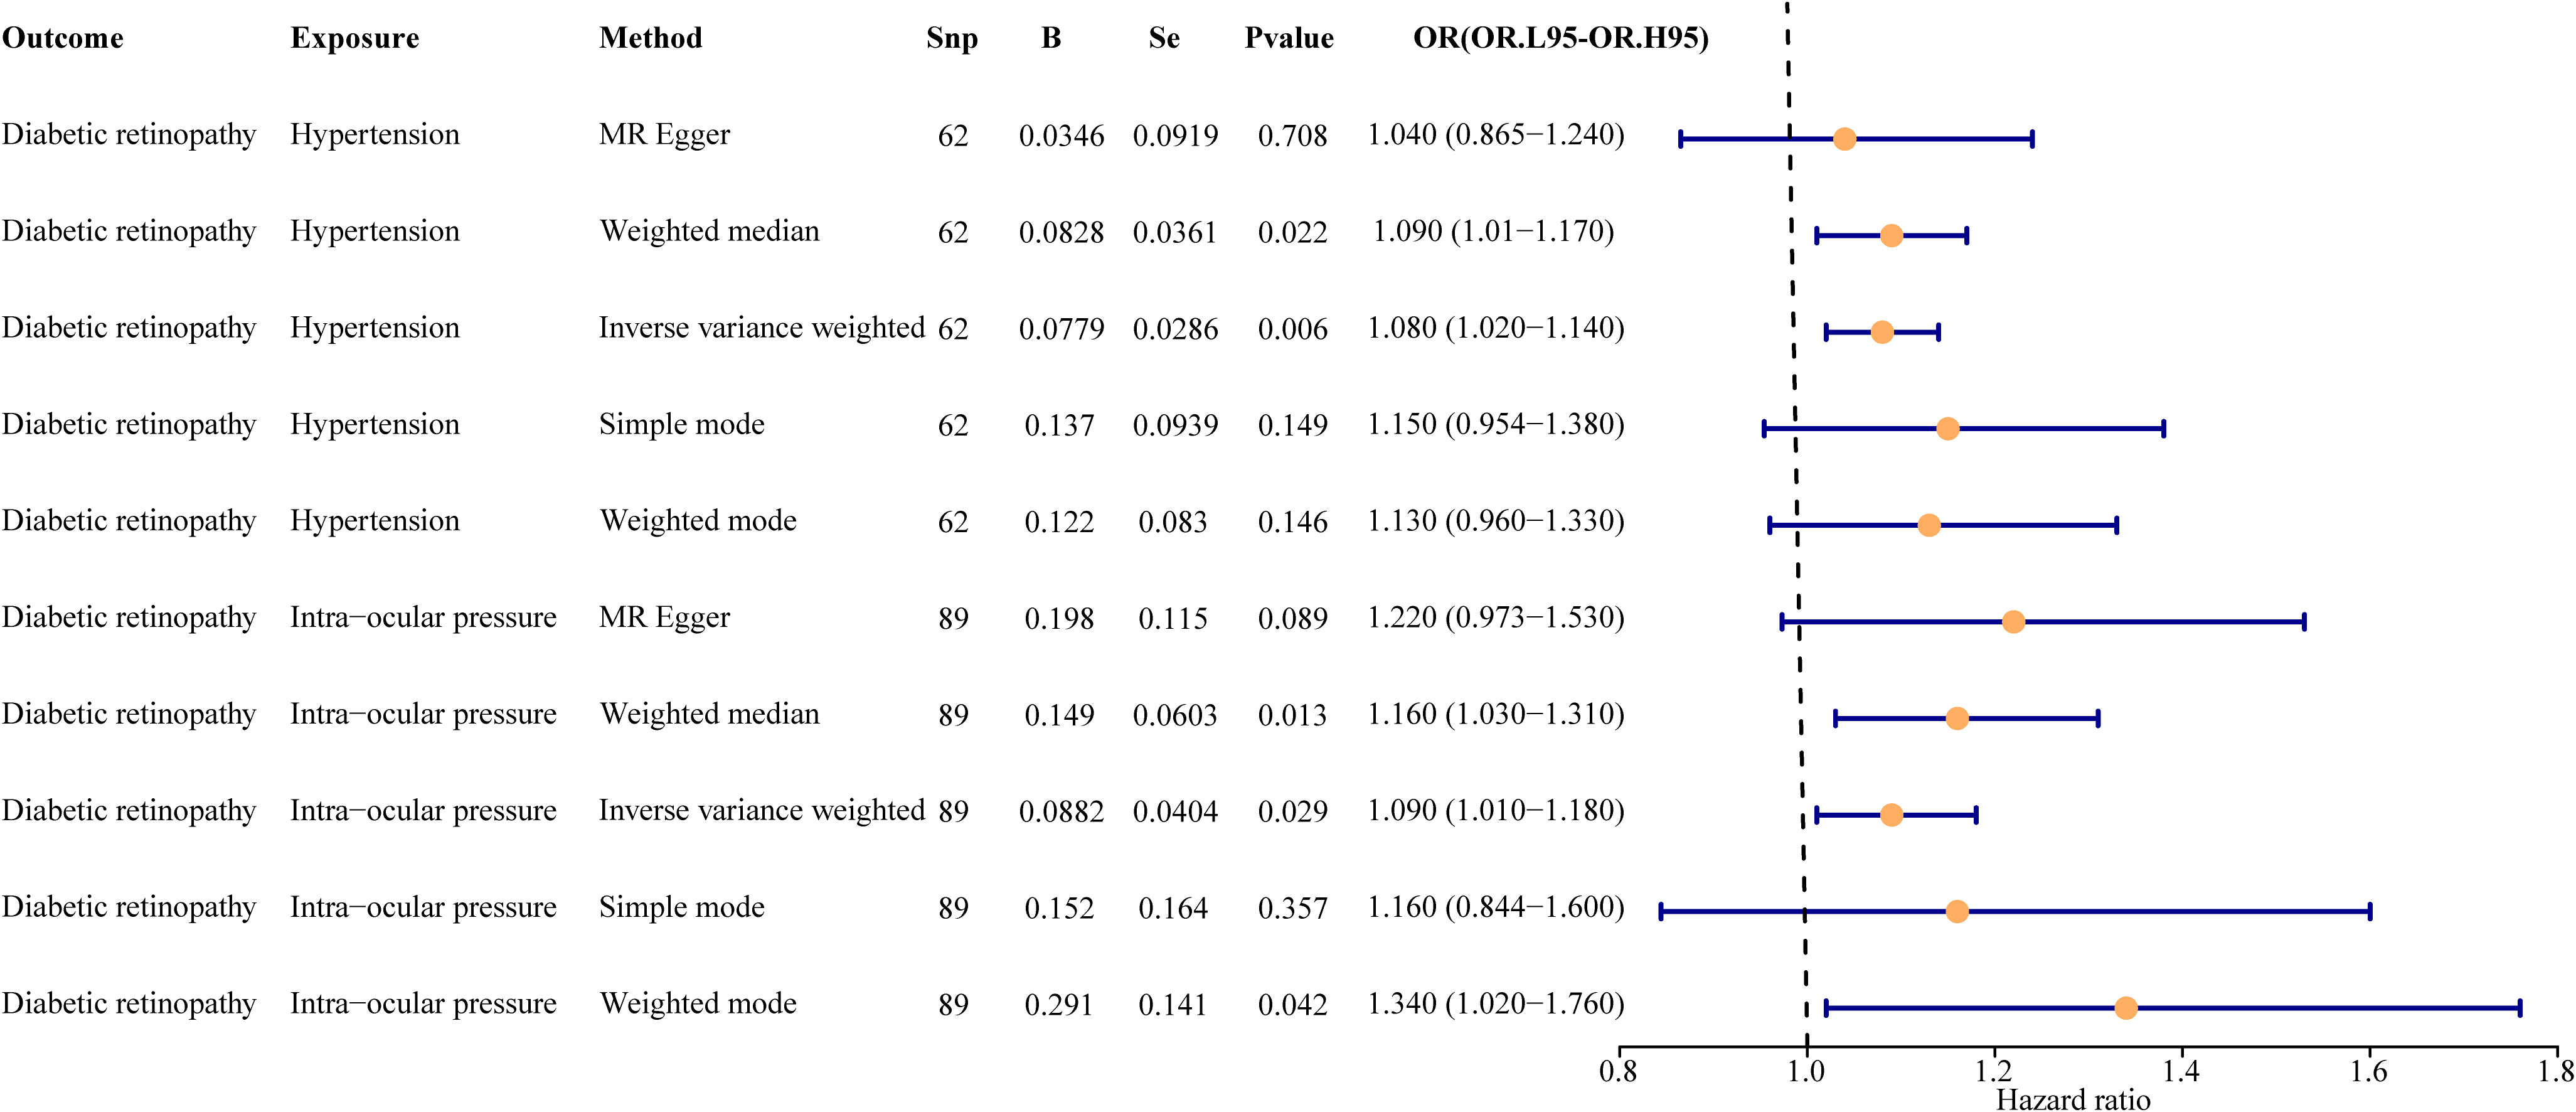
Figure 2 Univariate result forest map. The orange circle indicates that hazard ratio (HR) > 1, and the line segments on either side of the circle are 95% confidence intervals (CI) for HR values.
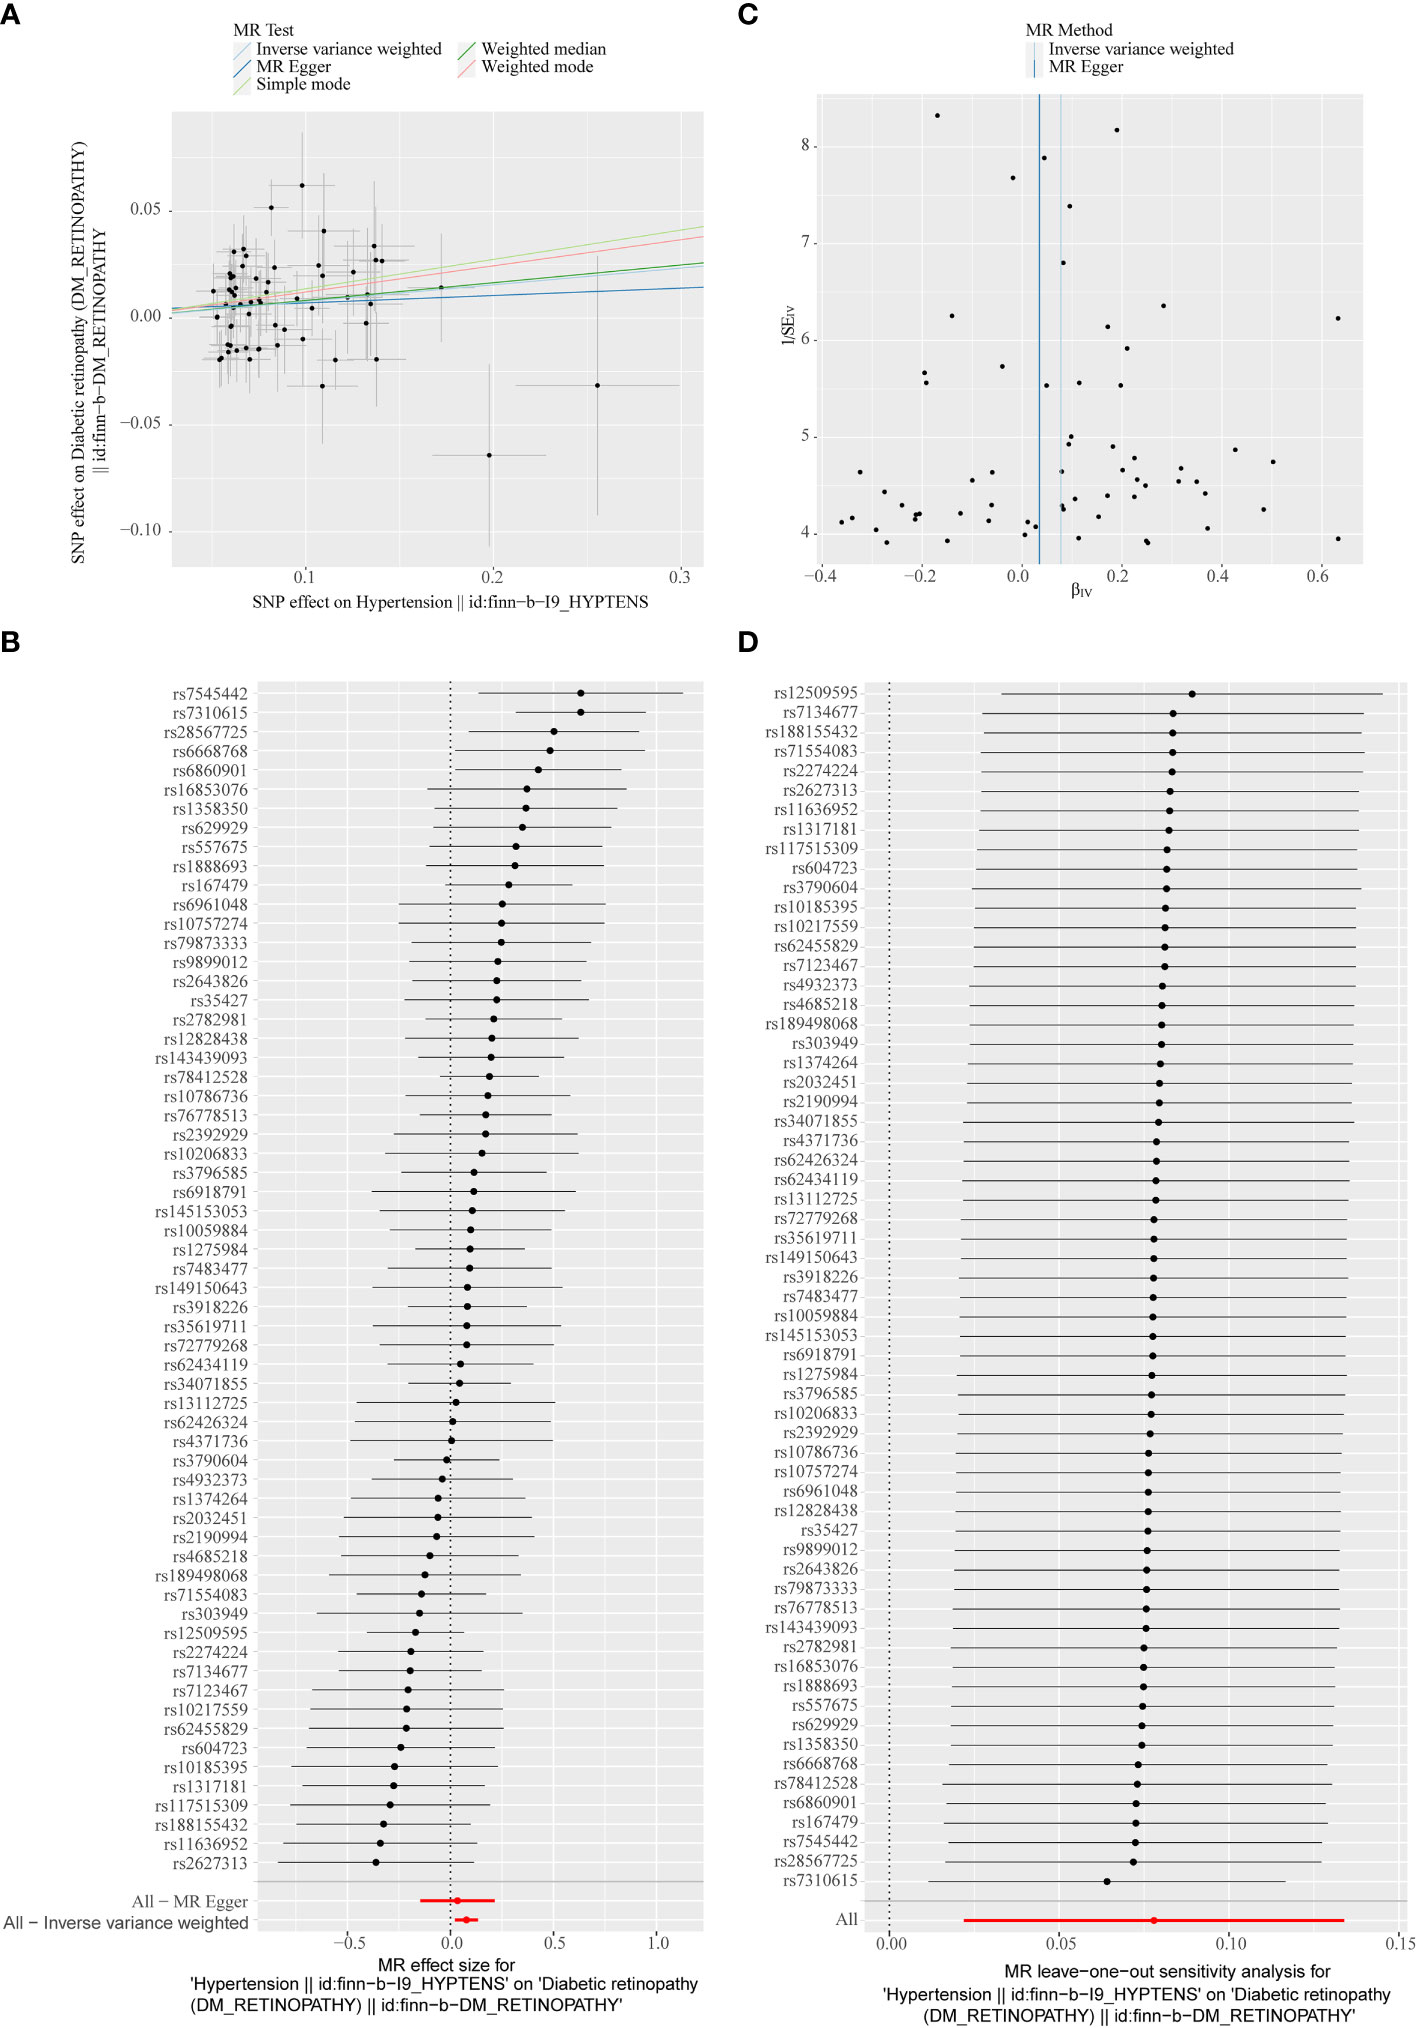
Figure 3 (A) Scatter plots of the MR analyses for the association of hypertension and the risk of diabetic retinopathy (DR). The colored lines represent fitting result of different algorithms. Error bars indicate 95% CI. (B) Forest plot of MR results of hypertension effect on DR. (C) Funnel plots of MR estimates for the effect of hypertension on the risk of DR. (D) Leave-One-Out plot for sensitivity test for the effect of hypertension on DR.
A total of 95 SNPs at the genome-wide significance level were selected as IVs for IOP-DR (Supplementary Table 2). Similarly, IOP was causally associated with DR, and IOP was a risk factor for DR (p = 0.029, OR = 1.090). The result of the weighted median method was similar to that of IVW (p = 0.013, OR = 1.160, Figure 2). The scatter plot suggested that the slope of the lines for all five methods was positive, suggesting that IOP is a risk factor for DR (Figure 4A). The results of the forest plot indicated that the SNP points for both MR Egger and IVW were on the right, supporting the notion that IOP is a risk factor for DR (Figure 4B). The funnel plot depicted that MR is consistent with Mendel’s second law of random grouping (Figure 4C). The results of sensitivity analysis implied that the Q value of this analysis was 0.052, which was greater than 0.05 without heterogeneity, and the p-value of Horizontal pleiotropy was 0.311, indicating that there was no horizontal multi-effect. The forest plot of the leave-one-out method demonstrated that all error lines were to the right of 0, indicating that there were no points of deviation and that IOP was a risk factor for DR (Figure 4D).
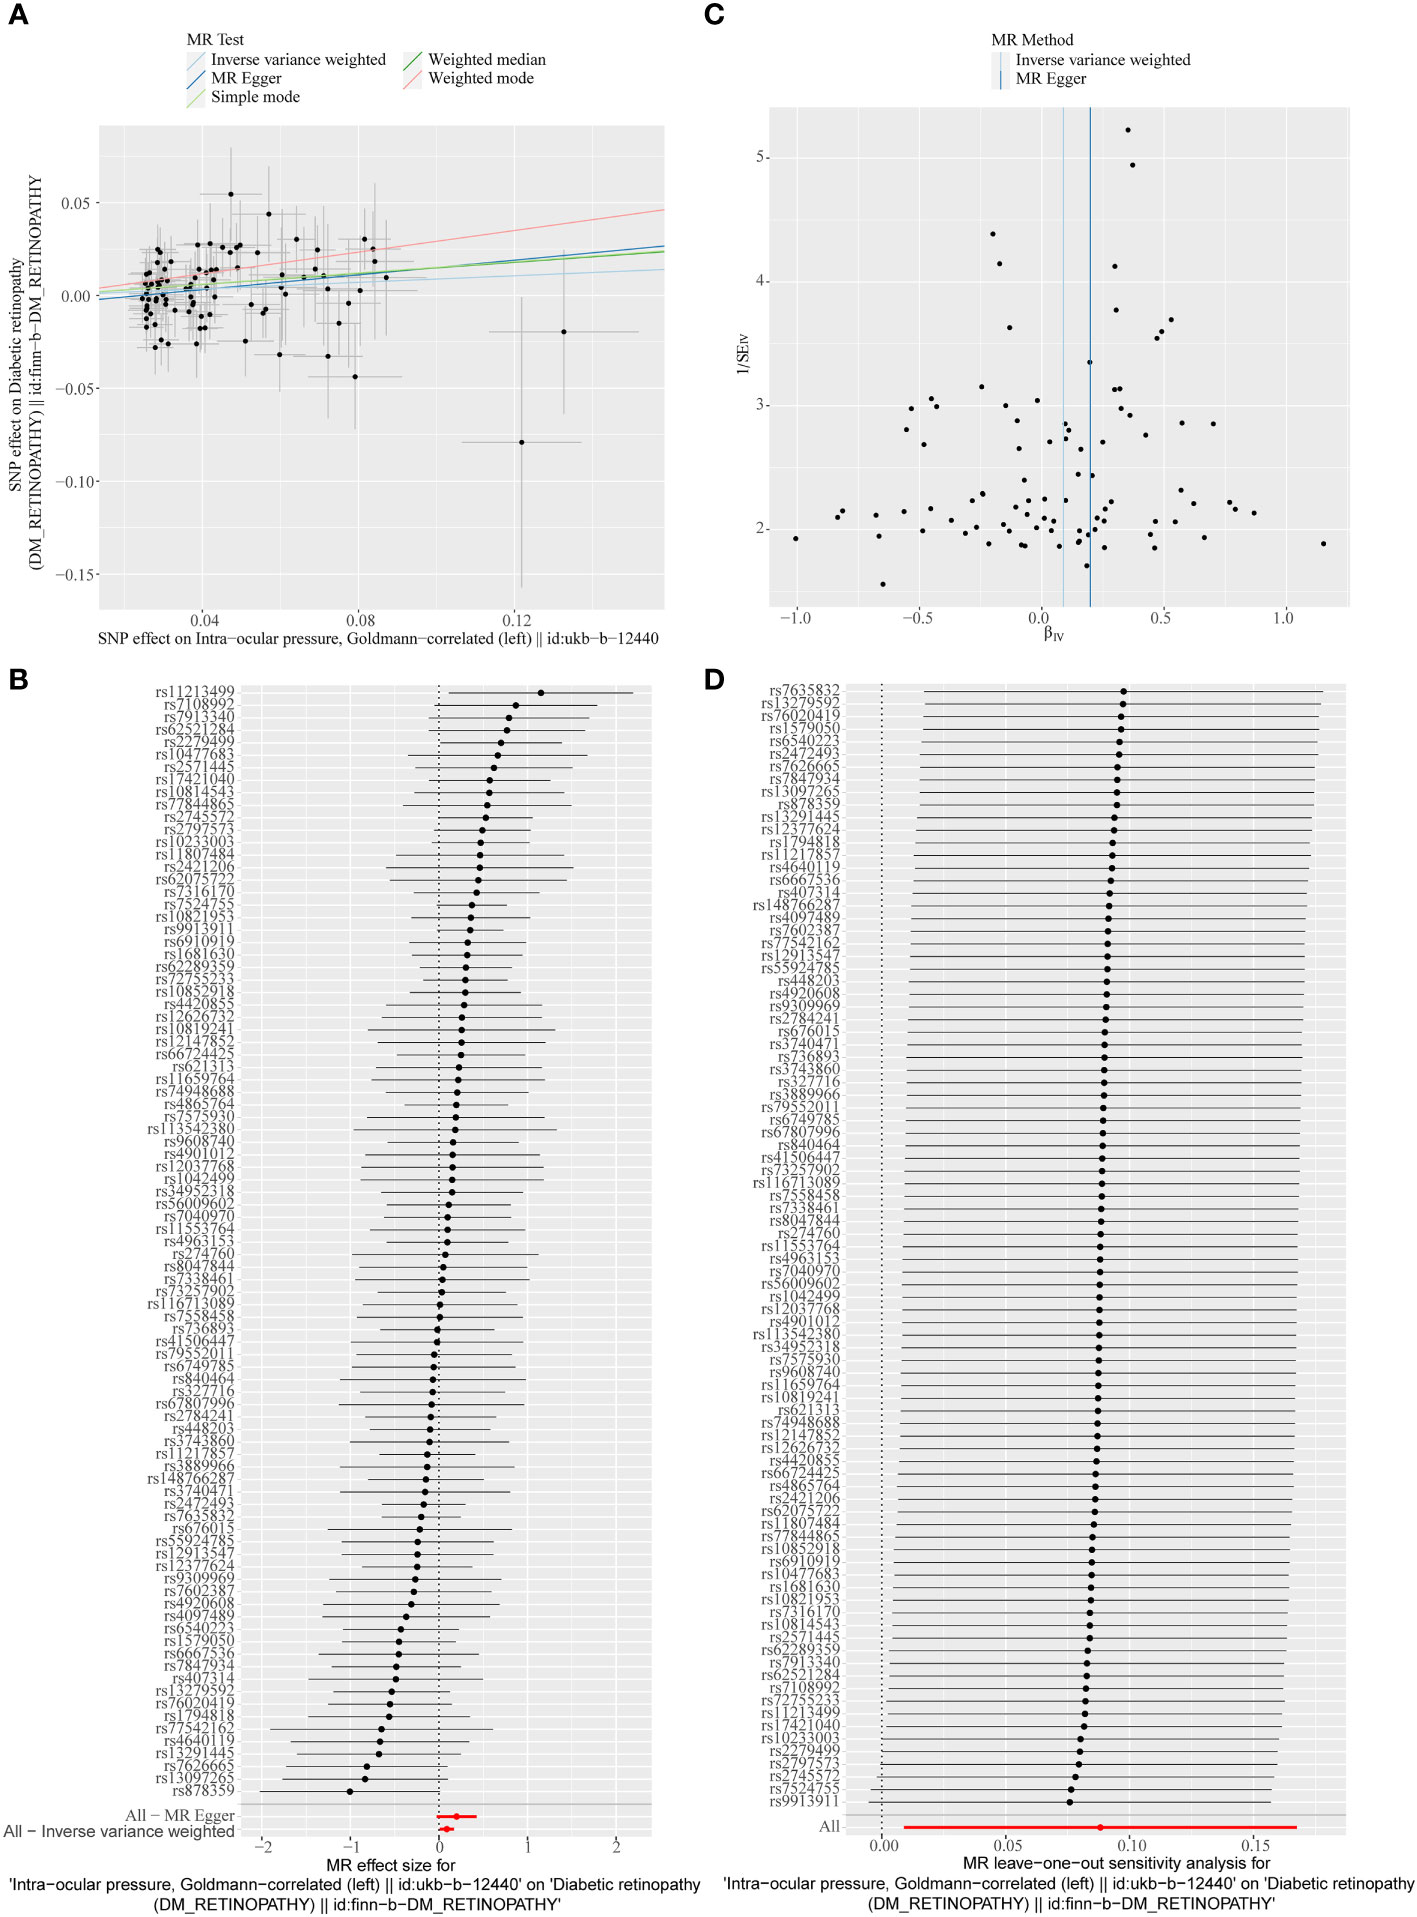
Figure 4 (A) Scatter plots of the MR analyses for the association of intraocular pressure (IOP) and the risk of DR. (B) Forest plot of MR results of IOP effect on DR. (C) Funnel plots of MR estimates for the effect of IOP on the risk of DR. (D) Leave-One-Out plot for sensitivity test for the effect of IOP on DR.
3.2 Reverse univariable MR analysis of DR, hypertension, and IOP
In the primary analysis, a total of 14 SNPs at the genome-wide significance level were selected as IVs for DR-hypertension (Supplementary Table 3). The results of reverse univariable MR analyses suggested a causal relationship between DR and hypertension and DR as a risk factor for hypertension (p = 1.27×10⁻¹⁰, OR = 1.119, Table 1). The weighted median method result was similar to that of IVW (p = 2.72×10⁻⁹, OR = 1.131, Table 1). The scatter plot suggested that the slope of the lines for all five methods was positive, indicating that DR is a risk factor for hypertension (Figure 5A). The results of the forest plot implied that the SNP points for both MR Egger and IVW methods were on the right, supporting the notion that DR is a risk factor for hypertension (Figure 5B). The funnel plot depicted that MR is consistent with Mendel’s second law of random grouping (Figure 5C). The results of sensitivity analysis demonstrated that the Q value of this analysis was 0.250, which was greater than 0.05 without heterogeneity, and the p-value of horizontal pleiotropy was 0.598, indicating that there was no horizontal multi-effect. The forest plot of the leave-one-out method indicated that all error lines were to the right of 0, indicating that there were no points of deviation and that DR was a risk factor for hypertension (Figure 5D).
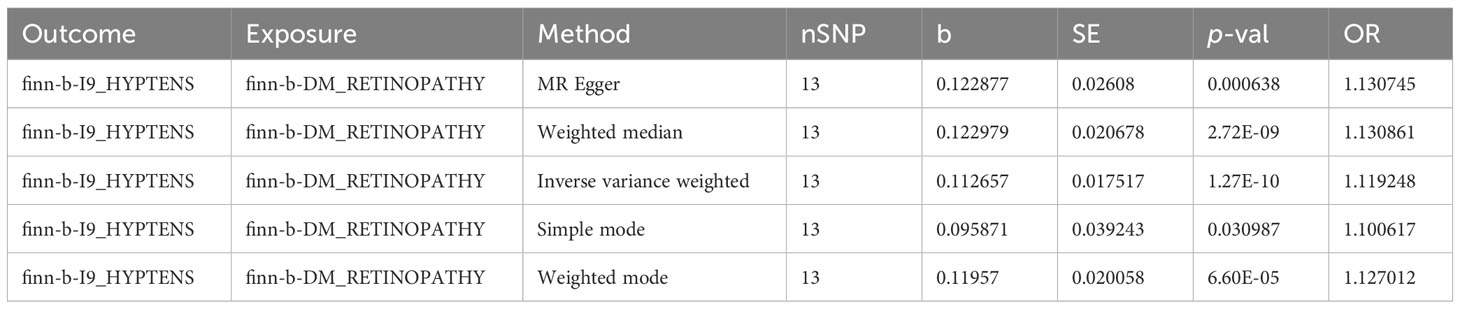
Table 1 Reverse Mendelian randomization (MR) results of diabetic retinopathy (DR) on hypertension.
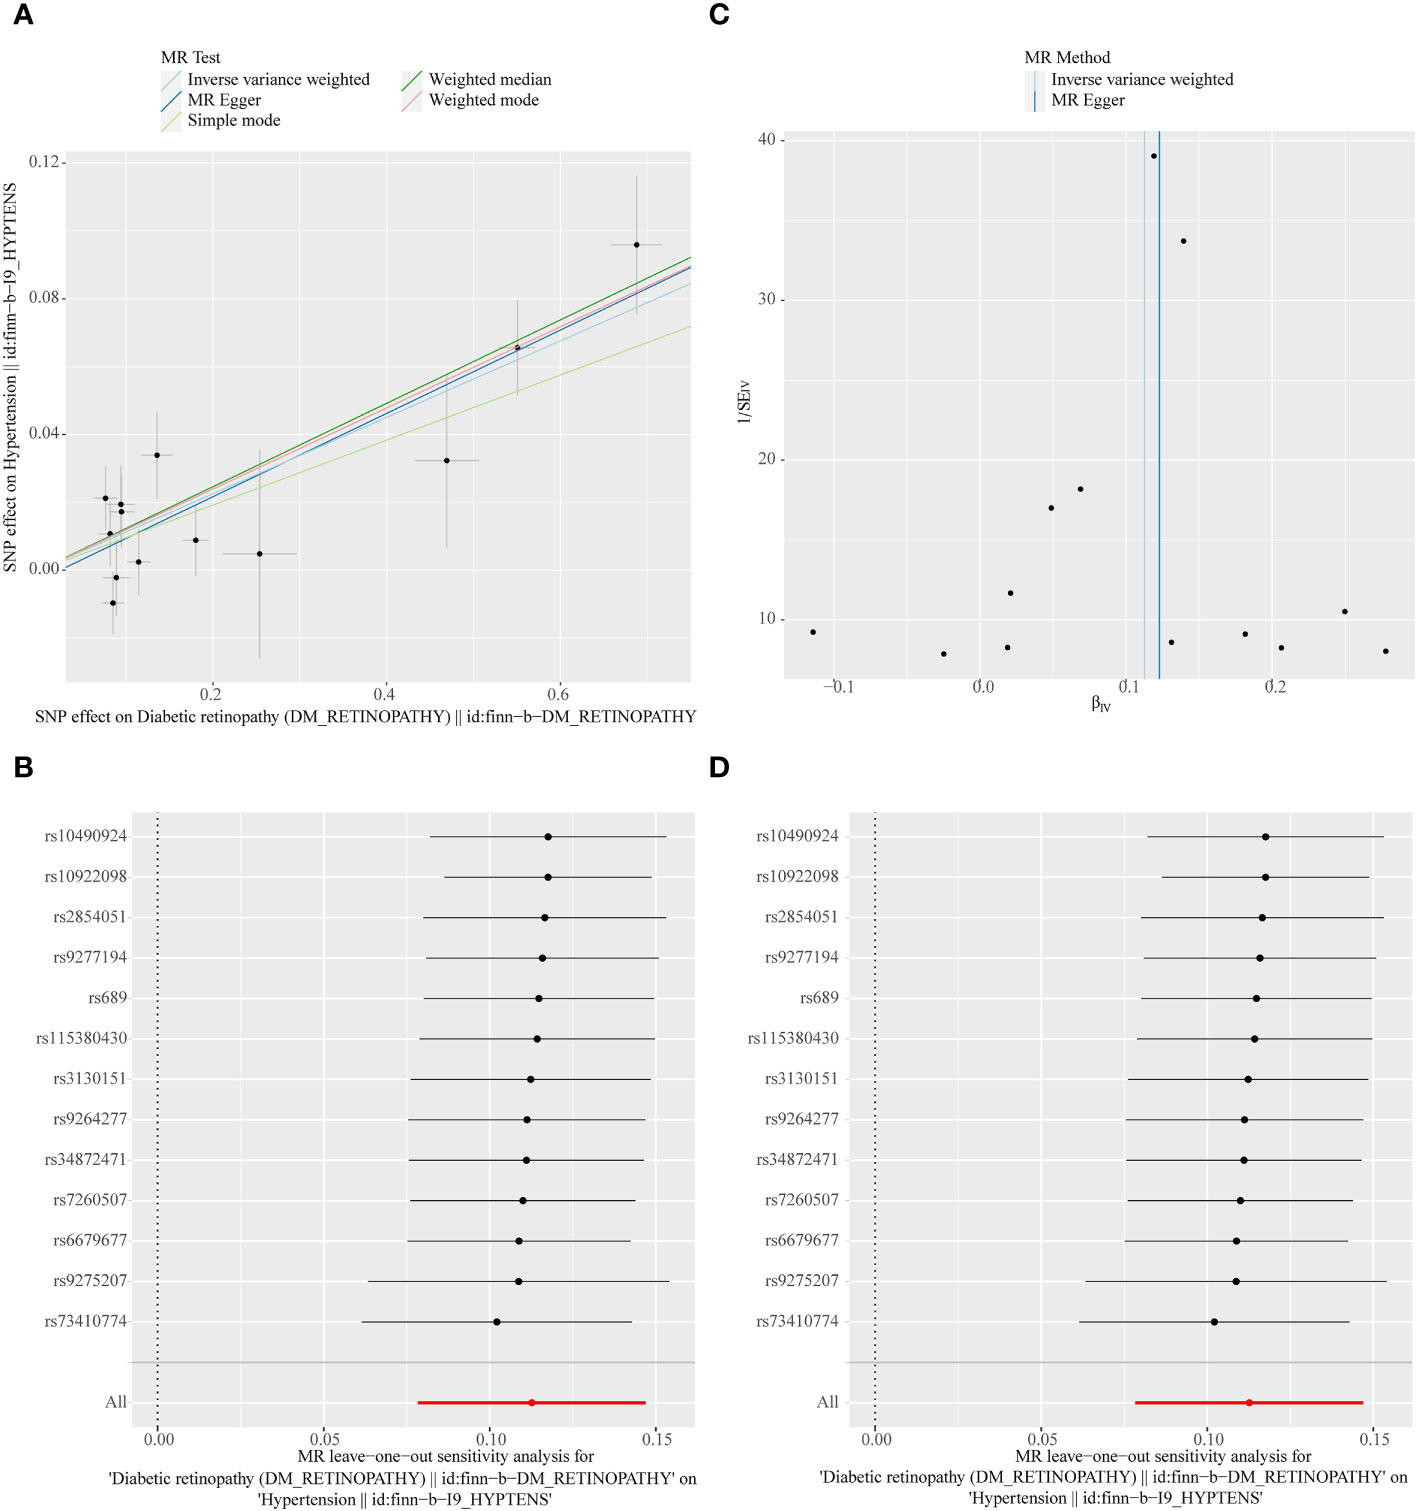
Figure 5 (A) Scatter plots of the MR analyses for the association of DR and the risk of hypertension. (B) Forest plot of MR results of DR effect on hypertension. (C) Funnel plots of MR estimates for the effect of DR on the risk of hypertension. (D) Leave-One-Out plot for sensitivity test for the effect of DR on hypertension.
A total of 11 SNPs at the genome-wide significance level were selected as IVs for DR-IOP (Supplementary Table 4). The p-values of the five MR methods were all greater than 0.05, indicating that there was no causal relationship between DR and IOP (Table 2). The combination of forest plots, scatter plots, and funnel plots supported the idea that there was no causal relationship between DR and IOP (Figures 6A-C). The results of sensitivity analysis showed that the reverse MR analysis was reliable (Figure 6D).
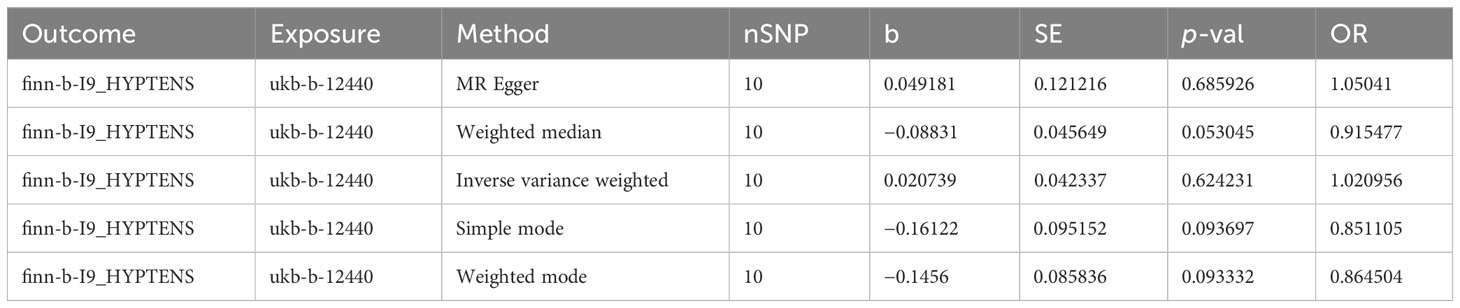
Table 2 Reverse MR results of DR on intraocular pressure (IOP).
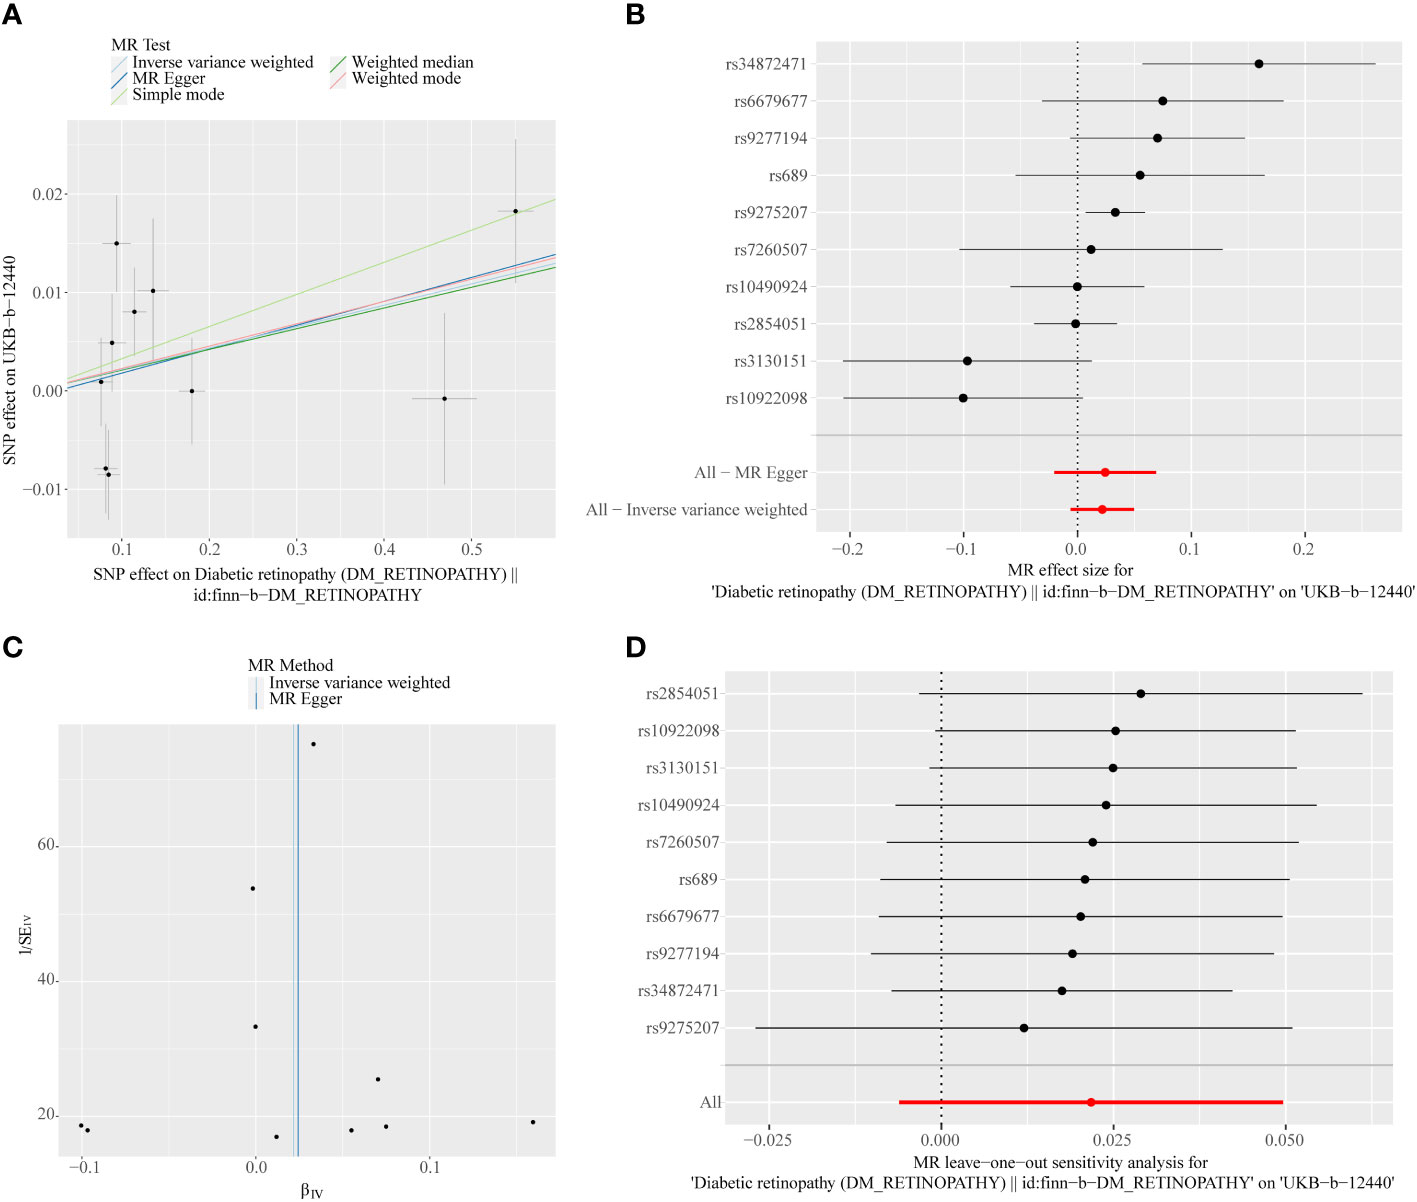
Figure 6 (A) Scatter plots of the MR analyses for the association of DR and the risk of IOP. (B) Forest plot of MR results of DR effect on IOP. (C) Funnel plots of MR estimates for the effect of DR on the risk of IOP. (D) Leave-One-Out plot for sensitivity test for the effect of DR on IOP.
3.3 Multivariable MR analyses
Multivariable MR was used to determine how hypertension and IOP affected DR. After the screening of the IVs, 260 IVs (SNPs) associated with any exposure factor for hypertension or IOP were obtained. Of these 260 SNPs, 131 were unrelated to DR and were used as input for multivariate analysis. Table 3 depicts that hypertension and IOP are still risk factors for DR, which have increased (p = 0.001, OR = 1.121, p = 0.030, OR = 1.124, Figure 7). Therefore, hypertension is still a risk factor for DR after the interference of IOP is eliminated; IOP is still a risk factor for DR after the interference of hypertension is eliminated.
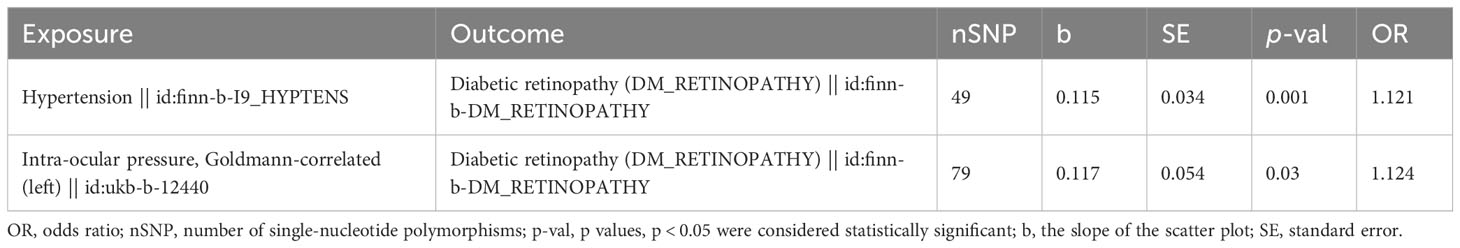
Table 3 Multivariable MR analysis results of hypertension and IOP on DR.
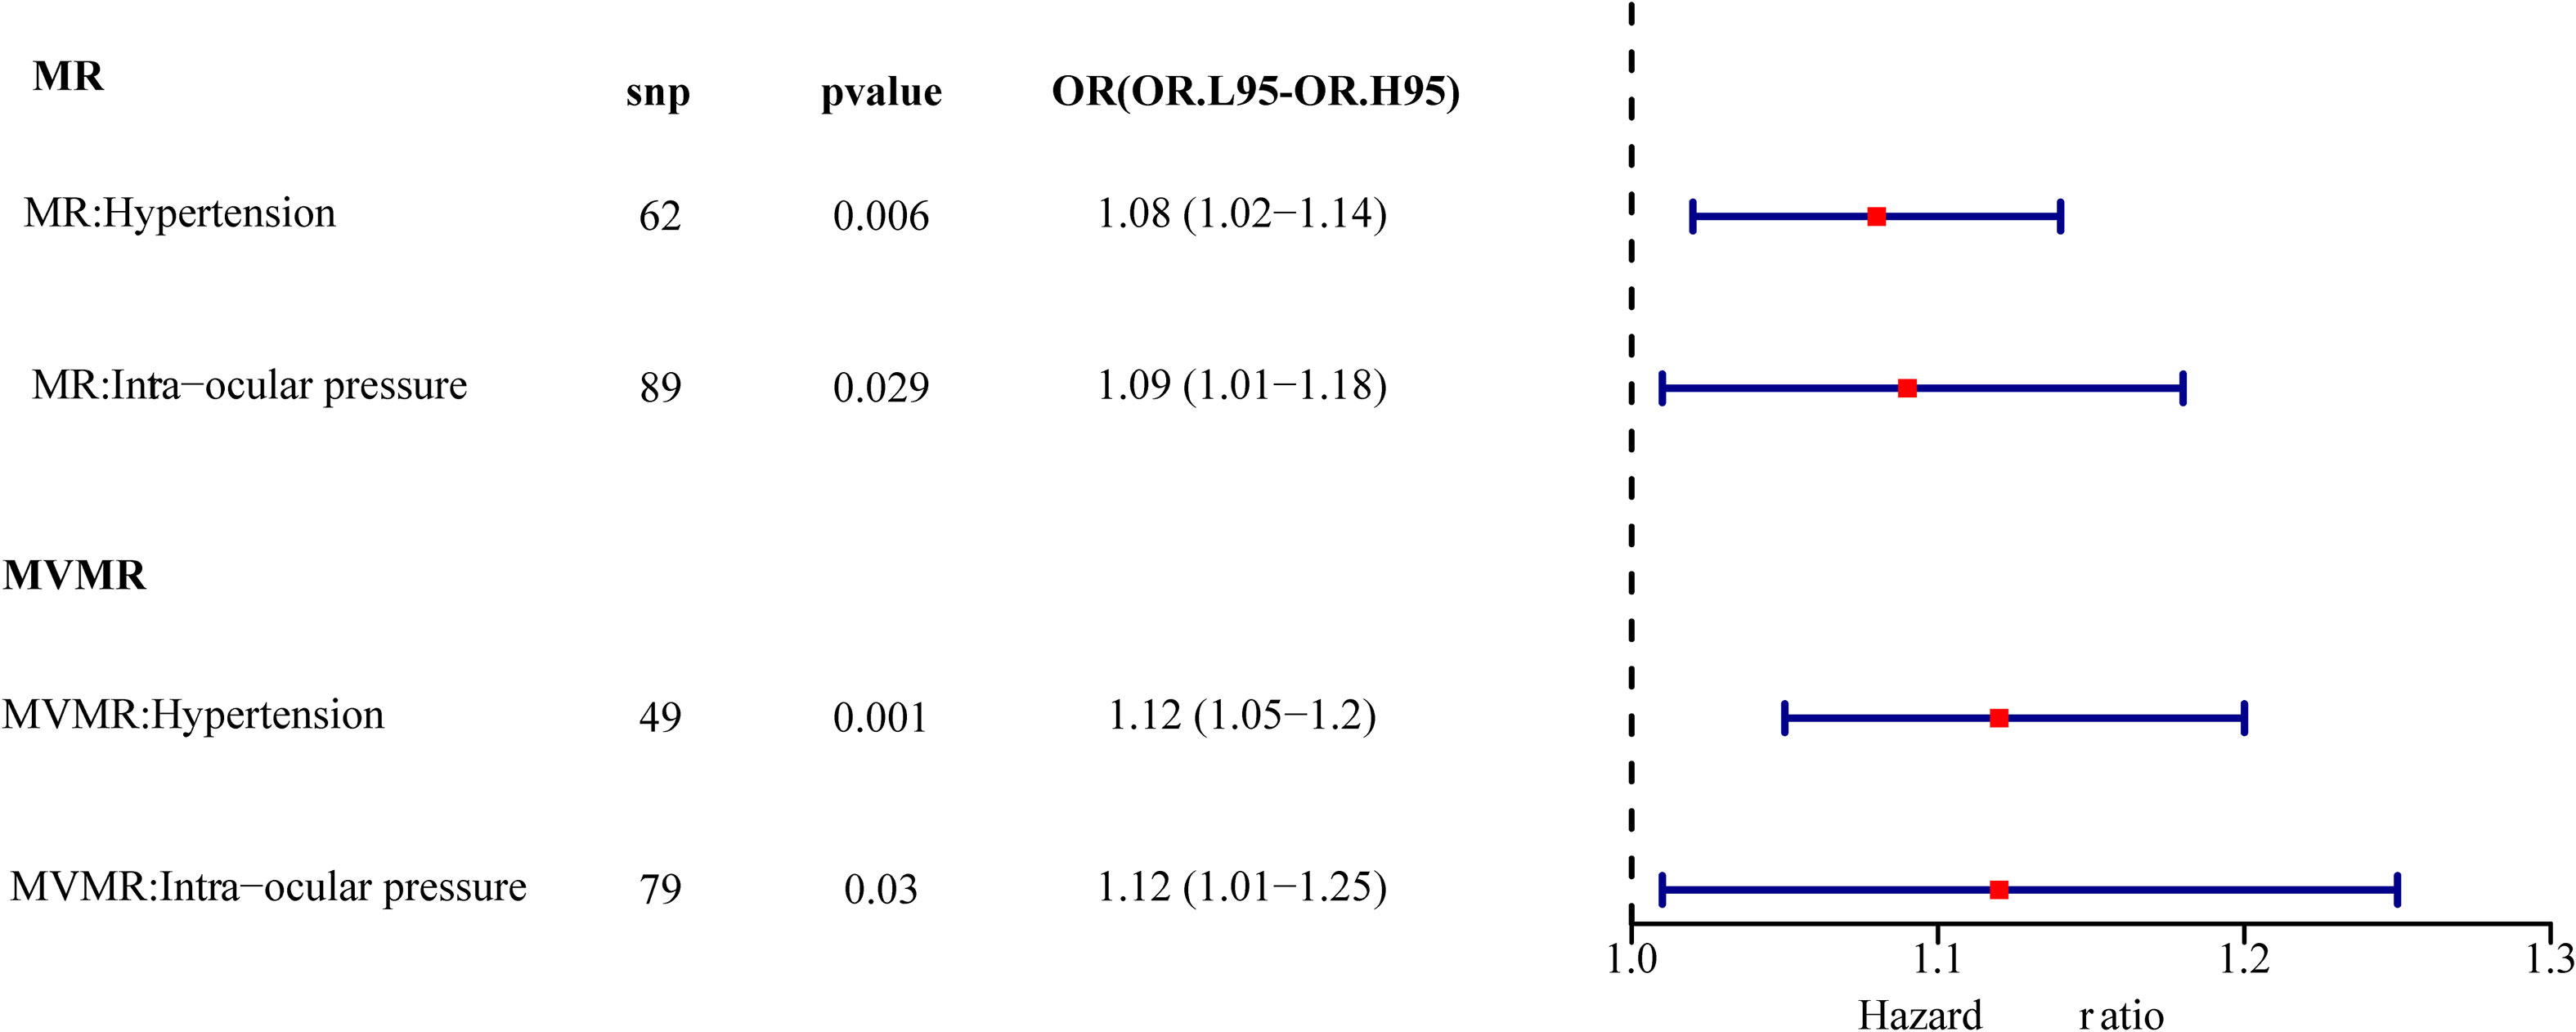
Figure 7 Univariate multivariate result forest map. The red square indicates that HR > 1, and the line segments on either side of the square are 95% CI for HR values.
4 Discussion
This study is the first to explore the potential causal relationship between hypertension and IOP and the risk of DR via bidirectional MR analysis. It is confirmed at the genetic level that hypertension and IOP are independent risk factors of DR in forward MR, which will increase the risk of DR while changing simultaneously. Similarly, it is confirmed at the genetic level that DR is an independent risk factor of hypertension in reverse MR, which will increase the risk of hypertension while changing simultaneously. However, we did not find an association between DR and IOP from reverse MR analyses.
Numerous metabolic pathways are involved in the occurrence and development of DR; however, the interaction among various mechanisms remains elusive, necessitating additional research and clarification. It has been determined that various environmental, systemic, and ocular factors impact the incidence and risk of DR based on the study of clinical demographic characteristics and epidemiological and laboratory data. It has been confirmed that numerous risk factors, such as age, sex, hypertension, diabetes course, diabetic neuropathy, fasting blood glucose, serum total cholesterol, serum triglyceride, and HbA1c, are linked to the occurrence and development of DR; however, these risk factors only contribute to a small part of DR progression (21).
Epidemiological research on the relationship between DR and hypertension has been conducted for a long time. Although it is generally accepted that hypertension is associated with the risk of DR, there are conflicting views on this relationship in previous studies. Numerous studies have confirmed that hypertension can be a potential risk factor for DR. A cross-sectional study by Yang et al. revealed that the progression of diabetes, hypertension, and HbA1c are independent risk factors for DR formation in patients with diabetes but do not impact the diagnostic rate of DR in the general population (22). Some RCTs have proved that good regular blood pressure control is advantageous for the emergence of DR. Higher blood pressure level may be associated with the occurrence and progress of DR; however, mildly elevated hypertension does not significantly impact the development of DR (23). Meta-analysis based on clinical trials has demonstrated that low blood pressure can effectively reduce the risk of microvascular and macrovascular complications in DM (24, 25). Recently, an increasing number of researchers have revealed the close relationship between hypertension and DR via deep machine learning, the construction of risk prediction models, and the phenotypic and genetic analysis of large sample banks such as the UK Biobank (26–28). A large cohort study by Li et al. demonstrates that there is a non-linear dose–response association between higher SBP and an increased risk of microangiopathy in patients with diabetes (29). It remains elusive how the specific mechanism of hypertension affects the occurrence and development of DR. Some studies indicate that hypertension may affect microvascular and macrovascular diseases through hemodynamic changes and vascular endothelial growth factor-dependent pathways. Although certain studies continue to contest the multivariate regression analysis-based significant correlation between blood pressure and DR (30–33), the findings of this study are consistent with the majority of earlier publications (21, 34–37). The interaction between hypertension and DR is more evident, and for the first time, the clear causal inference that DR is the effect of hypertension is advanced. The mutual causal relationship between hypertension and DR was verified by bidirectional MR.
There are several publications on IOP and blood glucose; however, there is limited research that focuses on DR cohorts, and the previous studies’ findings regarding IOP and DR occurrence and development have not always been consistent. This study is the first to examine the relationship between IOP and DR by MR. Changes in IOP have reportedly been linked to DR in some earlier investigations (38–41). Jain et al. believed that low IOP was related to DR and proposed that low IOP or IOP changes would accelerate the formation of microhemangioma, which was the primary manifestation of DR (42). Other researchers have confirmed that IOP in individuals with DR progression exhibits a downward trend, which may be related to myopia, glaucoma, and arterial stenosis (41, 43, 44). Blanksma et al. observed that the IOP of children with DR was significantly higher than that of children with diabetes without retinopathy (45). This research’s conclusion is not widely accepted by scholars. Li et al. unexpectedly observed in a cross-sectional study in 2023 that IOP change is not an independent risk factor in DR progression, which is contrary to certain early research findings and the results of this study (31). Although a growing number of studies focus on the relationship between diabetes, DR, and IOP, up to now, studies directly correlating glaucoma with DR are still rare, and the results are inconsistent. A study conducted in India in 2020 revealed that glaucoma and DR are positively correlated in individuals with T2DM, and some other studies have confirmed this conclusion. A recent article released by Hong Kong scholars reveals that there is no significant correlation between DR and glaucoma, and stronger epidemiological and clinical evidence is needed to explain the relationship between DR and glaucoma (14, 46–48). Many scholars proposed the concept of mean ocular perfusion pressure (MOPP) based on the complex relationship between DR, blood pressure, and IOP. MOPP is calculated from mean arterial pressure (MAP) and IOP (MOPP = 2/3 MAP-IOP). Many studies have reported that MOPP is related to the occurrence and development of DR; however, the relationship between high MOPP and low MOPP and DR remains controversial. Some studies suggest that high MOPP is related to the development of DR, and low MOPP can prevent the development of DR. Other studies indicate that MOPP decreases with the deterioration of DR progression. However, Raman et al. demonstrated that there is no evidence to prove that there is a significant correlation between MOPP and DR through univariate and multivariate analysis. In a study published in 2023 by Chinese scholars, it was proposed that the increase in MOPP affected the occurrence of DR rather than affecting its progression (49–53). Currently, there is no widespread consensus on how IOP and DR are related. This study focuses on the genetic variation related to exposure factors. For the first time, other confounding factors were eliminated using the data from GWAS and MR analysis methods, and the causal relationship between IOP and DR is established. The change in IOP affects the risk of DR, which provides a clear direction for future research.
Additionally, this study is the first to evaluate the effects of hypertension and IOP on DR. Using multivariate Mendelian analysis, it was confirmed that hypertension and IOP were still independent risk factors after eliminating their mutual interference. In multivariate analysis, the risk factors of both increased; thus, we can speculate that when the two exposure variables of hypertension and IOP change simultaneously, the risk of DR would be greatly increased. Although previous studies have also analyzed the effect of combined blood pressure and IOP (MOPP, average intraocular perfusion pressure) on DR, the effect of simultaneous changes in blood pressure and IOP on DR risk has not been mentioned (54).
Compared with the traditional randomized controlled analysis, MR analysis has certain advantages. First, this study systematically examined the relationship between hypertension, IOP, and the risk of DR using univariate and multivariate MR analyses. Second, bidirectional MR was used to analyze the potential association between genetic variations related to hypertension, IOP, and DR, eliminating potential outliers and other confounding factors, and the reliability of the analysis results was verified by a series of sensitivity analyses. Third, before beginning the costly RCT, acquiring relatively reliable and accurate data through MR research will save time, energy, and research funds, thus enabling more valuable research.
However, there are still some shortcomings. The original analysis data in this study came from the Open GWAS database, which summarized and collected a large amount of GWAS data, but did not provide the original data or even sample information. Owing to objective data limitations, we unfortunately cannot provide baseline characteristics of participants. The MR study was conducted according to the GWAS database of the European population. Although the population differences were removed, it has not been confirmed whether it applies to other groups, such as those in Asia. The outcome of this MR study only suggests the causal relationship between hypertension, IOP, and DR; however, the potential mechanism is not specified, and the relationship between the increase and decrease in IOP and DR has not been addressed in this study. In addition, because of objective data limitations, we unfortunately cannot calculate the power of this study. Although the author is not an expert in MR analysis, he has extensive academic and research background in the field and has the appropriate knowledge and understanding.
In conclusion, this study confirmed at the genetic level that hypertension and IOP are independent risk factors of DR, which will increase the risk of DR while changing simultaneously. Numerous traditional observational studies, prospective studies, and considerably larger samples of GWAS data are still needed to test the causal relationship. Based on the previous research results and the conclusion of this MR analysis, clarifying the risk factors related to the occurrence of DR is crucial for early prevention, diagnosis, management, and extensive and effective screening of DR. We are supposed to delay or at least delay the onset and progression of DR through careful blood pressure and IOP control.
Data availability statement
The original contributions presented in the study are included in the article/Supplementary Material. Further inquiries can be directed to the corresponding authors.
Author contributions
X-FW: Methodology, Writing – original draft, Writing – review & editing. X-WZ: Resources, Supervision, Writing – review & editing. Y-JL: Resources, Writing – review & editing. X-YZ: Writing – review & editing. M-RS: Project administration, Resources, Supervision, Writing – review & editing. X-HS: Project administration, Resources, Supervision, Writing – original draft, Writing – review & editing. FJ: Project administration, Resources, Supervision, Writing – review & editing. Z-NL: Funding acquisition, Project administration, Supervision, Writing – review & editing, Resources.
Funding
The author(s) declare financial support was received for the research, authorship, and/or publication of this article. This work was supported by Major Scientific and Technological Projects of Changzhou Health Commission (ZD202120), Jiangsu Province Elderly Health Project (LKM2022052) and Science and Technology planning project Foundation of Changzhou (CE20225071).
Acknowledgments
We appreciated all investigators for sharing these data. We also would like to thank the editors and the reviewers for their valuable comments and suggestions to improve the quality of the paper.
Conflict of interest
The authors declare that the research was conducted in the absence of any commercial or financial relationships that could be construed as a potential conflict of interest.
Publisher’s note
All claims expressed in this article are solely those of the authors and do not necessarily represent those of their affiliated organizations, or those of the publisher, the editors and the reviewers. Any product that may be evaluated in this article, or claim that may be made by its manufacturer, is not guaranteed or endorsed by the publisher.
Supplementary material
The Supplementary Material for this article can be found online at: https://www.frontiersin.org/articles/10.3389/fendo.2024.1304512/full#supplementary-material
References
1. Gao HX, Regier EE, Close KL. International diabetes federation world diabetes congress 2015. J Diabetes (2016) 8:300–2. doi: 10.1111/1753-0407.12377
2. Shaw JE, Sicree RA, Zimmet PZ. Global estimates of the prevalence of diabetes for 2010 and 2030. Diabetes Res Clin Pract (2010) 87:4–14. doi: 10.1016/j.diabres.2009.10.007
3. Klein R, Lee KE, Knudtson MD, Gangnon RE, Klein BE. Changes in visual impairment prevalence by period of diagnosis of diabetes: the Wisconsin Epidemiologic Study of Diabetic Retinopathy. Ophthalmology (2009) 116:1937–42. doi: 10.1016/j.ophtha.2009.03.012
4. Gaede P, Lund-Andersen H, Parving HH, Pedersen O. Effect of a multifactorial intervention on mortality in type 2 diabetes. N Engl J Med (2008) 358:580–91. doi: 10.1056/NEJMoa0706245
5. Vujosevic S, Aldington SJ, Silva P, Hernández C, Scanlon P, Peto T, et al. Screening for diabetic retinopathy: new perspectives and challenges. Lancet Diabetes Endocrinol (2020) 8:337–47. doi: 10.1016/S2213-8587(19)30411-5
6. Stratton IM, Kohner EM, Aldington SJ, Turner RC, Holman RR, Manley SE, et al. UKPDS 50: risk factors for incidence and progression of retinopathy in Type II diabetes over 6 years from diagnosis. Diabetologia (2001) 44:156–63. doi: 10.1007/s001250051594
7. Klein R, Klein BE, Moss SE, Davis MD, DeMets DL. Is blood pressure a predictor of the incidence or progression of diabetic retinopathy? Arch Intern Med (1989) 149:2427–32. doi: 10.1001/archinte.1989.00390110033008
8. Bulum T, Tomić M, Vrabec R, Martinović Bošković M, Ljubić S, Prkačin I. Blood pressure is associated with diabetic retinopathy in type 1 but not in type 2 diabetes. Acta Clin Croat (2022) 61:14–22. doi: 10.20471/acc.2022.61.s1.02
9. Pan CW, Wang S, Xu CL, Song E. Combined effect of glycemic and blood pressure control on diabetic retinopathy among Chinese with type-2 diabetes mellitus. Diabetol Metab Syndr (2018) 10:73. doi: 10.1186/s13098-018-0377-7
10. Tielsch JM, Katz J, Quigley HA, Javitt JC, Sommer A. Diabetes, intraocular pressure, and primary open-angle glaucoma in the Baltimore Eye Survey. Ophthalmology (1995) 102:48–53. doi: 10.1016/S0161-6420(95)31055-X
11. Kanamori A, Nakamura M, Mukuno H, Maeda H, Negi A. Diabetes has an additive effect on neural apoptosis in rat retina with chronically elevated intraocular pressure. Curr Eye Res (2004) 28:47–54. doi: 10.1076/ceyr.28.1.47.23487
12. Nakamura M, Kanamori A, Negi A. Diabetes mellitus as a risk factor for glaucomatous optic neuropathy. Ophthalmologica (2005) 219:1–10. doi: 10.1159/000081775
13. Sperling S, Stokholm L, Thykjaer AS, Pedersen FN, Möller S, Laugesen CS, et al. Bidirectional 5-year risks of diabetic retinopathy, glaucoma and/or ocular hypertension: Results from a national screening programme. Acta Ophthalmol (2023) 101:384–91. doi: 10.1111/aos.15300
14. Gangwani RA, McGhee SM, Lai JS, Chan CK, Wong D. Detection of glaucoma and its association with diabetic retinopathy in a diabetic retinopathy screening program. J glaucoma (2016) 25:101–5. doi: 10.1097/IJG.0000000000000138
15. Su Z, Wu Z, Liang X, Xie M, Xie J, Li H, et al. Diabetic retinopathy risk in patients with unhealthy lifestyle: A Mendelian randomization study. Front Endocrinol (Lausanne) (2022) 13:1087965. doi: 10.3389/fendo.2022.1087965
16. Liu K, Zou J, Fan H, Hu H, You Z. Causal effects of gut microbiota on diabetic retinopathy: A Mendelian randomization study. Front Immunol (2022) 13:930318. doi: 10.3389/fimmu.2022.930318
17. Huang YC, Chang YW, Cheng CW, Wu CM, Liao WL, Tsai FJ. Causal relationship between adiponectin and diabetic retinopathy: A mendelian randomization study in an Asian population. Genes (Basel) (2020) 12(1):17. doi: 10.3390/genes12010017
18. Zhang A, Wu H, Wang C, Tian S. Integrative analysis of Mendelian randomization and gene expression profiles reveals a null causal relationship between adiponectin and diabetic retinopathy. Adipocyte (2023) 12:2234522. doi: 10.1080/21623945.2023.2234522
19. Hemani G, Zheng J, Elsworth B, Wade KH, Haberland V, Baird D, et al. The MR-Base platform supports systematic causal inference across the human phenome. eLife (2018) 7:e34408. doi: 10.7554/eLife.34408
20. Li P, Wang H, Guo L, Gou X, Chen G, Lin D, et al. Association between gut microbiota and preeclampsia-eclampsia: a two-sample Mendelian randomization study. BMC Med (2022) 20:443. doi: 10.1186/s12916-022-02657-x
21. Li X, Tan TE, Wong TY, Sun X. Diabetic retinopathy in China: Epidemiology, screening and treatment trends—A review. Clin Exp Ophthalmol (2023) 51(6):607–26. doi: 10.1111/ceo.14269
22. Yang Z, Liu Q, Wen D, Yu Z, Zheng C, Gao F, et al. Risk of diabetic retinopathy and retinal neurodegeneration in individuals with type 2 diabetes: Beichen Eye Study. Front Endocrinol (2023) 14. doi: 10.3389/fendo.2023.1098638
23. Turner R, Holman R, Stratton I, Cull C, Frighi V, Manley S, et al. Tight blood pressure control and risk of macrovascular and microvascular complications in type 2 diabetes: UKPDS 38. UK Prospective Diabetes Study Group. BMJ (Clinical Res ed) (1998) 317:703–13. doi: 10.1136/bmj.317.7160.703
24. Emdin CA, Rahimi K, Neal B, Callender T, Perkovic V, Patel A. Blood pressure lowering in type 2 diabetes. Jama (2015) 313:603. doi: 10.1001/jama.2014.18574
25. Ovenseri-Ogbomo G, Azagew AW, Yohanes YB, Beko ZW, Ferede YM, Mekonnen CK. Determinants of diabetic retinopathy in Ethiopia: A systematic review and meta-analysis. PloS One (2023) 18:e0286627. doi: 10.1371/journal.pone.0286627
26. Yang Y, Tan J, He Y, Huang H, Wang T, Gong J, et al. Predictive model for diabetic retinopathy under limited medical resources: A multicenter diagnostic study. Front Endocrinol (Lausanne) (2022) 13:1099302. doi: 10.3389/fendo.2022.1099302
27. Zhu C, Zhu J, Wang L, Xiong S, Zou Y, Huang J, et al. Development and validation of a risk prediction model for diabetic retinopathy in type 2 diabetic patients. Sci Rep (2023) 13(1):5034. doi: 10.1038/s41598-023-31463-5
28. Vyas A, Raman S, Sen S, Ramasamy K, Rajalakshmi R, Mohan V, et al. Machine learning-based diagnosis and ranking of risk factors for diabetic retinopathy in population-based studies from South India. Diagnostics (2023) 13:2084. doi: 10.3390/diagnostics13122084
29. Li C, Yu H, Zhu Z, Shang X, Huang Y, Sabanayagam C, et al. Association of blood pressure with incident diabetic microvascular complications among diabetic patients: Longitudinal findings from the UK Biobank. J Global Health (2023) 13:04027. doi: 10.7189/jogh.13.04027
30. Yanko L, Goldbourt U, Michaelson IC, Shapiro A, Yaari S. Prevalence and 15-year incidence of retinopathy and associated characteristics in middle-aged and elderly diabetic men. Br J Ophthalmol (1983) 67:759–65. doi: 10.1136/bjo.67.11.759
31. Li Z, Tong J, Liu C, Zhu M, Tan J, Kuang G. Analysis of independent risk factors for progression of different degrees of diabetic retinopathy as well as non-diabetic retinopathy among type 2 diabetic patients. Front Neurosci (2023) 17. doi: 10.3389/fnins.2023.1143476
32. Janghorbani M, Amini M, Ghanbari H, Safaiee H. Incidence of and risk factors for diabetic retinopathy in Isfahan, Iran. Ophthalmic Epidemiol (2003) 10:81–95. doi: 10.1076/opep.10.2.81.13893
33. Zhu Z, Shi D, Liao H, Ha J, Shang X, Huang Y, et al. Visual impairment and risk of dementia: the UK biobank study. Am J Ophthalmol (2022) 235:7–14. doi: 10.1016/j.ajo.2021.08.010
34. Gillow JT, Gibson JM, Dodson PM. Hypertension and diabetic retinopathy–what’s the story? Br J Ophthalmol (1999) 83:1083–7. doi: 10.1136/bjo.83.9.1083
35. Yau JWY, Rogers SL, Kawasaki R, Lamoureux EL, Kowalski JW, Bek T, et al. Global prevalence and major risk factors of diabetic retinopathy. Diabetes Care (2012) 35:556–64. doi: 10.2337/dc11-1909
36. Klein R, Knudtson MD, Lee KE, Gangnon R, Klein BEK. The wisconsin epidemiologic study of diabetic retinopathy XXII. Ophthalmology (2008) 115:1859–68. doi: 10.1016/j.ophtha.2008.08.023
37. Yamazaki D, Hitomi H, Nishiyama A. Hypertension with diabetes mellitus complications. Hypertension Res (2018) 41:147–56. doi: 10.1038/s41440-017-0008-y
38. Browning DJ, Flynn HW, Blankenship GW. Asymmetric retinopathy in patients with diabetes mellitus. Am J Ophthalmol (1988) 105:584–9. doi: 10.1016/0002-9394(88)90048-7
39. Becker B, Bresnick G, Chevrette L, Kolker AE, Oaks MC, Cibis A. Intraocular pressure and its response to topical corticosteroids in diabetes. Arch Ophthalmol (Chicago Ill: 1960) (1966) 76:477–83. doi: 10.1001/archopht.1966.03850010479003
40. Valone JA Jr., McMeel JW, Franks EP. Unilateral proliferative diabetic retinopathy. I. Initial findings. Arch Ophthalmol (Chicago Ill: 1960) (1981) 99:1357–61. doi: 10.1001/archopht.1981.03930020231002
41. Moss SE, Klein R, Klein BE. Ocular factors in the incidence and progression of diabetic retinopathy. Ophthalmology (1994) 101:77–83. doi: 10.1016/S0161-6420(94)31353-4
42. Jain IS, Luthra CL. Diabetic retinopathy. Its relationship with intraocular pressure. Arch Ophthalmol (Chicago Ill: 1960) (1967) 78:198–200. doi: 10.1001/archopht.1967.00980030200013
43. Dimitrova G, Kato S, Yamashita H, Tamaki Y, Nagahara M, Fukushima H, et al. Relation between retrobulbar circulation and progression of diabetic retinopathy. Br J Ophthalmol (2003) 87:622–5. doi: 10.1136/bjo.87.5.622
44. Verma D. Pathogenesis of diabetic retinopathy–the missing link? Med Hypotheses (1993) 41:205–10. doi: 10.1016/0306-9877(93)90231-E
45. Blanksma LJ, Rouwe C, Drayer NM. Retinopathy and intraocular pressure in diabetic children. Ophthalmologica J Int d’ophtalmologie Int J Ophthalmol Z fur Augenheilkunde (1983) 187:137–40. doi: 10.1159/000309313
46. Li Y, Mitchell W, Elze T, Zebardast N. Association between diabetes, diabetic retinopathy, and glaucoma. Curr Diabetes Rep (2021) 21(10):38. doi: 10.1007/s11892-021-01404-5
47. Abikoye TM, Oluleye TS, Aribaba OT, Musa KO, Idowu OO, Onakoya AO. Is primary open-angle glaucoma a risk factor for diabetic retinopathy? Int Ophthalmol (2020) 40:3233–40. doi: 10.1007/s10792-020-01507-0
48. Behera U, Bhattacharjee H, Das T, Gilbert C, Murthy GS, Rajalakshmi R, et al. Spectrum of Eye Disease in Diabetes (SPEED) in India: A prospective facility-based study. Report # 4. Glaucoma in people with type 2 diabetes mellitus. Indian J Ophthalmol (2020) 68:32. doi: 10.4103/ijo.IJO_1948_19
49. Antonetti DA, Silva PS, Stitt AW. Current understanding of the molecular and cellular pathology of diabetic retinopathy. Nat Rev Endocrinol (2021) 17:195–206. doi: 10.1038/s41574-020-00451-4
50. Quigley M, Cohen S. A new pressure attenuation index to evaluate retinal circulation. A link to protective factors in diabetic retinopathy. Arch Ophthalmol (Chicago Ill: 1960) (1999) 117:84–9. doi: 10.1001/archopht.117.1.84
51. Langham ME, Grebe R, Hopkins S, Marcus S, Sebag M. Choroidal blood flow in diabetic retinopathy. Exp Eye Res (1991) 52:167–73. doi: 10.1016/0014-4835(91)90256-E
52. Zhai G, Lin Z, Wang FH, Wang Y, Li D, Wen L, et al. Association between mean ocular perfusion pressure and diabetic retinopathy in a northeastern chinese population. Biomed Environ sciences: BES (2020) 33:701–7. doi: 10.3967/bes2020.091
53. Ashraf H, Lotfi M, Akbari M, Jahanbani-Ardakani H, Ghaffari M, Khalili MR. Effect of calcium dobesilate on retrobulbar blood flow and choroidal thickness in patients with non-proliferative diabetic retinopathy. Int Ophthalmol (2021) 41:3479–86. doi: 10.1007/s10792-021-01914-x
54. Raman R, Gupta A, Kulothungan V, Sharma T. Association of mean ocular perfusion pressure and diabetic retinopathy in type 2 diabetes mellitus: sankara nethralaya diabetic retinopathy epidemiology and molecular genetic study (SN-DREAMS, report 28). Invest Opthalmol Visual Sci (2011) 52:4592. doi: 10.1167/iovs.10-6903
Keywords: diabetic retinopathy, hypertension, IOP, GWAS, Mendelian randomization
Citation: Wang X-F, Zhang X-W, Liu Y-J, Zheng X-Y, Su M-R, Sun X-H, Jiang F and Liu Z-N (2024) The causal effect of hypertension, intraocular pressure, and diabetic retinopathy: a Mendelian randomization study. Front. Endocrinol. 15:1304512. doi: 10.3389/fendo.2024.1304512
Received: 29 September 2023; Accepted: 17 January 2024;
Published: 06 February 2024.
Edited by:
Qi Pan, Peking University, ChinaReviewed by:
Kai Jin, Zhejiang University, ChinaChangzheng Chen, Renmin Hospital of Wuhan University, China
Copyright © 2024 Wang, Zhang, Liu, Zheng, Su, Sun, Jiang and Liu. This is an open-access article distributed under the terms of the Creative Commons Attribution License (CC BY). The use, distribution or reproduction in other forums is permitted, provided the original author(s) and the copyright owner(s) are credited and that the original publication in this journal is cited, in accordance with accepted academic practice. No use, distribution or reproduction is permitted which does not comply with these terms.
*Correspondence: Zhi-Nan Liu, bHpuMTk4MXZpcEAxNjMuY29t; Feng Jiang, b3BodGhhbGZlbmdqaWFuZ0B5YWhvby5jb20=; Xing-Hong Sun, c3VueGluZ2hvbmcxOTg5QDE2My5jb20=; Meng-Ru Su, c3VtZW5ncnVfbmpAMTI2LmNvbQ==
†These authors have contributed equally to this work and share first authorship
‡These authors have contributed equally to this work