 Ranran Yan1,2,3,4
 Zhenzhong Bai
 Ri-li Ge
- 1Qinghai-Utah Joint Key Lab for High-altitude Medicine, Medical College of Qinghai University, Xining, China
- 2Research Center for High Altitude Medicine, Medical College of Qinghai University, Xining, China
- 3Key Laboratory of High-Altitude Medicine in Qinghai University, Ministry of Education, Xining, China
- 4Key Laboratory for Application of High-Altitude Medicine in Qinghai Province, Xining, China
- 5Oncology Department, The Fifth People’s Hospital of Qinghai Provincial, Xining, China
- 6Affiliated Hospital of Qinghai University, Xining, China
Non-alcoholic fatty liver disease (NAFLD) has a high global prevalence and affects approximately one-third of adults, owing to high-fat dietary habits and a sedentary lifestyle. The role of hypoxia-inducible factor 2α (HIF-2α) in NAFLD progression remains unknown. This study aimed to investigate the effects of chronic hypoxia on NAFLD progression by examining the role of hypoxia-inducible factor 2α (HIF-2α) activation and that of hepatic stellate cell (HSC)-derived myofibroblasts through glutaminolysis. We hypothesised that hypoxia exacerbates NAFLD by promoting HIF-2α upregulation and inhibiting phosphorylated yes-associated protein (YAP), and that increasing YAP expression enhances HSC-derived myofibroblasts. We studied patients with NAFLD living at high altitudes, as well as animal models and cultured cells. The results revealed significant increases in HSC-derived myofibroblasts and collagen accumulation caused by HIF-2α and YAP upregulation, both in patients and in a mouse model for hypoxia and NAFLD. HIF-2α and HIF-2α-dependent YAP downregulation reduced HSC activation and myofibroblast levels in persistent chronic hypoxia. Furthermore, hypoxia-induced HIF-2α upregulation promoted YAP and inhibited YAP phosphorylation, leading to glutaminase 1 (GLS1), SLC38A1, α-SMA, and Collagen-1 overexpression. Additionally, hypoxia restored mitochondrial adenosine triphosphate production and reactive oxygen species (ROS) overproduction. Thus, chronic hypoxia-induced HIF-2α activation enhances fibrosis and NAFLD progression by restoring mitochondrial ROS production and glutaminase-1-induced glutaminolysis, which is mediated through the inhibition of YAP phosphorylation and increased YAP nuclear translocation. In summary, HIF-2α plays a pivotal role in NAFLD progression during chronic hypoxia.
Introduction
Non-alcoholic fatty liver disease (NAFLD) and its severe form, non-alcoholic hepatitis (NASH), are chronic fatty liver diseases affecting approximately one-third of adult population worldwide. This high prevalence has been attributed to the increased popularity of high-fat dietary habits and sedentary lifestyles (1–3). NAFLD, also known as metabolic-associated fatty liver disease, is characterised by steatosis and inflammation of hepatocytes caused by metabolic factors not related to alcohol consumption (4, 5). Moreover, NAFLD can progress to NASH due to unknown reasons in the absence of effective treatment options, leading to cirrhosis and end-stage primary hepatic carcinoma (6). Identifying potential molecular mechanisms underlying NAFLD progression may contribute to the development of an effective treatment. The activation of hepatic stellate cells (HSC)–derived myofibroblasts is the major cause of NAFLD progression (7, 8). In addition, glutamine catabolism is the main source of energy for HSC-derived myofibroblasts during NASH and progression to hepatic carcinoma (9–11).
Obstructive sleep apnea-induced hypoxia is closely associated with NAFLD progression (12, 13) and cardiovascular events (14, 15). Therefore, understanding metabolic alterations associated with the hypoxic microenvironment of hepatocytes is essential to identify the molecular mechanisms underlying NAFLD progression. Activation and transfer of hypoxia-inducible factor (HIF)-2α to the nucleus are among the cellular responses to chronic hypoxia in chronic liver disease (16–18). Elevated HIF-2α levels in patients with NASH have been associated with inflammation and development of fibrosis (19). However, how HIF-2α affects glutamine catabolism in HSCs (known as glutaminolysis) during NAFLD progression remains unclear.
Yes-associated protein (YAP) is a key component in the Hippo signalling pathway, regulating gene expression by binding to the transcriptional co-activator TAZ and playing an important role in myofibroblasts derived from HSCs (20–23). Glutamine enters HSCs through the SLC38A1 also called Sodium Coupled Neutral Amino Acid Transporters 1 (SNAT1) and is metabolised by glutaminase 1 (GLS-1) to provide energy to myofibroblasts (24, 25). YAP promotes glutamine metabolism and activates quiescent HSCs during NAFLD progression (10, 16). Additionally, glutamine metabolism has been shown to be enhanced by blockage of the phosphorylated YAP pathway, and this was dependent on HIF-2α (26, 27). Since a role for HIF-2α has been described in chronic hypoxia associated to NASH (18, 19, 28), we hypothesised that HIF-2α may promote YAP activation, increasing energy demand and accelerating fibrosis progression. This study aimed to investigate the potential role of HIF-2α in the metabolic reprogramming of HSCs during NASH pathogenesis. The study includes data from patients with NASH, from a mouse model for the disease, and from HSCs in culture.
Materials and methods
Clinical data and histology analysis
Health examination results from a cohort of male patients with NAFLD (n=73) living at an altitude range of 2300–3500 m in Qinghai (China) were collected for the study (Table 1). The inclusion criteria were as follows: no previous history of alcoholism, a diagnosis of steatosis using ultrasound, and absence of other liver diseases. The participants were in the early stages of NAFLD, ranging from F0 to F3, and had been originally diagnosed via ultrasound as part of a routine health examination at the Affiliated Hospital of Qinghai University from 2019 to 2022. In addition, liver tissue sections from twelve patients with NASH and fibrosis (stages F2–F3) who underwent liver biopsy for liver cancer screening were collected for Haematoxylin and Eosin (H&E), immunohistochemical, and immunofluorescence staining (Supplementary Table 1), and plasma for LC-MS. To identify patients with hypoxemia, we divided patients with NAFLD into two groups based on haemoglobin concentrations: the hypoxemia (>210 g/L) and the normoxia (120–180 g/L) group, according to the Qinghai Criteria used to diagnose chronic mountain sickness (CMS), which includes haemoglobin concentrations above 21g/dL in men or 19g/dL in women accompanied by the specialised clinical signs (29). This study was approved by the Ethics Committee of the Medical College of Qinghai University, China (No. 2022-06).
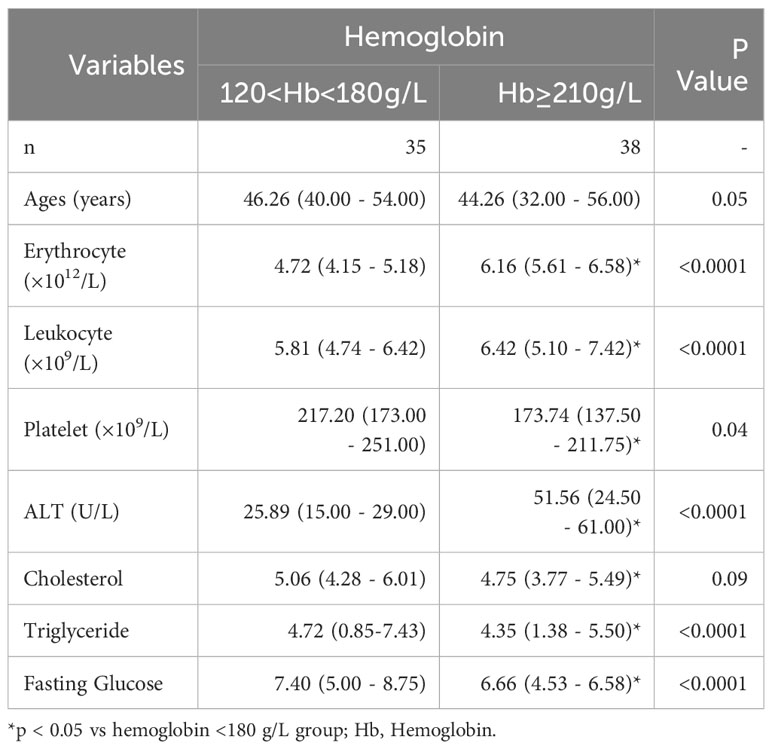
Table 1 Demographic characteristics of the NAFLD patients.
For immunohistochemistry (IHC) and immunofluorescent (IFC) staining, liver tissues were fixed in formalin, embedded in paraffin, sliced, de-waxed, and treated with EDTA (pH 9.0) (Servicebio G1203, Wuhan, China) to retrieve antigens. They were then incubated in an aqueous solution containing 3% hydrogen peroxide for 10 minutes to block the endogenous peroxidase. A 3% BSA (Servicebio GC305010, Wuhan, China) solution was used to blocked for 10 minutes, and after washing, they were incubated overnight at 4°C in a wet box in the presence of the GlS1 primary antibody (Proteintech Group 81486-1-RR, Wuhan, China). A hydrogen peroxide (HRP)-labelled secondary antibody (Servicebio GB23303, Wuhan, China) was used to incubate the tissue at room temperature for 50 minutes. Freshly prepared diaminobenzidine (DAB, Servicebio G1212, Wuhan, China) colorimetric solution was then added dropwise, colour development (brownish yellow) was controlled using a microscope, and the slices were rinsed with tap water to terminate the colorimetric process. The sections were re-stained with H&E for approximately three minutes to enable visualisation of the cell nuclei, dehydrated and sealed.
To determine whether HIF-1α and HIF-2α co-localise with the myofibroblasts of HSC marker α-SMA, co-staining was performed using the following primary antibodies: HIF-1α (GB114936, Servicebio, Wuhan, China), HIF-2α (GB11864, Servicebio, Wuhan, China), and α-SMA (GB111364, Servicebio, Wuhan, China), as well as HRP-labelled goat anti-rabbit IgG (GB23303, Servicebio, Wuhan, China), and Alexa Fluor 488-labelled goat anti-rabbit IgG (GB25303, Servicebio, Wuhan, China) as secondary antibodies. Details on antibodies and concentrations used are shown in Supplementary Table 2. The cell nuclei were stained with 4’,6-diamidino-2-phenylindole (DAPI, G1012, Servicebio, Wuhan, China). After quenching the spontaneous fluorescence of the tissue, and antifluorescence quenching sealing agent was used for sealing. Images were captured using an inverted laser confocal microscope (ZEISS LSM880, Jena, Germany).
Liquid chromatography–mass analysis
Amino acid concentrations from collected plasma samples were measured using a SHIMADZU-LC30 ultra-high performance liquid chromatography system (UHPLC) (Nexera X2 LC-30AD, Japan) and ACQUITY UPLC HSS T3 (2.1X Perform chromatographic separation on a 100 mm, 1.8 µ m (Waters, USA) column. Each sample was detected in positive (+) and negative (-) ion modes by electric spray ionization (ESI). The raw data was aligned, retention time corrected, and peak area extracted using the MSDIAL software (MSDIAL ver.4.9, USA). Amino acid structure identification was performed using precise mass number matching (mass tolerance <10 ppm) and secondary spectrum matching (mass tolerance <0.01 Da), with the search performed in public databases such as Human Metabolites Data Base as well as self-built metabolite standard libraries (BP-DB) for providing us with LC-MS/MS analysis. For the extracted data, ion peaks with missing values greater than 50% within the group were not included in the subsequent statistical analysis. The total peak area of the positive and negative ion data were normalised separately, the positive and negative ion peaks were integrated, and the Python software (Python 3.8.10, Holland) was used for pattern recognition. The data was preprocessed using unit variance (UV) scaling and then subjected to data analysis.
Generation of the mouse models and tissue sampling
Male C57BL/6J mice aged eight weeks were purchased from the Experimental Animal Centre of Xi’an Jiaotong University. The mice were randomly divided into four groups. The control group was fed with an standard chow diet. the NAFLD model group was fed with a high-fat diet (Research diet, D12492, US) and high-sugar water (23.1 g/L D-fructose, f0127, and 18.9 g/L d-glucose, G8270, Sigma-Aldrich, St. Louis, MO, USA). the NASH (C-NASH) model group was fed with a high-fat diet with sucrose and, and received intraperitoneal injections (0.2 mL/kg, two times/week, continuously for three weeks) of carbon tetrachloride (CCl4, 289116-100 mL, Sigma-Aldrich) dissolved in olive oil (O815210-500 mL, Sigma-Aldrich). the M-NASH group was fed with a methionine/choline-deficient (MCD, A02082002Bi, Ready Bite, China) diet during eight weeks (30, 31). We raised the control mice in a specific-pathogen-free animal lab, for the hypoxic group. Hypoxia (60% oxygen partial pressure) was elicited by housing the mice for 28 days in a hypobaric chamber simulating an altitude of 4500 m, DYC - 300, Guizhou Feng Lei Oxygen Chamber Co., Ltd., Guizhou, China). The experiment was reviewed and approved by the Medical College of Qinghai University, IACCU (No. 2022-06).
The mice were weighed, and the amount of food intake was recorded weekly. Blood glucose levels were measured using a blood glucose meter (Bayer, USA). Glucose tolerance tests were conducted. Each mouse was fasted for 12 h before receiving an intraperitoneal injection of 10% glucose solution (glucose; Sigma-Aldrich), with blood glucose concentrations measured immediately and after 15, 30, 60 and 120 min. The experimental animals were finally weighed, sacrificed, and the liver tissue was harvested. The tissue was weighed, and the liver index was calculated by dividing the liver weight (g) by the corresponding body weight (g).
The samples underwent protein and gene expression quantifications and were stored at a -80 °C ultra-low temperature refrigerator for subsequent testing. Whole blood centrifugation was used to separate serum samples, which were then stored at -80°C for future use. Serum alanine transaminase (ALT,C009-2-1), aspartate transaminase (AST, C010-2-1), triglyceride (TG, A110-1-1), and total cholesterol (T-CHO, A111-1-1) levels, including liver tissue TG, T-CHO levels, and Adenosine Triphosphate (ATP, A095-1-1) concentrations, were measured using biochemistry kits (Nanjing Jiancheng Bioengineering Institute, Nanjing, China).
Histopathological analysis of liver tissue
Liver tissue samples were fixed in 4% paraformaldehyde, dehydrated, embedded, and sectioned for routine staining according to the instructions for H&E and Sirius red staining provided by the manufacturer (Solarbio, Beijing, China). Sirius red stain features three colours for tissue staining: acid fuchsin stains collagen fibres in red, aniline blue stains nuclei in blue, and phosphomolybdic acid stains muscle and cytoplasm in green. Sirius red staining was used to quantify the degree of fibrosis in liver tissues by measuring the area of collagen fibres in the tissue section, using Image J software, and quantifying the blue-stained areas in the selected regions. H&E staining was observed under an optic microscope (Olympus, Japan). We evaluated the degree of pathological changes using the NAFLD activity score (NAS). Sections subjected to Sirius red staining were observed under a microscope, and the percentage of blue-stained fibrosis was determined. For transmission electron microscopy (TEM), the harvested liver tissues were fixed in a 3% glutaraldehyde solution and sent to the Lilai Biomedicine Experiment Centre (Chengdu, China) for imaging.
Flow cytometry
The fresh liver tissue was cut into small pieces, incubated with collagenase IV, and processed to obtain a single-cell suspension (32). Following the operating procedures for detecting the membrane-permeable JC-1 dye (C25H27Cl4N4.I) with an excitation wavelength of 514 nm, emission light of 529 nm, FITC/SSC (fluorescein isothiocyanate/side scatter) channel, and a reactive oxygen species (ROS) assay kit using the fluorescent probe 2’-7’-Dichlorodihydrofluorescein diacetate (DCFH-DA) was used to measure mitochondrial ROS production. DCFH-DA can be hydrolysed by intracellular esterases to generate DCFH without exiting the cell, allowing the probe to penetrate the membrane easily. Intracellular ROS can then oxidise non-fluorescent DCFH to generate fluorescent DCF. Therefore, the amount of DCF fluorescence was measured to estimate intracellular ROS levels. This was performed using an excitation wavelength of 300 nm, an emission light wavelength of 610 nm, and the phycoerythrin channel in a flow cytometer. A mitochondrial permeability transition pore (mPTP) assay kit was used to detect and assess the opening of the pore by the fluorescence of the mitochondrial membrane-penetrating probe calcein AM, with an excitation wavelength of 494 nm, an emission light wavelength of 517 nm, and the fluorescein isothiocyanate (FITC) or side scatter (SSC) gating channel. All three kits were obtained from Beyotime Biotechnology (Shanghai, China), and the experiments were performed using a CytoFLEX flow cytometer (Beckman, California, USA). Signal parameters were set according to the manufacturer’s instructions. The results were analysed and quantified using the CytoFLEX 2.1 software (Beckman, California, USA).
RNA extraction and quantitative analysis
TRIZOL reagent (Tiangen, Biotech, Beijing, China) was added to liver tissues and cells to extract total RNA. The RNA was Reverse-transcribed into cDNA (Tiangen, China). Table 2 shows the primers designed and synthesised to quantify the expression levels of candidate genes (Sangon, Shanghai, China). SYBR Green from Sagan Corporation (Shanghai, China) was used for real-time polymerase chain reaction (RT-PCR) in an ABI Q5 equipment (Applied Biosystems, Foster City, CA). All experiments were performed in triplicate for quantitative PCR (qPCR) analysis.
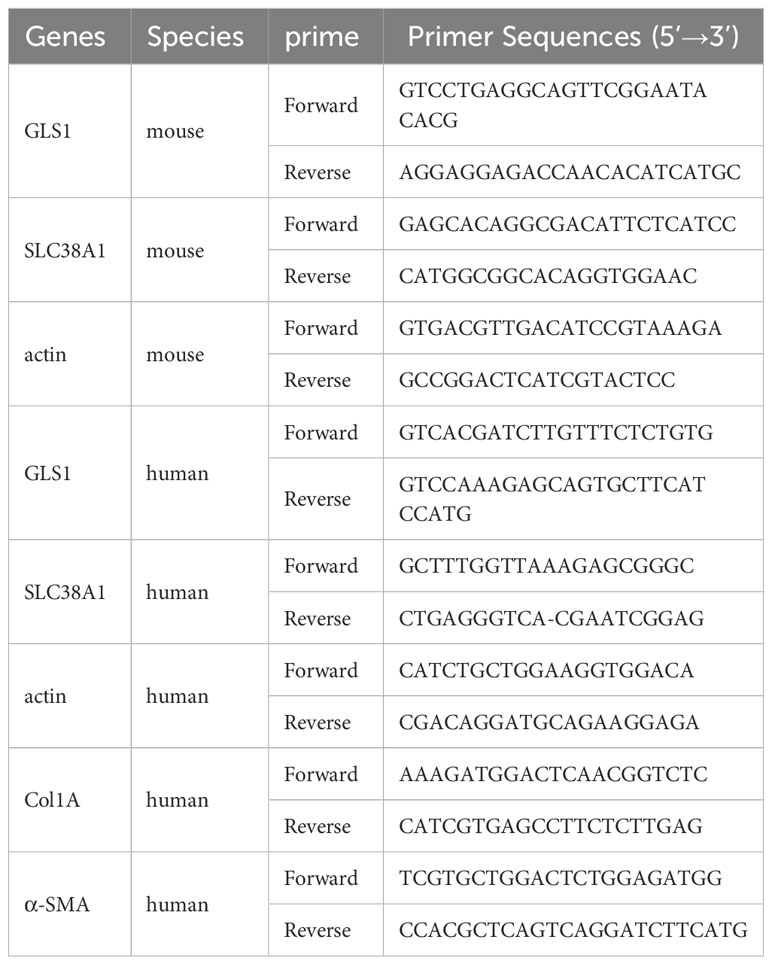
Table 2 Primers sequences and species.
Cell lines and culture
Considering the ability of the LX-2 human HSC line to retain key features of hepatic stellate cytokine signalling and fibrogenesis, LX-2 cells (33) were purchased (Procell Life Sciences, China) and cultured in Dulbecco’s modified eagle medium with 10% foetal bovine serum (GIBCO, US) containing 1% penicillin and 1% streptomycin (GIBCO). DMEM media with and without glutamine was purchased from Procell Life Sciences. Before stimulation treatment, a cells were seeded at a density of 2×10⁵/mL on a six-well plate, and cultivate in serum-free medium for 8 hours, and hypoxic treatment consisted of 200 μM palmitic acid (PA, P0500, Sigma-Aldrich) in 1% O2 for 72 h. Cell culture was conducted in CO2 incubator (Heracell, Thermo, US) at 37°C, 5% of CO2, and 21% of O2; and in tri-gas CO2 incubators (Memmert, Shanghai, China) at 37°C, 5% of CO2, and 1% of O2.
Wounding healing assay
Cells were seeded into 6-well plates (5 × 10⁵cells/mL) using serum-free medium. After 24 h, pipette tips were used to scratch the cell monolayer. The wound was washed to remove non-adherent cells, and culture medium without glutamine (PM150213, Procell Life Sciences, China) was added for 24 h. Cell migration into the scratched area was observed and quantified using an optic microscope. The percentage of wound closure was determined according to the following formula: wound closure rate = [wound area (0h) – wound area (24 h)]/wound area (0 h).
Small interfering RNA transfection
To inhibit HIF-2α expression under hypoxic conditions, small-interfering RNAs (siRNAs) corresponding to the oxygen-dependent domains (ODDs) of HIF-2α were synthesised using Shanghai Genechem Gene Technology Co., Ltd (Shanghai, China). HIF-2α siRNA or scrambled siRNA was cloned into the GV493 packaging plasmids containing the luciferase gene fragment to generate a GV493-hU6-MCS-Ubiquitin-firefly_Luciferase-IRES-puromycin construct. Lentivirus containing HIF-2α siRNA was used to infect LX-2 cells seeded at a density of 1×10⁵ cells/mL in a 24-well plate with a multiplicity of infection (MOI) of 40 using the Hitrans G virus infection enhancing kit (Genechem, China) at a concentration of 5×10⁷ Tu/mL for 16 h. The selected Transfection efficiency was confirmed by detecting green fluorescent protein fluorescence signal. The protein levels of HIF-2α were down regulated by 67% which show in Supplementary Materials. Moreover, YAP was synthesised using OBiO technology company (Shanghai, China). YAP short hairpin RNA (shRNA) or scrambled shRNA was cloned into the pSLenti-U6 packaging plasmid with the luciferase gene fragment to generate the pSLenti-U6-shRNA-CMV-mCherry-F2A-Puro-WPRE construct. Lentivirus containing YAP shRNA was used to infect LX-2 cells seeded at a density of 1×10⁵ cells/mL in a 24-well plate with a multiplicity of infection (MOI) of 40 using the HitransG virus infection enhancing kit (Genechem) at a concentration of 5×10⁸ Tu/mL for 16 h. The cells were incubated in a medium containing 0.4 μg/mL puromycin for 72 h. The efficiency of the silencing was determined using qRT-PCR and western blot analyses. The protein levels of YAP1 were down regulated by 71% which show in Supplementary Materials.
Western blot analysis
Extracted proteins from tissues and cells using Radio Immunoprecipitation Assay lysis buffer (RIPA, R0010) from Solarbio Life Sciences (Beijing, China). The BCA reagent kit from Thermo Scientific (23225, Waltham, USA) was used to detect protein concentration. Protein lysates were loaded on a 10% tris-glycine gel and transferred to a 0.22 μm polyvinylidene difluoride membrane. The primary antibodies (Supplementary Table 3) used to detect protein bands in the membranes included HIF-1α, YAP1, phosphorylated (p)-YAP(S127), Collagen type I alpha 1 (Col1A), mitochondrial oxide phosphorylation complex cocktails (OXPHOS), HIF-2α, α-smooth muscle actin (α-SMA), tubulin from Cell Signaling Technology (Danvers, USA) and β-actin from Sigma-Aldrich (St. Louis, US). The anti-rabbit immunoglobin G HRP-linked antibody and anti-mouse immunoglobin G horseradish from Cell Signaling Technology (Danvers, USA). The chemiluminescence method from Millipore Corporation was used to display the protein bands of western blot. The protein bands were visualised using an Amersham Imager 600 (GE, USA) and were quantified using densitometry analysis (Image J x64 software, NIH).
Immunofluorescence
Immunofluorescence was used to identify the cellular distribution and expression levels of HIF-2α, YAP1, p-YAP (Ser 127), and Col1A in LX-2 cells. Phosphate-buffered saline (PBS)-washed cell plates were fixed in ice-cold 95% methanol and 0.2% Triton X-100. They were then blocked with a 3% BSA solution and incubated with antibodies against HIF-2α, α-SMA, YAP1 (Alexa Fluor 647 Rabbit monoclonal to active YAP1, excitation wavelength of 647 nm, emission light of 652 nm; Abcam, Cambridge, UK), p-YAP(S127), and Col1A at 4°C for 20 h. Afterwards, the cells were incubated with fluorescent secondary antibody (excitation wavelength of 488 nm, emission light of 495 nm; Abcam) in the dark for 2 h. The cell nuclei were stained with DAPI, and the plates were sealed with an anti-fluorescence quenching sealing agent. After washing with PBS, the sections were visualised and imaged using a laser confocal microscope (ZEISS LSM880, Germany). Laser confocal microscopy was used to detect the intensity in each fluorescence channel, and the results were analysed using the ZEN 2.5 software (Zeiss).
Statistical analysis
Data were analysed using IBM SPSS Statistics 25 and GraphPad Prism 8.0 software. Partial least squares-discriminant analysis calculated models were applied to identify different metabolites from the raw LC-MS data between two groups: NASH patients with hypoxemia (Hemoglobin >210g/L) and without hypoxemia (120g/L < Hemoglobin < 180g/L). The significant discriminations of relative levels of amino acids were selected by an iterative backward selection strategy using Variable Importance in Projection (VIP) calculations. The significant discriminations of metabolites were used as values of VIP > 1, as an accepted threshold. Experimental data were obtained from multiple replicates. Inter-group data were analysed using one-way analysis of variance (ANOVA). Quantitative and normally distributed data were expressed as Mean ± Standard deviation, and inter-group data were analysed using one-way ANOVA. Variables with a skewed distribution were represented by the median and quartile, expressed as Mean (P25, P75), and the rank sum test was used for analyses involving multiple groups. Statistical significance was set at p < 0.05.
Results
Patients with NAFLD and hypoxaemia have increased ALT associated with augmented glutamine catabolism
Following our previous finding of increased hepatic HIF-2α in patients with NASH living at high altitudes, we hypothesised that HIF-2α may play an additional role in NAFLD and NASH progression. We first investigated the associations between hypoxaemia and ALT in a cohort of patients with NAFLD living in high altitudes (n=73). The general characteristics of patients with NAFLD are shown in Table 1. Moreover, we found that male patients with NASH and hypoxaemia (haemoglobin >210 g/L) had significantly increased serum levels of ALT compared to those without hypoxaemia (Figure 1A). Thereafter, we found that the expression levels of glutaminase-1 were significantly higher in patients with NASH and hypoxaemia (haemoglobin >210g/L) compared to those without hypoxaemia. The glutamine levels were significantly decreased by 25%, but those of glutamate were increased by 30% in the plasma of patients with hypoxaemia (Figure 1B). Immunohistochemistry for glutaminase-1 on liver sections of patients with NASH confirmed by histology showed that staining was located around the central vein areas in Zone 3, which is the area of relative hypoxia in the hepatic lobules (Figures 1C, D; Supplementary Figure 1). Similarly, increased intensity for HIF-2α but not HIF-1α (Figures 1C, E), staining were observed in the area, accompanied by increased α-SMA staining in the hypoxaemia and NASH group (Figures 1C, F).
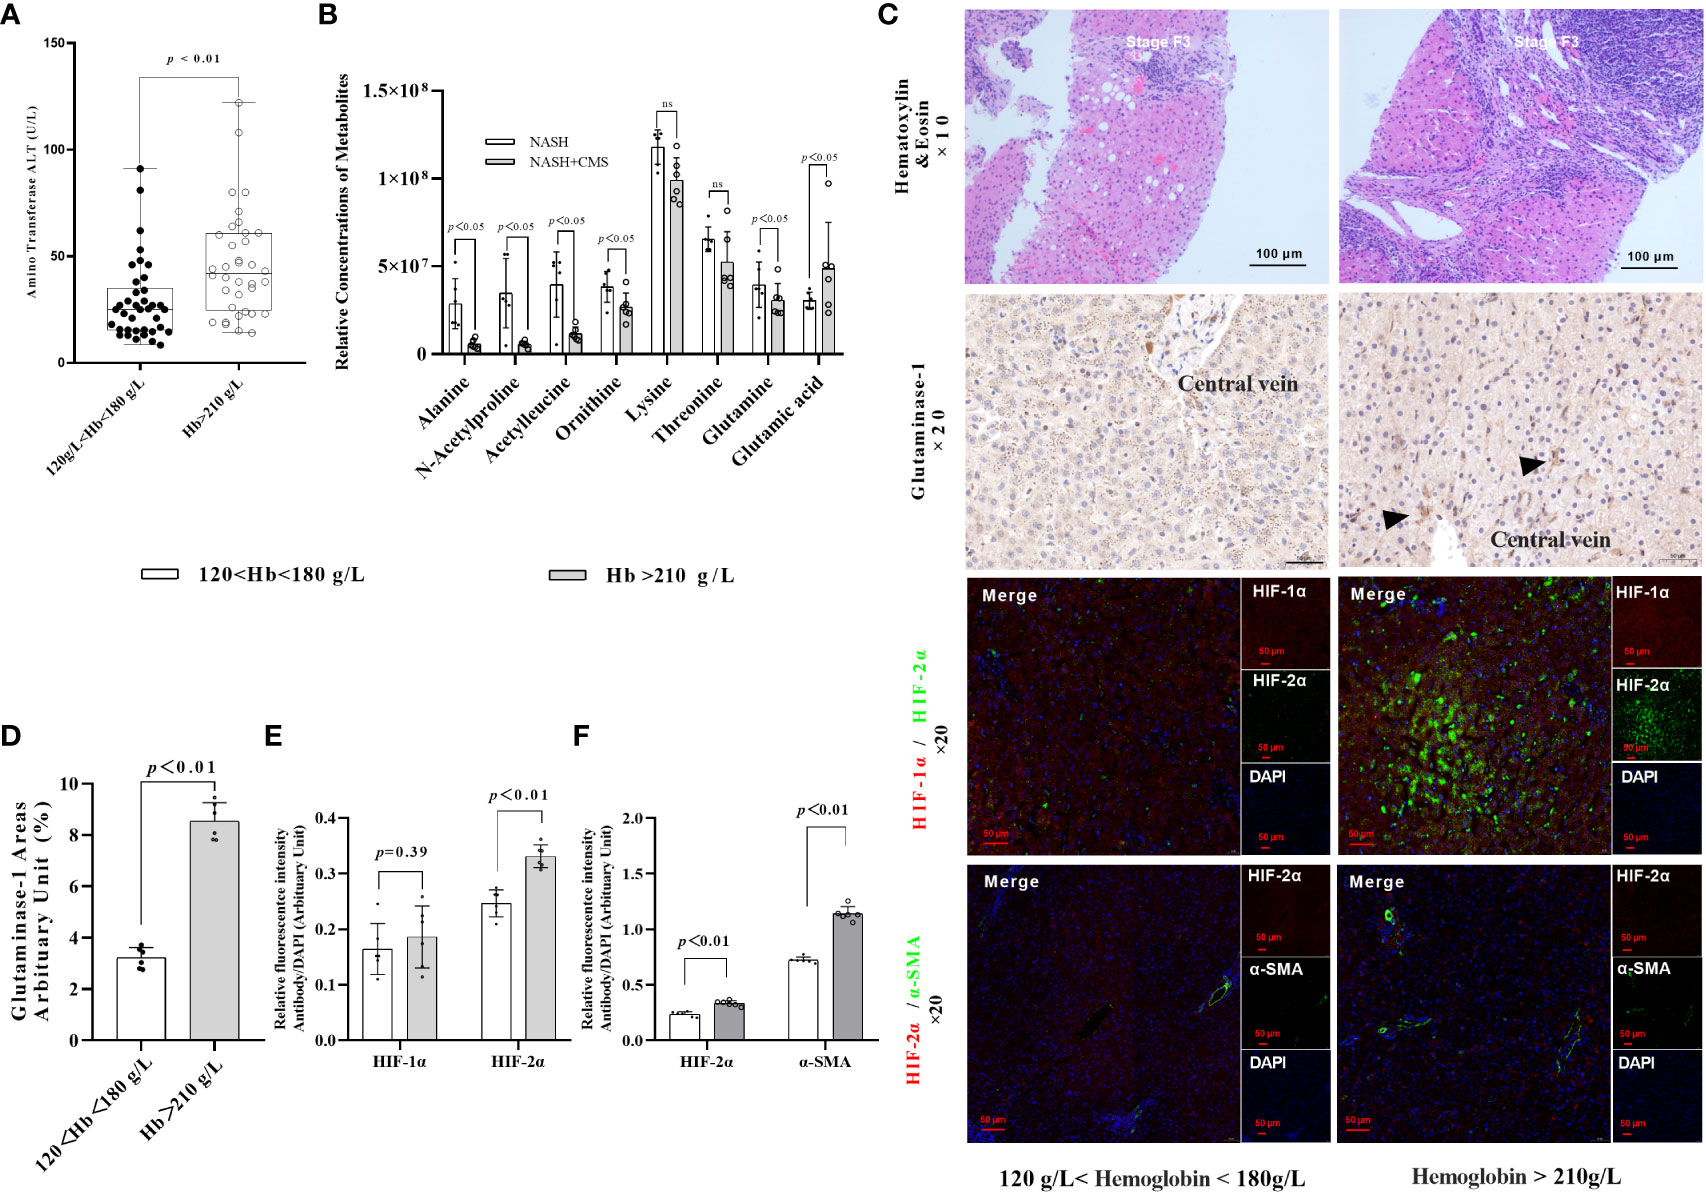
Figure 1 HIF-2α exacerbates fibrosis in patients with NASH by increasing GLS1 expression during chronic hypoxia. (A) Serum ALT levels were higher in male patients with NASH and hypoxemia (haemoglobin >180 g/L) compared to those with normal haemoglobin levels (120–180 g/L) (p < 0.01). (B) Relative concentration of amino acids in plasma (n=6). (C) H&E staining shows increased fibrosis in NASH patients with hypoxaemia. Immunohistochemistry staining shows increased GLS1 expression in liver tissues of patients with NASH and hypoxaemia. Immunofluorescence staining shows a non-significant increase in the expression of HIF-1α and a significant increase in HIF-2α expression and its co-localisation with α-SMA in liver sections from patients with NASH and hypoxemia. (n = 6; magnification, 200×). (D) GLS1 staining was significantly increased in patients with NASH and hypoxemia compared to those in the control group (n = 6). (E) HIF-2α protein levels were significantly increased in patients with NASH and hypoxemia compared to those in the control group (n = 6). (F) HIF-2α and α-SMA protein levels were significantly increased in patients with NASH and hypoxemia compared to those in the control group (n = 6). Data are presented as means±SD of independent experiments. H&E, Haematoxylin and eosin staining; NASH, non-alcoholic hepatitis; GLS1, Glutaminase 1; HIF-1α, hypoxia-inducible factor-1α; α-SMA, α-smooth muscle actin.
Hypoxia exacerbated hepatic fibrosis in mice with NAFLD/NASH associated with upregulated HIF-2α and YAP-induced glutamine catabolism
Hematoxylin-eosin staining and Sirius Red staining showed increased fibrosis in the mouse models for NAFLD and NASH (Figures 2A, B). Moreover, severe fibrosis was observed in mice with NAFLD, C-NASH, and M-NASH subjected to hypoxia (Figure 2B; Supplementary Figure 2). Furthermore, all three groups of experimental animals showed increased NAS values (Table 3). No significant differences were found in food intake, liver index, and body weight across and within the groups (Table 4). However, TG and cholesterol levels in liver tissue and serum were elevated in all the groups. Furthermore, glucose tolerance tests revealed that all the mouse models subjected to hypoxia had a significant increase in the area under the curve of Intraperitoneal Glucose Tolerance Test (IPGTT) and in the fasting glucose levels (Supplementary Figure 3; Figure 2C).
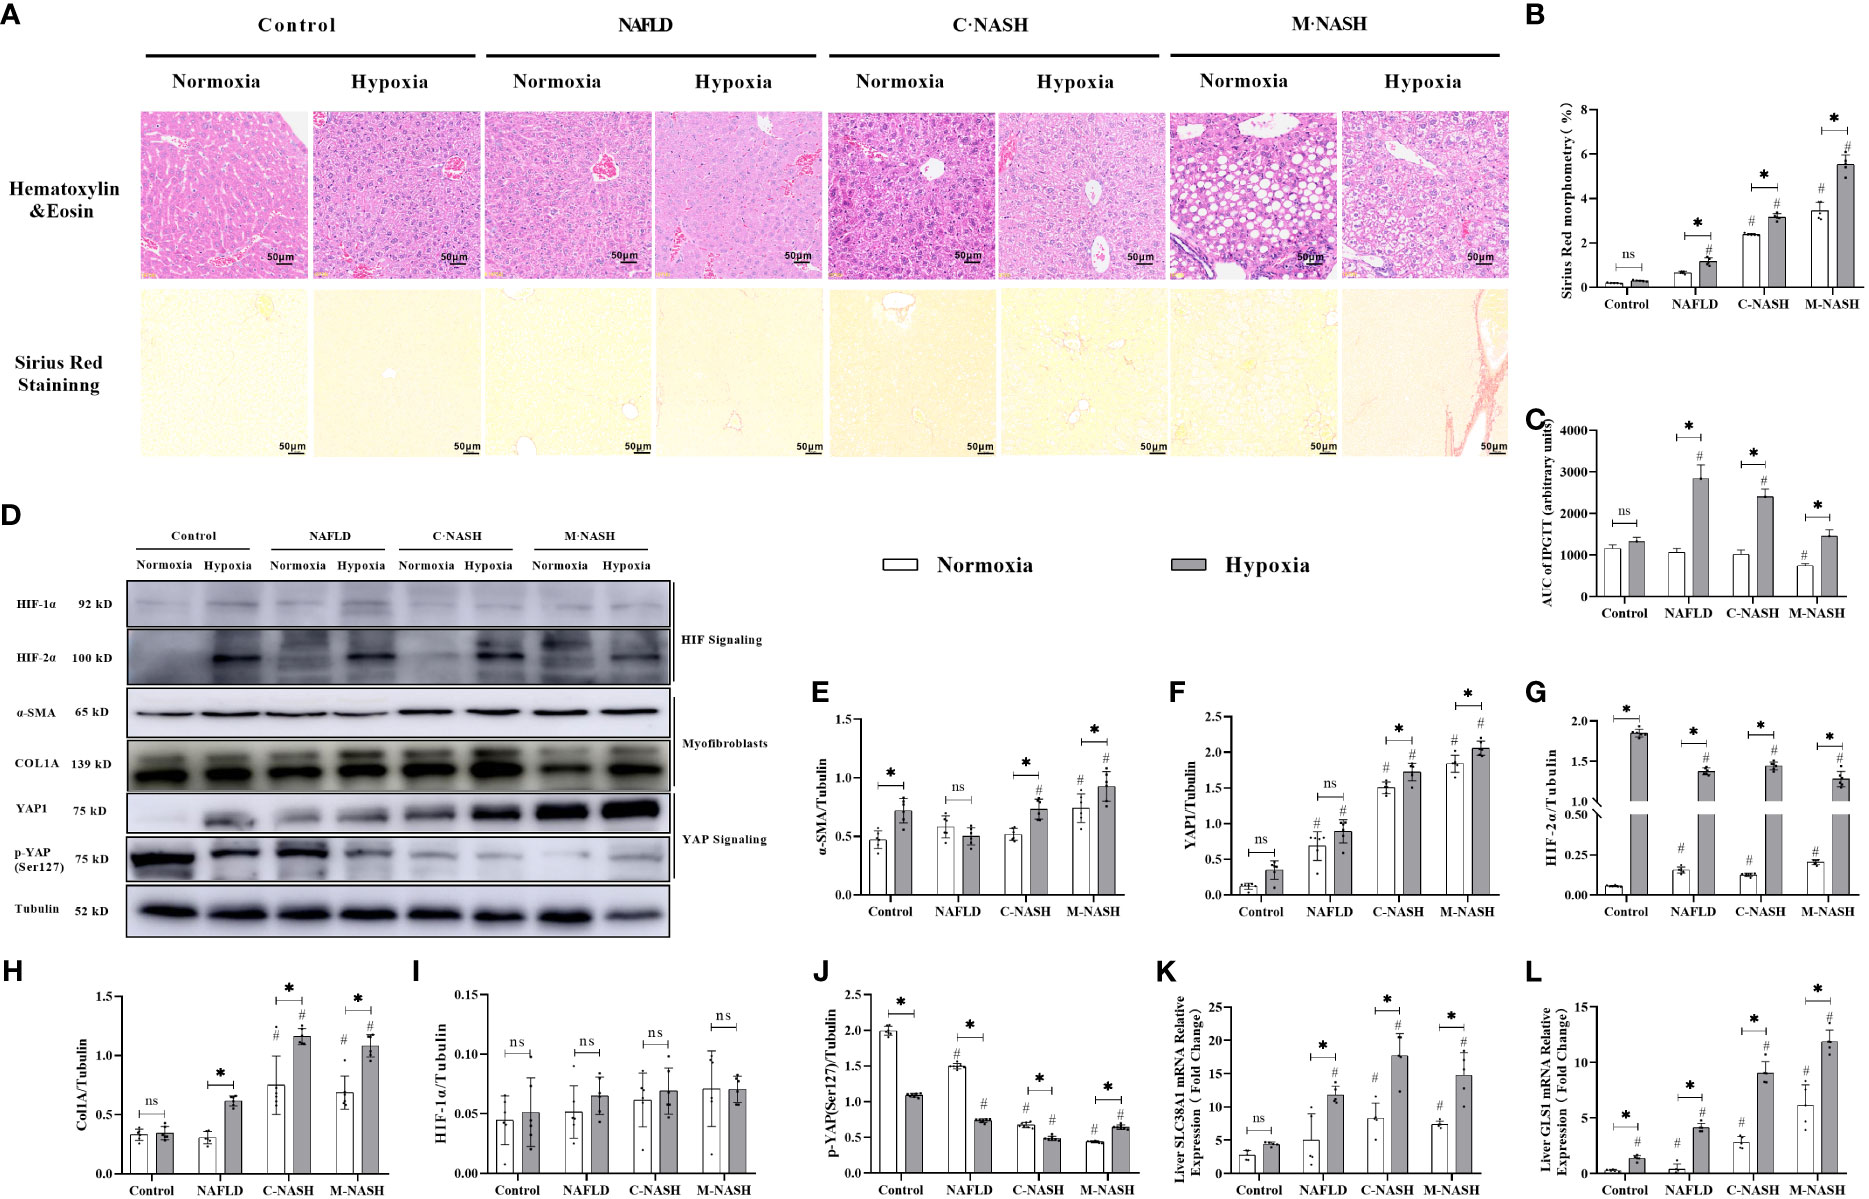
Figure 2 Chronic hypoxia exacerbates fibrosis in mice with NAFLD and NASH, and is associated with HIF-2α and YAP1 overexpression. (A) H&E and Sirius red staining of liver tissue from mouse models for NAFLD and NASH show increased fibrosis in response to hypoxia (n = 5; magnification, 200×). (B) Sirius red staining quantification confirmed increased fibrosis in a mouse model for NASH in response to hypoxia (n = 5). (C) Mice subjected to hypoxia showed impaired glucose tolerance according to the results of the glucose tolerance test. (D) Western blot analysis showed increased expression of α-SMA, YAP1, HIF-2α, and Col1A in mouse models subjected to hypoxia. (E–I) Quantification of western blot results confirmed increased expression of α-SMA, YAP1, HIF-2α, and Col1A, but not HIF-1α, in mouse models subjected to hypoxia (n = 5). (J) Quantification of p-YAP(S127) expression showed decreased phosphorylation of YAP in mouse models in response to hypoxia (n = 5). (K, L) Quantification of mRNA expression levels showed increased expression of SLC38A1 and GLS1 following hypoxia (n = 5). Bars represent mean ± SD of n=5 mice/group. *: p < 0.05 between the two groups under the same conditions, ns: p≥0.05 between the two groups under the same conditions, #p < 0.05 vs Control group. NAFLD, Non-alcoholic fatty liver disease; NASH, Nonalcoholic steatohepatitis; YAP1, Yes-associated protein 1; H&E, Haematoxylin and eosin; HIF-2α, Hypoxia-inducible factor-2α; Col1A, Collagen type I alpha 1; α-SMA, α-smooth muscle actin; p-YAP(S127), Phosphorylated yes-associated protein.
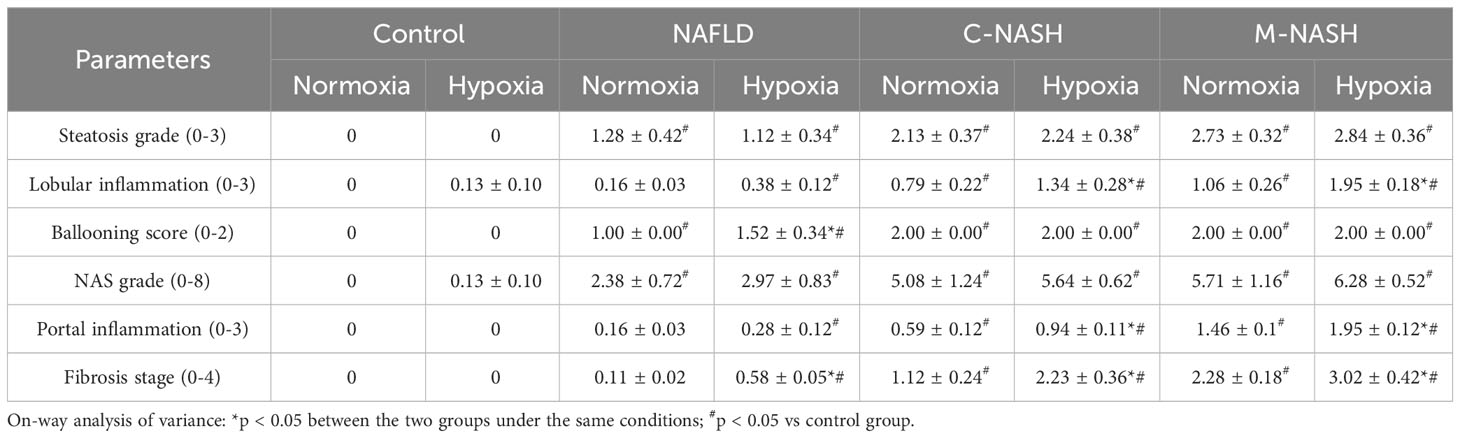
Table 3 Histologic characteristics of the established NAFLD and NASH mice (n=5 for each group).
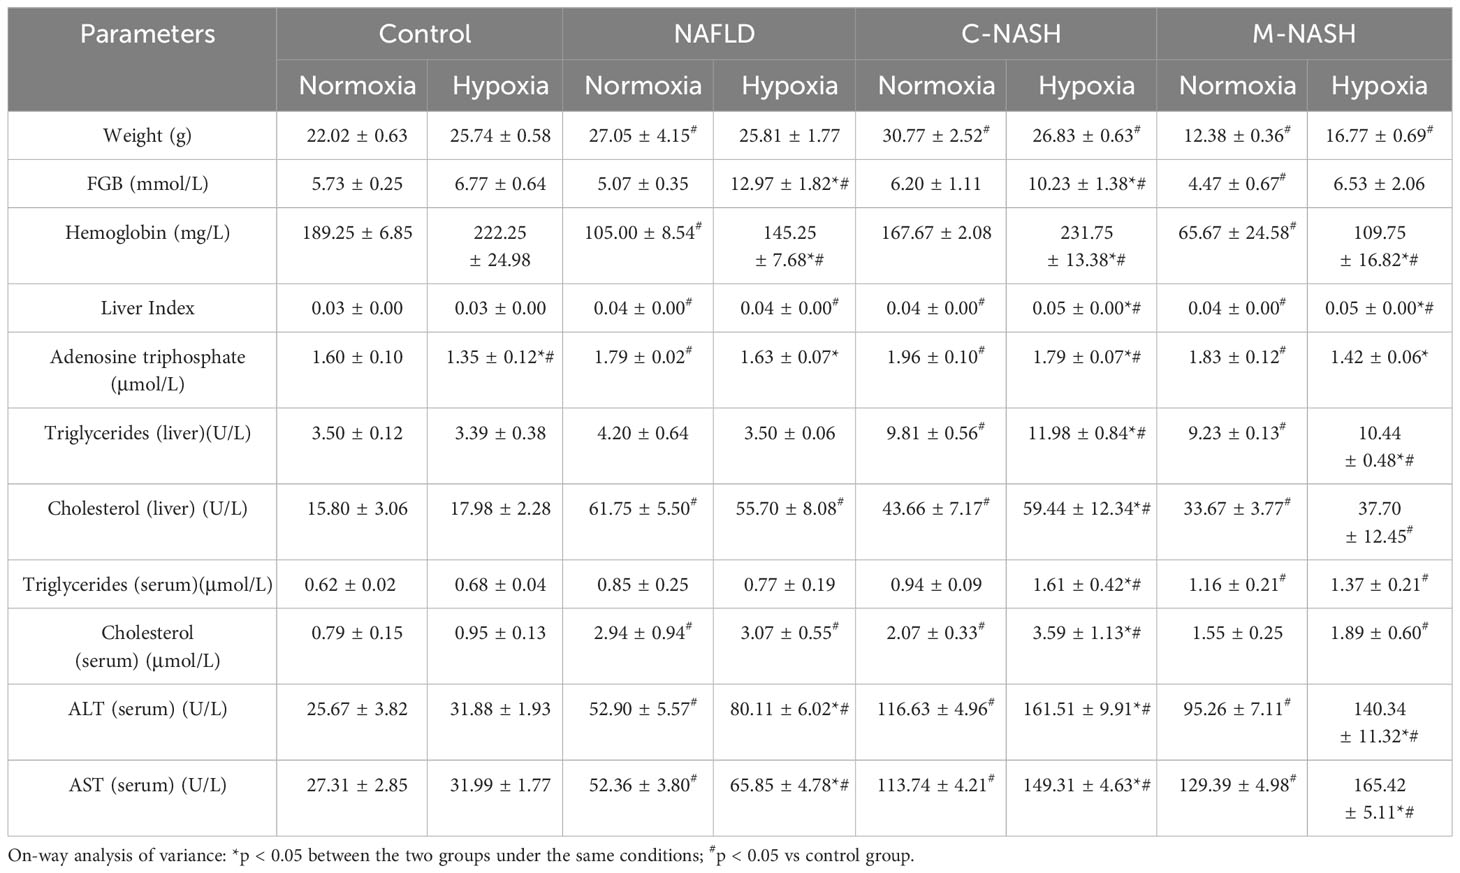
Table 4 General characteristics of the NAFLD and NASH mice (n=5 for each group).
We then examined HIF expression levels after chronic hypoxia. In contrast to HIF-1α expression levels, HIF-2α expression levels were significantly increased in all groups that had been subjected to hypoxia compared with those in the control group. Furthermore, we observed a significant increase in myofibroblast markers, α-SMA and Col1A in HSCs obtained from groups that had been subjected to hypoxia. The M-NASH group exhibited the highest increase, suggesting enhanced severity compared with the C-NASH group (Supplementary Figure 4; Figures 2D–J).
To understand the effect of chronic hypoxia on glutaminolysis in HSCs, the expression of two key enzymes, GLS1 (which decomposes glutamine) and SlC38A1 (which facilitates glutamine transfer) in the C-NASH and M-NASH groups was quantified by qRT-PCR (Figures 2K, L). The mRNA levels for both enzymes showed a significant increase in these two groups in response to hypoxia. Moreover, YAP1 protein levels increased in all groups subjected to hypoxia compared with those in the normoxic group, whereas phosphorylated p-YAP(S127) expression significantly decreased. These findings corroborate our observations in human patients, underlying the potential influence of hypoxia on fatty liver disease progression.
Hypoxia impaired hepatic mitochondria, inhibited oxidative phosphorylation, and increased ROS production in mouse models for NAFLD/NASH
Given the importance of mitochondrial dysfunction in NAFLD progression, we investigated the impact of chronic hypoxia on mitochondrial function. TEM revealed no significant differences in mitochondrial morphology between the normoxic and hypoxic groups. However, in the hypoxic NAFLD group, we observed swollen mitochondria with irregular edges, indicative of severe damage under hypoxic conditions. This mitochondrial damage was more severe in the C-NASH and M-NASH groups, with significant swelling, fusion, and cristae disappearance in the mitochondria following hypoxia (Figure 3A). We also observed a reduction in the expression of the oxidative phosphorylation complex, which is integral to mitochondrial oxidative metabolism. Figure 3B; Supplementary Figure 5 shows a significant decrease in complex I expression in the hypoxic group, with similar trends observed for complexes II, IV, and V. The most evident decreases after low oxygen treatment were observed in the M-NASH and C-NASH groups. We also found that ATP production was significantly decreased in all the experimental groups in response to hypoxia (Figures 3C–G).
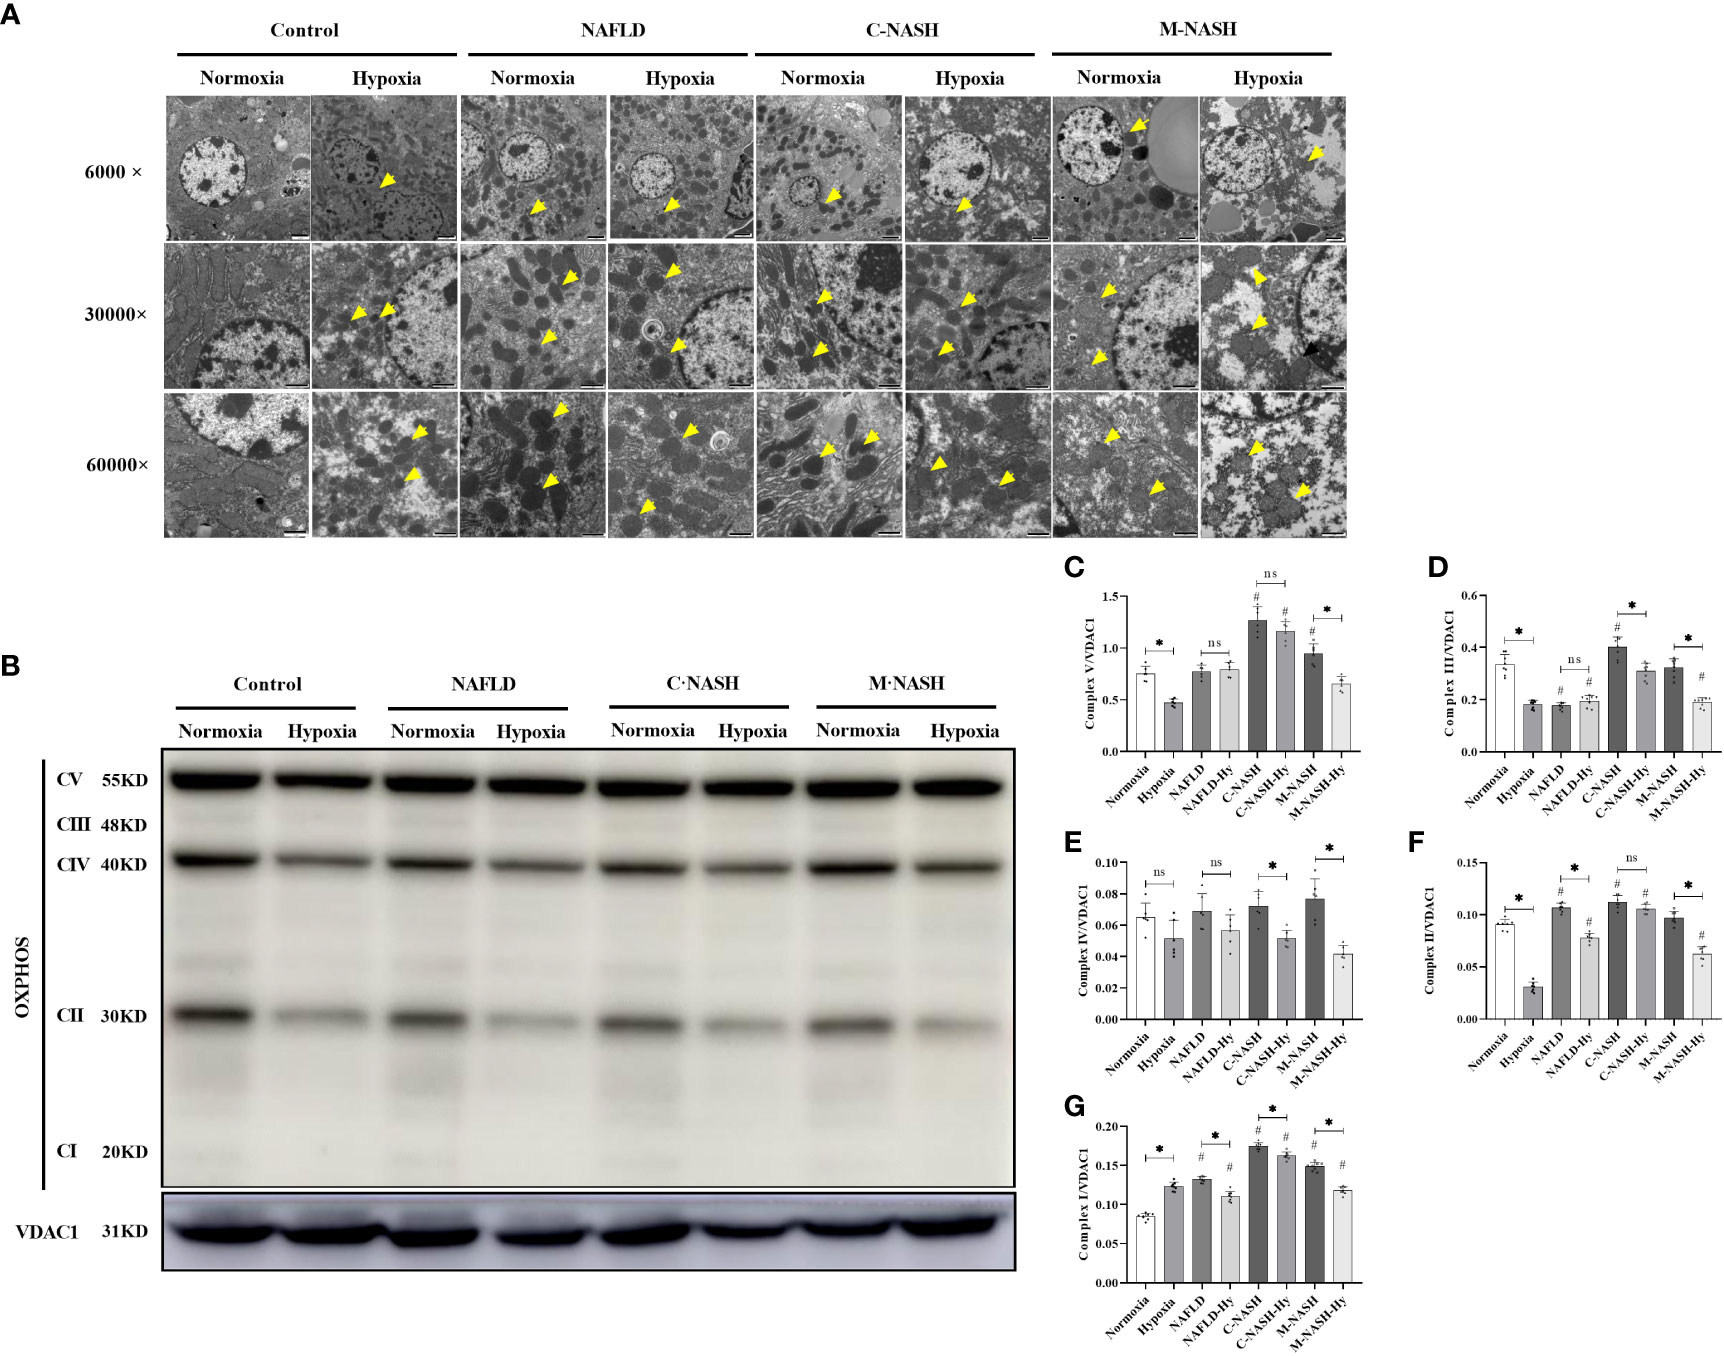
Figure 3 Chronic hypoxia impaired hepatic mitochondria and inhibited the oxidative phosphorylation complex in mouse models for NAFLD and NASH. (A) Representative TEM images showing the morphology of mitochondria in liver samples from mouse models for NAFLD and NASH. Samples from animals subjected to hypoxia showed enlarged and swollen mitochondria with disordered cristae. (B) Image of western blot from mouse liver lysates showing bands corresponding to OXPHOS complexes, with β-Tubulin used as the loading control. (C–G) Quantification of band densities for OXPHOS complexes I, II, III, IV, and V. The samples corresponding to animals subjected to hypoxia showed decreased expression for all OXPHOS complexes (n = 5; *p < 0.05 between the two groups under the same conditions, #p < 0.05 vs Control group). TEM, Transmission electron microscopy; NAFLD, Non-alcoholic fatty liver disease; NASH, Non-alcoholic hepatitis; OXPHOS, oxidative phosphorylation. ns: No significance.
We hypothesised that ROS production in the mitochondria of liver cells and mitochondrial membrane damage would significantly increase under hypoxic conditions. Hepatocytes were isolated and flow cytometry was applied to measure JC-1, mROS, and mPTP, all of which are related to mitochondrial activity and ROS production. The results showed that the JC-1 and mROS detection indices were significantly increased in the NAFLD and NASH groups subjected to hypoxia; however, the higher amount of mPTP was significantly decreased in these experimental groups (Figures 4A–D).
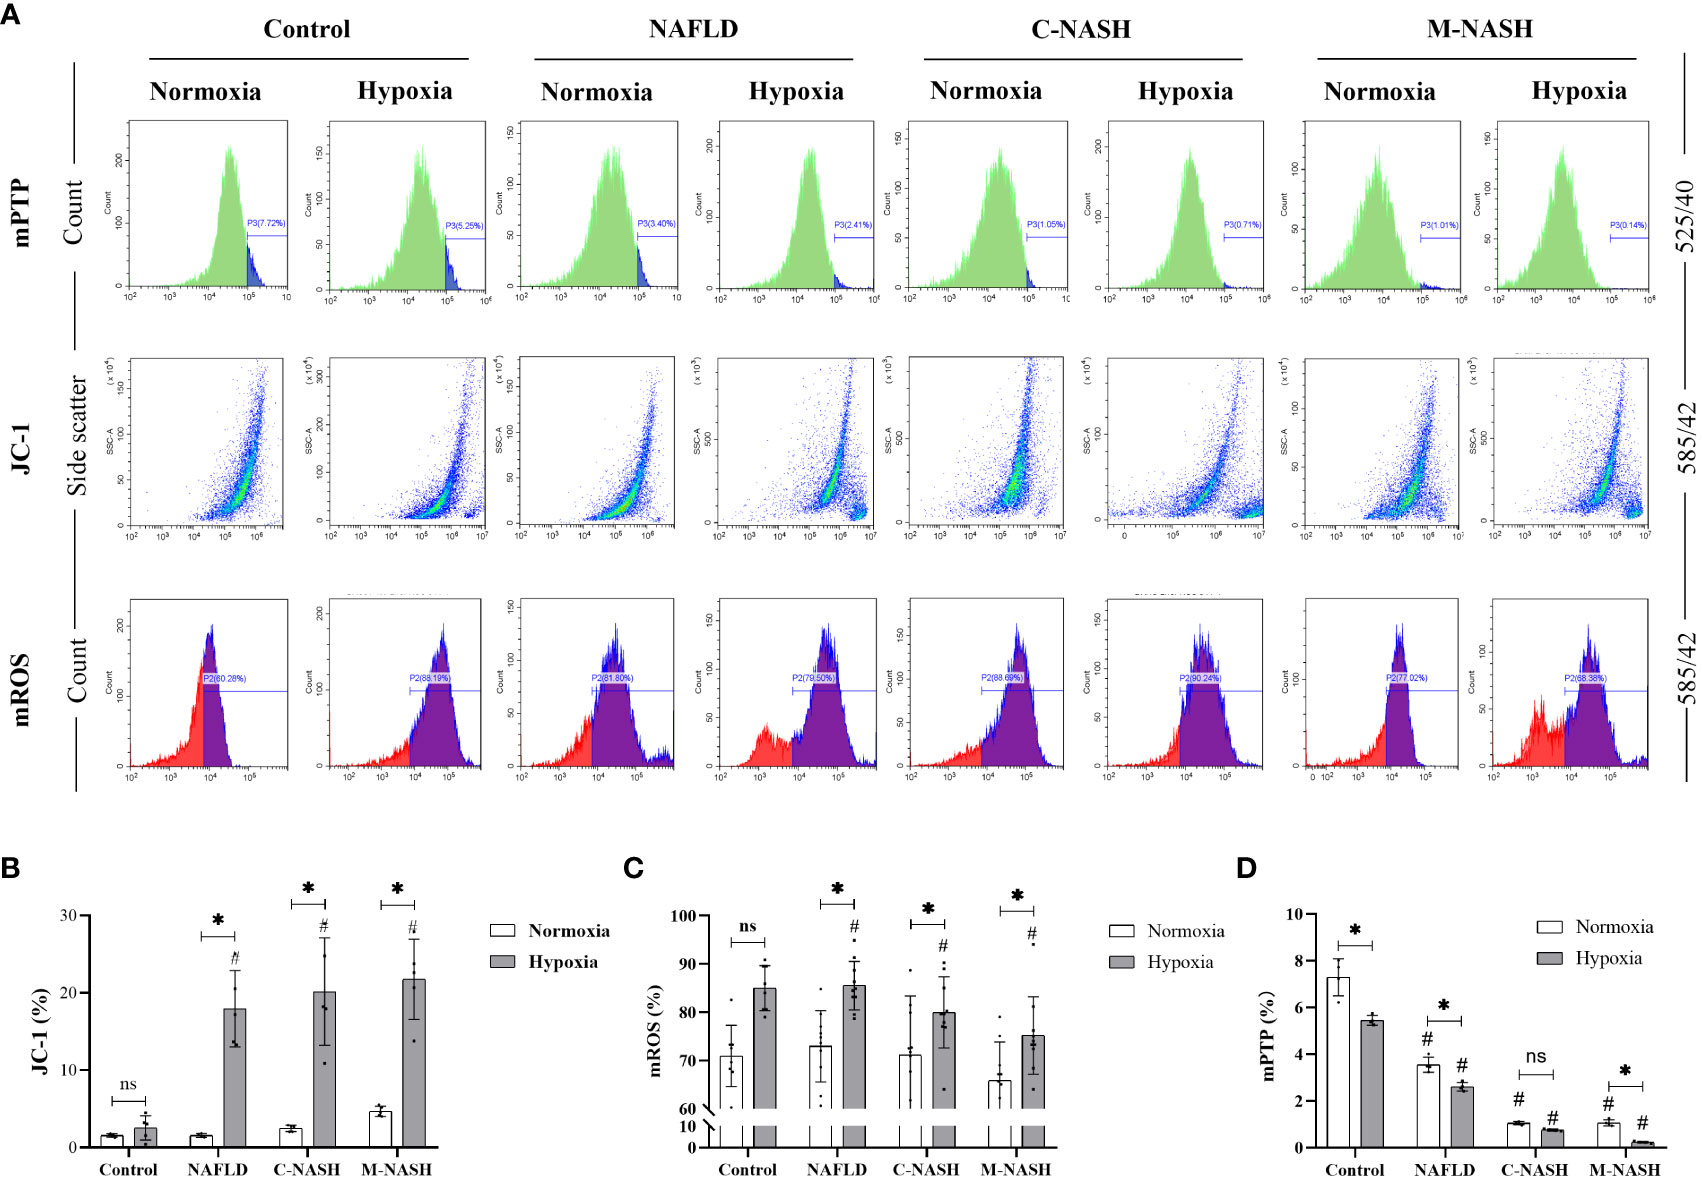
Figure 4 Chronic hypoxia augmented mitochondrial ROS production by impairing mitochondrial membrane and opening mPTPs in hepatocytes from mouse models for NAFLD and NASH. (A) Flow cytometry images and visualisations of the ΔΨm, ROS, and mPTP opening. Mice subjected to hypoxia showed decreased ΔΨm, increased ROS production, and increased mPTP opening. (B) Quantification of JC-1 levels of ΔΨm. Hypoxic mice showed a significantly decreased ΔΨm. (n = 5; *p < 0.05 between the two groups under the same conditions, #p < 0.05 vs Control group). (C) Quantification of mitochondrial ROS levels. Hypoxic mice showed significantly increased ROS production. (n = 5; *p < 0.05 between the two groups under the same conditions, #p < 0.05 vs Control group). (D) Quantification of mPTP opening. Mice subjected to hypoxia showed a significant increase in mPTP opening (n = 5; *p < 0.05 between the two groups under the same conditions, #p < 0.05 vs Control group). ROS, Reactive oxygen species; mPTP, Mitochondrial permeability transition pore; NAFLD, Non-alcoholic fatty liver disease; NASH, Non-alcoholic hepatitis; ΔΨm, mitochondrial membrane potential.ns: No significance.
HIF-2α upregulation increased myofibroblasts dependent on YAP-induced glutaminolysis in vitro
HIF-2α, α-SMA, and Col1A showed increased expression in LX-2 cell cultures subjected to hypoxia, with the highest increase observed in cultures supplemented with palmitate (Supplementary Figure 6; Figures 5A–F). qPCR detection further confirmed two-fold or higher increases in the expression of SLC38A1 and GLS1 (Figures 5G, H). These pieces of evidence from in vitro cell culture support the hypothesis that hypoxia exacerbates liver fibrosis. The trends in the changes observed in the expression levels of HIF-2α, α-SMA, Col1A, and the mitochondrial oxidative phosphorylation complex (Supplementary Figure 6; Figures 5J, K), as well as those in ATP production (Figure 5I) were consistent with those observed in vivo in the mouse models, suggesting that hypoxia-induced upregulation of HIF-2α promotes cell fibrosis via the YAP1 and mitochondrial energy metabolisms.
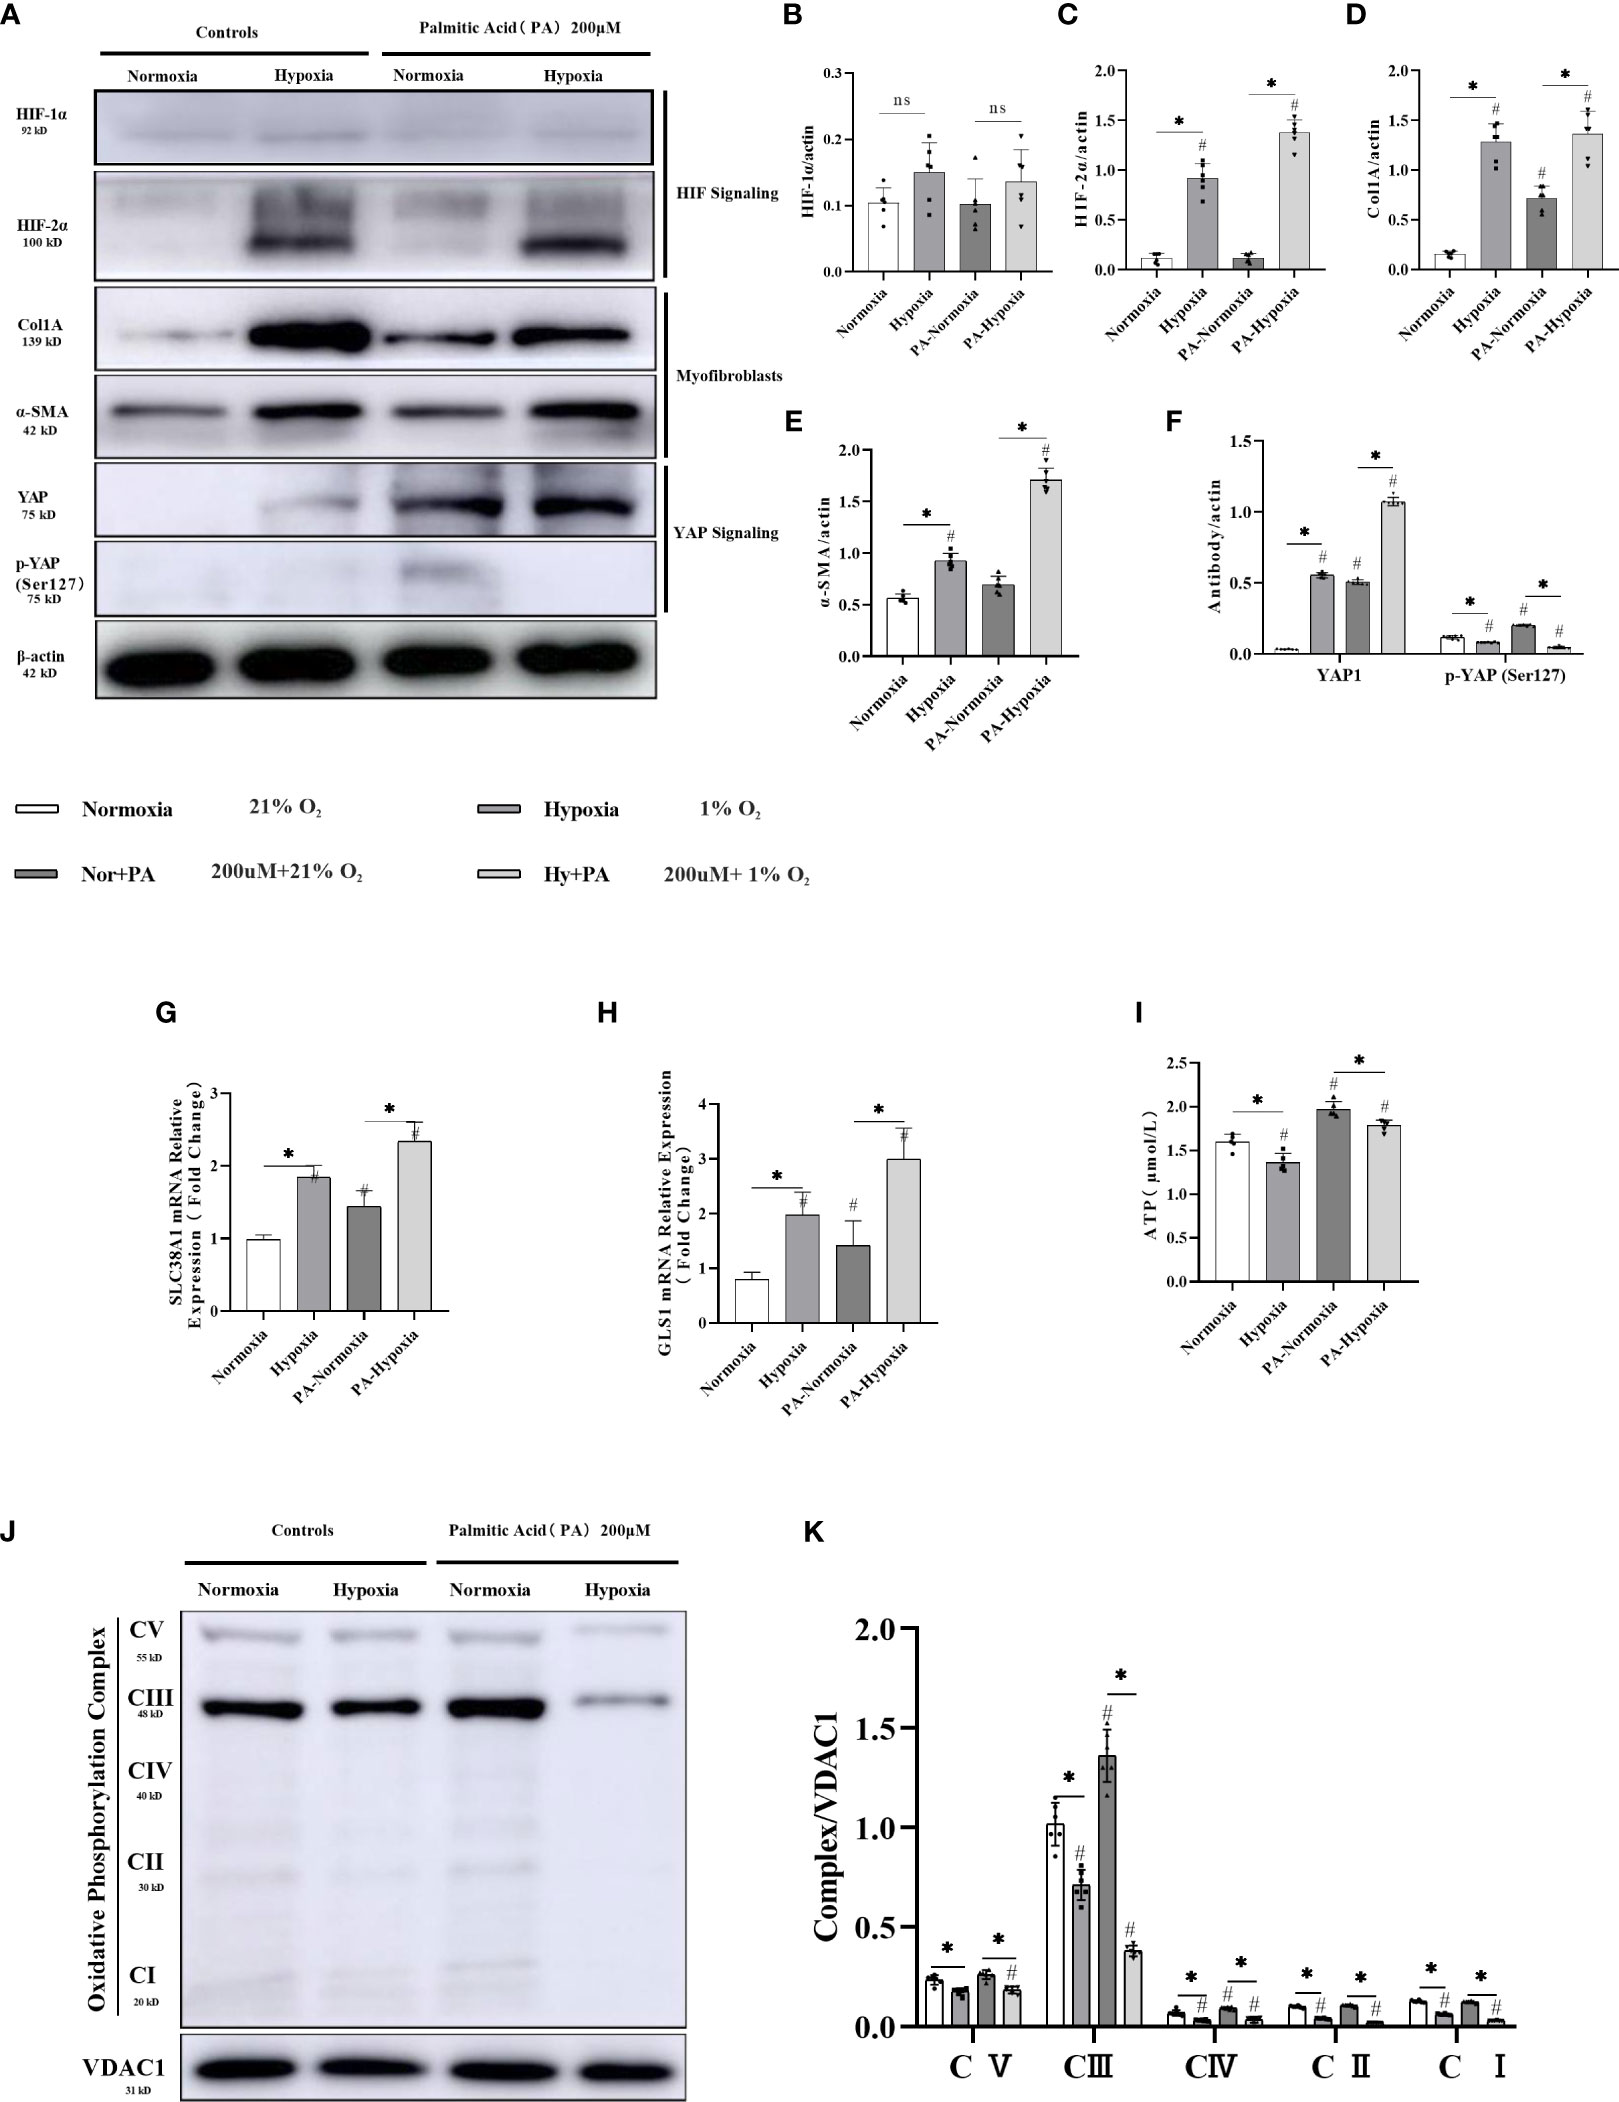
Figure 5 HIF-2α overexpression triggered by hypoxia augmented YAP-induced myofibroblast differentiation and inhibited the mitochondrial oxidative phosphorylation complex, and ATP production in LX-2 cells. (A) Western blot results for fibrosis-related proteins from LX-2 cell lysates, with β-actin as loading control. Cell cultures subjected to hypoxia showed increased expression of HIF-2α, α-SMA, YAP1, and Col1A, and decreased phosphorylation of YAP (Ser127). (B–F) Quantification of western blot results confirmed increased expression of HIF-1α, HIF-2α, α-SMA, Col1A, YAP1, and decreased expression of p-YAP (Ser127) in hypoxic cultures. (n = 3; *p < 0.05 between the two groups under the same conditions, #p < 0.05 vs normoxia group). The mRNA expression levels of SLC38A1 (G) and GLS1 (H) were increased in hypoxic cultures. (n = 3; *p < 0.05 between the two groups under the same conditions, #p < 0.05 vs normoxia group). (I) ATP production was decreased in cells subjected to hypoxia. (n = 3; *p < 0.05 between the two groups under the same conditions, #p < 0.05 vs normoxia group). (J) Western blot results for oxidative phosphorylation proteins from LX-2 cell lysates, with VDAC1 as loading control. Cell cultures subjected to hypoxia showed decreased expression of all OXPHOS complexes. (K) Quantification of western blot results confirmed decreased expression of all OXPHOS complexes in hypoxic cultures (n = 3; *p < 0.05 between the two groups under the same conditions, #p < 0.05 vs normoxia group). YAP1, Yes-associated protein; HIF-1α, Hypoxia-inducible factor-1α; HIF-2α, Hypoxia-inducible factor-2α; Col1A, Collagen type I alpha 1; α-SMA, α-smooth muscle actin; p-YAP(S127), Phosphorylated yes-associated protein; GLS1, Glutaminase 1; OXPHOS, oxidative phosphorylation. ns: No significance.
To confirm that glutamine is an energy source for myofibroblasts, LX-2 cell cultures were exposed to 1% O2 concentrations in a hypoxic chamber for three days using either standard or glutamine-deprived glucose medium. However, no significant differences in cell viability were observed between the hypoxia and control groups when glutamine-deprived culture medium was used (Figures 6A, B). Cell migration ratios were significantly decreased when glutamine-deprived glucose medium was used (Supplementary Figures 7A, B), and protein levels of both α-SMA and Col1A were downregulated (Supplementary Figures 7C, D). Interestingly, after HIF-2α and YAP were experimentally downregulated via shRNAs, upregulation in the expression levels of GlS1 and GlS2, which are related to glutamine metabolism during hypoxia, was no longer evident, and the fluorescence signal was completely reversed. Moreover, the expression levels of GLS1 and SLC38A1 were significantly reduced in the hypoxia group (Figures 6C, D). We also observed an increase in active myofibroblastic phenotypes, as demonstrated by α-SMA immunofluorescence, in the hypoxia group (Figure 6E and quantified in Figures 6F, G). Additionally, glutaminolytic activity was higher in the group exposed to 1% O2 compared with that in the control group (exposed to 21% O2).The fluorescence intensity of α-SMA and Col1A remained low, and mRNA expression levels for GLS1 and SLC38A1 were lower than those in the control group.
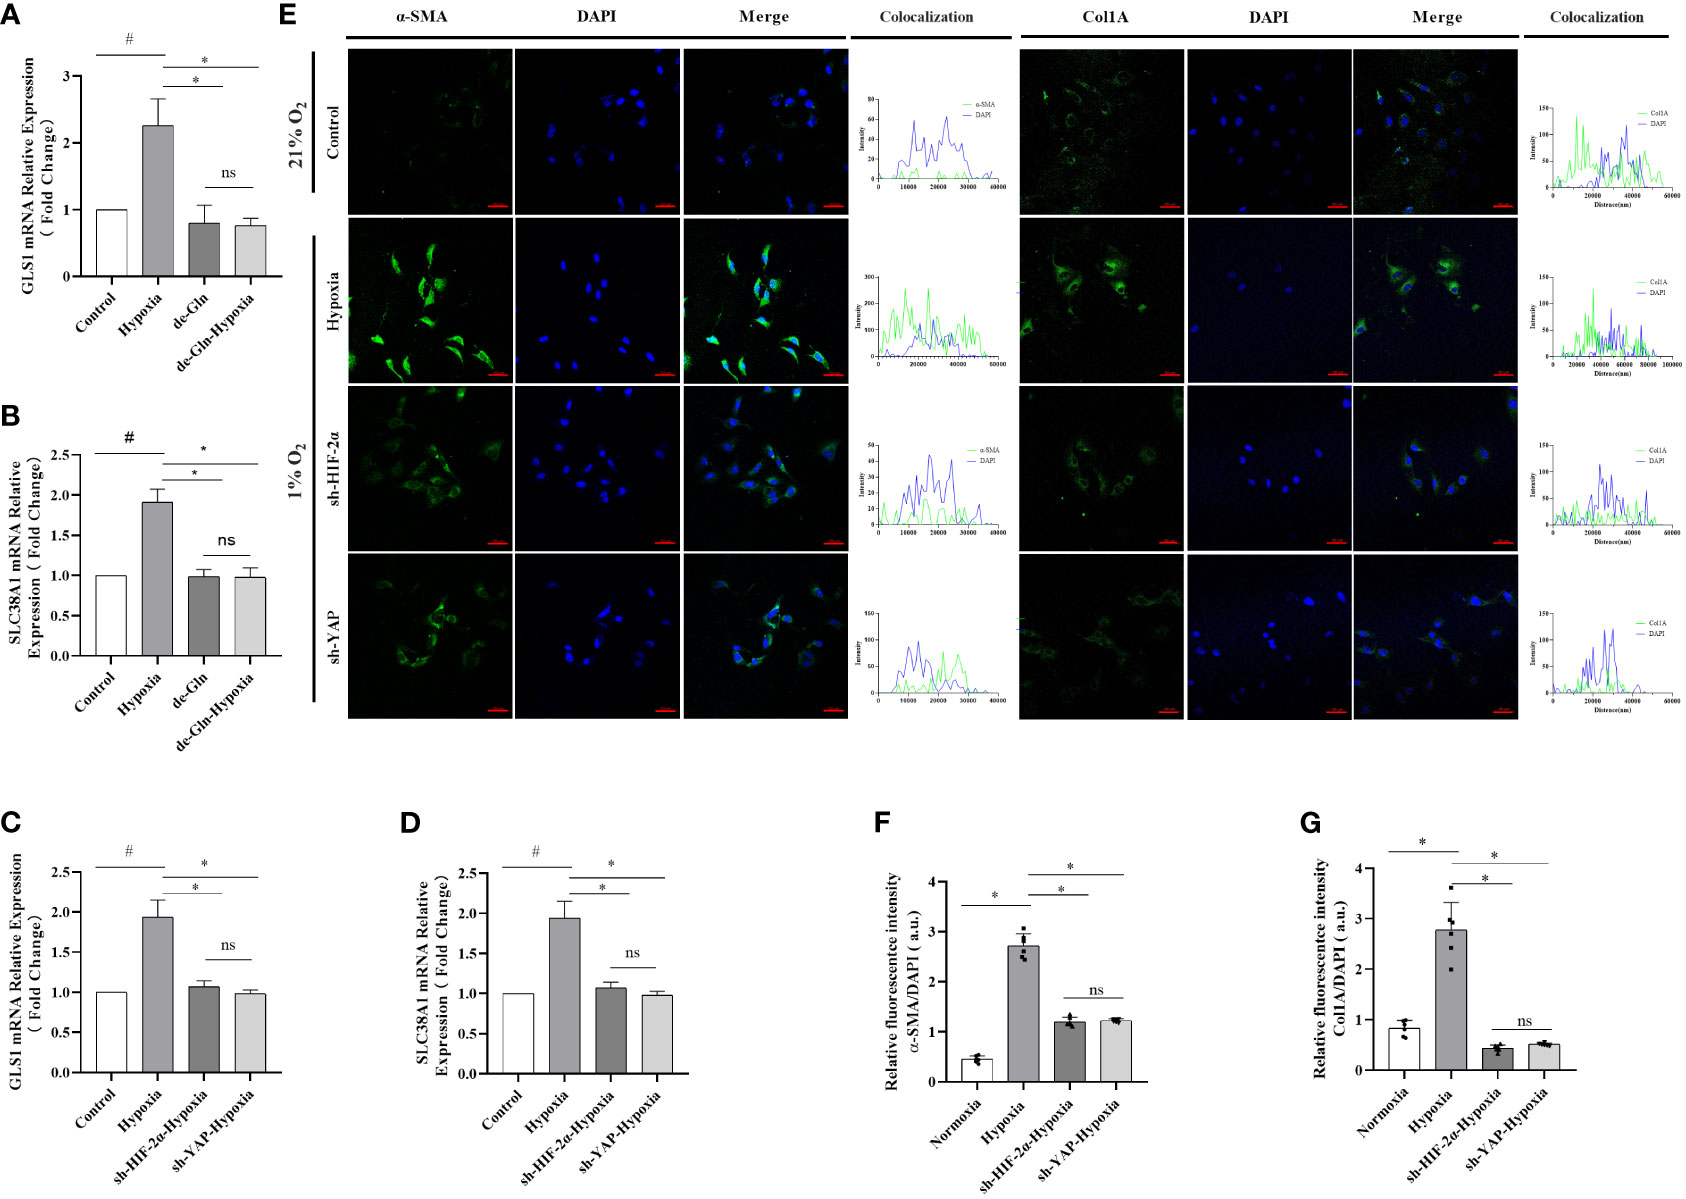
Figure 6 HIF-2α overexpression triggered by hypoxia augmented YAP-induced myofibroblast differentiation in a glutamine-dependent manner, which was abolished by the downregulation of HIF-2α and YAP in LX-2 cells. (A) GLS1 mRNA expression in LX-2 cells under different conditions. Hypoxia increased GLS1 expression, which was abolished by HIF-2α and YAP1 downregulation (n = 3; *p < 0.05 between the two groups under the same conditions, #p < 0.05 vs control group). (B) SLC38A1 mRNA expression in LX-2 cells under different conditions. Hypoxia increased SLC38A1 expression, which was abolished by HIF-2α and YAP1 downregulation (n = 3; *p < 0.05 between the two groups under the same conditions, #p < 0.05 vs control group). (C) GLS1 mRNA expression in LX-2 cells after HIF-2α and YAP1 downregulation. HIF-2α and YAP1 downregulation abolished the hypoxia-induced increase in GLS1 expression (n = 3; *p < 0.05 between the two groups under the same conditions, #p < 0.05 vs control group). (D) SLC38A1 mRNA expression in LX-2 cells after HIF-2α and YAP1 knockdown. HIF-2α and YAP1 knockdown abolished the hypoxia-induced increase in SLC38A1 expression (n = 3; *p < 0.05 between the two groups under the same conditions, #p < 0.05 vs control group). (E) Immunofluorescence staining with Alexa Fluor 488 (green) for α-SMA and Col1A in LX-2 cells, and colocalization with DAPI (blue). (F) Quantification of α-SMA expression. Hypoxia increased α-SMA expression, and this was abolished by HIF-2α and YAP1 downregulation (n = 3; *p < 0.05 between the two groups under the same conditions, #p < 0.05 vs control group). (G) Quantification of Col1a expression. Hypoxia increased Col1A expression, which was abolished by HIF-2α and YAP1 downregulation (n = 3; *p < 0.05 between the two groups under the same conditions, #p < 0.05 vs control group). Scale bar: 50 μm. Similar results were obtained from three independent experiments, and representative photographs are shown in each case. Data are presented as means ± SD (n=3). GLS1, Glutaminase 1; YAP1, Yes-associated protein; HIF-2α, Hypoxia-inducible factor-2α; Col1A, Collagen type I alpha 1; α-SMA, α-smooth muscle actin. ns: No significance.
HIF-2α enhanced activities and myofibroblasts in HSCs by inhibiting YAP phosphorylation
HIF-2α is highly expressed in LX-2 cells in response to chronic hypoxia, promoting glutamine catabolism via the YAP signalling pathway and thus allowing the cells to obtain the energy required for activation, proliferation, and differentiation into myofibroblasts. We observed that, similarly to those in the control group, the YAP fluorescence signal was weakly distributed in the cytoplasm of the cells in the hypoxia (1% O2) group. However, the ratio of YAP1 and p-YAP(S127) exhibited no changes in the YAP knockdown group (Supplementary Figure 8), even after hypoxia. When HIF-2α was experimentally downregulated (Supplementary Figure 9), analysis of the fluorescence signal showed that under hypoxic conditions (1% O2), YAP fluorescence was highly distributed in the cytoplasm of the cells, indicating an increase in p-YAP(S127). However, the region of overlap between the YAP fluorescence signal and DAPI fluorescence was significantly reduced, indicating a reduction in YAP1 levels (Figures 7A, C, D). In addition, the ratios of YAP1 and p-YAP (Ser127) were significantly reduced (Figures 7B, E). These findings imply a mechanism in which HIF-2α upregulation inhibits p-YAP(S127) (Figure 7F). This leads to nuclear translocation of the YAP mRNA, inducing glutaminolysis in HSCs subjected to chronic hypoxia.
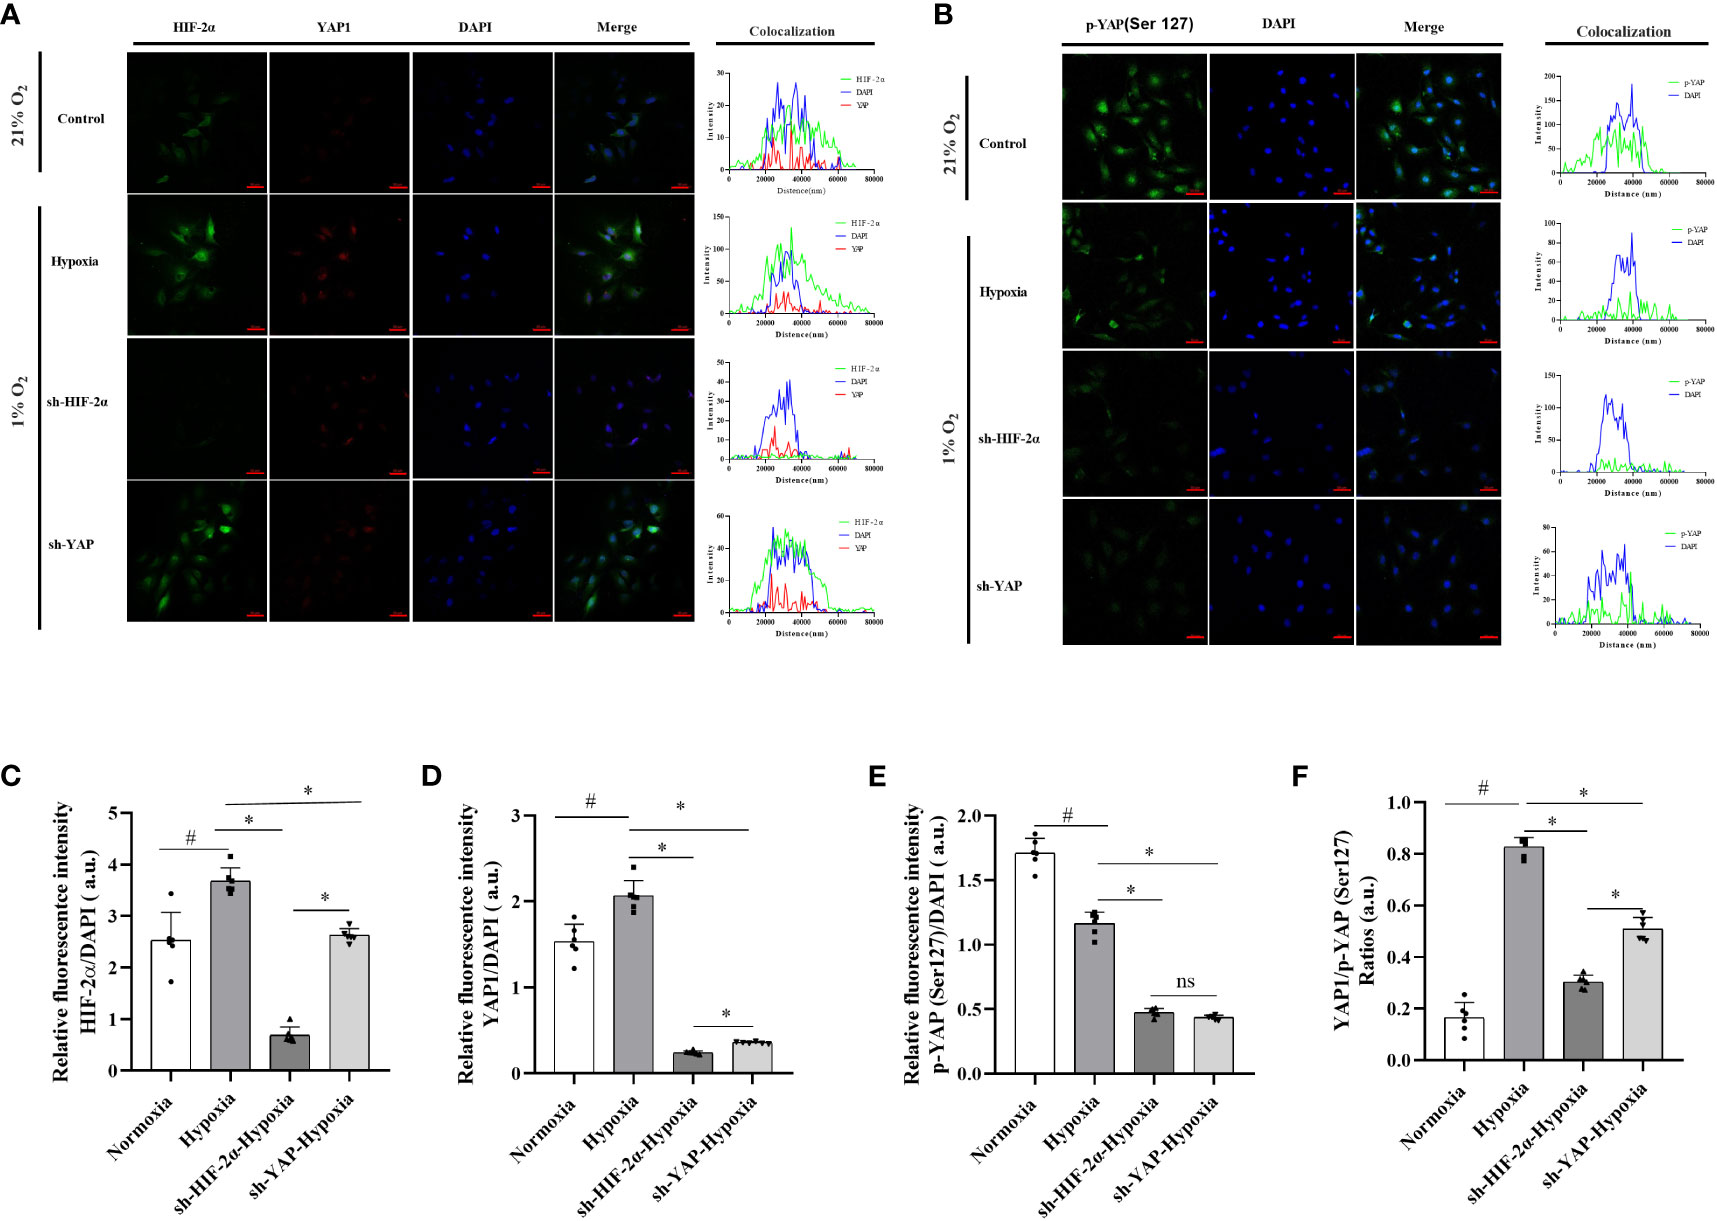
Figure 7 Expression levels and distribution of YAP1 and p-YAP (Ser 127) in LX-2 cells after HIF-2α and YAP1 knockdown. (A) LX-2 cells stained with DAPI to visualise nuclei (blue) and with antibody-conjugated Alexa Fluor 488 or Alexa Fluor 647 to visualise the distribution of HIF-2α (green) and YAP1 (red), respectively. (B) LX-2 cells stained with DAPI to visualise nuclei (blue) and antibody-conjugated Alexa Fluor 488 to visualise the distribution of p-YAP (Ser 127) (green). (C) Quantification of HIF-2α immunofluorescence staining relative to DAPI intensity in LX-2 cells. (D) Quantification of YAP1 immunofluorescence staining relative to DAPI intensity in LX-2 cells. (E) Quantification of p-YAP(S127) immunofluorescence staining relative to DAPI intensity in LX-2 cells. (F) Analysis of immunofluorescence staining intensity ratios between YAP1 and p-YAP (Ser 127). Scale bar: 50 μm. Similar results were obtained from three independent experiments, and representative photographs are shown in each case. Data are presented as means ± SD (n=3). *P<0.05, NS: P>0.05 compared with the same conditions. #P<0.05 compared with the control group. YAP1, Yes-associated protein; p-YAP(S127), Phosphorylated yes-associated protein; HIF-2α, Hypoxia-inducible factor-2α.
Discussion
Hypoxia is associated with the development and progression of NAFLD to NASH (18, 34, 35). However, the underlying mechanisms are unknown. Novel mechanisms through which chronic hypoxia activates HIF-2α, affecting glutamine catabolism in HSC-derived myofibroblasts, that were found in this study include: (1) Direct enhancement of fibrosis by HIF-2α in NASH through increased glutaminolysis; (2) Inhibition of mitochondrial activity in hepatocytes (but enhancement in HSCs) by HIF-2α; (3) Increase in GLS1 expression in HSCs by HIF-2α, mediated through YAP; and (4) Inhibition of p-YAP but enhancement of YAP by HIF-2α, facilitating YAP nuclear transfer, interaction with TAZ, and GLS1 mRNA expression.
The proteins that control NASH progression under chronic hypoxia are unknown. To circumvent the effect of different genetic backgrounds while investigating the potential driving role of chronic hypoxia in NAFLD and NASH progression, we have chosen NAFLD/NASH patients of Han Chinese ethnicity living in altitudes above 2300m as our study population. Exposure to chronic hypoxaemia was confirmed in the participants of our study by their elevated haemoglobin levels (36).
Several studies have revealed that both HIF-1α and HIF-2α (11, 37) control the metabolism of reprogrammed hepatocytes (38, 39). HIF-1α and HIF-2α recognise and bind hypoxia response elements to activate the cellular response to hypoxia. However, HIF-1α and HIF-2α have different structures and expression patterns (40–42). In this study, HIF-2α displayed different expression levels and distribution in hepatic tissue from both patients with NASH and mouse models for NASH subjected to persistent hypoxia, compared with those of HIF-1α. Moreover, treatment with an HIF-2α agonist improved mice with NASH and alleviated fibrotic NASH development. This is because HIF-1a influences angiogenesis and regulates endothelial function in intermittent hypoxia (43, 44) rather than in chronic and persistent hypoxia in fatty liver diseases (45–48). Moreover, HIF-2α is involved in lipid and amino acid metabolism in NAFLD, which may play a pivotal role in disease progression and be a major potential therapeutic target (49). In this study, we also found that HIF-2α was highly expressed in patients and mouse models for NASH exposed to chronic hypoxia. HIF-2α may be recruited to promote collagen and ECM accumulation, and activate HSCs to differentiate into myofibroblasts and thus enhance fibrosis (39, 50). HIF-2α showed fibrosis advances in chronic kidney diseases with chronic hypoxia (51, 52). We observed increased HIF-2α expression in mice with NASH and in LX-2 cell cultures. Identifying whether HIF-2α plays a role in the reprogramming of hepatocyte and HSC metabolism is crucial.
Chen et al. and Evert et al., 1998 revealed heightened l activity of oxidative phosphorylation in the mitochondria of cells cultured in vitro, but not in fibrotic livers in vivo. Moreover, we used TEM and western blot analysis to assess the impact of chronic hypoxia on the mitochondria of LX-2 cells and in mice with NASH. We found decreased mitochondrial numbers, suppressed mitochondrial activity, and decreased mitochondrial membrane potential and ATP production, both in vivo and in vitro, which demonstrates that upregulated HIF-2α significantly inhibits mitochondrial activity. We further investigated ROS production in mitochondria from liver tissue and from those in LX-2 cells. We found that mPTPs in the mitochondrial inner membrane opened more in response to calcium overload in the mitochondrial matrix when HIF-2α was upregulated, and that this effect can be reversed by HIF-2α downregulation in LX-2 cells. Therefore, mPTP opening, decreased mitochondrial activity, and increased ROS production are closely associated with the progression of NAFLD and NASH after HIF-2α upregulation (53, 54).
HSCs contribute to hepatic fibrosis in NAFLD or NASH by becoming activated and differentiating into myofibroblasts, which secrete extracellular matrix (7, 8). This requires additional energy, obtained from central carbon metabolism (9, 10, 55, 56). a-SMA significantly enhances HSC-associated fibrosis and myofibroblast differentiation. Fibrosis, collagen secretion, and differentiation of HSCs into myofibroblasts have been reported to significantly decrease in response to HIF-2α downregulation (57). Therefore, chronic hypoxia significantly exacerbates the progression of NAFLD and NASH by an HIF-2α-induced mechanism of activation and differentiation of HSCs into myofibroblasts.
Determining whether HIF-2α has the same effects on mitochondrial activity in hepatocytes and HSCs would be useful to understand the progression of NAFLD to NASH. We discovered that HIF-2α inhibited mitochondrial ATP production and reduced hepatocyte numbers, while highly increasing ROS production in the mitochondria. However, an increase in mitochondrial respiratory function, including ATP production, has been reported in the case of HSCs (58). ROS are generated in excess by impaired mitochondria and are a key factor on NASH pathogenesis (59–62). Fluorescent detectors have been used to show that ROS levels in the mitochondria are markedly increased under hypoxic conditions (53, 54). In this study, we confirmed that mPTP opening gradually increased according to the degree of fibrosis present in mice with NASH. These findings indicate that hypoxia positively regulates ROS production by inhibiting mitochondrial function (63). Hypoxia suppresses mitochondrial function and induces ROS production in large quantities, which is essential for collagen accumulation and ECM remodelling (64).
Furthermore, we discovered a link between GLS1 overexpression in HSCs and increased ATP production. In particular, we detected that glutamine levels were low in the plasma of the NASH patients, but that it was enriched in glutamate, and that HIF-2α levels in liver tissue were enhanced. Glutamine catabolism may provide the additional energy required by HSCs during chronic hypoxia (28). We found that GLS1 levels increased in both patients and in an animal model for NASH, and that this was dependent on fibrosis, suggesting that GLS1 may enhance glutaminolysis associated with hypoxia-induced HIF-2α (37, 65). Further research using LX-2 cells in vitro could be helpful to understand the relationship between HIF-2α and glutaminolysis.
The metabolic reprogramming that controls HSC activation from a quiescent status in response to changes in the microenvironment has only garnered attention recently (16). We propose that glutamine, as the largest non-essential amino acid present in plasma, could be used to replenish the intermediates of the tricarboxylic acid cycle and thus generate nucleotides and fatty acids. We found increased mitochondrial respiration in zone 3. Moreover, we found increased mitochondrial fusion rather than fission when we assessed morphological changes, which could be attributed to decreased mitochondrial turnover to compensate for oxygen deprivation during hypoxia. Glutamine metabolism, either oxidative or reductive, occurs in mitochondria (66, 67). We found increased expression of GLS1 and GDH, suggesting increased oxidative reactions. HIF-2α may be involved in the activation of the oxidative pathways; however, further experiments are needed to characterise glutaminolysis taking place in the mitochondria. HIF-2α in hypoxic liver tissues increased SNAT expression in the cell membrane of HSCs, prompting more glutamine translocation into the cells (28, 68–70).
We studied HSCs to identify the role of HIF-2α in myofibroblast differentiation leading to NASH. This study found that increased GLS1 expression enhanced HSC glutaminolysis. The molecular pathways regulating glutaminolysis are mostly associated with Hippo and YAP signals; however, no direct evidence exists to verify an interaction between HIF-2α and YAP. Hypoxia also increased YAP levels in the nucleus but decreased those of phosphorylated YAP in the HSC cytosol. HIF-2α may stimulate the Hippo pathway and activate YAP to enhance nuclear translocation and thus upregulate GLS1 mRNA expression. We also found that decreased YAP levels did not change a-SMA levels without affecting HIF-2α expression, which indicates that YAP-induced glutaminolysis is HIF-2α-dependent, and HIF-2α regulates YAP expression and decreases p-YAP(S127) levels in HSCs. Moreover, we found that HIF-2α inhibited YAP phosphorylation at serine 127, which was consistently identified by genetic HIF-2α knock-out mice, to suppress hepatocellular carcinoma invasion and proliferation by inhibiting YAP through AKT activation (71). This is supported by the presence of the adhesive junction protein α-catenin in YAP serine 127 (72, 73), which can be phosphorylated by LAS T1/2, Hippo signal proteins, and recruited E3 ubiquitin ligases, leading to YAP/TAZ degradation and reduced nuclear translocation. HIF2α upregulates GLS1 expression and is involved in glutaminolysis. Our research results show that targeting HIF-2α regulation may serve as a new approach to alleviate hypoxic stress, interfere with the YAP signalling pathways, and prevent fibrosis progression in NAFLD.
However, our study does have some limitations, including limited clinical data, which underscores the need to increase the number of tissue samples. The exposure to hypoxia that the experimental animals were subjected to may not accurately reflect the specific hypoxia conditions affecting liver tissue, and gene manipulation may be required for in vivo validation. Despite the fact that three different animal models in our study, each of these models only partially represent the disease features of NAFLD and NASH, and thus cannot fully mirror all manifestations of these diseases. Moreover, it has been recently reported that circadian rhythm (74) and the endocrine system (75), are also involved in this phenomenon. This research focused only on HIF proteins involved in the hypoxia signalling pathway. Additionally, while glutamine catabolism is the main energy source for the myofibroblasts derived from HSCs in chronic liver disease, this study only considered the Hippo-YAP pathway, without conducting an omics analysis. Lastly, the use of the LX-2 cell line for the in vitro studies might not perfectly reflect the actual in vivo microenvironment of liver tissue.
Conclusion
In summary, we found that HIF-2α enhances glutamine catabolism in myofibroblasts derived from HSCs and inhibits YAP phosphorylation, promoting fibrosis in NAFLD. Moreover, we have found that this pathway might serve as a potential target for interventions aimed at preventing the progression of NAFLD to NASH.
Data availability statement
The original contributions presented in the study are included in the article/Supplementary Material. Further inquiries can be directed to the corresponding authors.
Ethics statement
Ethical approval was not required for the studies on humans in accordance with the local legislation and institutional requirements because only commercially available established cell lines were used. The animal study was approved by Ethics Committee of the Medical College of Qinghai University. The study was conducted in accordance with the local legislation and institutional requirements.
Author contributions
RY: Data curation, Methodology, Formal analysis, Investigation, Visualizaion, Software, Writing - review & editing. HC and XZ: Resources, Writing - review & editing. GB: Validation, Writing - review & editing. ZB: Data curation, Methodology, Supervision, Conceptualization, Formal analysis, Project administration, Validation, Funding acquisition, Visualizaion, Software, Writing - original draft. RG: Supervision, Writing - review & editing.
Funding
The author(s) declare financial support was received for the research, authorship, and/or publication of this article. This work was supported by Applied and Basic Science Program, Department of Science and Technology, Qinghai Province, China (2020-ZJ-721). Qinghai Innovative and Talented Program in 2022 to Bai. National Natural Science Foundation of China (No. 82072107). Laboratory for High Altitude Medicine of Qinghai Province, and Key Laboratory of Application and Foundation for High Altitude Medicine Research in Qinghai Province (Qinghai-Utah Joint Research Key Lab for High Altitude Medicine), Qinghai University (No.2023-KF-2).
Acknowledgments
We would like to thank the Department of Pathology at Qinghai University, Chengdu Lilai Company for their transmission electron microscopy and imaging (No.20210811-20163), and Wuhan Servicebio Company for their immunostaining and imaging (No.SWR00213348). We also would like to thank the Shanghai Bioprofile Technology Company Ltd. for providing us with LC-MS/MS analysis (No. BP20231280).
Conflict of interest
The authors declare that the research was conducted in the absence of any commercial or financial relationships that could be construed as a potential conflict of interest.
Publisher’s note
All claims expressed in this article are solely those of the authors and do not necessarily represent those of their affiliated organizations, or those of the publisher, the editors and the reviewers. Any product that may be evaluated in this article, or claim that may be made by its manufacturer, is not guaranteed or endorsed by the publisher.
Supplementary material
The Supplementary Material for this article can be found online at: https://www.frontiersin.org/articles/10.3389/fendo.2024.1344971/full#supplementary-material
References
1. Estes C, Anstee QM, Arias-Loste MT, Bantel H, Bellentani S, Caballeria J, et al. Modeling NAFLD disease burden in China, France, Germany, Italy, Japan, Spain, United Kingdom, and United States for the period 2016-2030. J Hepatol (2018) 69(4):896–904. doi: 10.1016/j.jhep.2018.05.036
2. Younossi ZM. Non-alcoholic fatty liver disease - A global public health perspective. J Hepatol (2019) 70(3):531–44. doi: 10.1016/j.jhep.2018.10.033
3. Huang DQ, El-Serag HB, Loomba R. Global epidemiology of NAFLD-related HCC: trends, predictions, risk factors and prevention. Nat Rev Gastroenterol Hepatol (2021) 18(4):223–38. doi: 10.1038/s41575-020-00381-6
4. Kuchay MS, Choudhary NS, Mishra SK. Pathophysiological mechanisms underlying MAFLD. Diabetes Metab Syndr (2020) 14(6):1875–87. doi: 10.1016/j.dsx.2020.09.026
5. James OF, Day CP. Non-alcoholic steatohepatitis (NASH): a disease of emerging identity and importance. J Hepatol (1998) 29(3):495–501. doi: 10.1016/S0168-8278(98)80073-1
6. Angulo P, MaChado MV, Diehl AM. Fibrosis in nonalcoholic Fatty liver disease: mechanisms and clinical implications. Semin Liver Dis (2015) 35(2):132–45. doi: 10.1055/s-0035-1550065
7. Xiang DM, Sun W, Ning BF, Zhou TF, Li XF, Zhong W, et al. The HLF/IL-6/STAT3 feedforward circuit drives hepatic stellate cell activation to promote liver fibrosis. Gut (2018) 67(9):1704–15. doi: 10.1136/gutjnl-2016-313392
8. Yuan S, Wei C, Liu G, Zhang L, Li J, Li L, et al. Sorafenib attenuates liver fibrosis by triggering hepatic stellate cell ferroptosis via HIF-1alpha/SLC7A11 pathway. Cell Prolif (2022) 55(1):e13158. doi: 10.1111/cpr.13158
9. Ibar C, Irvine KD. Integration of hippo-YAP signaling with metabolism. Dev Cell (2020) 54(2):256–67. doi: 10.1016/j.devcel.2020.06.025
10. Du K, Maeso-Diaz R, Oh SH, Wang E, Chen T, Pan C, et al. Targeting YAP-mediated HSC death susceptibility and senescence for treatment of liver fibrosis. Hepatology (2023) 77(6):1998–2015. doi: 10.1097/HEP.0000000000000326
11. Yuneva MO, Fan TW, Allen TD, Higashi RM, Ferraris DV, Tsukamoto T, et al. The metabolic profile of tumors depends on both the responsible genetic lesion and tissue type. Cell Metab (2012) 15(2):157–70. doi: 10.1016/j.cmet.2011.12.015
12. Aron-Wisnewsky J, Minville C, Tordjman J, Levy P, Bouillot JL, Basdevant A, et al. Chronic intermittent hypoxia is a major trigger for non-alcoholic fatty liver disease in morbid obese. J Hepatol (2012) 56(1):225–33. doi: 10.1016/j.jhep.2011.04.022
13. Schwenger KJP, Ghorbani Y, Li C, Fischer SE, Jackson TD, Okrainec A, et al. Obstructive sleep apnea and non-alcoholic fatty liver disease in obese patients undergoing bariatric surgery. Obes Surg (2020) 30(7):2572–8. doi: 10.1007/s11695-020-04514-3
14. Yeghiazarians Y, Jneid H, Tietjens JR, Redline S, Brown DL, El-Sherif N, et al. Obstructive sleep apnea and cardiovascular disease: A scientific statement from the american heart association. Circulation (2021) 144(3):e56–67. doi: 10.1161/CIR.0000000000000988
15. Gottlieb DJ, Punjabi NM. Diagnosis and management of obstructive sleep apnea: A review. JAMA (2020) 323(14):1389–400. doi: 10.1001/jama.2020.3514
16. Du K, Hyun J, Premont RT, Choi SS, Michelotti GA, Swiderska-Syn M. Hedgehog-YAP signaling pathway regulates glutaminolysis to control activation of hepatic stellate cells. Gastroenterology (2018) 154(5):1465–79.e13. doi: 10.1053/j.gastro.2017.12.022
17. Chen J, Chen J, Huang J, Li Z, Gong Y, Zou B, et al. HIF-2alpha upregulation mediated by hypoxia promotes NAFLD-HCC progression by activating lipid synthesis via the PI3K-AKT-mTOR pathway. Aging (Albany NY) (2019) 11(23):10839–60. doi: 10.18632/aging.102488
18. Chen J, Chen J, Fu H, Li Y, Wang L, Luo S, et al. Hypoxia exacerbates nonalcoholic fatty liver disease via the HIF-2alpha/PPARalpha pathway. Am J Physiol Endocrinol Metab (2019) 317(4):E710–E22. doi: 10.1152/ajpendo.00052.2019
19. Cai H, Bai Z, Ge RL. Hypoxia-inducible factor-2 promotes liver fibrosis in non-alcoholic steatohepatitis liver disease via the NF-kappaB signalling pathway. Biochem Biophys Res Commun (2021) 540:67–74. doi: 10.1016/j.bbrc.2021.01.002
20. Moya IM, Halder G. Hippo-YAP/TAZ signalling in organ regeneration and regenerative medicine. Nat Rev Mol Cell Biol (2019) 20(4):211–26. doi: 10.1038/s41580-018-0086-y
21. Driskill JH, Pan D. The hippo pathway in liver homeostasis and pathophysiology. Annu Rev Pathol (2021) 16:299–322. doi: 10.1146/annurev-pathol-030420-105050
22. Bertero T, Oldham WM, Cottrill KA, Pisano S, Vanderpool RR, Yu Q, et al. Vascular stiffness mechanoactivates YAP/TAZ-dependent glutaminolysis to drive pulmonary hypertension. J Clin Invest (2016) 126(9):3313–35. doi: 10.1172/JCI86387
23. Swiderska-Syn M, Xie G, Michelotti GA, Jewell ML, Premont RT, Syn WK, et al. Hedgehog regulates yes-associated protein 1 in regenerating mouse liver. Hepatology (2016) 64(1):232–44. doi: 10.1002/hep.28542
24. Park YY, Sohn BH, Johnson RL, Kang MH, Kim SB, Shim JJ, et al. Yes-associated protein 1 and transcriptional coactivator with PDZ-binding motif activate the mammalian target of rapamycin complex 1 pathway by regulating amino acid transporters in hepatocellular carcinoma. Hepatology (2016) 63(1):159–72. doi: 10.1002/hep.28223
25. Edwards DN, Ngwa VM, Wang S, Shiuan E, Brantley-Sieders DM, Kim LC, et al. The receptor tyrosine kinase EphA2 promotes glutamine metabolism in tumors by activating the transcriptional coactivators YAP and TAZ. Sci Signal (2017) 10(508). doi: 10.1126/scisignal.aan4667
26. Ma B, Chen Y, Chen L, Cheng H, Mu C, Li J, et al. Hypoxia regulates Hippo signalling through the SIAH2 ubiquitin E3 ligase. Nat Cell Biol (2015) 17(1):95–103. doi: 10.1038/ncb3073
27. Dai XY, Zhuang LH, Wang DD, Zhou TY, Chang LL, Gai RH, et al. Nuclear translocation and activation of YAP by hypoxia contributes to the chemoresistance of SN38 in hepatocellular carcinoma cells. Oncotarget (2016) 7(6):6933–47. doi: 10.18632/oncotarget.6903
28. Perez-Escuredo J, Dadhich RK, Dhup S, Cacace A, Van Hee VF, De Saedeleer CJ, et al. Lactate promotes glutamine uptake and metabolism in oxidative cancer cells. Cell Cycle (2016) 15(1):72–83. doi: 10.1080/15384101.2015.1120930
29. Leon-Velarde F, Maggiorini M, Reeves JT, Aldashev A, Asmus I, Bernardi L, et al. Consensus statement on chronic and subacute high altitude diseases. High Alt Med Biol (2005) 6(2):147–57. doi: 10.1089/ham.2005.6.147
30. Parlati L, Regnier M, Guillou H, Postic C. New targets for NAFLD. JHEP Rep (2021) 3(6):100346. doi: 10.1016/j.jhepr.2021.100346
31. Li X, Wang TX, Huang X, Li Y, Sun T, Zang S, et al. Targeting ferroptosis alleviates methionine-choline deficient (MCD)-diet induced NASH by suppressing liver lipotoxicity. Liver Int (2020) 40(6):1378–94. doi: 10.1111/liv.14428
32. Finlon JM, Burchill MA, Tamburini BAJ. Digestion of the murine liver for a flow cytometric analysis of lymphatic endothelial cells. J Vis Exp (2019) 143. doi: 10.3791/58621
33. Xu L, Hui AY, Albanis E, Arthur MJ, O'Byrne SM, Blaner WS, et al. Human hepatic stellate cell lines, LX-1 and LX-2: new tools for analysis of hepatic fibrosis. Gut (2005) 54(1):142–51. doi: 10.1136/gut.2004.042127
34. Gonzalez FJ, Xie C, Jiang C. The role of hypoxia-inducible factors in metabolic diseases. Nat Rev Endocrinol (2018) 15(1):21–32. doi: 10.1038/s41574-018-0096-z
35. Isaza SC, Del Pozo-Maroto E, Dominguez-Alcon L, Elbouayadi L, Gonzalez-Rodriguez A, Garcia-Monzon C. Hypoxia and non-alcoholic fatty liver disease. Front Med (Lausanne) (2020) 7:578001. doi: 10.3389/fmed.2020.578001
36. Prevalence of nonalcoholic fatty liver disease in soldiers in Nakchu prefecture of Tibet. Medical Journal of National Defending Forces in Southwest China (2012) 22(10):1153–5.
37. Zhou S, Xie J, Yu C, Feng Z, Cheng K, Ma J, et al. CD226 deficiency promotes glutaminolysis and alleviates mitochondria damage in vascular endothelial cells under hemorrhagic shock. FASEB J (2021) 35(11):e21998. doi: 10.1096/fj.202101134R
38. Arai T, Tanaka M, Goda N. HIF-1-dependent lipin1 induction prevents excessive lipid accumulation in choline-deficient diet-induced fatty liver. Sci Rep (2018) 8(1):14230. doi: 10.1038/s41598-018-32586-w
39. Morello E, Sutti S, Foglia B, Novo E, Cannito S, Bocca C, et al. Hypoxia-inducible factor 2alpha drives nonalcoholic fatty liver progression by triggering hepatocyte release of histidine-rich glycoprotein. Hepatology (2018) 67(6):2196–214. doi: 10.1002/hep.29754
40. Ullah K, Ai L, Humayun Z, Wu R. Targeting endothelial HIF2alpha/ARNT expression for ischemic heart disease therapy. Biol (Basel) (2023) 12(7). doi: 10.3390/biology12070995
41. From the American Association of Neurological Surgeons ASoNC, Interventional Radiology Society of Europe CIRACoNSESoMINTESoNESOSfCA, Interventions SoIRSoNS, World Stroke O, Sacks D, Baxter B, et al. Multisociety consensus quality improvement revised consensus statement for endovascular therapy of acute ischemic stroke. Int J Stroke (2018) 13(6):612–32. doi: 10.1177/1747493018778713
42. Hamidian A, von Stedingk K, Munksgaard Thoren M, Mohlin S, Pahlman S. Differential regulation of HIF-1alpha and HIF-2alpha in neuroblastoma: Estrogen-related receptor alpha (ERRalpha) regulates HIF2A transcription and correlates to poor outcome. Biochem Biophys Res Commun (2015) 461(3):560–7. doi: 10.1016/j.bbrc.2015.04.083
43. Han J, He Y, Zhao H, Xu X. Hypoxia inducible factor-1 promotes liver fibrosis in nonalcoholic fatty liver disease by activating PTEN/p65 signaling pathway. J Cell Biochem (2019) 120(9):14735–44. doi: 10.1002/jcb.28734
44. Mesarwi OA, Moya EA, Zhen X, Gautane M, Zhao H, Wegbrans Giro P, et al. Hepatocyte HIF-1 and intermittent hypoxia independently impact liver fibrosis in murine nonalcoholic fatty liver disease. Am J Respir Cell Mol Biol (2021) 65(4):390–402. doi: 10.1165/rcmb.2020-0492OC
45. Ebersole JL, Novak MJ, Orraca L, Martinez-Gonzalez J, Kirakodu S, Chen KC, et al. Hypoxia-inducible transcription factors, HIF1A and HIF2A, increase in aging mucosal tissues. Immunology (2018) 154(3):452–64. doi: 10.1111/imm.12894
46. Dickson I. NAFLD: HIF2alpha: a new therapeutic target for NAFLD. Nat Rev Gastroenterol Hepatol (2017) 14(12):690–1. doi: 10.1038/nrgastro.2017.148
47. Wu MF, Zhang GD, Liu TT, Shen JH, Cheng JL, Shen J, et al. Hif-2alpha regulates lipid metabolism in alcoholic fatty liver disease through mitophagy. Cell Biosci (2022) 12(1):198. doi: 10.1186/s13578-022-00889-1
48. Elorza A, Soro-Arnaiz I, Melendez-Rodriguez F, Rodriguez-Vaello V, Marsboom G, de Carcer G, et al. HIF2alpha acts as an mTORC1 activator through the amino acid carrier SLC7A5. Mol Cell (2012) 48(5):681–91. doi: 10.1016/j.molcel.2012.09.017
49. Claveria-Cabello A, Avila MA. HIF2alpha activation in NASH: A new force pushing toward HCC. Cell Mol Gastroenterol Hepatol (2022) 13(2):678–80. doi: 10.1016/j.jcmgh.2021.11.005
50. Seki E, Schwabe RF. Hepatic inflammation and fibrosis: functional links and key pathways. Hepatology (2015) 61(3):1066–79. doi: 10.1002/hep.27332
51. Pan SY, Tsai PZ, Chou YH, Chang YT, Chang FC, Chiu YL, et al. Kidney pericyte hypoxia-inducible factor regulates erythropoiesis but not kidney fibrosis. Kidney Int (2021) 99(6):1354–68. doi: 10.1016/j.kint.2021.01.017
52. Packer M. Mechanisms leading to differential hypoxia-inducible factor signaling in the diabetic kidney: modulation by SGLT2 inhibitors and hypoxia mimetics. Am J Kidney Dis (2021) 77(2):280–6. doi: 10.1053/j.ajkd.2020.04.016
53. Li HX, Lin J, Jiang B, Yang XJ. Wnt11 preserves mitochondrial membrane potential and protects cardiomyocytes against hypoxia through paracrine signaling. J Cell Biochem (2020) 121(2):1144–55. doi: 10.1002/jcb.29349
54. Yin X, Zheng F, Pan Q, Zhang S, Yu D, Xu Z, et al. Glucose fluctuation increased hepatocyte apoptosis under lipotoxicity and the involvement of mitochondrial permeability transition opening. J Mol Endocrinol (2015) 55(3):169–81. doi: 10.1530/JME-15-0101
55. Wang F, Chen L, Zhang B, Li Z, Shen M, Tang L, et al. O-glcNAcylation coordinates glutaminolysis by regulating the stability and membrane trafficking of ASCT2 in hepatic stellate cells. J Clin Transl Hepatol (2022) 10(6):1107–16. doi: 10.14218/JCTH.2021.00413
56. Lu W, Pelicano H, Huang P. Cancer metabolism: is glutamine sweeter than glucose? Cancer Cell (2010) 18(3):199–200. doi: 10.1016/j.ccr.2010.08.017
57. Qu A, Taylor M, Xue X, Matsubara T, Metzger D, Chambon P, et al. Hypoxia-inducible transcription factor 2alpha promotes steatohepatitis through augmenting lipid accumulation, inflammation, and fibrosis. Hepatology (2011) 54(2):472–83. doi: 10.1002/hep.24400
58. Du D, Liu C, Qin M, Zhang X, Xi T, Yuan S, et al. Metabolic dysregulation and emerging therapeutical targets for hepatocellular carcinoma. Acta Pharm Sin B (2022) 12(2):558–80. doi: 10.1016/j.apsb.2021.09.019
59. Pirola CJ, Garaycoechea M, Flichman D, Castano GO, Sookoian S. Liver mitochondrial DNA damage and genetic variability of Cytochrome b - a key component of the respirasome - drive the severity of fatty liver disease. J Intern Med (2021) 289(1):84–96. doi: 10.1111/joim.13147
60. Simoes ICM, Amorim R, Teixeira J, Karkucinska-Wieckowska A, Carvalho A, Pereira SP, et al. The alterations of mitochondrial function during NAFLD progression-an independent effect of mitochondrial ROS production. Int J Mol Sci (2021) 22(13). doi: 10.3390/ijms22136848
61. Putker M, O'Neill JS. Reciprocal control of the circadian clock and cellular redox state - a critical appraisal. Mol Cells (2016) 39(1):6–19. doi: 10.14348/molcells.2016.2323
62. Mezhnina V, Ebeigbe OP, Poe A, Kondratov RV. Circadian control of mitochondria in reactive oxygen species homeostasis. Antioxid Redox Signal (2022) 37(10-12):647–63. doi: 10.1089/ars.2021.0274
63. Wang Q, Wang P, Qin Z, Yang X, Pan B, Nie F, et al. Altered glucose metabolism and cell function in keloid fibroblasts under hypoxia. Redox Biol (2021) 38:101815. doi: 10.1016/j.redox.2020.101815
64. Bernard M, Yang B, Migneault F, Turgeon J, Dieude M, Olivier MA, et al. Autophagy drives fibroblast senescence through MTORC2 regulation. Autophagy (2020) 16(11):2004–16. doi: 10.1080/15548627.2020.1713640
65. Corbet C, Draoui N, Polet F, Pinto A, Drozak X, Riant O, et al. The SIRT1/HIF2alpha axis drives reductive glutamine metabolism under chronic acidosis and alters tumor response to therapy. Cancer Res (2014) 74(19):5507–19. doi: 10.1158/0008-5472.CAN-14-0705
66. Yoo HC, Yu YC, Sung Y, Han JM. Glutamine reliance in cell metabolism. Exp Mol Med (2020) 52(9):1496–516. doi: 10.1038/s12276-020-00504-8
67. Mota M, Banini BA, Cazanave SC, Sanyal AJ. Molecular mechanisms of lipotoxicity and glucotoxicity in nonalcoholic fatty liver disease. Metabolism (2016) 65(8):1049–61. doi: 10.1016/j.metabol.2016.02.014
68. Fike CD, Sidoryk-Wegrzynowicz M, Aschner M, Summar M, Prince LS, Cunningham G, et al. Prolonged hypoxia augments L-citrulline transport by system A in the newborn piglet pulmonary circulation. Cardiovasc Res (2012) 95(3):375–84. doi: 10.1093/cvr/cvs186
69. Yoo HC, Park SJ, Nam M, Kang J, Kim K, Yeo JH, et al. A variant of SLC1A5 is a mitochondrial glutamine transporter for metabolic reprogramming in cancer cells. Cell Metab (2020) 31(2):267–83.e12. doi: 10.1016/j.cmet.2019.11.020
70. Yu D, Shi X, Meng G, Chen J, Yan C, Jiang Y, et al. Kidney-type glutaminase (GLS1) is a biomarker for pathologic diagnosis and prognosis of hepatocellular carcinoma. Oncotarget (2015) 6(10):7619–31. doi: 10.18632/oncotarget.3196
71. Foglia B, Sutti S, Cannito S, Rosso C, Maggiora M, Autelli R, et al. Hepatocyte-specific deletion of HIF2alpha prevents NASH-related liver carcinogenesis by decreasing cancer cell proliferation. Cell Mol Gastroenterol Hepatol (2022) 13(2):459–82. doi: 10.1016/j.jcmgh.2021.10.002
72. Yu FX, Zhao B, Guan KL. Hippo pathway in organ size control, tissue homeostasis, and cancer. Cell (2015) 163(4):811–28. doi: 10.1016/j.cell.2015.10.044
73. Schlegelmilch K, Mohseni M, Kirak O, Pruszak J, Rodriguez JR, Zhou D, et al. Yap1 acts downstream of alpha-catenin to control epidermal proliferation. Cell (2011) 144(5):782–95. doi: 10.1016/j.cell.2011.02.031
74. Gnocchi D, Custodero C, Sabba C, Mazzocca A. Circadian rhythms: a possible new player in non-alcoholic fatty liver disease pathophysiology. J Mol Med (Berl) (2019) 97(6):741–59. doi: 10.1007/s00109-019-01780-2
Keywords: NAFLD/NASH, hepatic stellate cells-derived myofibroblasts, glutaminolysis, HIF-2α, YAP/p-YAP
Citation: Yan R, Cai H, Zhou X, Bao G, Bai Z and Ge R-l (2024) Hypoxia-inducible factor-2α promotes fibrosis in non-alcoholic fatty liver disease by enhancing glutamine catabolism and inhibiting yes-associated protein phosphorylation in hepatic stellate cells. Front. Endocrinol. 15:1344971. doi: 10.3389/fendo.2024.1344971
Received: 27 November 2023; Accepted: 25 January 2024;
Published: 28 February 2024.
Edited by:
Uma Shanker Navik, Central University of Punjab, IndiaReviewed by:
Sang R. Lee, Sovargen, Republic of KoreaÁgueda González Rodríguez, Princess University Hospital, Spain
Davide Gnocchi, University of Bari Aldo Moro, Italy
Copyright © 2024 Yan, Cai, Zhou, Bao, Bai and Ge. This is an open-access article distributed under the terms of the Creative Commons Attribution License (CC BY). The use, distribution or reproduction in other forums is permitted, provided the original author(s) and the copyright owner(s) are credited and that the original publication in this journal is cited, in accordance with accepted academic practice. No use, distribution or reproduction is permitted which does not comply with these terms.
*Correspondence: Ri-li Ge, Z2VyaWxpZ2FvQGhvdG1haWwuY29t; Zhenzhong Bai, dGliZXRhbm5hbmthQGhvdG1haWwuY29t