 Lijing Yan1
 Peijie Li
- 1Department of Endocrinology, The Second Affiliated Hospital of Xi ‘an Jiaotong University, Xi’an, China
- 2Department of Gastroenterology, The First Affiliated Hospital of Xi’an Jiaotong University, Xi’an, China
- 3Department of Respiratory Medicine, The First Affiliated Hospital of Xi ‘an Jiaotong University, Xi’an, China
Introduction: The aim of this study was to investigate the relationship between obesity and the accelerated decline in Total Sleep Time (TST) and its potential impact on the self-reported diagnoses of diabetes.
Methods: Our study addresses this gap by analyzing trends in a longitudinal cohort study conducted in China, using data from the China Health and Nutrition Survey (CHNS). Employing a joint model, inter-individual variability and intra-individual variability in TST, and its impact on self-reported diagnoses of diabetes were considered.
Results: Our findings reveal that self-reported diagnoses of diabetes prevalence in China rose from 1.10% in 2004 to 3.06% in 2015, accompanied by a decrease in average TST from 8.12 to 7.80. With age, TST decreased by 0.01 per year. Among coffee or tea consumers, it decreased by 0.03, while alcohol users saw a decrease of 0.07. The obese group experienced a decrease of 0.05, the overweight group 0.03, and the normal weight group 0.01. Each 1-hour decrease in TST was associated with a substantial 3.61-fold increase in self-reported diagnoses of diabetes risk (95% CI: 2.92-4.44). Specifically, individuals with a higher baseline TST tend to experience smaller changes over time, whereas those with a lower baseline TST tend to experience larger changes.
Discussion: For the obese, TST decreases at an accelerated rate which contributes to the risk of self-reported diagnoses of diabetes. The findings underscore the role of sleep loss in diabetes risk, with implications for public policy. Future research and interventions should emphasise the impact of sleep management, particularly on obesity and metabolic health, to develop more effective prevention and treatment strategies.
1 Introduction
A lack of sleep has become a common aspect of modern lifestyles (1). Extensive studies on the link between sleep deprivation and cardiovascular disease or mortality have classified sleep deprivation as an epidemic in some countries (2–4).However, there is still ongoing debate regarding the role of TST in causing diabetes (5). It has been established that the development of diabetes mellitus is influenced by a combination of genetic and environmental factors. Obese individuals and those with a family history of insulin sensitivity experience more erratic insulin sensitivity, and it is believed that sleep plays a role in this interaction. A Dutch study conducted on overweight and obese adolescents revealed that lower TST was associated with increased insulin sensitivity, particularly among those with a family history of non-insulin-dependent diabetes mellitus (6). Some experts argue that lack of sleep can affect blood sugar levels but may not necessarily lead to diabetes. Although in some studies, TST was recorded by some objective measures. Actigraphy has replaced Polysomnography (PSG) as the dominant tool in the study of sleep today. For studies with large populations, subjective sleep is still predominantly used due to the inaccessibility of equipment (Actigraphy or PSG). The existence of differences between subjective and objective sleep is then a matter of debate among scholars (7, 8). Several researches have now concluded that the objective TST results do not deviate from self-declared TST by more than half an hour, and the correlation coefficient between the two is 0.70 (9, 10). It appears that the credibility of self-reported remains acceptable, especially for large cohort studies in medically deprived areas (2, 11).
Given that early symptoms of diabetes are not readily apparent, blood testing is currently the only means available to identify and diagnose the condition. Consequently, early detection and screening for diabetes pose significant challenges. In epidemiological surveys, self-reported has emerged as a cost-effective approach with a high participation rate. Previous studies have confirmed the consistency between self-reports, drug utilization patterns, and medical records (12). Self-reported diagnoses of diabetes refers to patients being identified and informed of their condition by physicians using established diabetes diagnosis guidelines. While self-reported diagnoses of diabetes lacks objective measurement, it serves as a relatively reliable indicator of regional disparities in diabetes prevalence and undiagnosed cases, particularly in low- and middle-income areas where access to blood glucose testing and diagnosis is limited. It is worth noting that self-reported diagnoses of diabetes may underestimate the true prevalence due to the high occurrence of undiagnosed diabetes, but it remains a valid tool (13, 14). Furthermore, compared to other chronic diseases, self-reported diagnoses of diabetes exhibits the highest sensitivity and specificity (kappa: 0.84-0.76) (15). Its utilization in research is particularly advantageous in resource-constrained settings of low-income countries. Despite the limitations imposed by limited clinic access, self-reported diagnoses of diabetes generally aligns with the expected trends in the onset of diabetes. Moreover, when accurate data on the undiagnosed rate is unavailable, self-reported diagnoses of diabetes can serve as a corroborating indicator.
There is no consensus on the causal relationship between sleep duration and obesity in academic circles. Indian scholars have discovered that the risk of obesity or overweight in adults is associated with a short sleep duration (16). In pre-adolescent populations, scholars in Hong Kong reach similar conclusions (17). There is some modest evidence of a bilateral relationship. In a prospective study on middle-aged adults in the UK, prolonged sleep was associated with low BMI, while high BMI exacerbated shortened TST (18). Similarly, a US study found that sleep variability influenced adolescent obesity and cardiometabolic health (19). The majority of these studies focused on the average TST for the population and segmented it into various intervals, disregarding the differences between and within individuals. TST is influenced by factors such as gender and ethnicity, as it varies in levels between individuals (20–22). Within person level can change dramatically based on time, age, tobacco, alcohol, caffeine consumption, and weight status.
Sleep deprivation, obesity, and diabetes are significant public health concerns in today’s society (23). Obesity is widely recognized by the public as a risk factor for diabetes. It makes it impossible to ignore obesity and overweight as a factor in the study of the effect of TST on the survival of diabetes mellitus. So our study focuses on both the timing of self-reported diagnoses of diabetes and the possible longitudinal trajectory of change in the relationship between TST and weight status. To compensate for inefficiencies or biased results in separate analyses. We utilized a joint model of longitudinal and survival time outcomes to reveal the relationship.
2 Materials and methods
2.1 Study population
The CHNS is a stratified probability cohort study of the Chinese population that utilized a multistage, random cluster sampling strategy. It encompassed urban and rural areas in over 20 provinces and cities within China and included 15 ethnic groups, such as Man, Miao, Buyi, Tujia, and others. During the first stage of sampling, 2 cities and 4 counties were chosen in each province. In the second stage, a random selection of 2 urban and 2 suburban communities was conducted in each chosen city. In the third stage, a capital community and three rural villages were randomly selected in each chosen county, and 20 random families in each community were recruited. The CHNS commenced in 1989 and was tracked over nine waves in 1991, 1993, 1997, 2000, 2004, 2006, 2009, 2011, and 2015, with a survey population of almost 40,000 individuals overall. More information about the design, objectives, and survey methodology can be found on the CNHS homepage (https://www.cpc.unc.edu/projects/china). Since the earlier questionnaire did not have questions about sleep, our study was set to cover 2004 to 2015.
Our study enrolled participants who were between 18 and 65 years of age and completed questionnaires regarding their TST and diabetes diagnosis. Since the CHNS was conducted at different times, there were constantly new enrolled attendees and participants who were lost of follow-up. We conducted a current prevalence analysis with different time perspectives as cross-sectional data (as shown in Table 1). This dataset incorporates both survival data and longitudinal data traits. To compensate for the inefficiency of separate analyses or biased results, we conducted joint modeling of the two data types in order to explore their relevance. As shown in Supplementary Figure S1. We modeled the longitudinal measurements using linear mixed effects models and the survival data using the Cox proportional hazards model. Furthermore, we built a joint model to further analyze the dependencies and degree of association.
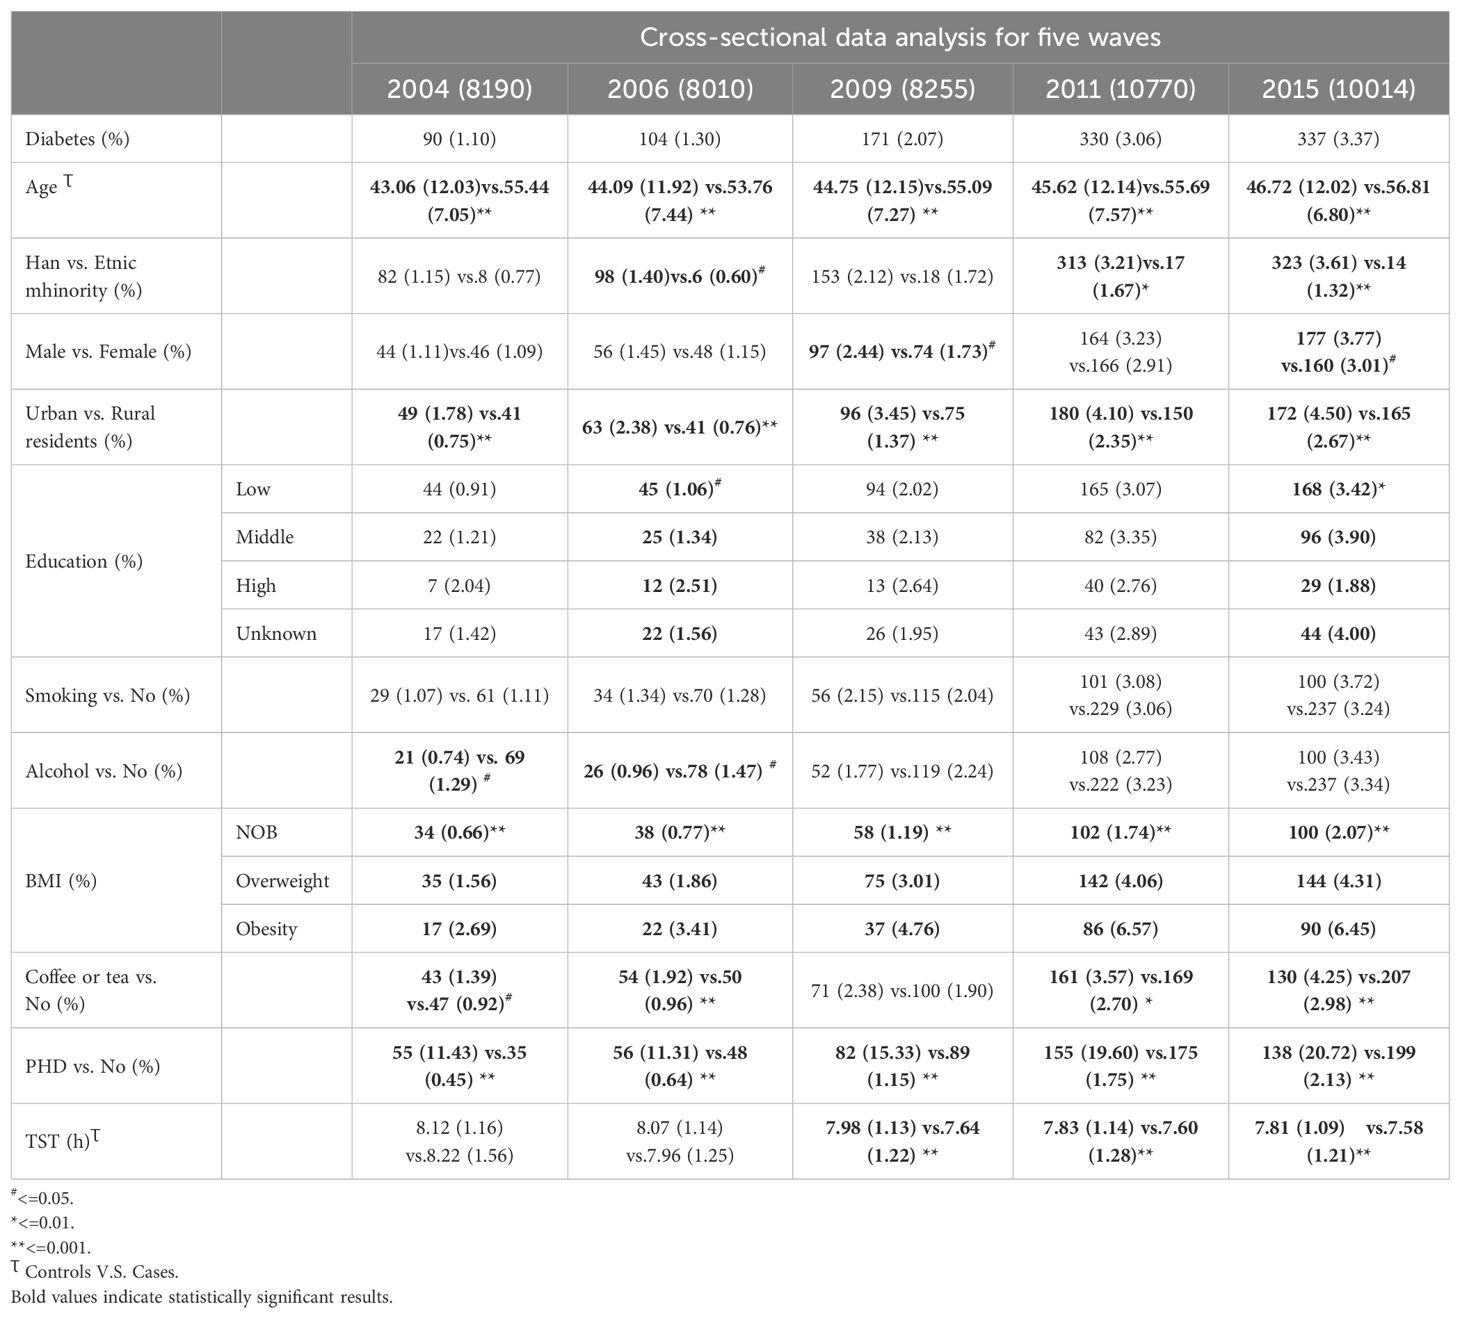
Table 1. Prevalence of self-reported diabetes in cross-sectional study.
2.2 Outcomes and covariates
In this study, data on TST were collected from the CHNS Standard Questionnaire, which included the question, “How many hours each day do you usually sleep, including daytime and nighttime?” Participants were instructed to record their answers in hours.
To assess self-reported diagnoses of diabetes, the CHNS Standard Questionnaire was utilized, which included the question, “Has a doctor ever told you that you suffer from diabetes?” Those who responded affirmatively were classified as diabetic, while those who responded with unknown or no were classified as non-diabetic. We calculated Body Mass Index (BMI) by dividing the weight (kg) by the square of the height (m) based on physical measurements. We then graded BMI into three classifications according to the China obesity standard. BMI ≥ 28.0 was classified as obesity, BMI < 24.00 as normal or below (NOB), and overweight was situated between the two.
Parental history of diabetes (PHD) was determined by whether the father or mother had been diagnosed with diabetes at any time during the study period. Those with a reported diagnosis were classified as having a positive parental history, while those without a reported diagnosis were classified as having a negative parental history.
Covariates included in our study were age, sex (male, female), level of education (6–9 years for low, 10–12 for medium, and ≥ 13 for high, unknown), ethnicity (Han, other), residence area (urban, rural), tobacco use (yes or no), caffeine (coffee or tea) and alcohol consumption (yes or no).
2.3 Statistical analysis
First, we analyzed the prevalence and characteristics of self-reported diagnoses of diabetes using a cross-sectional study design across five different survey years. We used means (standard deviations) for TST and age that conformed to a normal or approximately normal distribution, and frequencies (percentages) for categorical variables. We all used the chi-square test to analyze the prevalence of self-reported diagnoses of diabetes among participants, considering factors such as gender, ethnicity, age, residence areas, education, smoking, drinking, coffee or tea, PHD, BMI, and TST. We employed one-way ANOVA to analyze trends for TST across survey years and to compare TST between diabetics and non-diabetics. Additionally, the Cochran-Armitage Test was used to analyze trends of diabetes prevalence over time.
Given the dynamic nature of the CHNS cohort, which allows for the continuous enrollment of participants, we have selected individuals who first joined the study in the years 2004, 2006, 2009, 2011, and 2015 as the subjects for our case-control analysis. The inclusion criterion was to utilize the baseline records of all participants upon their initial entry into the study for this analysis. Participants were excluded if their first record lacked sleep duration data, if they were outside the age range of 18 to 65, or if there was inconsistency in their self-reported diabetes status across follow-up assessments.
Subsequently, we established a cohort study by tracking participants who were initially undiagnosed with diabetes. We conducted descriptive statistics to summarize the basic characteristics of individuals included in the cohort study. (as shown in Supplementary Table S1)
In our longitudinal data analysis, we incorporated fixed effects to account for the influence of age and the interplay between BMI groups and observation time (Obstime) on TST. This approach allows us to explore how age and BMI categories dynamically interact with time to affect changes in TST. Furthermore, we acknowledged the potential impact of lifestyle choices on sleep by including covariates for habitual consumption of coffee or tea, alcohol intake, and smoking status. These factors are acknowledged for their capacity to significantly alter an individual’s sleep architecture and were thus controlled for within the model. To encapsulate the temporal dynamics and individual-specific fluctuations, Obstime was incorporated as a random effect. This strategy effectively integrates both systematic changes over time and the inherent randomness that shapes the individual’s sleep trajectory. The construction of a mixed linear model for TST represents our analysis’s objective of offering a comprehensive and nuanced portrayal of the multifaceted determinants of sleep patterns.
The term the Level -1 equation is an interaction term. It allows us to understand how the effect of time on TST varies across different BMI groups. For example, in individuals with different BMI levels, the rate at which TST changes over time might be distinct. By including this interaction term, we can capture these complex relationships and provide a more accurate description of the data. Level -2, the random effects and are associated with the intercept and the coefficient of the interaction term respectively. The random intercept accounts for the individual-specific differences in the baseline TST. Different individuals may have different starting points of TST even when all other covariates are the same. The random coefficient , on the other hand, allows the relationship between time and TST to vary across individuals within each BMI group. This takes into account the inherent variability among individuals and helps us better fit the data and make more accurate predictions.
In order to address inquiries regarding the probability of self-reported diagnoses of diabetes and the time frame within which said reports occur as a consequence of variations in TST, we employed survival analysis, a powerful analytical tool. In our analysis, we considered a range of factors known to influence outcomes, including place of residence, ethnicity, gender, educational level, PHD, and BMI groups. These variables were integrated into a Cox proportional hazards model, which is an effective method for estimating the risk. Building upon this foundation, we advanced our analysis by constructing a joint model. This innovative approach enabled us to explore the intricate relationship between fluctuations in TST and the risk of self-reported diagnoses of diabetes across various BMI statuses. The joint model provides a more nuanced understanding of how sleep patterns interplay with other health indicators to affect the risk of self-reported diagnoses of diabetes.
We conducted statistical modeling and plotting using R4.2.1 with packages compareGroups,lme4, JM and ggplot2. We set p<=0.05 as the level of statistical significance in the study.
3 Results
The prevalence of self-reported diagnoses of diabetes showed a progressive increase from 1.10% in 2004 to 3.06% in 2015 (Z= -12.56, p<0.01). Meanwhile, the mean TST gradually decreased from 8.12 hours in 2004 to 7.80 hours in 2015 (F= 144.53, p<0.01). This decline was observed in both self-reported diabetes patients and non-diabetic participants, with TST being lower in self-reported diabetes patients than in non-diabetic participants (p<0.01) (refer to Figure 1). Prevalence differences were observed across various factors such as PHD, age, residence, BMI, and coffee or tea consumption group in almost all cross-sectional analyses. However, educational level, gender, and alcohol consumption showed variations in only some waves (as presented in Table 1). Baseline analysis results indicated that the risk factors for self-reported diagnoses of diabetes included PHD (OR= 14.2, p<0.001), overweight/obesity (OR= 2.64/3.98, p<0.001), age (OR= 1.12, p<0.001), Han ethnicity (OR= 1.98, p=0.002), urban residence (OR= 2.09, p<0.001), coffee or tea consumption (OR= 1.38, p=0.003), and a decrease of 1 hour in TST (OR= 1.26, p<0.001) (as shown in Table 2).
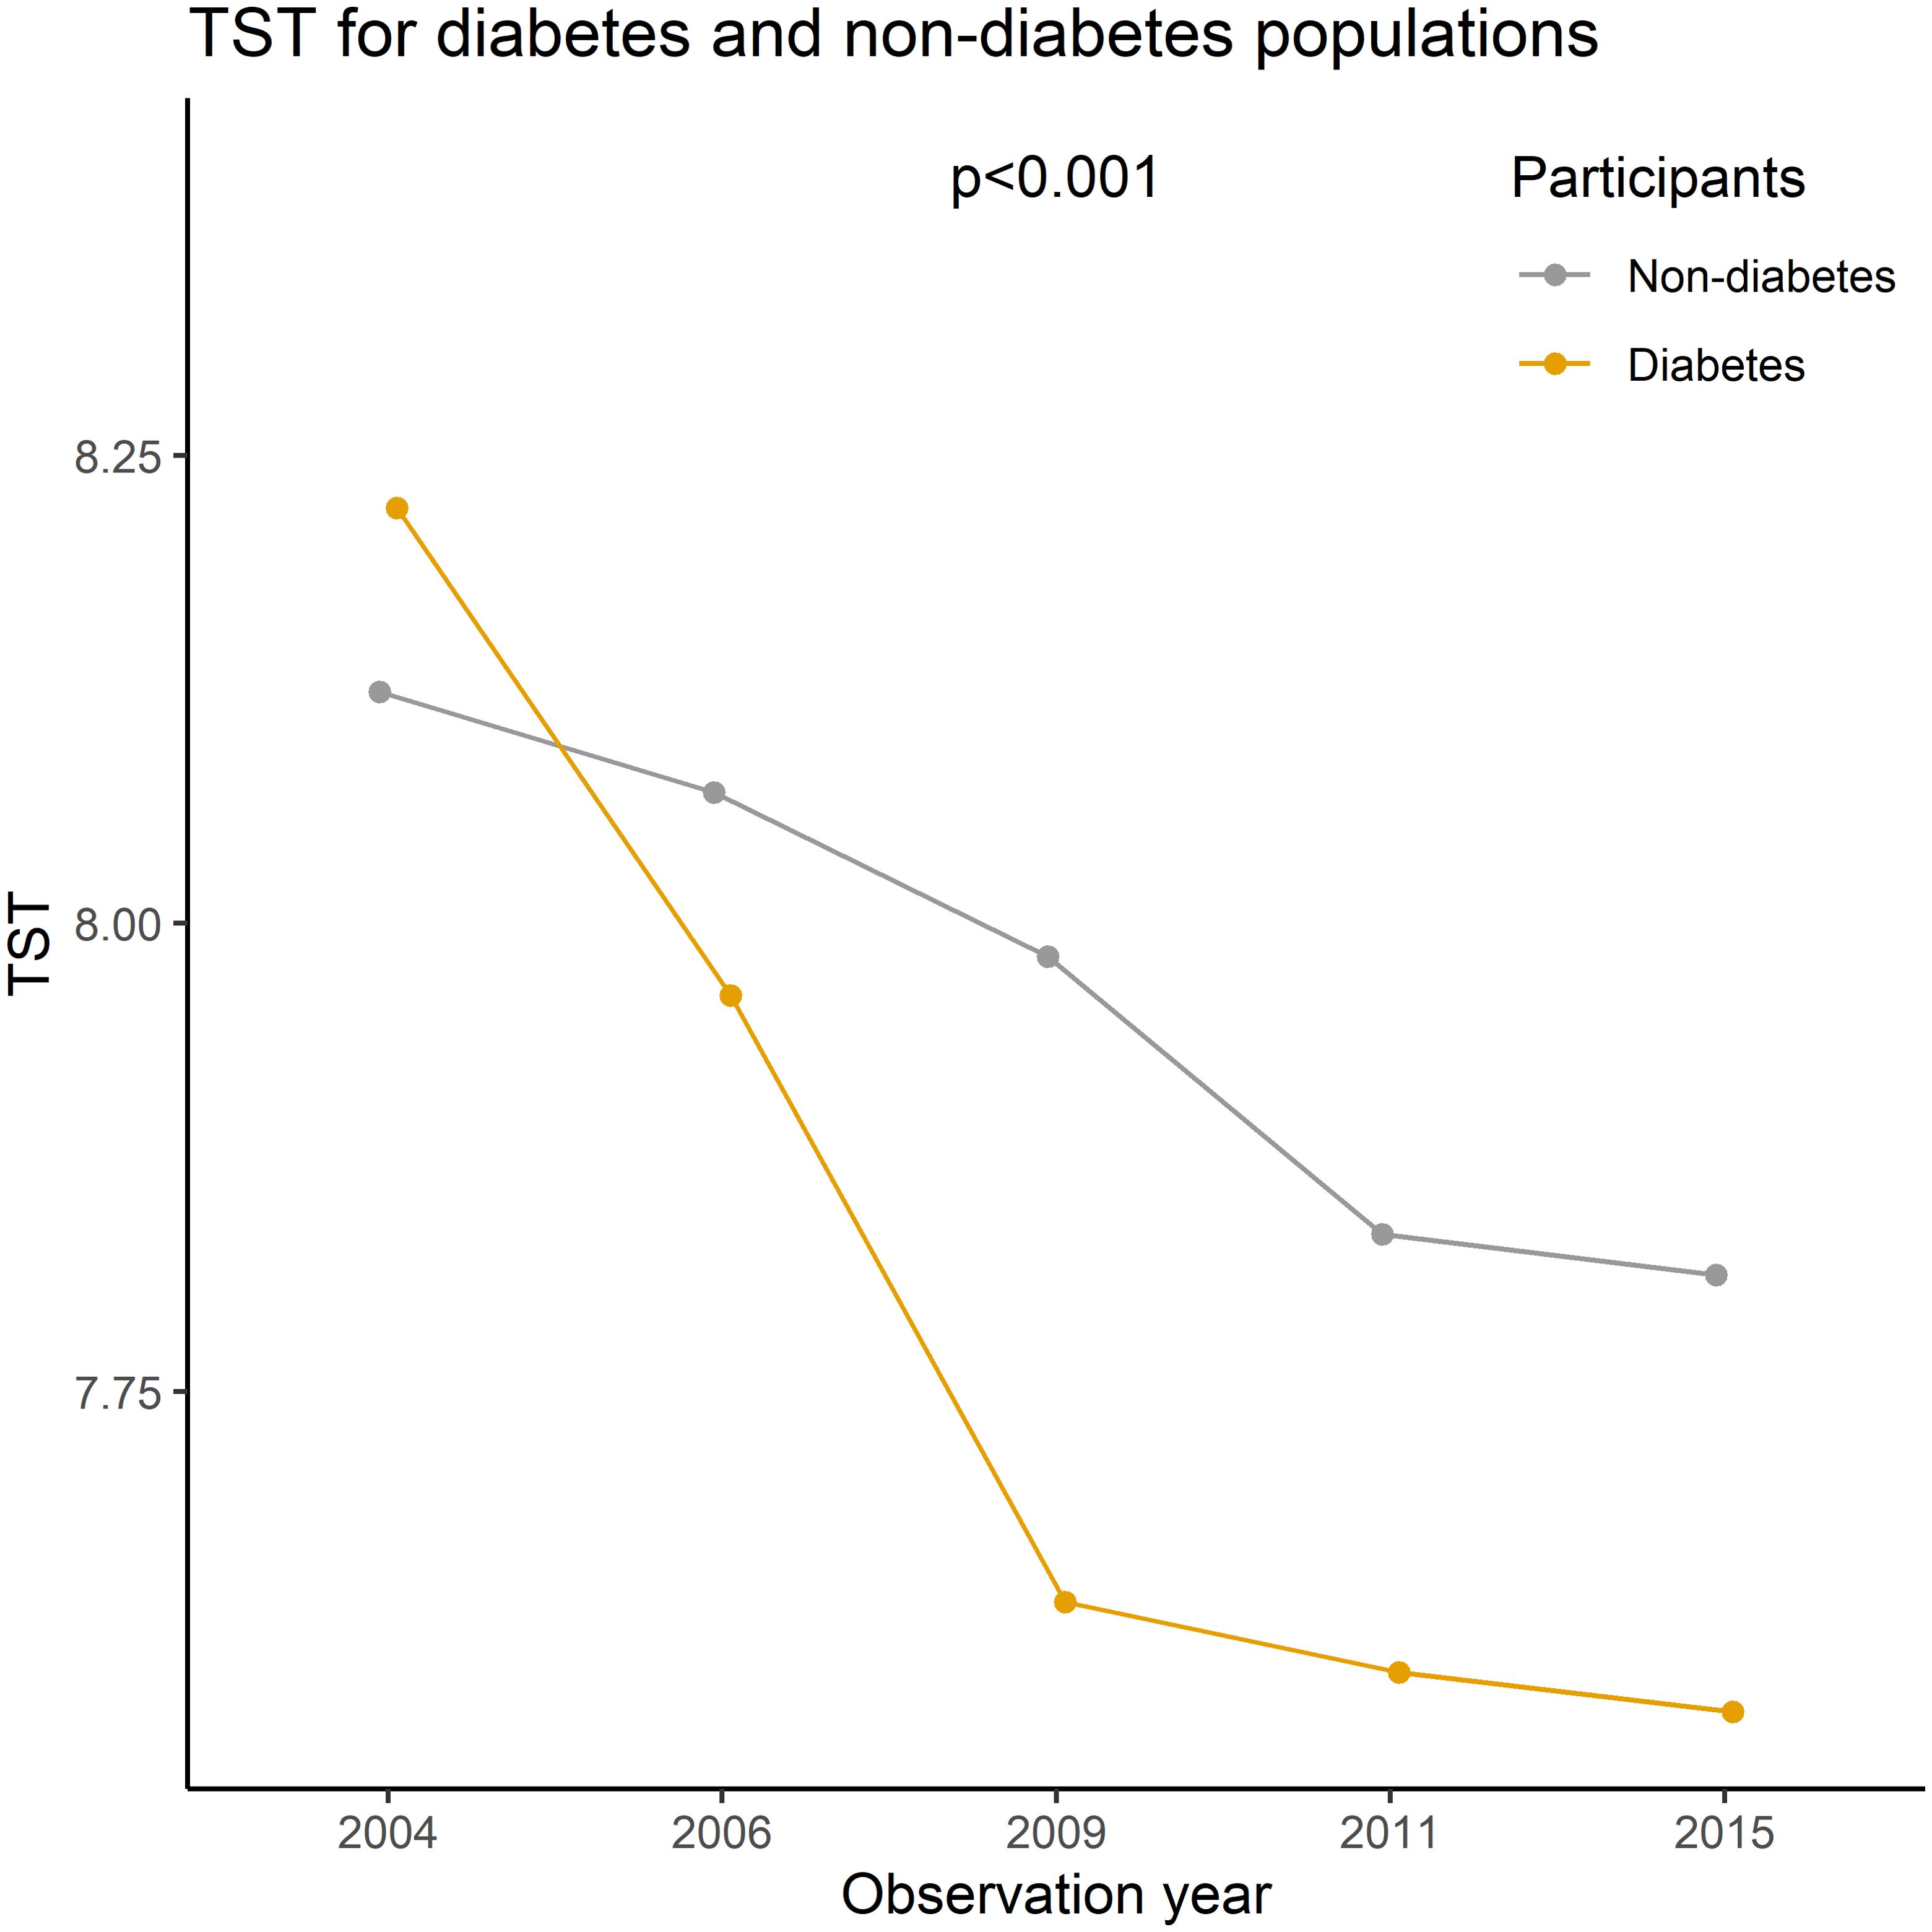
Figure 1. Mean TST for diabetes and non-diabetes in CHNS, 2004-2015.
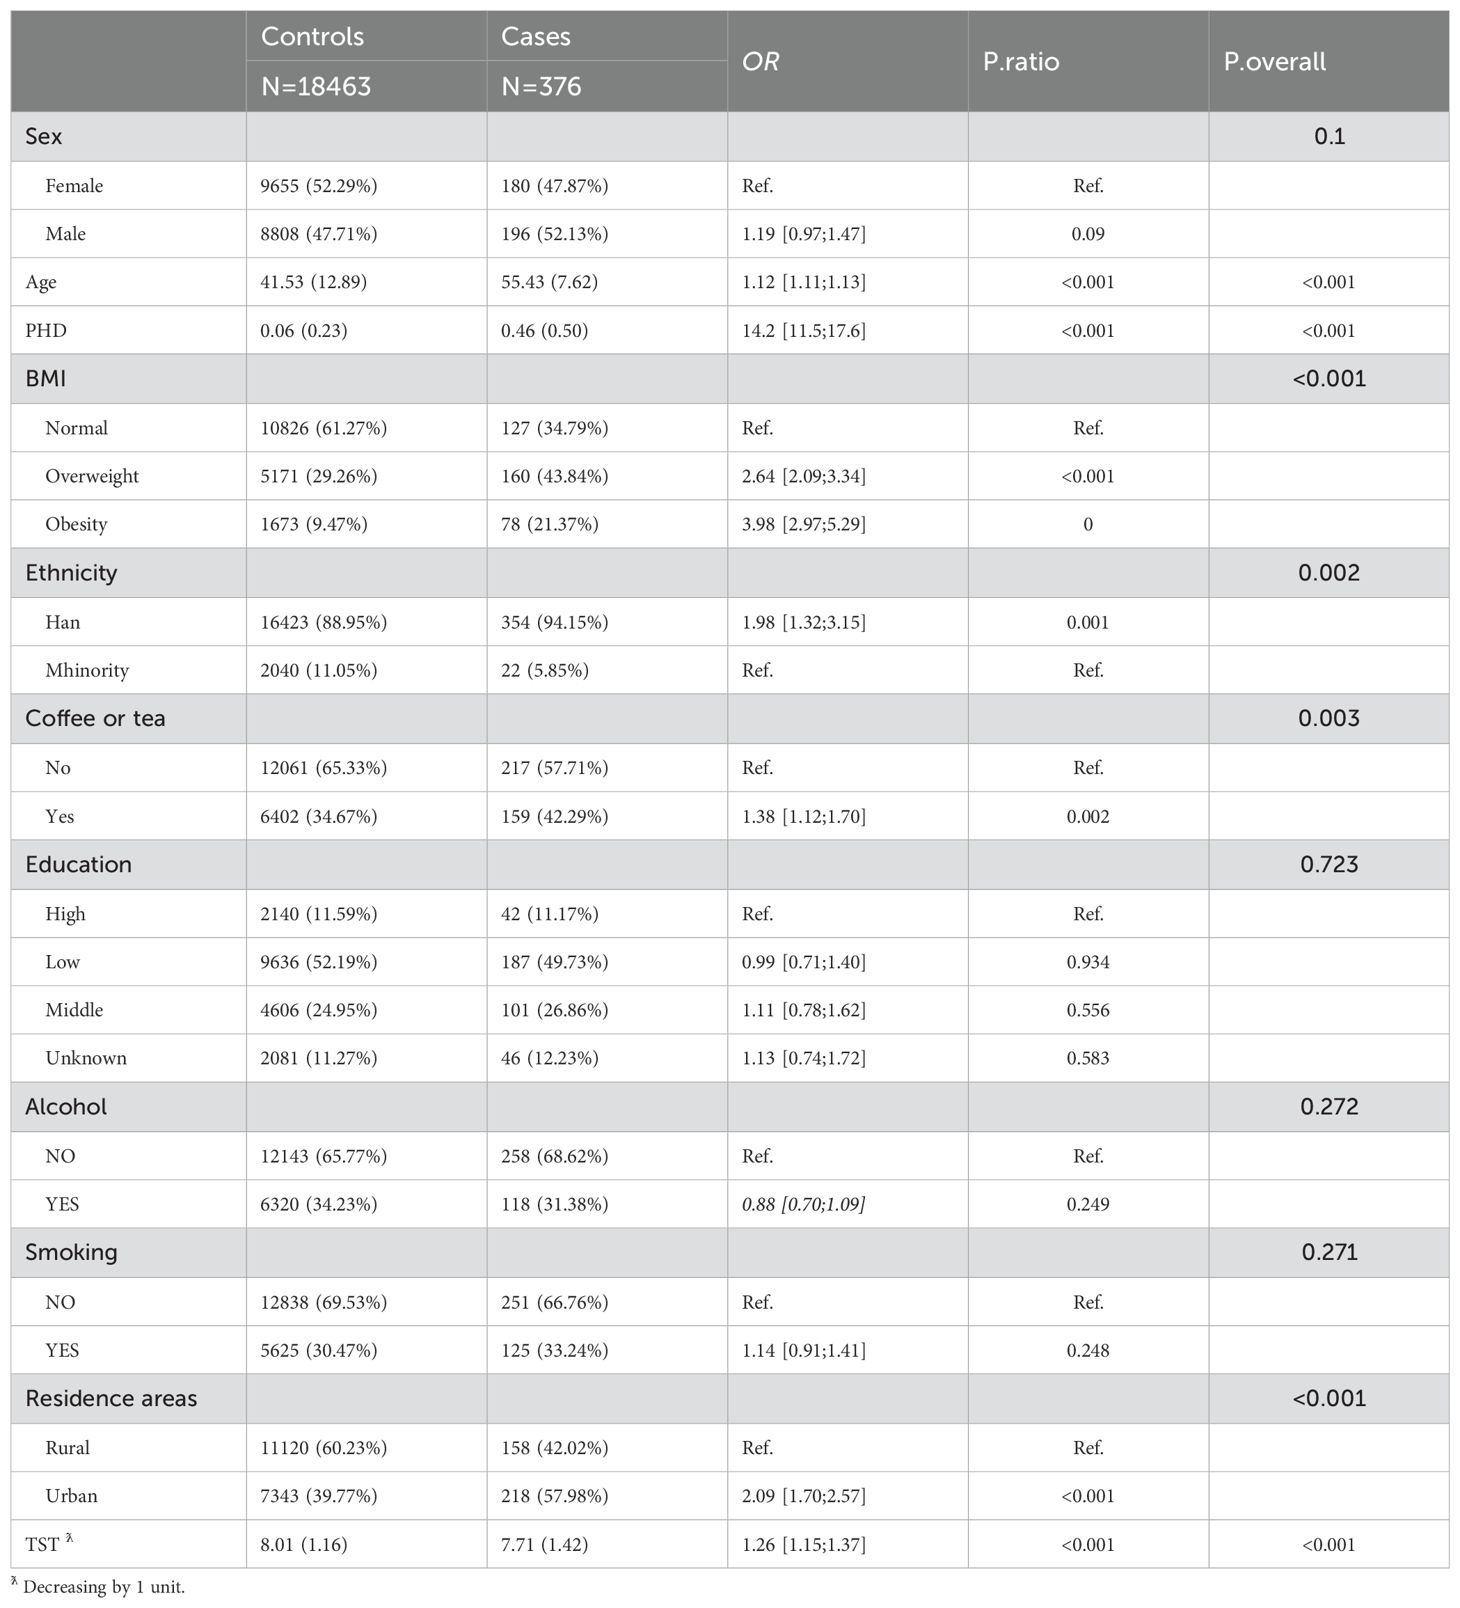
Table 2. A case-control study with initial cohort enrollment.
In the longitudinal sub-model, the intercept, age, BMI× Obstime, coffee or tea consumption, and alcohol consumption were all found to be statistically significant. TST progressively decreased with age, coffee or tea consumption, and alcohol consumption. The interaction between different BMI groups and time was also statistically significant, suggesting that the trend of TST over time varied across BMI groups (as shown in Figure 2). The deceleration was fastest in obese individuals and second fastest in overweight. As for the random effects section, the correlation coefficient of -0.65 between intercept and slope indicated a negative relationship between baseline TST and the magnitude of change in the outcome variable. Specifically, individuals with a higher baseline TST tend to experience smaller changes over time, whereas those with a lower baseline TST tend to experience larger changes. In the survival sub-model, PHD, BMI groups, residence, ethnicity, and literacy were all found to be statistically significant (as shown in Figure 3).
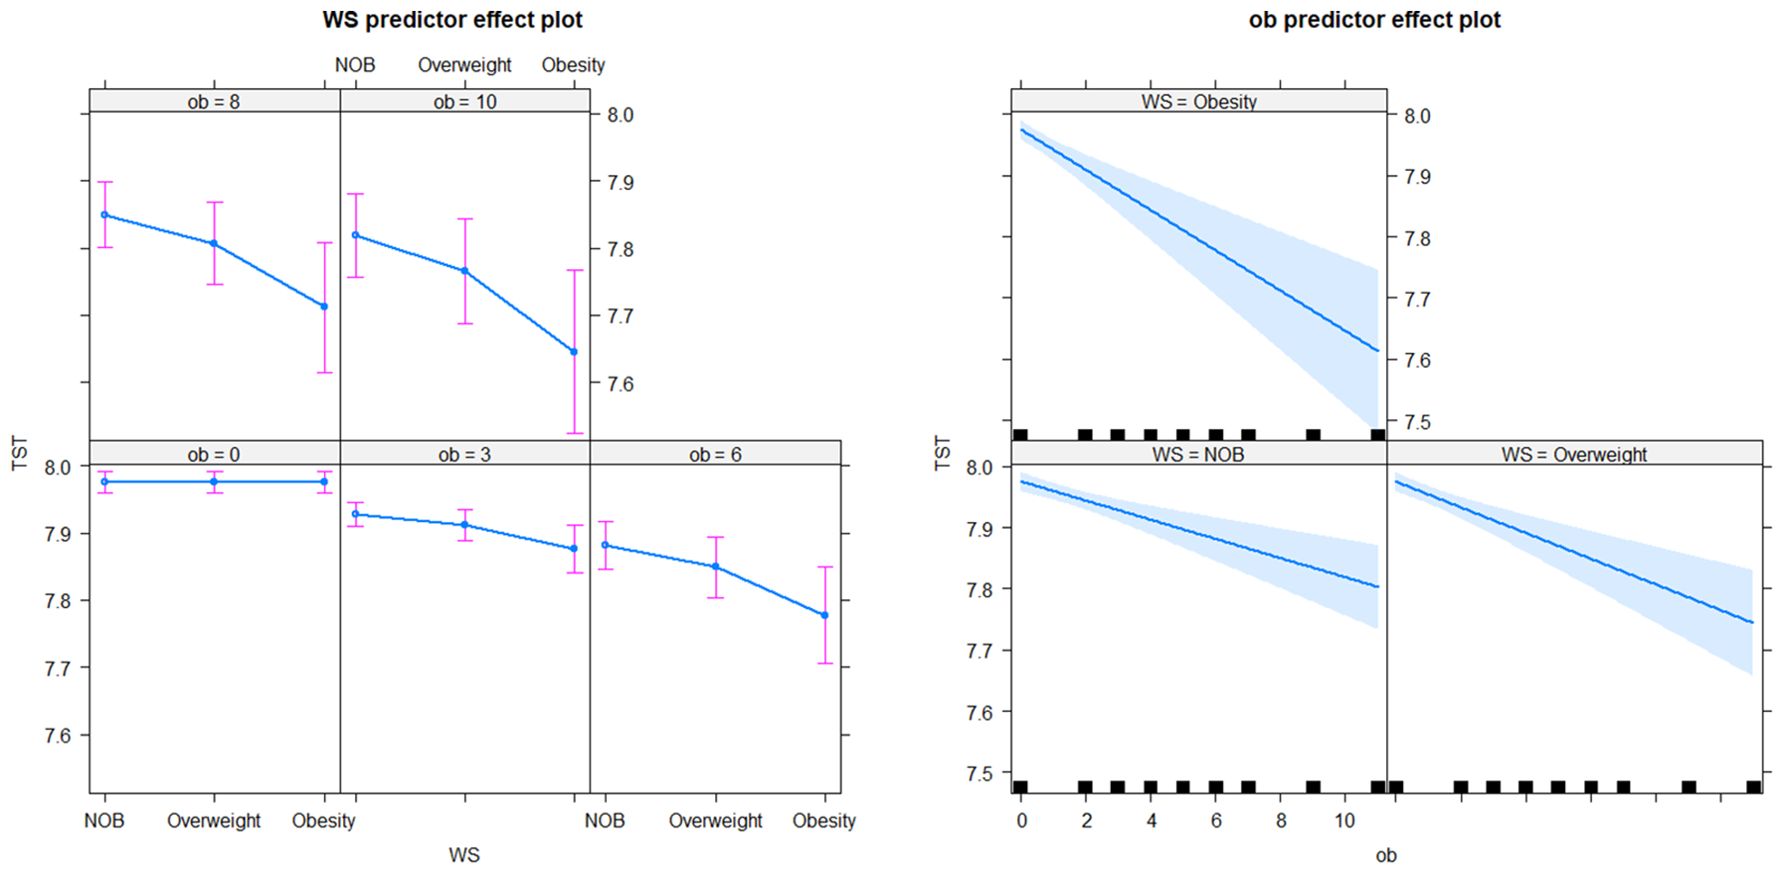
Figure 2. TST by the interaction effect between BMI and Observation time.

Figure 3. Cox regression forest plot of self-reported diabetes survival data.
In the longitudinal process, TST decreased on average by 0.01 with each annual increase in age. Furthermore, TST was lower by an average of 0.03 in the group consuming coffee or tea compared to the non-consuming group, and by 0.07 in the alcohol-consuming group compared to the non-alcohol group. Among the BMI groups, TST decreased on average by 0.05 in the obese group with each follow-up visit, by 0.03 in the overweight group, and by 0.01 in the NOB group. In the event process, the Hazard Ratio (HR) for self-reported diagnoses of diabetes was 1.84 (95% CI: 1.40-2.41) in the overweight group and 2.81 (95% CI: 2.07-3.80) in the obese group compared to the normal and underweight group. The HR was 1.99 (95% CI: 1.18-3.34) for secondary education and 2.15 (95% CI: 1.31-3.53) for lower education compared to tertiary education. Urban residents had a HR and 95% CI for self-reported diagnoses of diabetes of 0.65 (0.52-0.83) compared to rural residents, and 0.46 (0.27-0.78) for ethnic minorities compared to Han Chinese. The relative HR for the PHD group compared to the non-PHD group was 9.95 (95% CI: 7.88-12.57), and for females compared to males, it was 0.87 (0.69-1.10). The joint model with diabetic self-reports revealed an association coefficient of -1.28 (-1.49 – 1.07) and a 95% confidence interval. Specifically, each 1-hour decrease in TST was associated with a substantial 3.61 (2.92-4.44) fold increase in the risk of self-reported diagnoses of diabetes (see Table 3).
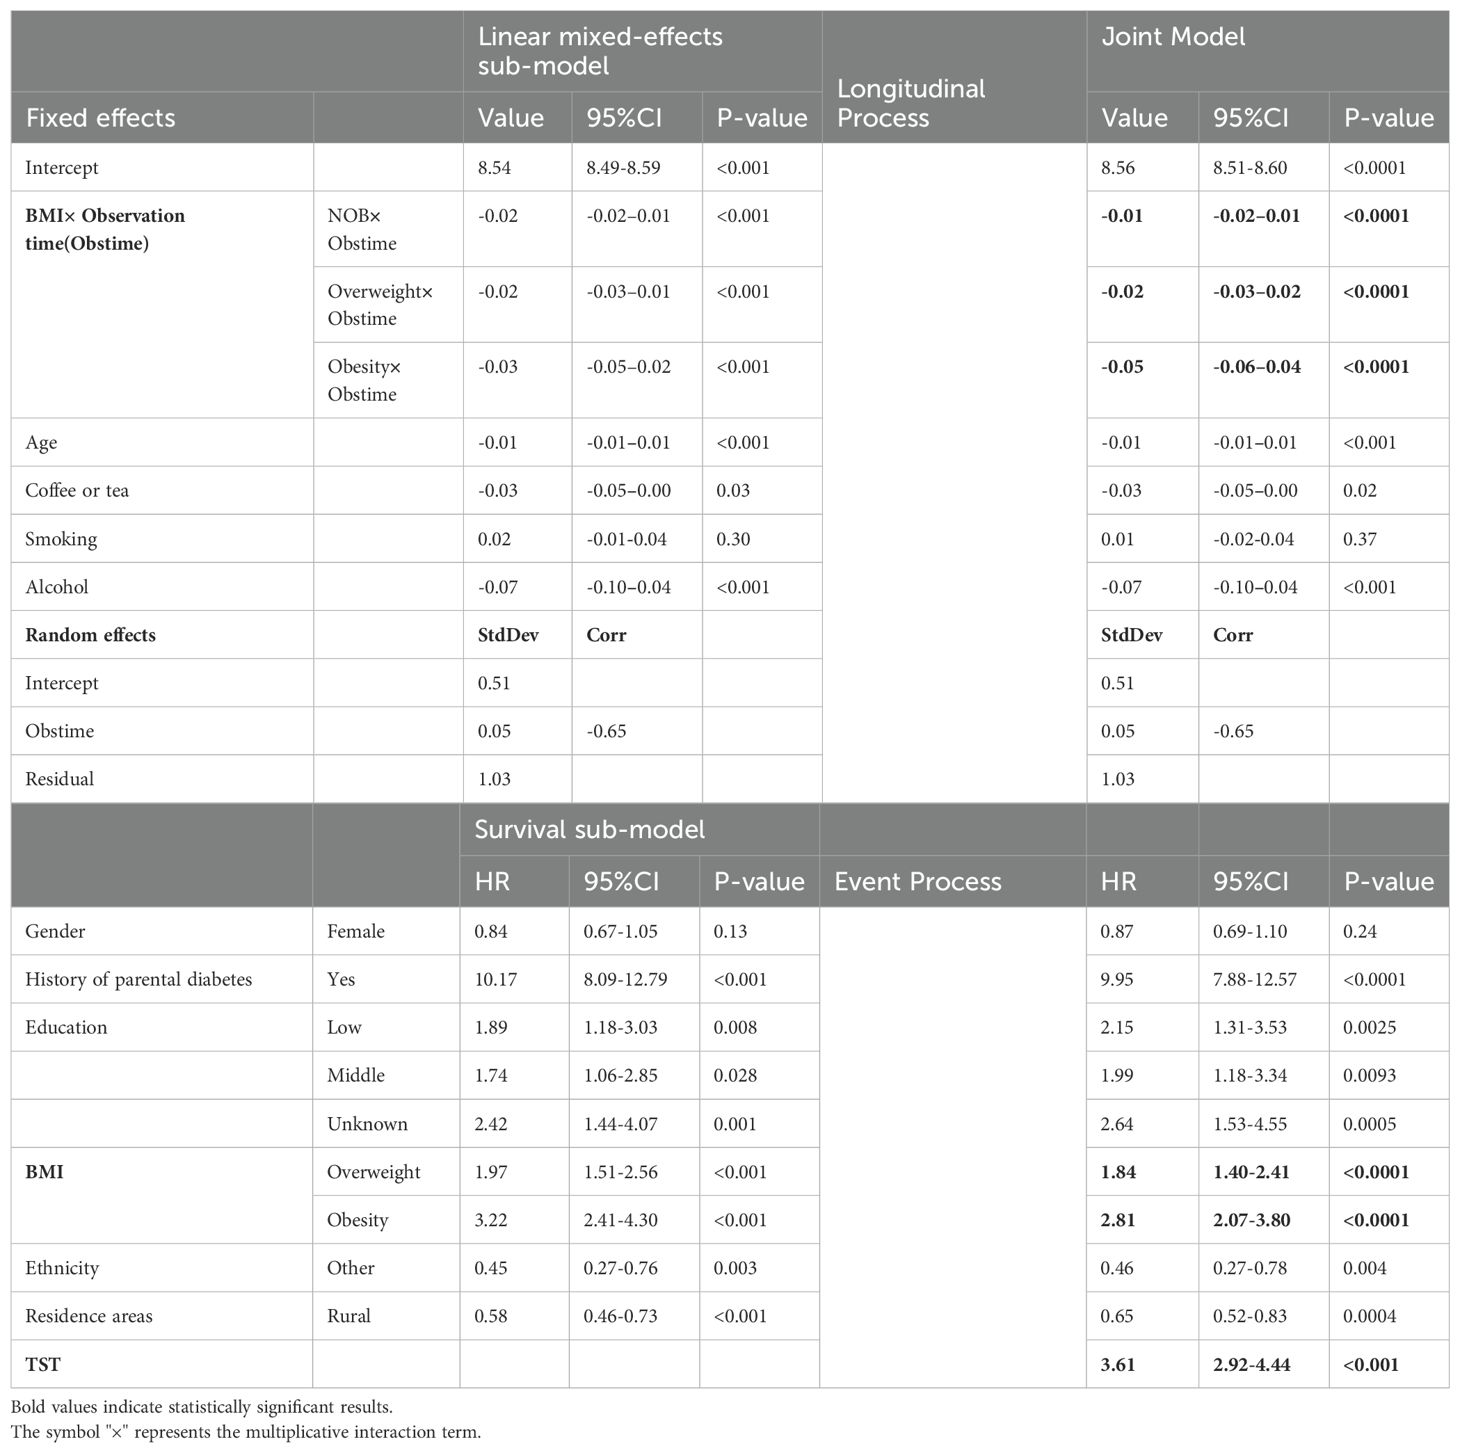
Table 3. Joint model for TST and risk of self-reported diabetes in CHNS.
4 Discussion
Our study provides compelling evidence that the average TST is decreasing while the self-reported rate of diabetes continues to increase in China between 2004 and 2015. TST was affected by age, coffee and tea consumption, drinking habits, and obesity level. PHD, lower education level, heavier obesity, urban dwellers, and Han Chinese had a higher risk of the disease than the control group. We specifically analyzed the time-dependent variability of TST among individuals with diverse BMI states. As the obese state with-in individual, TST decreases at an accelerated rate. Our results showed that a 1-hour decrease in TST was associated with a 3.61-fold increase in the risk of self-reported diagnoses of diabetes. These findings provide a new vision for diabetes intervention through sleep manipulation in different populations. They also highlight the impact of overweight and obesity status on the temporal relationship between sleep and self-reported diagnoses of diabetes.
It’s an indisputable fact that modern people are sleeping less and less. The reduction in TST as individuals age aligns with previous literature (24). Our study identified an average TST decrease of 6 minutes per decade. This differs slightly from the SIESTA data, which suggests a decline of 8–10 minutes per decade. The discrepancy in measurement methods, with our study using self-assessment on an hourly scale and SIESTA employing PSG measurements on a minute scale, could explain this slight disparity (25). Caffeine and alcohol consumption habits may lead to an average reduction in TST by 2 and 4 minutes, respectively. Caffeine intake prolongs the time taken to fall asleep and reduces the overall duration of sleep (26, 27). These findings have been consistently supported in regions where tea or coffee consumption is prevalent (28, 29). The amount of caffeine consumed and the timing of consumption play a crucial role in influencing TST (30, 31). Public awareness regarding the potential negative effects of alcohol on sleep is often lacking, and alcohol is frequently used as a sleep aid. However, alcohol actually leads to a decrease in TST during the latter half of the night and an increase in both the frequency and duration of awakenings (32). The study conducted in the Stonington, Massachusetts area, female participants who consumed alcohol experienced a 19-minute decrease in TST compared to those in the placebo group, whereas the difference was not significant among male participants (33). NHIS data from the United States (2004-2015) confirmed that the prevalence of short sleep was higher in drinkers than in the non-drinking group (34). Our research findings are inconsistent with those of Shabana Masood, as we did not find any evidence that smoking reduces sleep duration (35). It is possible that the discrepancy arises from the fact that their study focused solely on adult males and categorized smoking into three levels.
We identified a parallel relationship between obesity and TST. Obesity state led to a decline in TST at a rate of half an hour per decade. Similarly, overweight status resulted in a decrease in sleep of 12 minutes over a 10-year period. Our findings align with Koolhaas et al.’s longitudinal data analysis, revealing a link between high BMI and reduced sleep duration over time (18). The trend of TST varied across different BMI groups, with the obese group showing the most significant decrease, followed by the overweight group.
In an increasing number of regions and countries, the general public has been urged not to ignore and underestimate sleep problems (23, 36). Also, some experiments have been conducted on sleep interventions and it is believed that sleep manipulation is feasible. Several studies have shown that it is feasible to prolong sleep using simple non-pharmacological interventions, including behavioral interventions and health education (37, 38). The effectiveness of these interventions has also been demonstrated in randomized controlled studies. At the same time, some studies have confirmed that sleep manipulation can change an individual’s food intake and dietary preferences. These include reduced intake of free sugars, fats, and carbohydrates and reduced overall appetite and desire for sweet and savory foods (38, 39).Cognitive-behavioral therapy with sleep manipulation is more effective than cognitive-behavioral therapy alone in weight loss in the overweight and obese population by Logue et al. (40)
In recent years, the intricate relationship among obesity, reduced sleep duration, and diabetes has emerged as a prominent research focus in the field of metabolism. Scholars have been exploring integrative theoretical models, emphasizing the bidirectional causal or mediated causal mechanisms among these factors. Individuals with overweight often report a shortened sleep duration (41), and this is also corroborated by animal models, which demonstrate that obesity can lead to insomnia (42). Research has found that the “Raptin” reveals potential molecular mechanisms underlying the connection between sleep and obesity, providing valuable insights into this complex relationship (43). Additionally, models have been proposed suggesting that obesity acts as a mediator in the relationship between sleep and diabetes (44).
Recent evidence suggests that sleep duration and diabetes can be explained by mechanisms such as inflammatory responses, reduced insulin sensitivity, and increased appetite. However, the effect of the TST (time-dependent variable) and obesity on the temporal relationship of diabetes mellitus is unclear. While previous research has adjusted for BMI and obesity indicators when examining the correlation between TST and diabetes, it may not fully explain the dynamic fluctuation of TST in relation to weight status and its impact on diabetes (23). To address this gap, our study employs a joint model of longitudinal and survival data to investigate diabetes self-reports in the CHNS. This novel model incorporates longitudinal TST measurements, obesity grading, and other relevant factors. The tendency for the higher baseline TST is likely to be small, and conversely the tendency for the lower baseline TST to be large. The higher rank of obesity, the faster TST declined over time, with a 3.6-fold increase in self-reported diagnoses of diabetes risk for each hour of decrease in TST. Despite the lack of direct evidence linking extended sleep duration to the prevention and treatment of diabetes, there are indications that alleviating sleep deprivation may improve insulin sensitivity (23, 45). Moreover, as mentioned earlier, sleep manipulation may have a positive influence on obesity. Therefore, sleep manipulation could potentially serve as a significant intervention strategy to decrease diabetes prevalence and alleviate the burden of disease in our modern society.
In conclusion, our findings indicate suggest a significant increase in the prevalence of self-reported diagnoses of diabetes and a significant decrease in TST among Chinese adults over the past decade. Furthermore, our analysis revealed that the time-dependent variability of TST among individuals with diverse BMI states and found that a 1-hour decrease in TST was associated with a 3.61-fold increase in the risk of self-reported diagnoses of diabetes. For the obese, TST decreases at an accelerated rate, thereby increasing the risk of self-reported diagnoses of diabetes. These initiatives provide new ideas to further explore the dynamic causal relationship and specific mechanisms of the three (obesity, reduced sleep duration, diabetes). It could also serve as effective policy measures for diabetes control. Despite studies confirming the effectiveness of metformin in preventing diabetes in obese people under the age of 60, the American Diabetes Association now recommends metformin as a viable option for diabetes prevention (46). However, it is important to note that this recommendation complements, rather than replaces, the emphasis on lifestyle interventions as the cornerstone of diabetes prevention strategies (47). Sleeping interventions are likely to be included.
Our study has several limitations that need to be acknowledged. First, the self-reported nature of sleep duration or diabetes in the survey may have introduced recall bias in the interviews. However, previous studies have demonstrated the reliability and accuracy of self-reported measures compared with objective measures. Additionally, self-reporting remains a cost-effective method with high participation rates. Second, the study measured and analyzed TST in hours, potentially overlooking small yet significant differences. Third, the TST in our study represented the combined value of lunch break duration and night sleep duration, preventing separate consideration of their effects and hindering the accurate assessment of their relative and independent contributions to diabetes. The results need to be used with more caution, as there are also studies showing that napping for more than 30 minutes may increase the risk of T2DM (48).
Data availability statement
Publicly available datasets were analyzed in this study. This data can be found here: https://www.cpc.unc.edu/projects/china.
Ethics statement
The studies involving humans were approved by the Institutional Review Boards of University of North Carolina at Chapel Hill, National Institute of Nutrition and Food Safety, and Chinese Center for Disease Control and Prevention. The studies were conducted in accordance with the local legislation and institutional requirements. The participants provided their written informed consent to participate in this study.
Author contributions
LY: Writing – original draft. HS: Formal analysis, Writing – review & editing. YC: Formal Analysis, Writing – review & editing. XY: Formal analysis, Writing – review & editing. JZ: Writing – review & editing, Data curation. PL: Writing – review & editing, Writing – original draft.
Funding
The author(s) declare that no financial support was received for the research and/or publication of this article.
Acknowledgments
This research uses data from China Health and Nutrition Survey (CHNS). We thank the National Institute of Nutrition and Food Safety, China Center for Disease Control and Prevention, Carolina Population Center, the University of North Carolina at Chapel Hill, the NIH (R01-HD30880, DK056350, and R01-HD38700) and the Fogarty International Center, NIH for financial support for the CHNS data collection and analysis files from 1989 to 2006 and both parties plus the China-Japan Friendship Hospital, Ministry of Health for support for CHNS 2009 and future surveys.
Conflict of interest
The authors declare that the research was conducted in the absence of any commercial or financial relationships that could be construed as a potential conflict of interest.
Publisher’s note
All claims expressed in this article are solely those of the authors and do not necessarily represent those of their affiliated organizations, or those of the publisher, the editors and the reviewers. Any product that may be evaluated in this article, or claim that may be made by its manufacturer, is not guaranteed or endorsed by the publisher.
Supplementary material
The Supplementary Material for this article can be found online at: https://www.frontiersin.org/articles/10.3389/fendo.2025.1473892/full#supplementary-material
Abbreviations
TST, Total Sleep Time; CHNS, China Health and Nutrition Survey; PSG, Polysomnograph; BMI, Body Mass Index; PHD, Parental history of diabetes; Obstime, observation time; NOB, normal or below; HR, Hazard Ratio.
References
1. Ghekiere A, Van Cauwenberg J, Vandendriessche A, Inchley J, Gaspar de Matos M, Borraccino A, et al. Trends in sleeping difficulties among European adolescents: Are these associated with physical inactivity and excessive screen time? Int J Public Health. (2019) 64:487–98. doi: 10.1007/s00038-018-1188-1
2. Wang C, Bangdiwala SI, Rangarajan S, Lear SA, AlHabib KF, Mohan V, et al. Association of estimated sleep duration and naps with mortality and cardiovascular events: a study of 116 632 people from 21 countries. Eur Heart J. (2019) 40:1620–9. doi: 10.1093/eurheartj/ehy695
3. Svensson T, Saito E, Svensson AK, Melander O, Orho-Melander M, Mimura M, et al. Association of sleep duration with all- and major-cause mortality among adults in Japan, China, Singapore, and korea. JAMA network Open. (2021) 4:e2122837. doi: 10.1001/jamanetworkopen.2021.22837
4. van de Straat V, Bracke P. How well does Europe sleep? A cross-national study of sleep problems in European older adults. Int J Public Health. (2015) 60:643–50. doi: 10.1007/s00038-015-0682-y
5. Hartescu I, Stensel DJ, Thackray AE, King JA, Dorling JL, Rogers EN, et al. Sleep extension and metabolic health in male overweight/obese short sleepers: A randomised controlled trial. J sleep Res. (2022) 31:e13469. doi: 10.1111/jsr.13469
6. Dorenbos E, Rijks JM, Adam TC, Westerterp-Plantenga MS, Vreugdenhil AC. Sleep efficiency as a determinant of insulin sensitivity in overweight and obese adolescents. Diabetes obesity Metab. (2015) 17 Suppl 1:90–8. doi: 10.1111/dom.12515
7. Jackson CL, Ward JB, Johnson DA, Sims M, Wilson J, Redline S. Concordance between self-reported and actigraphy-assessed sleep duration among African-American adults: findings from the Jackson Heart Sleep Study. Sleep. (2020) 43(3):zsz246. doi: 10.1093/sleep/zsz246
8. Jackson CL, Patel SR, Jackson WB2, Lutsey PL, Redline S. Agreement between self-reported and objectively measured sleep duration among white, black, Hispanic, and Chinese adults in the United States: Multi-Ethnic Study of Atherosclerosis. Sleep. (2018) 41(6):zsy057. doi: 10.1093/sleep/zsy057
9. Wang W, Peng H, Bouak F. Measuring sleep parameters of naval sailors: A comparison between subjective self-report and wrist actigraphy. Appl ergonomics. (2022) 102:103744. doi: 10.1016/j.apergo.2022.103744
10. Miner B, Stone KL, Zeitzer JM, Han L, Doyle M, Blackwell T, et al. Self-reported and actigraphic short sleep duration in older adults. J Clin sleep Med. (2022) 18:403–13. doi: 10.5664/jcsm.9584
11. Tao Z, Feng Y, Liu J, Tao L. Trends and disparities in sleep quality and duration in older adults in China from 2008 to 2018: A national observational study. Front Public Health. (2023) 11:998699. doi: 10.3389/fpubh.2023.998699
12. Okura Y, Urban LH, Mahoney DW, Jacobsen SJ, Rodeheffer RJ. Agreement between self-report questionnaires and medical record data was substantial for diabetes, hypertension, myocardial infarction and stroke but not for heart failure. J Clin Epidemiol. (2004) 57:1096–103. doi: 10.1016/j.jclinepi.2004.04.005
13. Gatimu SM, Milimo BW, Sebastian MS. Prevalence and determinants of diabetes among older adults in Ghana. BMC Public Health. (2016) 16:1174. doi: 10.1186/s12889-016-3845-8
14. Moradpour F, Piri N, Dehghanbanadaki H, Moradi G, Fotouk-Kiai M, Moradi Y. Socio-demographic correlates of diabetes self-reporting validity: a study on the adult Kurdish population. BMC Endocr Disord. (2022) 22:139. doi: 10.1186/s12902-022-01056-w
15. El Fakiri F, Bruijnzeels MA, Hoes AW. No evidence for marked ethnic differences in accuracy of self-reported diabetes, hypertension, and hypercholesterolemia. J Clin Epidemiol. (2007) 60:1271–9. doi: 10.1016/j.jclinepi.2007.02.014
16. Yazdanpanah MH, Farjam M, Naghizadeh MM, Jedi F, Mohebi K, Homayounfar R. Sleep duration and anthropometric indices in an Iranian population: the Fasa PERSIAN cohort study. Sci Rep. (2021) 11:16249. doi: 10.1038/s41598-021-95796-9
17. Lim LL, Tse G, Choi KC, Zhang J, Luk AOY, Chow E, et al. Temporal changes in obesity and sleep habits in Hong Kong Chinese school children: a prospective study. Sci Rep. (2019) 9:5881. doi: 10.1038/s41598-019-42346-z
18. Koolhaas CM, Kocevska D, Te Lindert BHW, Erler NS, Franco OH, Luik AI, et al. Objectively measured sleep and body mass index: a prospective bidirectional study in middle-aged and older adults. Sleep Med. (2019) 57:43–50. doi: 10.1016/j.sleep.2019.01.034
19. Morales-Ghinaglia N, Fernandez-Mendoza J. Sleep variability and regularity as contributors to obesity and cardiometabolic health in adolescence. Obesity (Silver Spring Md.). (2023) 31:597–614. doi: 10.1002/oby.23667
20. Taporoski TP, Beijamini F, Alexandria S, Aaby D, von Schantz M, Pereira AC, et al. Gender differences in the relationship between sleep and age in a Brazilian cohort: the Baependi Heart Study. J sleep Res. (2024):e14154. doi: 10.1111/jsr.14154
21. Xu Z, Chen M, Yao Y, Yu L, Yan P, Cui H, et al. Temporal relationship between sleep duration and obesity among Chinese Han people and ethnic minorities. BMC Public Health. (2023) 23:503. doi: 10.1186/s12889-023-15413-4
22. Garfield V. The Association Between Body Mass Index (BMI) and Sleep Duration: Where Are We after nearly Two Decades of Epidemiological Research? Int J Environ Res Public Health. (2019) 16(22):4327. doi: 10.3390/ijerph16224327
23. Antza C, Kostopoulos G. The links between sleep duration, obesity and type 2 diabetes mellitus. J Endocrinol. (2021) 252:125–41. doi: 10.1530/JOE-21-0155
24. Li J, Vitiello MV, Gooneratne NS. Sleep in normal aging. Sleep Med Clinics. (2018) 13:1–11. doi: 10.1016/j.jsmc.2017.09.001
25. Dorffner G, Vitr M, Anderer P. The effects of aging on sleep architecture in healthy subjects. Adv Exp Med Biol. (2015) 821:93–100. doi: 10.1007/978-3-319-08939-3_13
26. Baur DM, Dornbierer DA, Landolt HP. Concentration-effect relationships of plasma caffeine on EEG delta power and cardiac autonomic activity during human sleep. J sleep Res. (2024) 33(5):e14140. doi: 10.1111/jsr.14140
27. Clark I, Landolt HP. Coffee, caffeine, and sleep: A systematic review of epidemiological studies and randomized controlled trials. Sleep Med Rev. (2017) 31:70–8. doi: 10.1016/j.smrv.2016.01.006
28. Althakafi KA, Alrashed AA, Aljammaz KI, Abdulwahab IJ, Hamza R, Hamad AF, et al. Prevalence of short sleep duration and effect of co-morbid medical conditions - A cross-sectional study in Saudi Arabia. J Family Med primary Care. (2019) 8:3334–9. doi: 10.4103/jfmpc.jfmpc_660_19
29. Drake C, Roehrs T, Shambroom J, Roth T. Caffeine effects on sleep taken 0, 3, or 6 hours before going to bed. J Clin sleep Med. (2013) 9:1195–200. doi: 10.5664/jcsm.3170
30. Gardiner C, Weakley J, Burke LM, Roach GD, Sargent C, Maniar N, et al. The effect of caffeine on subsequent sleep: A systematic review and meta-analysis. Sleep Med Rev. (2023) 69:101764. doi: 10.1016/j.smrv.2023.101764
31. Koivusilta L, Kuoppamäki H, Rimpelä A. Energy drink consumption, health complaints and late bedtime among young adolescents. Int J Public Health. (2016) 61:299–306. doi: 10.1007/s00038-016-0797-9
32. Graupensperger S, Fairlie AM, Vitiello MV, Kilmer JR, Larimer ME, Patrick ME, et al. Daily-level effects of alcohol, marijuana, and simultaneous use on young adults’ perceived sleep health. Sleep. (2021) 44(12):zsab187. doi: 10.1093/sleep/zsab187
33. Arnedt JT, Rohsenow DJ, Almeida AB, Hunt SK, Gokhale M, Gottlieb DJ, et al. Sleep following alcohol intoxication in healthy, young adults: effects of sex and family history of alcoholism. Alcoholism Clin Exp Res. (2011) 35:870–8. doi: 10.1111/j.1530-0277.2010.01417.x
34. Jackson CL, Gaston SA, Liu R, Mukamal K, Rimm EB. The relationship between alcohol drinking patterns and sleep duration among black and white men and women in the United States. Int J Environ Res Public Health. (2018) 15(3):557. doi: 10.3390/ijerph15030557
35. Masood S, Cappelli C, Li Y, Tanenbaum H, Chou C-P, Spruijt-Metz D, et al. Cigarette smoking is associated with unhealthy patterns of food consumption, physical activity, sleep impairment, and alcohol drinking in Chinese male adults. Int J Public Health. (2015) 60:891–9. doi: 10.1007/s00038-015-0730-7
36. Ren Y, Liu Y, Meng T, Liu W, Qiao Y, Gu Y, et al. Social-biological influences on sleep duration among adult residents of Northeastern China. Health Qual Life outcomes. (2019) 17:47. doi: 10.1186/s12955-019-1111-3
37. Knowlden AP, Hackman CL, Sharma M. Systematic review of dietary interventions targeting sleep behavior. J Altern complementary Med (New York N.Y.). (2016) 22:349–62. doi: 10.1089/acm.2015.0238
38. Al Khatib HK, Hall WL, Creedon A, Ooi E, Masri T, McGowan L, et al. Sleep extension is a feasible lifestyle intervention in free-living adults who are habitually short sleepers: a potential strategy for decreasing intake of free sugars? A randomized controlled pilot study. Am J Clin Nutr. (2018) 107:43–53. doi: 10.1093/ajcn/nqx030
39. Tasali E, Chapotot F, Wroblewski K, Schoeller D. The effects of extended bedtimes on sleep duration and food desire in overweight young adults: a home-based intervention. Appetite. (2014) 80:220–4. doi: 10.1016/j.appet.2014.05.021
40. Logue EE, Bourguet CC, Palmieri PA, Scott ED, Matthews BA, Dudley P, et al. The better weight-better sleep study: a pilot intervention in primary care. Am J Health Behav. (2012) 36:319–34. doi: 10.5993/AJHB.36.3.4
41. Chaput JP, McHill AW, Cox RC, Broussard JL, Dutil C, da Costa BGG, et al. The role of insufficient sleep and circadian misalignment in obesity. Nat Rev Endocrinol. (2023) 19:82–97. doi: 10.1038/s41574-022-00747-7
42. Grubbs JJ, Lopes LE, van der Linden AM, Raizen DM. A salt-induced kinase is required for the metabolic regulation of sleep. PloS Biol. (2020) 18:e3000220. doi: 10.1371/journal.pbio.3000220
43. Xie LQ, Hu B, Lu RB, Cheng YL, Chen X, Wen J, et al. Raptin, a sleep-induced hypothalamic hormone, suppresses appetite and obesity. Cell Res. (2025) 35(3):165–85. doi: 10.1038/s41422-025-01078-8
44. Chen S, Wang J, Wang J, Gao Q, Zhao X, Guan H, et al. Obesity as a mediator linking sleep-disordered breathing to both impaired fasting glucose and type 2 diabetes. Sleep Breath. (2023) 27:1067–80. doi: 10.1007/s11325-022-02705-z
45. Leproult R, Deliens G, Gilson M, Peigneux P. Beneficial impact of sleep extension on fasting insulin sensitivity in adults with habitual sleep restriction. Sleep. (2015) 38:707–15. doi: 10.5665/sleep.4660
46. Alfayez OM, Alsallum AA, Aljabri AF, Almutairi FS, Al-Azzeh O, Almalki OS, et al. The use of metformin for type 2 diabetes prevention: Observational multicenter study from Saudi Arabia. Front Public Health. (2022) 10:989072. doi: 10.3389/fpubh.2022.989072
47. Zhao J, Li M. Worldwide trends in prediabetes from 1985 to 2022: A bibliometric analysis using bibliometrix R-tool. Front Public Health. (2023) 11:1072521. doi: 10.3389/fpubh.2023.1072521
Keywords: total sleep time, diabetes, time-dependent changes, longitudinal cohort study, joint model
Citation: Yan L, Sun H, Chen Y, Yu X, Zhang J and Li P (2025) Obesity and the accelerated decline in total sleep time increases the self-reported diagnoses of diabetes. Front. Endocrinol. 16:1473892. doi: 10.3389/fendo.2025.1473892
Received: 14 August 2024; Accepted: 07 April 2025;
Published: 12 May 2025.
Edited by:
Nazarii Kobyliak, Bogomolets National Medical University, UkraineReviewed by:
Dana Mihaela Ciobanu, University of Medicine and Pharmacy Iuliu Hatieganu, RomaniaLiyun He, Sun Yat-sen University Cancer Center (SYSUCC), China
Copyright © 2025 Yan, Sun, Chen, Yu, Zhang and Li. This is an open-access article distributed under the terms of the Creative Commons Attribution License (CC BY). The use, distribution or reproduction in other forums is permitted, provided the original author(s) and the copyright owner(s) are credited and that the original publication in this journal is cited, in accordance with accepted academic practice. No use, distribution or reproduction is permitted which does not comply with these terms.
*Correspondence: Peijie Li, bGlwamx6dTA2QDE2My5jb20=