 Ryo Ito1
 Makito Oku2*
 Iwao Kimura2,3Takayuki Haruki2,4Masataka Shikata5Tsuyoshi Teramoto6Daisuke Chujo6Minoru Iwata5,7
 Shiho Fujisaka5Yoshiki Nagata8Takashi Yamagami8
 Makoto Kadowaki2Kazuyuki Tobe2
 Shigeru Saito2
 Keiichi Ueda2,3*
- 1Graduate School of Science and Engineering, University of Toyama, Toyama, Japan
- 2Research Center for Pre-Disease Science, University of Toyama, Toyama, Japan
- 3Faculty of Science, University of Toyama, Toyama, Japan
- 4Faculty of Sustainable Design, University of Toyama, Toyama, Japan
- 5First Department of Internal Medicine, University of Toyama, Toyama, Japan
- 6Center for Clinical and Translational Research, Toyama University Hospital, Toyama, Japan
- 7Second Department of Human Science, Faculty of Medicine, University of Toyama, Toyama, Japan
- 8Laboratory of Preventive Medicine, Hokuriku Health Service Association, Toyama, Japan
Aims: To clarify the pathways from a healthy state to the diabetes onset via pre-disease states, we applied energy landscape analysis (ELA) to Specific Health Checkup data in Japan.
Methods: This retrospective and observational cohort study analyzed data from 4,928 males aged 56.0 ± 3.2 years, including 242 individuals with diabetes, over a period of 5.26 ± 3.21 years. A total of 22,326 records were examined using six features: hemoglobin A1c, plasma glucose, high-density lipoprotein-cholesterol, body mass index (BMI), uric acid, and alanine aminotransferase. ELA was also applied to subdata from the 242 individuals with diabetes.
Results: ELA revealed three stable states: healthy, intermediate, and unhealthy (pre-diabetes) states. The intermediate state was characterized by obesity. Obese individuals with BMI ≥ 25 kg/m2 (n = 1,460) preferred a pathway via the intermediate state, whereas non-obese individuals with BMI < 25 kg/m2 (n = 3,468) preferred to transit directly to the unhealthy state. There was a significant difference between the preferences of the two groups (p = 0.0085, chi-squared test). Two distinct pathways were also observed for obese and non-obese individuals with diabetes.
Conclusions: We demonstrated that ELA could indicate different pathways of diabetes development in obese and non-obese individuals in a data-driven manner. These insights could inform more targeted diabetes prevention measures, such as reducing visceral fat in obese individuals and protecting beta-cells in non-obese individuals.
1 Introduction
The number of individuals with diabetes is on the rise around the world (1, 2), and the increasing medical expenses associated with it have become a significant concern. Diabetes can be prevented by implementing appropriate interventions before its onset (3–5). A state between a healthy state and a disease state is generally called a pre-disease state (6–8), and the pre-disease state of diabetes includes pre-diabetes and earlier stages broadly. Early detection of individuals in the pre-disease state having a high risk of diabetes and providing suitable interventions are expected to help control the increase in the number of individuals with diabetes.
The Industrial Safety and Health Act in Japan mandates regular health checkups at least once a year (9). Japanese-style regular health checkups, also known as “Specific Health Checkups,” are basically targeted at all employees aged 40 or over of all companies, and do not focus on high-risk groups for any particular disease. Therefore, oral glucose tolerance test and insulin measurement are not performed due to cost-benefit tradeoffs. On the other hand, an important advantage of Specific Health Checkups is that they allow the longitudinal measurement of many features, such as body mass index (BMI) and plasma glucose (PG) levels, for a large number of individuals. Thus, the time-series data from these health checkups is expected to be useful for early detection of individuals at high risk of diabetes.
Machine learning (ML)-based approaches have been proposed for predicting diabetes (10–19). However, predicting diabetes alone is not enough for effective interventions. It is also necessary to clarify the detailed pathways before the diabetes onset. Currently, methods for extracting such features from health checkup data are not well-established.
Energy landscape analysis (ELA) has been proposed as a technique for understanding state transitions in multidimensional time-series data, and it has been applied to various datasets (20–26). ELA identifies multiple stable states corresponding to energy valleys in the data and represents the difficulty of transitions between states as the height of the energy barrier. Therefore, ELA was expected to be suitable for revealing the important states and pathways before the diabetes onset. Each state is composed of multiple microstates, which are referred to as “patterns” henceforth. Each pattern is assigned a virtual energy level; the lower the energy, the more frequently the pattern will occur. The minimum energy pattern (also called the local minimum pattern) for each state is the most frequent and representative pattern for that state.
As a metaphor, the energy landscape is often explained as a ball on an uneven terrain. Without noise, the ball falls down a slope and reaches the bottom of a valley. With noise, the ball can climb a slope, and there is a small probability that the ball escapes from the current valley and moves to another one. The vertical axis of the terrain corresponds to the virtual energy. However, it should be noted that the “terrain” considered in ELA is not continuous but consists of discrete patterns.
What is unique about ELA is that the value of each feature is converted to 0 or 1 depending on whether the original value is below or above a threshold. Therefore, each pattern corresponds to a sequence of 0 and 1, such as “010111”, meaning the first feature is low, the second feature is high, and so on. This binarization process is believed to help ELA capture the global structure of the data.
In the present study, we applied ELA to Specific Health Checkup data in Toyama Prefecture in Japan to clarify the pathways from a healthy state to the diabetes onset via pre-disease states.
2 Materials and methods
2.1 Definition of diabetes and obesity
In the present study, an individual was diagnosed with diabetes based on the health checkup data if the individual fulfilled any of the following four conditions according to the diagnostic criteria of the Japanese Clinical Practice Guideline for Diabetes (27): (a) fasting PG ≥ 126 mg/dL and hemoglobin A1c (HbA1c) ≥ 6.5% (48 mmol/mol), (b) non-fasting PG ≥ 200 mg/dL and HbA1c ≥ 6.5% (48 mmol/mol), (c) responded to the questionnaire to have a history of diabetes, and (d) responded to the questionnaire to be under diabetes treatment. Since the questionnaire was administered at each health checkup, some individuals began to respond that they had a history of diabetes or were under diabetes treatment from a certain year. The first year when an individual was diagnosed with diabetes was taken as the diabetes onset. Although the health checkup data did not include information to distinguish between type 1 and type 2 diabetes, such as C-peptide levels, it was expected that most cases of diabetes in the present study were type 2 diabetes based on the general prevalence.
The obesity group was defined as individuals with a BMI of 25 kg/m2 or greater at the first measurement according to the diagnostic criteria of the Japan Society for the Study of Obesity (28–30). Similarly, the non-obesity group was defined as individuals with a BMI of less than 25 kg/m2 at the first measurement.
2.2 Study participants
The participants in the present study were 18,373 individuals aged 55.8 ± 3.3 years (49 to 64 years) who underwent Specific Health Checkups from April 2012 to March 2021 at Hokuriku Health Service Association in Toyama Prefecture in Japan. The anonymized dataset consisted of 108,920 records and 206 features. Among the 18,373 individuals, 1,192 individuals developed diabetes by 2020. The background characteristics of the study participants are shown in Supplementary Table S1. A list of abbreviations is shown in Supplementary Table S2.
2.3 Research design
Figure 1 shows a flowchart of our study design. Before performing ELA, we excluded features, individuals, and records in five steps. In the first step, we excluded redundant or unsuitable features for ELA: height, weight, categorical variables, and features with more than 30% missing values, except for HbA1c. Although HbA1c had 37% missing values, we included it as a clinically important feature because HbA1c generally reflects long-term blood glucose levels and plays a complementary role to PG (31). 18 features remained at this step: BMI, waist circumference (WC), systolic blood pressure (SBP), diastolic blood pressure (DBP), triglycerides (TG), low-density lipoprotein-cholesterol (LDL-C), high-density lipoprotein-cholesterol (HDL-C), PG, HbA1c, uric acid (UA), creatinine (Cre), aspartate aminotransferase (AST), alanine aminotransferase (ALT), γ-glutamyl transpeptidase (γ-GTP), white blood cell count (WBC), red blood cell count (RBC), hemoglobin (Hb), and hematocrit (Ht).
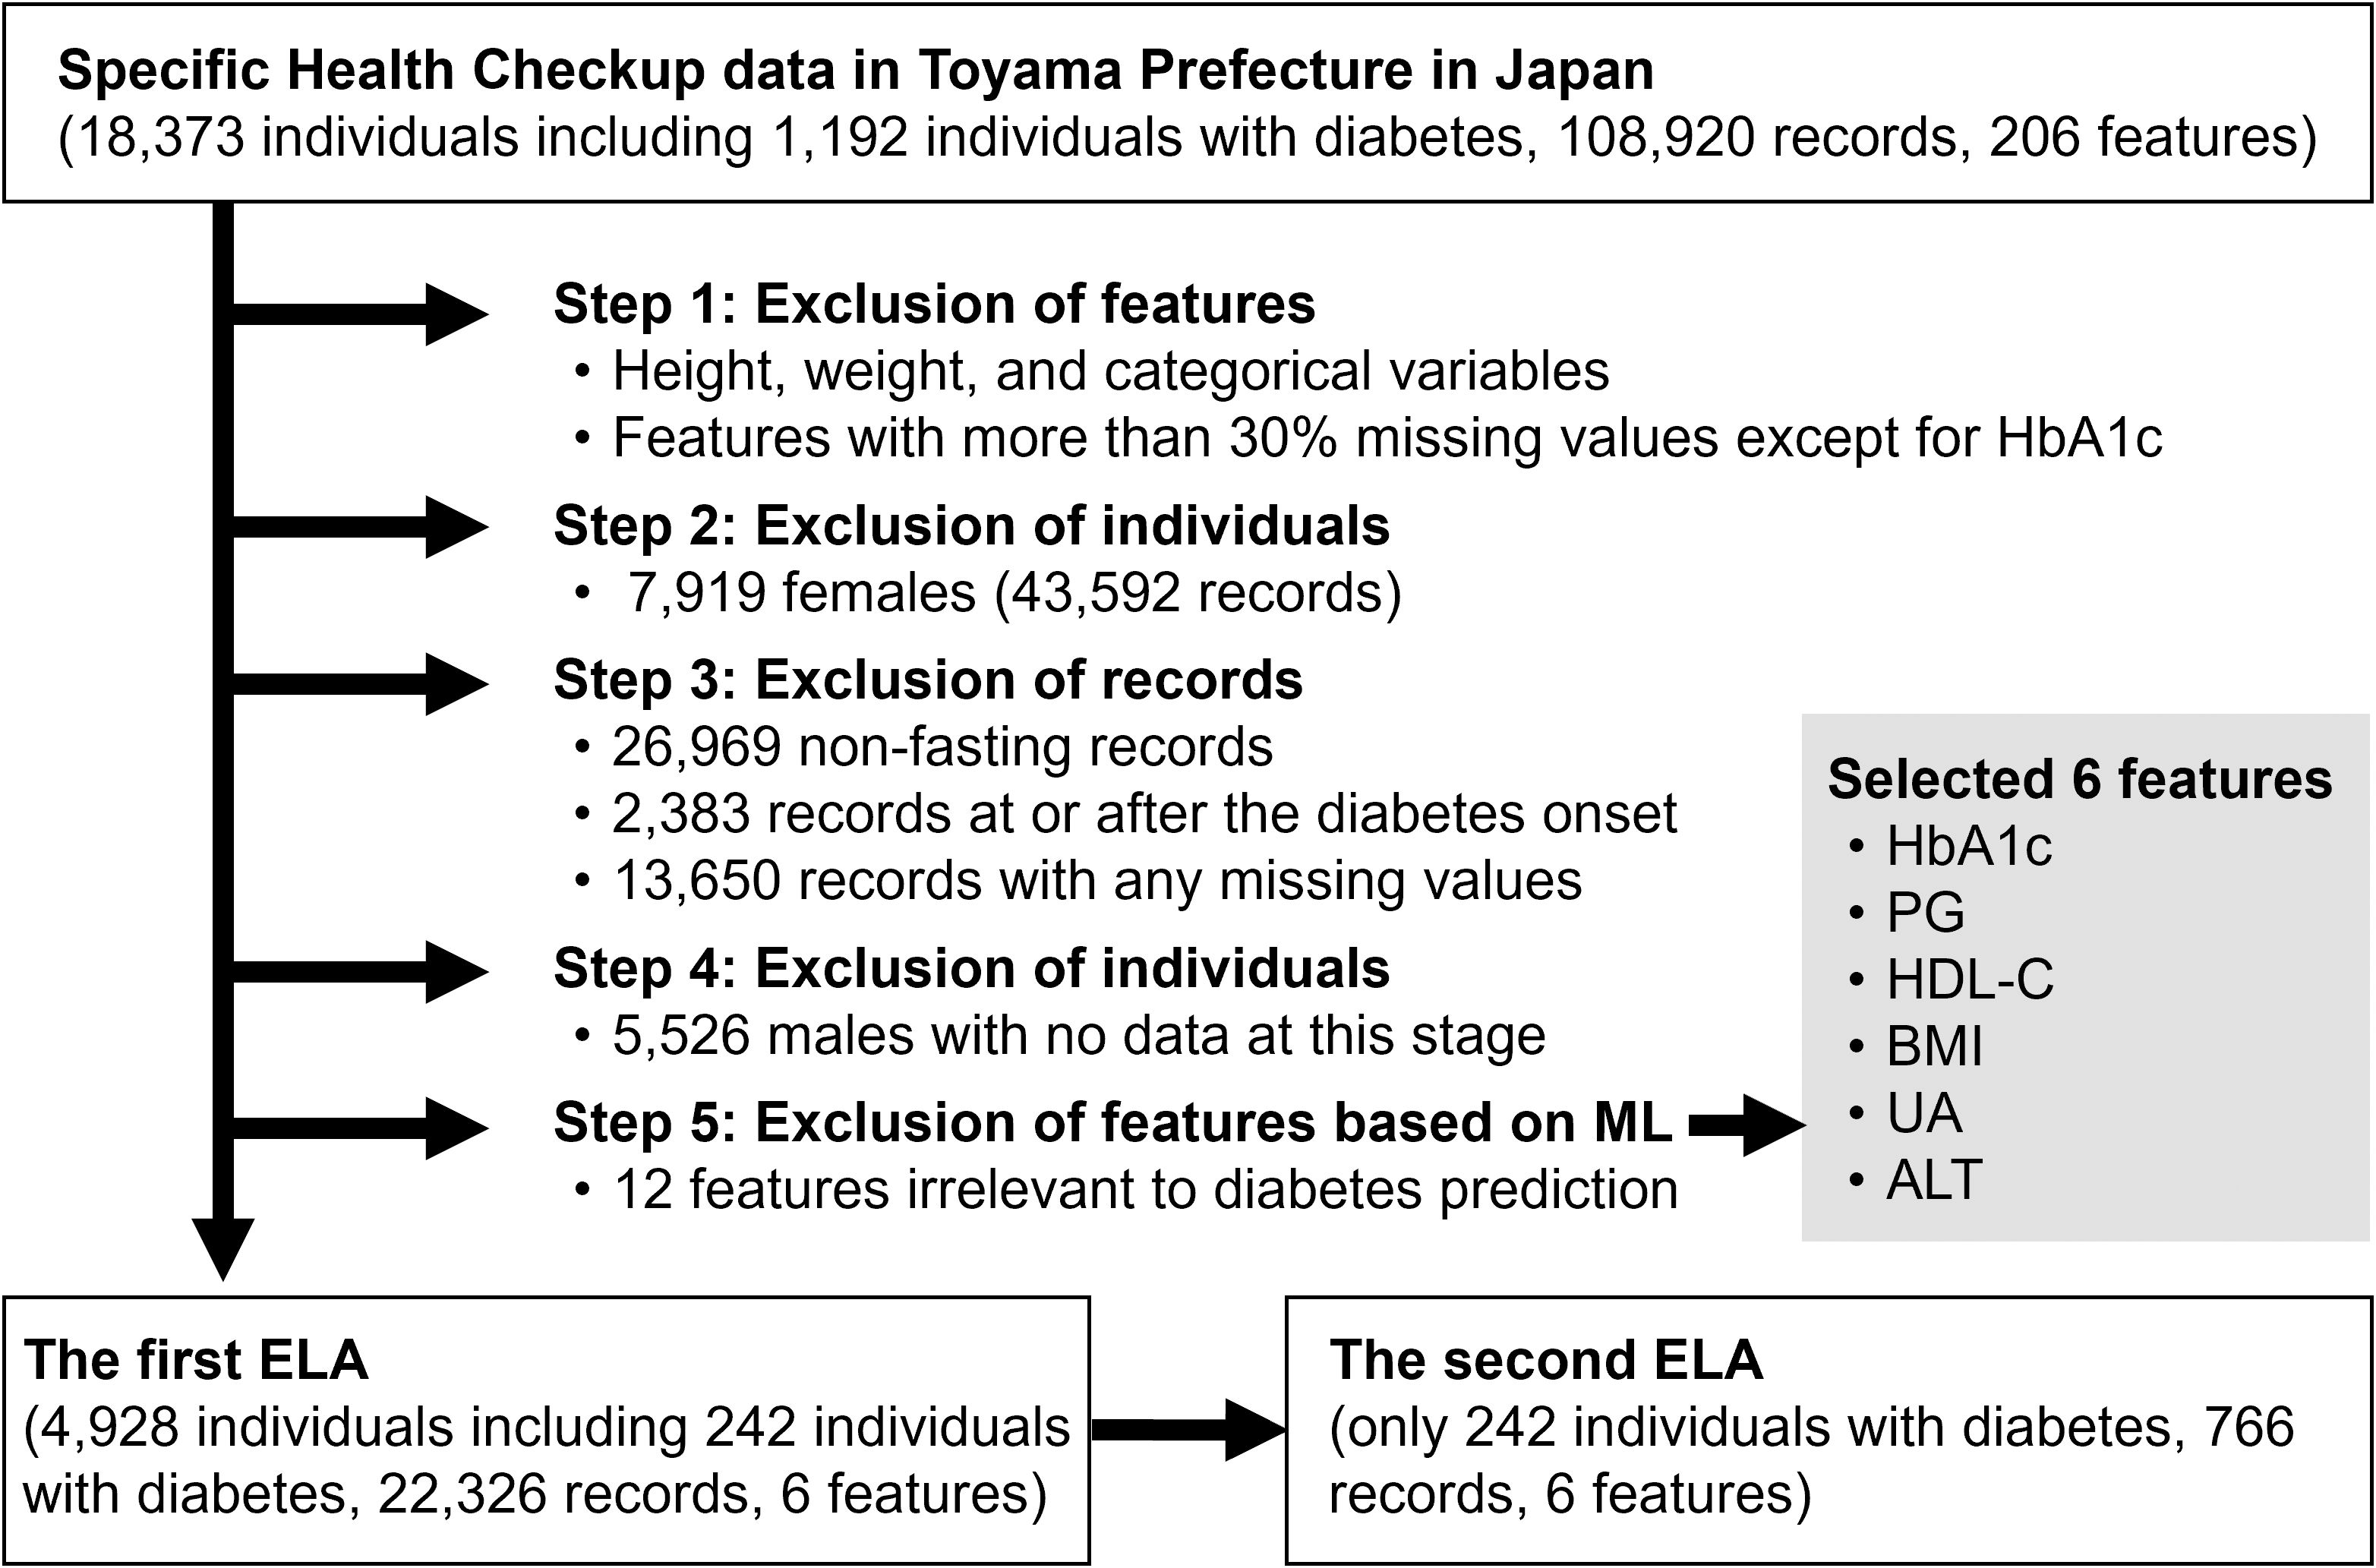
Figure 1. Flowchart of the study design. HbA1c, hemoglobin A1c; PG, plasma glucose; HDL-C, high-density lipoprotein-cholesterol; BMI, body mass index; UA, uric acid; ALT, alanine aminotransferase; ML, machine learning; ELA, energy landscape analysis.
In the second step, we excluded 7,919 females and their corresponding 43,592 records. We considered the influence of estrogen on insulin resistance and conducted the analysis exclusively on males. In the third step, we excluded records that met any of the following criteria: (a) records with non-fasting blood sampling (26,969 records), (b) records at or after the diabetes onset (2,383 records), and (c) records with any missing values among the 18 features (13,650 records). In the fourth step, we excluded 5,526 males with no data at this stage.
In the fifth step, we excluded features again based on ML prediction analysis. A random forest model was trained to predict whether an individual would develop diabetes within three years when given a single-year record of the individual on the 17 features except for HbA1c. The top five features that contributed most to predicting diabetes onset were PG, HDL-C, BMI, UA, and ALT. We added HbA1c to them as a clinically important feature, and the six features were selected for the following ELA. The 12 other features were excluded.
Finally, a subset of 22,326 records and 6 features from 4,928 individuals (males only, aged 56.0 ± 3.2 years) over a period of 5.26 ± 3.21 years was obtained and was used for the first ELA. Among the 4,928 individuals, 242 developed diabetes by 2020. The second ELA used the same data as the first ELA but was limited to 766 records from the 242 individuals with diabetes.
Our previous study (Shikata et al., unpublished) analyzed the same dataset from a completely different perspective. It focused on weight changes before diabetes onset and did not use ELA, whereas the present study used ELA to characterize multivariate transitions before diabetes onset. Therefore, the present study is complementary to the previous study.
2.4 Energy landscape analysis
The basic steps of ELA are feature selection, data binarization, Ising model fitting, basin graph calculation, and disconnectivity graph calculation. Detailed mathematical explanations are provided in Supplementary Text. In the feature selection step, several features to be analyzed should be selected. Using a large number of features not only increases the computational cost, but can lead to unreliable results. In the data binarization step, the values of the specified six features were converted to 0 or 1. To represent good health conditions as 0 and bad health conditions as 1, values less than or equal to the median of each feature were converted to 0, and all other values were converted to 1, except for HDL-C. For HDL-C, the assignment was reversed. After the binarization, the entire dataset was categorized into 26 = 64 patterns.
In the calculation of a basin graph, each pattern was expressed in a decimal number. For example, a pattern of “010111” was transformed to 0 + 16 + 0 + 4 + 2 + 1 = 23. For each pattern or node, a directed edge was drawn toward the node with the lowest energy among its neighborhood except for the local minimum patterns. We regarded each set of connected nodes of the basin graph as a “state.”
In the calculation of a disconnectivity graph, the height of the energy barrier for each pair of states was calculated. We also calculated a modified disconnectivity graph in which visits to patterns outside the two target states were prohibited.
We also counted the occurrence of state transitions. Two consecutive years of measurements of the same individual were analyzed. For example, when an individual was in state 1 in 2012 and changed to state 2 in 2013, the number of transitions from state 1 to state 2 was counted as 1. Transitions to the same state were included as self-transitions. Transitions between measurements separated by two years or more due to missing data were not counted.
2.5 Other statistical analysis
Mann-Whitney’s U-test and chi-squared test were used for between-group comparisons on numerical and categorical variables, respectively. Numerical variables were presented as the mean ± standard deviation. A p-value less than 0.05 was considered statistically significant.
2.6 Software
All statistical analyses were performed with Python version 3.10 (Python Software Foundation, Beaverton, OR, USA). We ported the original MATLAB code of ELA (32) to Python and used it.
2.7 Ethical approval
All procedures of the present study were performed in accordance with the 1964 Helsinki Declaration, its later amendments, and the “Ethical Guidelines for Medical and Biological Research Involving Human Subjects” published by the Ministry of Health, Labour and Welfare of Japan. The ethics committee of Toyama University Hospital approved the study protocol (approval number: R2021070, approved date: 2021/8/19). The study participants consented to the use of their data for scientific research.
2.8 Data and resource availability
The datasets generated during and/or analyzed in the current study are available from the corresponding authors upon reasonable request. The Python port of the ELA toolbox used in the current study is available in a GitHub repository https://github.com/okumakito/elapy under the Apache 2.0 license.
3 Results
3.1 Results of the first ELA
Figure 2 shows the results of the first ELA. The threshold values for the binarization were as follows: HbA1c, 5.6% (38 mmol/mol); PG, 95 mg/dL; HDL-C, 58 mg/dL; BMI, 23.3 kg/m2; UA, 6.1 mg/dL; and ALT, 22 U/L. Figure 2A shows the basin graph, which was separated into three states. The numbers of patterns belonging to states 1, 2, and 3 were 33, 5, and 26, respectively. The local minimum patterns of states 1, 2, and 3 were numbered 0, 15, and 63, respectively. The energy level of pattern 15 was higher than pattern 0 and pattern 63, indicating that state 2 was less frequent. Pattern 0 had the lowest energy level, indicating that state 1 was the most frequent.
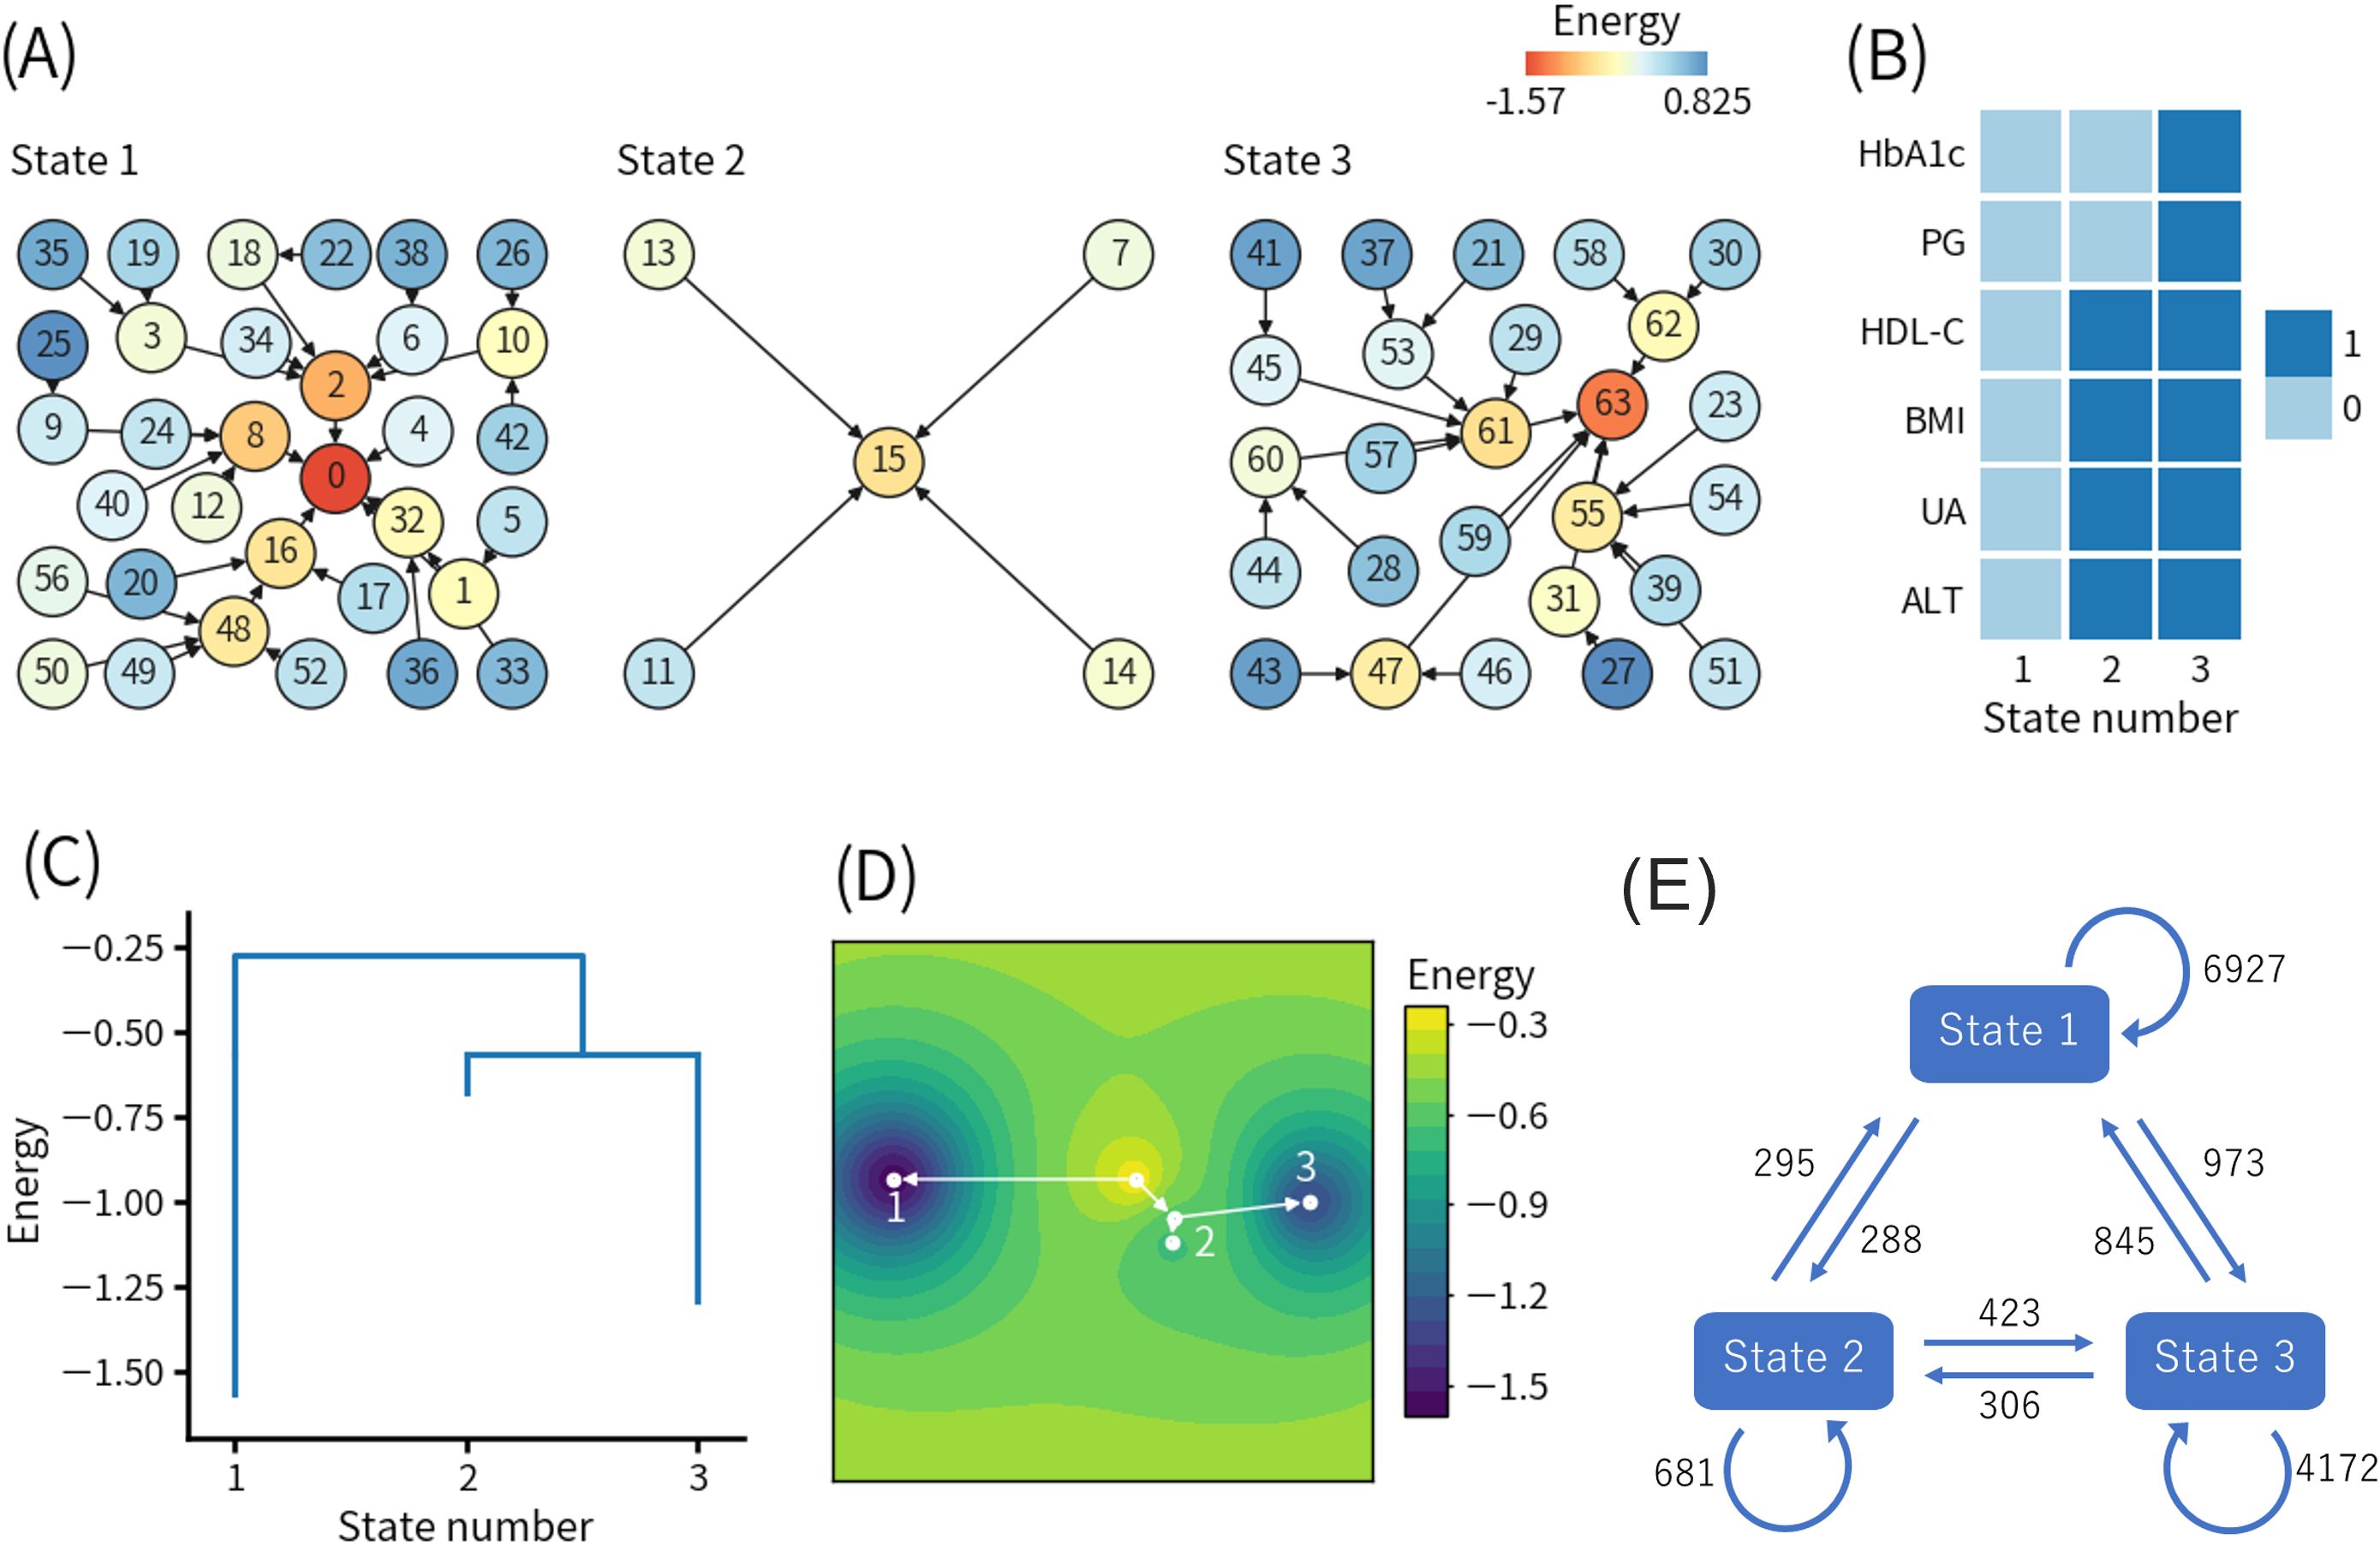
Figure 2. Results of the first energy landscape analysis. (A) Basin graph. The node number indicates the decimal representation of each binary pattern (see detail in the main text). The node color indicates the energy level of the node. Edges are drawn toward the minimum energy node within each node’s neighborhood. (B) Local minimum patterns of each state. 0 and 1 indicate relatively good and bad health conditions, respectively. (C) Disconnectivity graph. The height of paths connecting states indicates the height of energy barriers between states. The energy value for each state indicates the energy of the local minimum pattern of the state. (D) Energy landscape reconstructed from the disconnectivity graph. Movement is only allowed on the white lines. (E) State transition counts. The numbers in the figure indicate the total numbers of the events. HbA1c, hemoglobin A1c; PG, plasma glucose; HDL-C, high-density lipoprotein-cholesterol; BMI, body mass index; UA, uric acid; ALT, alanine aminotransferase.
Figure 2B shows the local minimum patterns of the three states. As explained earlier, the binary representations 0 and 1 indicate relatively good and bad health conditions, respectively. Therefore, states 1, 2, and 3 corresponded to healthy, intermediate, and unhealthy states in a relative sense, respectively.
Figure 2C shows the disconnectivity graph, and Figure 2D shows the energy landscape reconstructed from the disconnectivity graph. The energy barrier for the transition from state 1 to state 2 or 3 was higher than the energy barrier between state 2 and state 3, which was also close to the minimum energy level of state 2. Namely, the transition from state 1 to state 2 or 3 was more difficult than the transition between state 2 and state 3.
In addition, the modified disconnectivity graph shown in Supplementary Figure S1A revealed that the energy barrier between state 1 and state 3 increased when visits to state 2 were prohibited. Therefore, the direct transition from state 1 to state 3 (1-3 pathway) required to pass through a pattern with higher energy (i.e., a lower frequency of occurrence) than the transition from state 1 to state 3 via state 2 (1-2-3 pathway).
Figure 2E shows the state transition counts. The numbers of self-transitions of states 1, 2, and 3 were 6927, 681, and 4172, respectively, which were consistent with the numbers of patterns belonging to each state, as shown in Figure 2A. The numbers of transitions from state 1 to state 2 and from state 2 to state 3, which corresponded to the 1-2-3 pathway, were 288 and 423, respectively. Interestingly, the number of transitions directly from state 1 to state 3 was 973, which was more than twice the occurrences of the 1-2-3 pathway. Focusing on state 2, the number of transitions from state 2 to state 3 was higher than transitions from state 2 to state 1, which was also consistent with the disconnectivity graph, as shown in Figure 2C.
To identify the features contributing to the choice between the 1-2-3 pathway and the 1-3 pathway, we compared the values of each feature in the year before the transition for each type of state transition, as shown in Table 1. In the comparison between the transition from state 1 to state 2 and the transition from state 1 to state 3, significant differences were observed in BMI (24.0 ± 2.3 kg/m2 vs 23.3 ± 2.3 kg/m2, p ≤ 0.0001), WC (85.9 ± 6.8 cm vs 84.6 ± 6.7 cm, p ≤ 0.05), HDL-C (57.0 ± 10.9 mg/dL vs 60.5 ± 12.9 mg/dL, p ≤ 0.001), PG (88.5 ± 6.3 mg/dL vs 97.0 ± 9.7 mg/dL, p ≤ 0.0001), HbA1c (5.37 ± 0.19% (35.2 ± 2.1 mmol/mol) vs 5.69 ± 0.29% (38.7 ± 3.2 mmol/mol), p ≤ 0.0001), Cre (0.87 ± 0.13 mg/dL vs 0.86 ± 0.25 mg/dL, p ≤ 0.05), ALT (23.2 ± 11.1 U/L vs 21.2 ± 9.2 U/L, p ≤ 0.001), Hb (15.3 ± 1.0 g/dL vs 15.0 ± 1.0 g/dL, p ≤ 0.0001), and Ht (45.3 ± 2.6% vs 44.7 ± 2.8%, p ≤ 0.01).
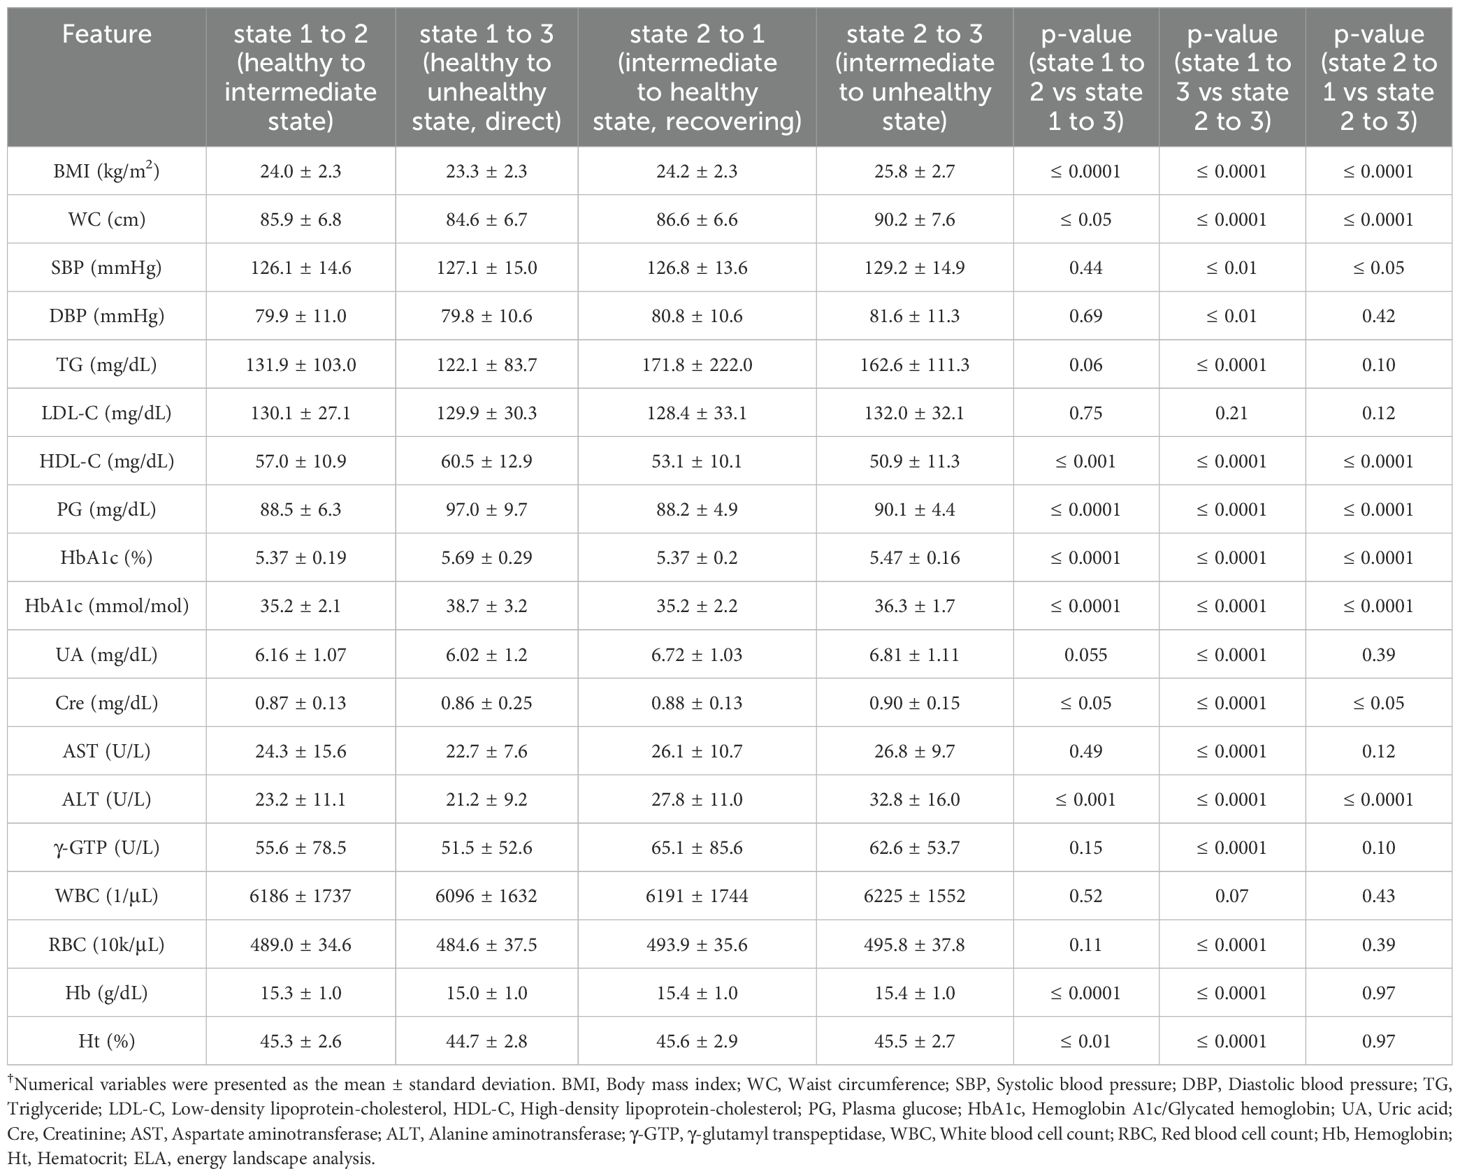
Table 1. Comparison of feature values in the year before the transition for the first ELA†.
In the comparison between the transition from state 1 to state 3 and the transition from state 2 to state 3 (Table 1), significant differences were observed in BMI (23.3 ± 2.3 kg/m2 vs 25.8 ± 2.7 kg/m2, p ≤ 0.0001), WC (84.6 ± 6.7 cm vs 90.2 ± 7.6 cm, p ≤ 0.0001), SBP (127.1 ± 15.0 mmHg vs 129.2 ± 14.9 mmHg, p ≤ 0.01), DBP (79.8 ± 10.6 mmHg vs 81.6 ± 11.3 mmHg, p ≤ 0.01), TG (122.1 ± 83.7 mg/dL vs 162.6 ± 111.3 mg/dL, p ≤ 0.0001), HDL-C (60.5 ± 12.9 mg/dL vs 50.9 ± 11.3 mg/dL, p ≤ 0.0001), PG (97.0 ± 9.7 mg/dL vs 90.1 ± 4.4 mg/dL, p ≤ 0.0001), HbA1c (5.69 ± 0.29% (38.7 ± 3.2 mmol/mol) vs 5.47 ± 0.16% (36.3 ± 1.7 mmol/mol), p ≤ 0.0001), UA (6.02 ± 1.2 mg/dL vs 6.81 ± 1.11 mg/dL, p ≤ 0.0001), Cre (0.86 ± 0.25 mg/dL vs 0.90 ± 0.15 mg/dL, p ≤ 0.0001), AST (22.7 ± 7.6 U/L vs 26.8 ± 9.7 U/L, p ≤ 0.0001), ALT (21.2 ± 9.2 U/L vs 32.8 ± 16.0 U/L, p ≤ 0.0001), γ-GTP (51.5 ± 52.6 U/L vs 62.6 ± 53.7 U/L, p ≤ 0.0001), RBC (484.6 ± 37.5 × 10⁴/μL vs 495.8 ± 37.8 × 10⁴/μL, p ≤ 0.0001), Hb (15.0 ± 1.0 g/dL vs 15.4 ± 1.0 g/dL, p ≤ 0.0001), and Ht (44.7 ± 2.8% vs 45.5 ± 2.7%, p ≤ 0.0001). Interestingly, PG and HbA1c levels were significantly higher in the transition from state 1 to 3 (1-3 pathway) than the transition from state 2 to 3 (1-2-3 pathway).
In addition, we compared the transition from state 2 to state 1 and the transition from state 2 to state 3 to identify features contributing to whether individuals in state 2 return to state 1 or worsen to state 3, as shown in Table 1. In that comparison, significant differences were observed in BMI (24.2 ± 2.3 kg/m2 vs 25.8 ± 2.7 kg/m2, p ≤ 0.0001), WC (86.6 ± 6.6 cm vs 90.2 ± 7.6 cm, p ≤ 0.0001), SBP (126.8 ± 13.6 mmHg vs 129.2 ± 14.9 mmHg, p ≤ 0.05), HDL-C (53.1 ± 10.1 mg/dL vs 50.9 ± 11.3 mg/dL, p ≤ 0.0001), PG (88.2 ± 4.9 mg/dL vs 90.1 ± 4.4 mg/dL, p ≤ 0.0001), HbA1c (5.37 ± 0.2% (35.2 ± 2.2 mmol/mol) vs 5.47 ± 0.16% (36.3 ± 1.7 mmol/mol), p ≤ 0.0001), Cre (0.88 ± 0.13 mg/dL vs 0.90 ± 0.15 mg/dL, p ≤ 0.05), and ALT (27.8 ± 11.0 U/L vs 32.8 ± 16.0 U/L, p ≤ 0.0001).
Because BMI was identified as one of the main factors determining the direction of state transitions, we stratified the individuals into the obese group with BMI ≥ 25 kg/m2 (n = 1,460) and the non-obese group with BMI < 25 kg/m2 (n = 3,468). Supplementary Figure S2 shows the state transition counts for the obese and non-obese groups. For the obese group, the numbers of transitions from state 1 to state 2, state 2 to state 3, and state 1 to state 3 were 78, 222, and 191, respectively. For the non-obese group, the numbers of transitions from state 1 to state 2, state 2 to state 3, and state 1 to state 3 were 210, 201, and 782, respectively. The obese group significantly preferred the transition from state 1 to state 2 over the transition from state 1 to state 3 than the non-obese group (p = 0.0085). The obese group also significantly preferred the transition from state 2 to state 3 over the transition from state 1 to state 3 than the non-obese group (p < 0.0001).
3.2 Results of the second ELA limited to individuals with diabetes
The second ELA targeted only the data of the 242 individuals who developed diabetes by 2020. As with the first ELA, all records at or after the diabetes onset were excluded to focus on the period before diabetes onset. Figure 3 shows the results of the second ELA. The threshold values for the data binarization were as follows: HbA1c, 6.2% (44 mmol/mol); PG, 112 mg/dL; HDL-C, 49 mg/dL; BMI, 25.8 kg/m2; UA, 6.1 mg/dL; and ALT, 33 U/L. It should be noted that the meanings of patterns with the same numbers in Figures 2, 3 are quantitatively different.
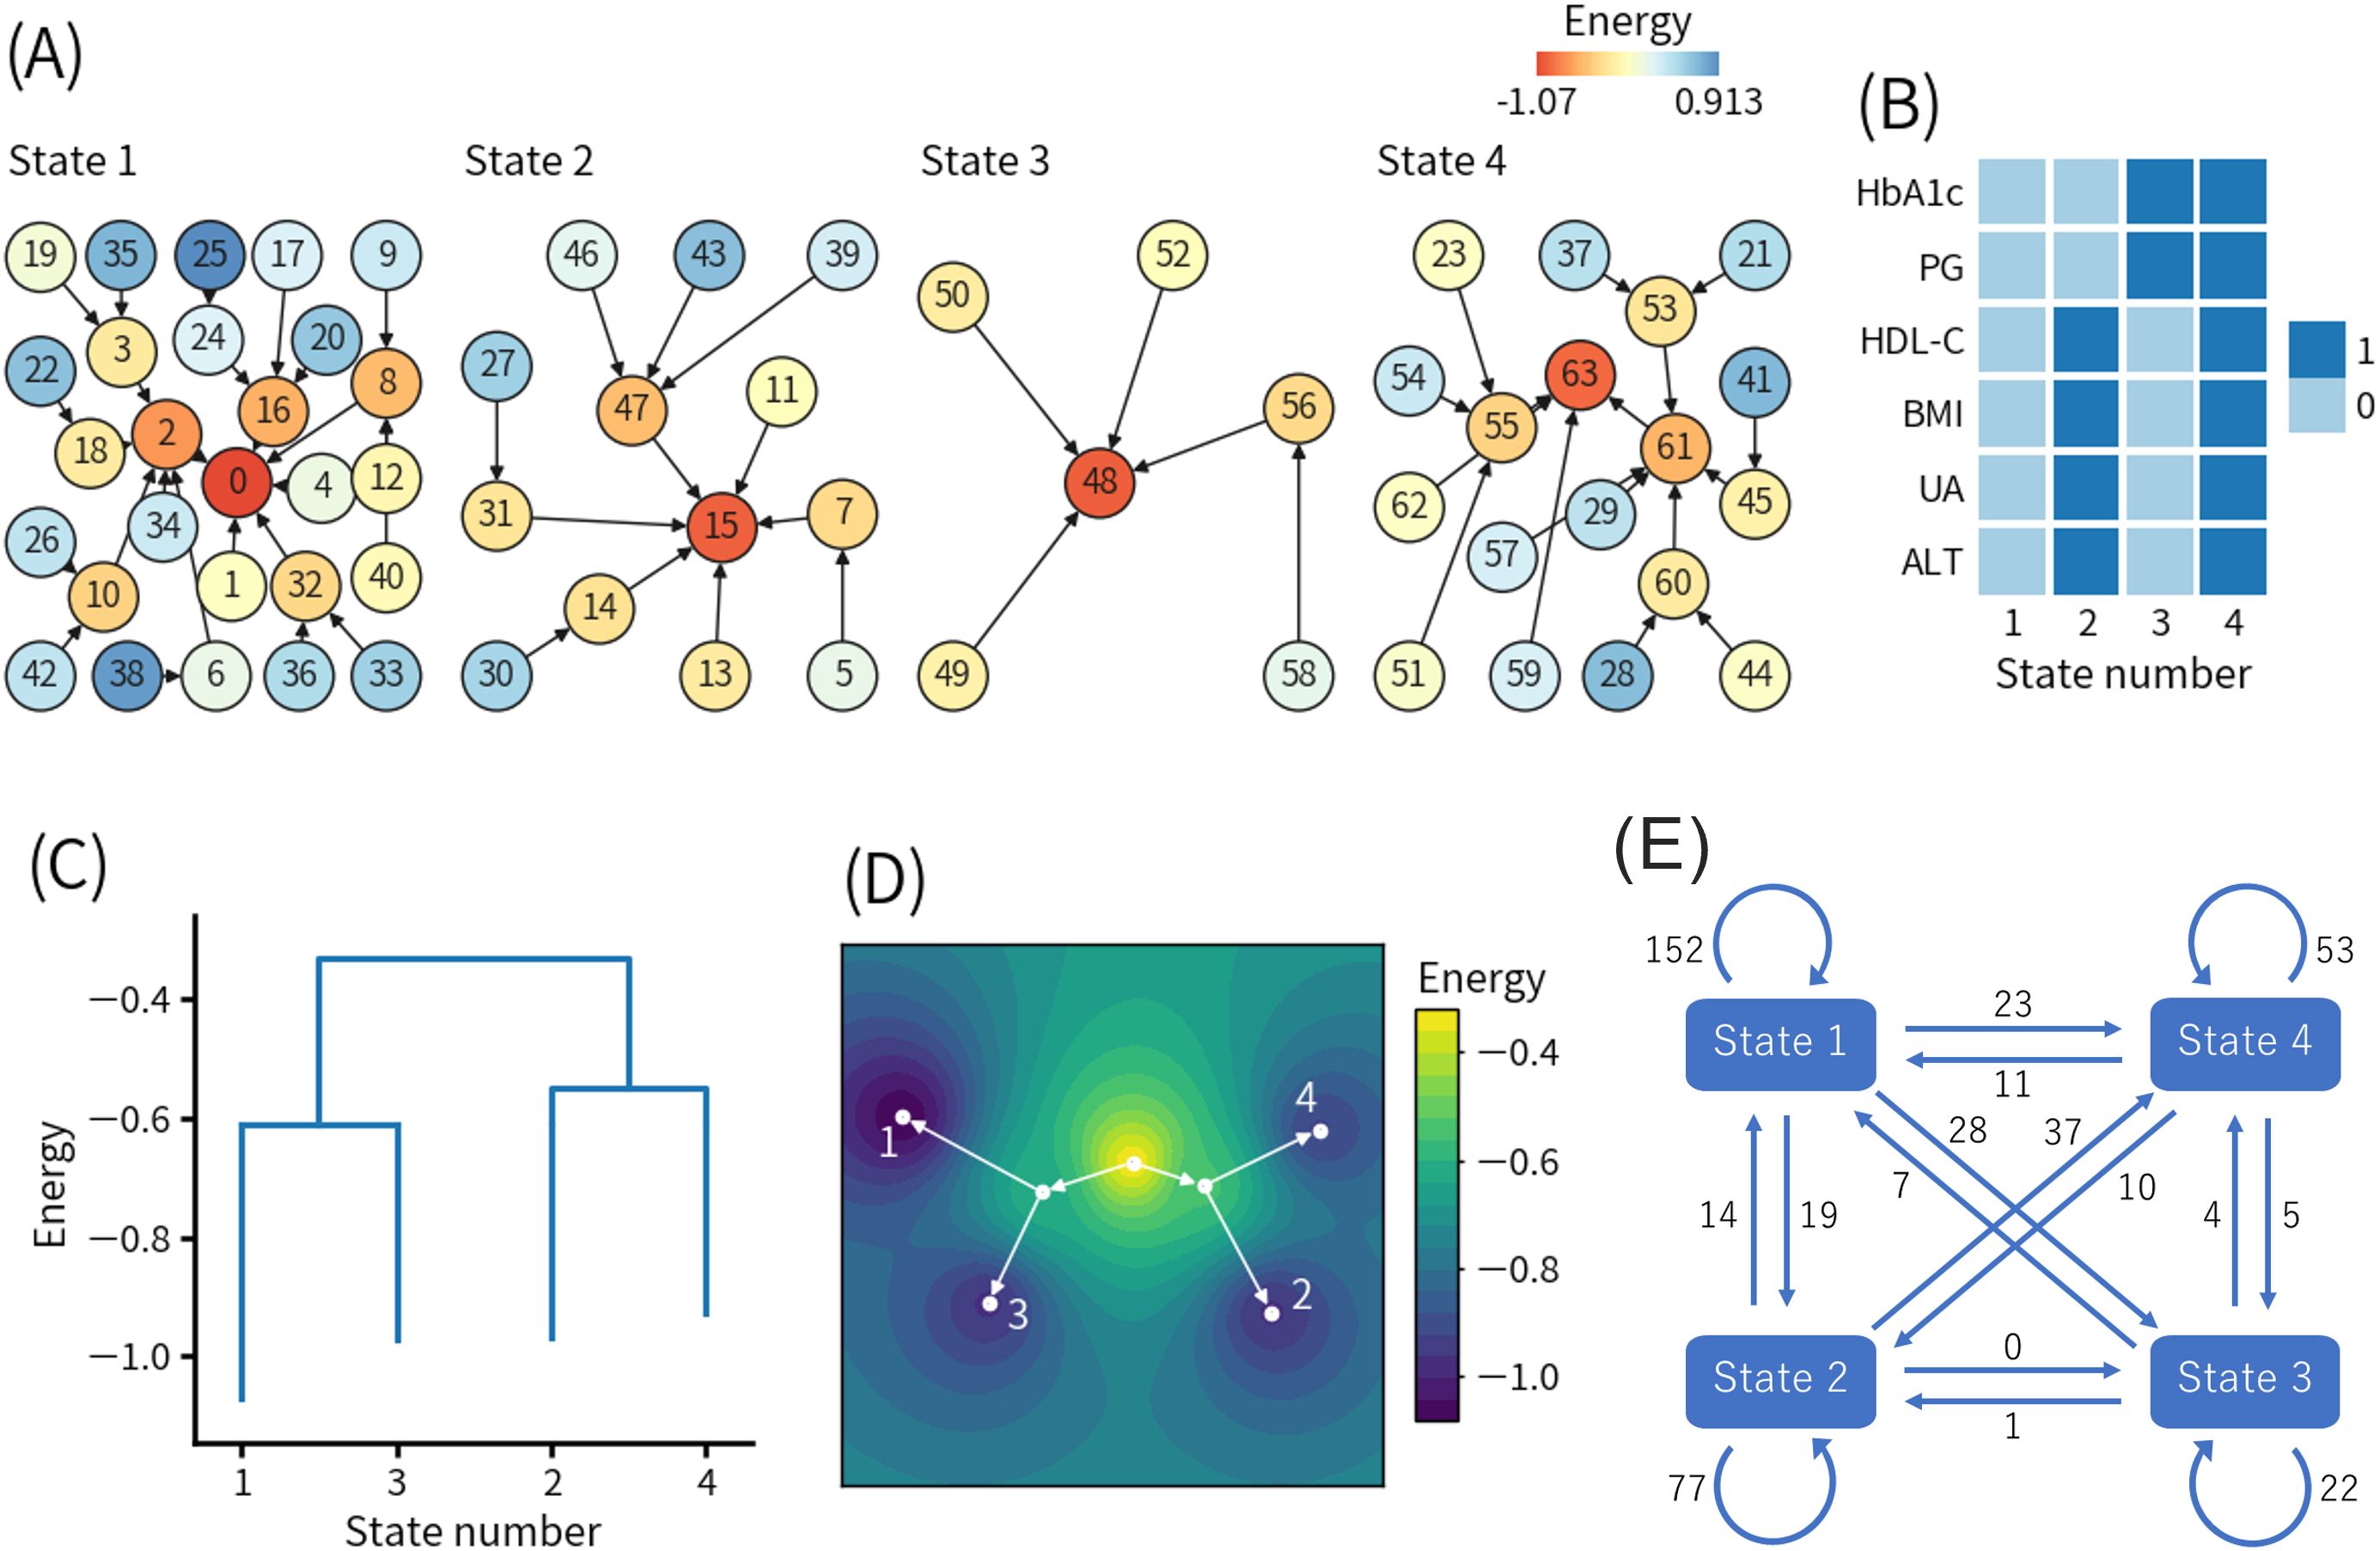
Figure 3. Results of the second energy landscape analysis. (A) Basin graph. The node number indicates the decimal representation of each binary pattern (see detail in the main text). The node color indicates the energy level of the node. Edges are drawn toward the minimum energy node within each node’s neighborhood. (B) Local minimum patterns of each state. 0 and 1 indicate relatively good and bad health conditions, respectively. (C) Disconnectivity graph. The height of paths connecting states indicates the height of energy barriers between states. The energy value for each state indicates the energy of the local minimum pattern of the state. (D) Energy landscape reconstructed from the disconnectivity graph. Movement is only allowed on the white lines. (E) State transition counts. The numbers in the figure indicate the total numbers of the events. HbA1c, hemoglobin A1c; PG, plasma glucose; HDL-C, high-density lipoprotein-cholesterol; BMI, body mass index; UA, uric acid; ALT, alanine aminotransferase.
Figure 3A shows the basin graph, which was separated into four states. The numbers of patterns belonging to states 1, 2, 3, and 4 were 27, 13, 6, and 18, respectively. The local minimum patterns of states 1, 2, 3, and 4 were numbered 0, 15, 48, and 63, respectively.
Figure 3B shows the local minimum patterns of the four states. State 1 and state 4 corresponded to healthy and unhealthy states in a relative sense. State 2 and state 3 seemingly corresponded to different types of intermediate states between state 1 and state 4. However, state 3 had high HbA1c and PG levels, and there were not many transitions from state 3 to state 4, indicating that there were direct transitions from state 3 to diabetes. Only state 3 was not found in the first ELA.
Figure 3C shows the disconnectivity graph, and Figure 3D shows the energy landscape reconstructed from the disconnectivity graph. The energy barriers between state 1 and state 3 and between state 2 and state 4 were much lower than the energy barrier for the transition from state 1 or 3 to state 2 or 4. In other words, state 1 was more likely to transition to state 3, and state 2 was more likely to transition to state 4 compared to other states. In both the transition from state 1 to state 3 (1-3 pathway) and the transition from state 2 to state 4 (2-4 pathway), HbA1c and PG increased and exceeded the binarization thresholds, whereas the other four features did not change beyond the binarization thresholds. The modified disconnectivity graph shown in Supplementary Figure S1B revealed that the energy barrier between state 1 and state 4 increased when visits to state 2 and state 3 were prohibited.
Figure 3E shows the state transition counts. The self-transitions of states 1, 2, 3, and 4 were 152, 77, 22, and 53 times, respectively. Except for the self-transitions, the top two most frequent transitions were 37 times from state 2 to state 4 and 28 times from state 1 to state 3, which were consistent with the disconnectivity graph, as shown in Figure 3C.
To clarify the characteristics of the 1-3 pathway and the 2-4 pathway, we compared the transition from state 1 to state 3 and the transition from state 2 to state 4, as shown in Supplementary Table S3. In that comparison, significant differences were observed in BMI (23.8 ± 2.3 kg/m2 vs 29.3 ± 3.4 kg/m2, p ≤ 0.0001), WC (84.9 ± 5.0 cm vs 99.1 ± 8.9 cm, p ≤ 0.0001), DBP (78.7 ± 10.1 mmHg vs 84.5 ± 9.7 mmHg, p ≤ 0.01), TG (126.7 ± 64.0 mg/dL vs 181.6 ± 91.4 mg/dL, p ≤ 0.01), HDL-C (55.3 ± 13.0 mg/dL vs 44.6 ± 9.0 mg/dL, p ≤ 0.001), PG (112.0 ± 6.6 mg/dL vs 108.6 ± 7.3 mg/dL, p ≤ 0.05), UA (5.82 ± 1.36 mg/dL vs 7.22 ± 1.22 mg/dL, p ≤ 0.001), AST (23.9 ± 7.5 U/L vs 37.2 ± 16.0 U/L, p ≤ 0.0001), ALT (26.7 ± 15.9 U/L vs 53.0 ± 23.9 U/L, p ≤ 0.0001), and γ-GTP (62.0 ± 92.5 U/L vs 76.6 ± 60.9 U/L, p ≤ 0.01). Interestingly, PG level was significantly higher in the transition from state 1 to 3 than the transition from state 2 to 4.
4 Discussion
4.1 Summary of key findings
The present study demonstrated that ELA could indicate different pathways of diabetes development in obese and non-obese individuals in a data-driven manner. Previous studies reported that type 2 diabetes can be divided into five subgroups using machine learning methods (33–36). It was also reported that type 2 diabetes can be classified into eight subgroups using genome-wide association studies (37). Our findings suggest that the recently emerging idea that diabetes is more heterogeneous than previously thought applies even before onset. Specifically, we found that obese individuals significantly preferred to visit an intermediate state with increased BMI and deteriorated HDL-C, UA, and ALT levels. We also found that non-obese individuals were at risk for elevated PG and HbA1c without passing through the intermediate state. These insights could inform more targeted diabetes prevention measures, such as reducing visceral fat in obese individuals and protecting beta-cells in non-obese individuals. Detailed discussion is given below.
4.2 Comparison of ELA and other methods
Our findings suggest that ELA is a powerful tool for investigating trajectories before the diabetes onset. A previous study used a linear mixed model to analyze trajectories of BMI and WC before the diabetes onset (38). It reported that individuals who progressed from pre-diabetes to diabetes showed significantly greater pre-onset increases in both BMI and WC compared to individuals who remained in pre-diabetes. Another previous study used a latent class trajectory analysis, in which a linear mixed model was used, to analyze BMI trajectories before the diabetes onset (39). It reported that even in the normoglycemic group, an increasing BMI trend was associated with the risk of type 2 diabetes. In contrast to these linear models, ELA can capture nonlinear trajectories, such as multiple transitions between a healthy state and a pre-disease state, i.e., repeated declines and recoveries in health status. Therefore, ELA is expected to work as a complementary tool to existing linear models and contribute to adding new insights.
Cluster analysis is another powerful method. Using it, previous studies successfully identified novel subgroups of diabetes in a data-driven manner (33, 34). Although there have been no studies comparing cluster analysis and ELA in detail, cluster analysis may be able to detect multiple stable states before the diabetes onset, similar to ELA. However, it is generally believed that ELA is suitable for cases where the status of the target system (for example, an individual’s health status) switches between multiple states over time (20–26). Another difference is that the data binarization in ELA may improve noise tolerance at the expense of loss of quantitative information. It is an important future work to clarify the advantages and disadvantages of ELA against cluster analysis as well as other existing methods.
4.3 Interpretation of the pre-disease states identified in the first ELA
The results of the first ELA suggest that multiple pre-disease states exist between the healthy state and the diabetes onset. It should be noted that the unhealthy state does not correspond to diabetes because we removed all records at or after the diabetes onset from the analysis. We expect that the unhealthy state mainly corresponds to pre-diabetes, which is impaired fasting glucose (IFG) and/or impaired glucose tolerance (IGT). Pre-diabetes is a well-known pre-disease state of diabetes with established diagnostic criteria (27, 40). It is natural that the unhealthy state corresponding to pre-diabetes was detected as a distinct pre-disease state in our analysis.
On the other hand, the intermediate state (another pre-disease state) had fasting PG less than 95 mg/dL and HbA1c less than 5.6% (38 mmol/mol), and thus it is at least not IFG, and probably not IGT either. Previous studies reported that even before pre-diabetes, higher fasting PG was associated with a higher risk of type 2 diabetes (41). The idea that the stages before pre-diabetes are also clinically important is consistent with our results. Previous studies also reported that UA and ALT were risk factors for diabetes (42, 43), which is consistent with our results. Because we detected the intermediate state using a data-driven approach without a priori assumptions, our findings suggest the importance of further research on such early stages.
4.4 Interpretation of the multiple pathways identified in the first ELA
Next, our results suggest that obese individuals with visceral fat accumulation tended to visit the intermediate state (1-2-3 pathway), whereas non-obese individuals with relatively high PG and HbA1c levels tended to directly transit to the unhealthy state (1-3 pathway). A possible explanation is that the individuals who visited the intermediate state had higher potential capacity for insulin secretion than the others. Insulin secretion generally promotes blood glucose uptake by muscle and adipose tissues (44), lowering PG immediately and HbA1c over a longer time scale. The glucose taken up by the adipose tissues was converted to TG for storage, contributing to the increases in BMI and WC. As abdominal obesity progresses, insulin resistance occurs, and insulin secretion increases due to the compensatory response of beta-cells (45, 46). Taken together, the intermediate state with high BMI and relatively low PG and HbA1c levels may correspond to a state with mild insulin resistance before reaching the maximum capacity of insulin secretion.
In contrast, individuals with insufficient insulin secretion capacity should have relatively high PG and HbA1c, but at the same time, adipose tissue hypertrophy may be suppressed. Non-obese people generally have lower potential insulin secretion capacity than obese people (47). In addition, previous studies have revealed that insulin sensitivity and insulin secretion are inversely related (45, 46).
Therefore, the 1-2-3 and 1-3 pathways may be relatively associated with insulin resistance and beta-cell dysfunction, respectively. This interpretation is consistent with the drug selection algorithm for patients with type 2 diabetes in Japan that basically assumes insulin resistance in obese patients and insulin secretion deficiency in non-obese patients (48). Our study demonstrated in a data-driven manner that the widely recognized differences between obese and non-obese patients with diabetes also apply before the onset.
Previous studies also reported that East Asians including Japanese have lower insulin secretion capacity than Caucasian, and the decline of insulin secretion capacity is a major factor in the development and progression of glucose intolerance in Japanese people even at an early stage (49–54). This may explain why more individuals took the 1-3 pathway than the 1-2-3 pathway.
4.5 Interpretation of the results of the second ELA
The results of the second ELA suggest that obese and non-obese individuals tended to take different pathways, which is consistent with the first ELA. The 1-2-3 and 1-3 pathways of the first ELA may primarily correspond to the 2-4 and 1-3 pathways of the second ELA, respectively. An important finding is that non-obese individuals may exhibit increases in HbA1c and PG without remarkable changes in HDL-C, BMI, UA, and ALT. As we argued for the first ELA, such a pathway would be mainly associated with beta-cell dysfunction, which is common in Japanese people.
4.6 Clinical implications
In the first ELA, we found that those who could return from the intermediate state to the healthy state had significantly lower BMI and WC than those who deteriorated from the intermediate state to the unhealthy state. This suggests that reducing body weight and visceral fat in the intermediate state through lifestyle guidance and administration of anti-obesity drugs is effective for diabetes prevention, which is consistent with common understanding.
In both the first ELA and second ELA, we found that non-obese individuals preferred to transition directly to a state of elevated HbA1c and PG levels, which corresponds to a pre-disease state of diabetes. Therefore, non-obese individuals should also be careful about their HbA1c and PG levels, and when their HbA1c and PG levels become high, they are recommended to improve their lifestyle habits such as exercise and diet to protect beta-cells and prevent diabetes. It has also been reported that changing the order of meals, such as taking dietary fiber before carbohydrates, effectively suppresses postprandial hyperglycemia (55), which damages beta-cells.
4.7 Limitations
The present study has several limitations. First, the present study focused on men aged 55.8 ± 3.3 years who underwent Specific Health Checkups in Toyama Prefecture from April 2012 to March 2021. This selection bias must be considered when interpreting the results. Recent studies have highlighted the importance of diabetes not only for older men but also for women and young people (56, 57). Second, the average observation period was about five years, which is shorter than the typical period from a healthy state without visceral fat accumulation to metabolic syndrome and ultimately diabetes. Our findings should be limited to phenomena relatively close to the diabetes onset. Third, the health checkup data analyzed in the present study did not contain data on insulin, race, family health history, and accurate diagnosis including discrimination between type 1 and type 2 diabetes as well as more detailed stratification (34–37). Fourth, the results of the ELA were based on only six features. This is a general limitation of ELA in that increasing the number of features remarkably reduces the reliability of the results.
It is future tasks to apply ELA to females, younger or elder individuals, data from other regions, long-term data, detailed clinical data, and different combinations of features relevant to other lifestyle diseases. In particular, prospective studies in relatively small populations including oral glucose tolerance test and insulin measurements would be useful to verify the clinical relevance of our findings.
Data availability statement
The data analyzed in this study is subject to the following licenses/restrictions: the participants in this study did not consent to have their data publicly available. Requests to access these datasets should be directed to Makito Oku,b2t1QGN0cy51LXRveWFtYS5hYy5qcA==; Keiichi Ueda,a3VlZGFAc2NpLnUtdG95YW1hLmFjLmpw.
Ethics statement
The studies involving humans were approved by the ethics committee of Toyama University Hospital. The studies were conducted in accordance with the local legislation and institutional requirements. The participants provided their written informed consent to participate in this study.
Author contributions
RI: Formal Analysis, Methodology, Software, Visualization, Writing – original draft. MO: Software, Supervision, Writing – review & editing. IK: Supervision, Writing – review & editing. TH: Supervision, Writing – review & editing. MS: Writing – review & editing. TT: Writing – review & editing. DC: Writing – review & editing. MI: Writing – review & editing. SF: Writing – review & editing. YN: Data curation, Resources, Writing – review & editing. TY: Data curation, Resources, Writing – review & editing. MK: Conceptualization, Project administration, Writing – review & editing. KT: Conceptualization, Project administration, Writing – review & editing. SS: Funding acquisition, Project administration, Writing – review & editing. KU: Methodology, Supervision, Writing – original draft, Writing – review & editing.
Funding
The author(s) declare that financial support was received for the research and/or publication of this article. This research was supported by Japan Science and Technology Agency (JST) Moonshot R&D Grant Number JPMJMS2021.
Acknowledgments
The authors thank the clinical staff for collecting the health checkup data.
Conflict of interest
KT received lecture fees from MSD K.K., Novo Nordisk Pharma Ltd., Kowa Pharmaceutical Co. Ltd.; grants from Daiichi Sankyo Co. Ltd., Ono Pharmaceutical Co. Ltd., Takeda Pharmaceutical Co. Ltd., Nippon Boehringer Ingelheim Co. Ltd., MSD K.K., Mitsubishi Tanabe Pharma Corporation, Novo Nordisk Pharma Ltd., Teijin Pharma Limited, Eli Lilly Japan K.K., Asahi Kasei Pharma Corporation, The Mitsubishi Foundation, Japan Diabetes Foundation and Suntory Global Innovation Center Ltd., Medical corporation association Shikinokai, Medical corporation association Shichitokukai, Heiseikai Medical corporation association Sakurai Hospital, and Kuwayamakai Medical corporation association Tanbo Hospital.
The remaining authors declare that the research was conducted in the absence of any commercial or financial relationships that could be constructed as a potential conflict of interest.
Generative AI statement
The author(s) declare that no Generative AI was used in the creation of this manuscript.
Publisher’s note
All claims expressed in this article are solely those of the authors and do not necessarily represent those of their affiliated organizations, or those of the publisher, the editors and the reviewers. Any product that may be evaluated in this article, or claim that may be made by its manufacturer, is not guaranteed or endorsed by the publisher.
Supplementary material
The Supplementary Material for this article can be found online at: https://www.frontiersin.org/articles/10.3389/fendo.2025.1576431/full#supplementary-material
Abbreviations
ALT, alanine aminotransferase; AST, aspartate aminotransferase; BMI, body mass index; Cre, creatinine; DBP, diastolic blood pressure; ELA, energy landscape analysis; Hb, hemoglobin; HbA1c, hemoglobin A1c/glycated hemoglobin; HDL-C, high-density lipoprotein-cholesterol; Ht, hematocrit; LDL-C, low-density lipoprotein-cholesterol; ML, machine learning; PG, plasma glucose; RBC, red blood cell count; ROC, receiver operating characteristic; SBP, systolic blood pressure; TG, triglyceride; UA, uric acid; WBC, white blood cell count; WC, waist circumference; γ-GTP, γ-glutamyl transpeptidase.
References
2. Sun H, Saeedi P, Karuranga S, Pinkepank M, Ogurtsova K, Duncan BB, et al. IDF Diabetes Atlas: Global, regional and country-level diabetes prevalence estimates for 2021 and projections for 2045. Diabetes Res Clin Pract. (2022) 183:109119. doi: 10.1016/j.diabres.2021.109119
3. Knowler WC, Barrett-Connor E, Fowler SE, Hamman RF, Lachin JM, Walker EA, et al. Reduction in the incidence of type 2 diabetes with lifestyle intervention or metformin. N Engl J Med. (2002) 346:393–403. doi: 10.1056/nejmoa012512
4. Schellenberg ES, Dryden DM, Vandermeer B, Ha C, Korownyk C. Lifestyle interventions for patients with and at risk for type 2 diabetes: A systematic review and meta-analysis. Ann Intern Med. (2013) 159:543–51. doi: 10.7326/0003-4819-159-8-201310150-00007
5. American Diabetes Association Professional Practice Committee. Prevention or delay of diabetes and associated comorbidities: Standards of care in diabetes-2025. Diabetes Care. (2025) 48:S50–8. doi: 10.2337/dc25-S003
6. Koizumi K, Oku M, Hayashi S, Inujima A, Shibahara N, Chen L, et al. Identifying pre-disease signals before metabolic syndrome in mice by dynamical network biomarkers. Sci Rep. (2019) 9:8767. doi: 10.1038/s41598-019-45119-w
7. Yonezawa S, Haruki T, Koizumi K, Taketani A, Oshima Y, Oku M, et al. Establishing monoclonal gammopathy of undetermined significance as an independent pre-disease state of multiple myeloma using Raman spectroscopy, dynamical network biomarker theory, and energy landscape analysis. Int J Mol Sci. (2024) 25:1570. doi: 10.3390/ijms25031570
8. Akagi K, Jin YJ, Koizumi K, Oku M, Ito K, Shen X, et al. Integration of dynamical network biomarkers, control theory and Drosophila model identifies Vasa/DDX4 as the potential therapeutic targets for metabolic syndrome. Cells. (2025) 14:415. doi: 10.3390/cells14060415
9. Tsushita K, Hosler A S, Miura K, Ito Y, Fukuda T, Kitamura A, et al. Rationale and descriptive analysis of specific health guidance: The nationwide lifestyle intervention program targeting metabolic syndrome in Japan. J Atheroscler Thromb. (2018) 25:308–22. doi: 10.5551/jat.42010
10. Nanri A, Nakagawa T, Kuwahara K, Yamamoto S, Honda T, Okazaki H, et al. Development of risk score for predicting 3-year incidence of type 2 diabetes: Japan epidemiology collaboration on occupational health study. PloS One. (2015) 10:e0142779. doi: 10.1371/journal.pone.0142779
11. Hu H, Nakagawa T, Yamamoto S, Honda T, Okazaki H, Uehara A, et al. Development and validation of risk models to predict the 7-year risk of type 2 diabetes: The Japan epidemiology collaboration on occupational health study. J Diabetes Investig. (2018) 9:1052–9. doi: 10.1111/jdi.12809
12. Xiong XL, Zhang RX, Bi Y, Zhou WH, Yu Y, Zhu DL. Machine learning models in type 2 diabetes risk prediction: Results from a cross-sectional retrospective study in Chinese adults. Curr Med Sci. (2019) 39:582–8. doi: 10.1007/s11596-019-2077-4
13. Lai H, Huang H, Keshavjee K, Guergachi A, Gao X. Predictive models for diabetes mellitus using machine learning techniques. BMC Endocr Disord. (2019) 19:101. doi: 10.1186/s12902-019-0436-6
14. Deberneh HM, Kim I. Prediction of type 2 diabetes based on machine learning algorithm. Int J Environ Res Public Health. (2021) 18:3317. doi: 10.3390/ijerph18063317
15. Joshi RD, Dhakal CK. Predicting type 2 diabetes using logistic regression and machine learning approaches. Int J Environ Res Public Health. (2021) 18:7346. doi: 10.3390/ijerph18147346
16. Seto H, Oyama A, Kitora S, Toki H, Yamamoto R, Kotoku J, et al. Gradient boosting decision tree becomes more reliable than logistic regression in predicting probability for diabetes with big data. Sci Rep. (2022) 12:15889. doi: 10.1038/s41598-022-20149-z
17. Kodama S, Fujihara K, Horikawa C, Kitazawa M, Iwanaga M, Kato K, et al. Predictive ability of current machine learning algorithms for type 2 diabetes mellitus: A meta-analysis. J Diabetes Investig. (2022) 13:900–8. doi: 10.1111/jdi.13736
18. Kaliappan J, Saravana Kumar IJ, Sundaravelan S, Anesh T, Rithik RR, Singh Y, et al. Analyzing classification and feature selection strategies for diabetes prediction across diverse diabetes datasets. Front Artif Intell. (2024) 7:1421751. doi: 10.3389/frai.2024.1421751
19. Munekawa C, Horiguchi G, Naito A, Hamaguchi M, Kurogi K, Murata H, et al. Development of a prediction model for predicting 10-year incidence of type 2 diabetes in Japanese people; Panasonic cohort study 7. Diabetes Metab Res Rev. (2025) 41:e70040. doi: 10.1002/dmrr.70040
20. Ezaki T, Watanabe T, Ohzeki M, Masuda N. Energy landscape analysis of neuroimaging data. Philos Trans A Math Phys Eng Sci. (2017) 375:20160287. doi: 10.1098/rsta.2016.0287
21. Watanabe T, Rees G. Brain network dynamics in high-functioning individuals with autism. Nat Commun. (2017) 8:16048. doi: 10.1038/ncomms16048
22. Suzuki K, Nakaoka S, Fukuda S, Masuya H. Energy landscape analysis elucidates the multistability of ecological communities across environmental gradients. Ecol Monographs. (2021) 91:e01469. doi: 10.1002/ecm.1469
23. Yamamoto K, Sakaguchi M, Onishi A, Yokoyama S, Matsui Y, Yamamoto W, et al. Energy landscape analysis and time-series clustering analysis of patient state multistability related to rheumatoid arthritis drug treatment: The KURAMA cohort study. PloS One. (2024) 19:e0302308. doi: 10.1371/journal.pone.0302308
24. Zhang K, Nakaoka S. An energy landscape approach reveals the potential key bacteria contributing to the development of inflammatory bowel disease. PloS One. (2024) 19:e0302151. doi: 10.1371/journal.pone.0302151
25. Masuda N, Islam S, Aung ST, Watanabe T. Energy landscape analysis based on the Ising model: Tutorial review. arXiv. (2024) 2411:16979. doi: 10.48550/arXiv.2411.16979
26. Su CW, Tang Y, Tang NL, Liu N, Li JW, Qi S, et al. Unveiling the dynamic effects of major depressive disorder and its rTMS interventions through energy landscape analysis. Front Neurosci. (2025) 19:1444999. doi: 10.3389/fnins.2025.1444999
27. Araki E, Goto A, Kondo T, Noda M, Noto H, Origasa H, et al. Japanese clinical practice guideline for diabetes 2019. Diabetol Int. (2020) 11:165–223. doi: 10.1007/s13340-020-00439-5
28. Matsuzawa Y, Nakamura T, Takahashi M, Miwa R, Inoue S, Ikeda Y, et al. Examination Committee of Criteria for ‘Obesity Disease’ in Japan; Japan Society for the Study of Obesity. New criteria for ‘obesity disease’ in Japan. Circ J. (2002) 66:987–92. doi: 10.1253/circj.66.987
29. Kanazawa M, Yoshiike N, Osaka T, Numba Y, Zimmet P, Inoue S. Criteria and classification of obesity in Japan and Asia-Oceania. World Rev Nutr Diet. (2005) 94:1–12. doi: 10.1159/000088200
30. Ogawa W, Hirota Y, Miyazaki S, Nakamura T, Ogawa Y, Shimomura I, et al. Definition, criteria, and core concepts of guidelines for the management of obesity disease in Japan. Endocr J. (2024) 71:223–31. doi: 10.1507/endocrj.EJ23-0593
31. Mukai N, Doi Y, Ninomiya T, Hata J, Hirakawa Y, Fukuhara M, et al. Cut-off values of fasting and post-load plasma glucose and HbA1c for predicting type 2 diabetes in community-dwelling Japanese subjects: the Hisayama Study. Diabetes Med. (2012) 29:99–106. doi: 10.1111/j.1464-5491.2011.03378.x
32. Ezaki T, Masuda N. Energy Landscape Analysis Toolbox (ELAT) . Available online at: https://github.com/tkEzaki/energy-landscape-analysis (Accessed November 19, 2023).
33. Ahlqvist E, Storm P, Käräjämäki A, Martinell M, Dorkhan M, Carlsson A, et al. Novel subgroups of adult-onset diabetes and their association with outcomes: a data-driven cluster analysis of six variables. Lancet Diabetes Endocrinol. (2018) 6:361–9. doi: 10.1016/s2213-8587(18)30051-2
34. Ahlqvist E, Prasad RB, Groop L. Subtypes of type 2 diabetes determined from clinical parameters. Diabetes. (2020) 69:2086–93. doi: 10.2337/dbi20-0001
35. Tanabe H, Saito H, Kudo A, Machii N, Hirai H, Maimaituxun G, et al. Factors associated with risk of diabetic complications in novel cluster-based diabetes subgroups: A Japanese retrospective cohort study. J Clin Med. (2020) 9:2083. doi: 10.3390/jcm9072083
36. Tanabe H, Sato M, Miyake A, Shimajiri Y, Ojima T, Narita A, et al. Machine learning-based reproducible prediction of type 2 diabetes subtypes. Diabetologia. (2024) 67:2446–58. doi: 10.1007/s00125-024-06248-8
37. Suzuki K, Hatzikotoulas K, Southam L, Taylor HJ, Yin X, Lorenz KM, et al. Genetic drivers of heterogeneity in type 2 diabetes pathophysiology. Nature. (2024) 627:347–57. doi: 10.1038/s41586-024-07019-6
38. Hu H, Kawasaki Y, Kuwahara K, Nakagawa T, Honda T, Yamamoto S, et al. Trajectories of body mass index and waist circumference before the onset of diabetes among people with prediabetes. Clin Nutr. (2020) 39:2881–8. doi: 10.1016/j.clnu.2019.12.023
39. Hassanloo N, Mehran L, Amouzegar A, Abdi H, Masoumi S, Azizi F, et al. Association between body mass index trajectories and type 2 diabetes incidence over an 18-year follow-up in the Tehran Lipid and Glucose Study. Sci Rep. (2024) 14:27615. doi: 10.1038/s41598-024-75179-6
40. American Diabetes Association Professional Practice Committee. Diagnosis and classification of diabetes: Standards of care in diabetes-2025. Diabetes Care. (2025) 47:S27–49. doi: 10.2337/dc25-S002
41. Munekawa C, Okada H, Hamaguchi M, Habu M, Kurogi K, Murata H, et al. Fasting plasma glucose level in the range of 90-99 mg/dL and the risk of the onset of type 2 diabetes: Population-based Panasonic cohort study 2. J Diabetes Investig. (2022) 13:453–9. doi: 10.1111/jdi.13692
42. Kodama S, Saito K, Yachi Y, Asumi M, Sugawara A, Totsuka K, et al. Association between serum uric acid and development of type 2 diabetes. Diabetes Care. (2009) 32:1737–42. doi: 10.2337/dc09-0288
43. Doi Y, Kubo M, Yonemoto K, Ninomiya T, Iwase M, Tanizaki Y, et al. Liver enzymes as a predictor for incident diabetes in a Japanese population: The Hisayama study. Obesity. (2007) 15:1841–50. doi: 10.1038/oby.2007.218
44. Saltiel AR, Kahn CR. Insulin signalling and the regulation of glucose and lipid metabolism. Nature. (2001) 414:799–806. doi: 10.1038/414799a
45. Kahn SE. The relative contributions of insulin resistance and beta-cell dysfunction to the pathophysiology of Type 2 diabetes. Diabetologia. (2003) 46:3–19. doi: 10.1007/s00125-002-1009-0
46. Retnakaran R, Shen S, Hanley AJ, Vuksan V, Hamilton JK, Zinman B. Hyperbolic relationship between insulin secretion and sensitivity on oral glucose tolerance test. Obes (Silver Spring). (2008) 16:1901–7. doi: 10.1038/oby.2008.307
47. Iwahashi H, Okauchi Y, Ryo M, Noguchi M, Morita S, Kishida K, et al. Insulin-secretion capacity in normal glucose tolerance, impaired glucose tolerance, and diabetes in obese and non-obese Japanese patients. J Diabetes Investig. (2012) 3:271–5. doi: 10.1111/j.2040-1124.2011.00180.x
48. Bouchi R, Kondo T, Ohta Y, Goto A, Tanaka D, Satoh H, et al. A consensus statement from the Japan Diabetes Society: A proposed algorithm for pharmacotherapy in people with type 2 diabetes - 2nd edition (English version). J Diabetes Investig. (2024) 15:1326–42. doi: 10.1111/jdi.14202
49. Matsumoto K, Miyake S, Yano M, Ueki Y, Yamaguchi Y, Akazawa S, et al. Glucose tolerance, insulin secretion, and insulin sensitivity in nonobese and obese Japanese subjects. Diabetes Care. (1997) 20:1562–8. doi: 10.2337/diacare.20.10.1562
50. Fukushima M, Usami M, Ikeda M, Nakai Y, Taniguchi A, Matsuura T, et al. Insulin secretion and insulin sensitivity at different stages of glucose tolerance: a cross-sectional study of Japanese type 2 diabetes. Metabolism. (2004) 53:831–5. doi: 10.1016/j.metabol.2004.02.012
51. Fukushima M, Suzuki H, Seino Y. Insulin secretion capacity in the development from normal glucose tolerance to type 2 diabetes. Diabetes Res Clin Pract. (2004) 66:S37–43. doi: 10.1016/j.diabres.2003.11.024
52. Mitsui R, Fukushima M, Taniguchi A, Nakai Y, Aoyama S, Takahashi Y, et al. Insulin secretory capacity and insulin sensitivity in impaired fasting glucose in Japanese. J Diabetes Investig. (2012) 3:377–83. doi: 10.1111/j.2040-1124.2012.00201.x
53. Kodama K, Tojjar D, Yamada S, Toda K, Patel CJ, Butte AJ. Ethnic differences in the relationship between insulin sensitivity and insulin response: A systematic review and meta-analysis. Diabetes Care. (2013) 36:1789–96. doi: 10.2337/dc12-1235
54. Yabe D, Seino Y, Fukushima M, Seino S. β cell dysfunction versus insulin resistance in the pathogenesis of type 2 diabetes in East Asians. Curr Diabetes Rep. (2015) 15:36. doi: 10.1007/s11892-015-0602-9
55. Kubota S, Liu Y, Iizuka K, Kuwata H, Seino Y, Yabe D. A review of recent findings on meal sequence: An attractive dietary approach to prevention and management of type 2 diabetes. Nutrients. (2020) 12:2502. doi: 10.3390/nu12092502
56. Kautzky-Willer A, Harreiter J, Pacini G. Sex and gender differences in risk, pathophysiology and complications of type 2 diabetes mellitus. Endocr Rev. (2016) 37:278–316. doi: 10.1210/er.2015-1137
Keywords: energy landscape analysis, multiple pathways, pre-disease state, specific health checkup data, diabetes, obesity
Citation: Ito R, Oku M, Kimura I, Haruki T, Shikata M, Teramoto T, Chujo D, Iwata M, Fujisaka S, Nagata Y, Yamagami T, Kadowaki M, Tobe K, Saito S and Ueda K (2025) Energy landscape analysis of health checkup data clarified multiple pathways to diabetes development in obese and non-obese subjects. Front. Endocrinol. 16:1576431. doi: 10.3389/fendo.2025.1576431
Received: 14 February 2025; Accepted: 16 April 2025;
Published: 06 May 2025.
Edited by:
Rashu Barua, New York University, United StatesReviewed by:
Mohammad Rashedul Islam, University of Chittagong, BangladeshMd Saqline Mostaq, University of Louisiana at Monroe, United States
Mohammad Abul Hasnat, Shahjalal University of Science and Technology, Bangladesh
Copyright © 2025 Ito, Oku, Kimura, Haruki, Shikata, Teramoto, Chujo, Iwata, Fujisaka, Nagata, Yamagami, Kadowaki, Tobe, Saito and Ueda. This is an open-access article distributed under the terms of the Creative Commons Attribution License (CC BY). The use, distribution or reproduction in other forums is permitted, provided the original author(s) and the copyright owner(s) are credited and that the original publication in this journal is cited, in accordance with accepted academic practice. No use, distribution or reproduction is permitted which does not comply with these terms.
*Correspondence: Makito Oku, b2t1QGN0cy51LXRveWFtYS5hYy5qcA==; Keiichi Ueda, a3VlZGFAc2NpLnUtdG95YW1hLmFjLmpw