 Hetao Chen1
 Peipei Du1
 Tao Jiang1
 Ying Li2
 Yuanyuan Li1Yalin Liu3Baotong Yang1Jingyi Kang3
 Jiajia Duan1
 Yujin Ma4
 Xiangmei Chen5*
 Hongwei Jiang4*
- 1Department of Clinical Laboratory, The First Affiliated Hospital, and College of Clinical Medicine of Henan University of Science and Technology, Luoyang, China
- 2Department of Pharmacy, The First Affiliated Hospital, and College of Clinical Medicine of Henan University of Science and Technology, Luoyang, China
- 3Department of Central Laboratory, The First Affiliated Hospital, and College of Clinical Medicine of Henan University of Science and Technology, Luoyang, China
- 4Henan Key Laboratory of Rare Diseases, Endocrinology and Metabolism Center, The First Affiliated Hospital, and College of Clinical Medicine of Henan University of Science and Technology, Luoyang, China
- 5Senior Department of Nephrology, the First Medical Center of Chinese People’s Liberation Army (PLA) General Hospital, Chinese People’s Liberation Army (PLA) Institute of Nephrology, National Key Laboratory of Kidney Diseases, National Clinical Research Center for Kidney Diseases, Beijing Key Laboratory of Kidney Diseases Research, Beijing, China
Objective: Diabetes mellitus (DM) is a prevalent chronic disease, with diabetic nephropathy (DN) being a significant complication. Early detection of DN is critical for effective management. Current diagnostic methods, such as urinary albumin-to-creatinine ratio (uACR) and estimated glomerular filtration rate (eGFR), have limitations. Metabolomics offers a promising alternative by identifying specific metabolic signatures associated with DM and DN. This study aimed to identify potential metabolic biomarkers of DN using metabolomics.
Methods: A total of 100 participants were recruited, including 20 healthy controls and 80 DM patients, who were classified into three groups based on uACR: normoalbuminuria (DM), microalbuminuria (DN-1), and macroalbuminuria (DN-2). Metabolomic profiles were analyzed using ultra-high performance liquid chromatography-tandem mass spectrometry (UPLC-MS/MS).
Results: Results showed 74, 86, and 107 differentially expressed metabolites in the DM, DN-1, and DN-2 groups, respectively, compared to healthy controls. Compared to the DM group, DN-1 had 70 differential metabolites (55 upregulated, 15 downregulated), and DN-2 had 91 (81 upregulated, 10 downregulated). Between DN-1 and DN-2, 71 differential metabolites were identified (57 upregulated, 14 downregulated). Key metabolites such as lactate, L-ornithine, L-tryptophan, L-alanine, adenine, and cholecalciferol emerged as potential biomarkers and therapeutic targets. Venn diagram analysis identified 36 common differential metabolites across all groups. KEGG enrichment analysis highlighted significant involvement of amino acid biosynthesis and arginine and proline metabolism pathways in DN.
Conclusion: In conclusion, this study provides valuable insights into potential metabolic markers and mechanisms for early identification and prediction of DN progression, which may aid in developing more accurate diagnostic tools and targeted therapies for DN.
1 Introduction
Diabetes mellitus (DM) is a common chronic disease that affects millions of people worldwide, resulting in poor health outcomes and escalating healthcare costs (1). Diabetic nephropathy (DN), one of the most severe complications of DM, is the leading cause of end-stage kidney disease (ESKD) and is now recognized as the fourth leading cause of death globally (2). Studies have shown that DN develops in 30-40% of individuals with diabetes, and over 50% of ESKD cases are attributed to DN (3–7). Therefore, timely identification of DN is crucial for effective prevention and management.
However, current clinical diagnosis and staging of DN primarily rely on the urine albumin-to-creatinine ratio (ACR) and estimated glomerular filtration rate (eGFR). Albuminuria is considered a highly specific marker for diagnosing kidney disease because it can indicate kidney damage even before a decline in glomerular filtration (8). However, clinically, renal injury in DN patients may have been ongoing for a considerable duration prior to significant changes in urinary albumin levels. Furthermore, normoalbuminuric diabetic kidney disease (NADKD) is prevalent. Additionally, reversing the condition after the onset of proteinuria is relatively challenging. Therefore, the sensitivity and specificity of urinary albumin, particularly microalbuminuria, are limited, posing challenges for early diagnosis and appropriate classification of chronic kidney disease (CKD) in clinical settings.
In the past decade, high-throughput metabolomic techniques have provided critical insights into the preconditions and pathophysiological pathways of diabetes, facilitating their widespread application in the clinical diagnosis of DN (4, 9–11). Liquid chromatography-mass spectrometry (LC-MS)-based metabolomics has become a prevalent tool for monitoring metabolic changes in diabetes and predicting disease progression. Numerous metabolomic studies have demonstrated that serum metabolites are significantly altered in patients with DN and type 2 diabetes mellitus (T2DM), including sugar metabolites and derivatives, amino acids (such as aromatic amino acids, glycine, glutamine, and glutamate), alpha-hydroxybutyrate (α-HB), hexadecanoic acid (C16:0), linolelaidic acid (C18:2n6t), and linoleic acid (C18:2n6c) (10, 12–14). These alterations in serum metabolites enhance our understanding of the metabolic mechanisms underlying T2DM onset and progression and aid in identifying early potential metabolic markers (15–17).
The identification of definitive markers for accurately estimating the stages of DN in patients is crucial. Early detection and timely intervention can significantly mitigate the risk of kidney injury in DN patients. Consequently, enhancing the detection capability for DN and identifying more sensitive and specific biomarkers are essential to facilitate early diagnosis and predict disease progression. In this study, we utilized ultra-performance liquid chromatography-tandem mass spectrometry (UPLC-MS/MS) to analyze the metabolomic profiles of healthy individuals and those with T2DM, aiming to identify novel metabolic markers indicative of DN in diabetic patients. Additionally, we investigated the correlation between differential metabolites as potential predictors of DN progression.
2 Materials and methods
2.1 Ethics statement
The written informed consent was obtained from all subjects, and the study design was approved by the Ethics Committee of the First Affiliated Hospital of Henan University of Science and Technology. The ethical approval number for this study is 2024-0585. The registration number at the Chinese Clinical Trial Registry (ChiCTR) is ChiCTR2400093494.
2.2 Sample collection
A total of 100 participants (61 males and 39 females) were included in this study, consisting of 20 healthy volunteers and 80 patients with T2DM. The average age was 53.62 ± 13.24 years. All samples were from the first affiliated hospital of Henan university of science and technology. Inclusion criteria included (1): age ≥ 18 years (2); clinical diagnosis of DM, which was in line with the American Diabetes Association (ADA) criteria (18). Exclusion criteria included (1): age <18 years (2); T1DM; (3) suffering from diseases that affected urinary albumin secretion and eGFR, such as benign and malignant tumors, hypertension, and urogenital infections; (4) kidney transplantation; (5) menstruating, pregnant, and lactating women. According to the KDIGO guidelines, patients with type 2 diabetes were divided into three groups: DM (uACR <30 mg/g), DN-1 (uACR 30–300 mg/g), and DN-2 (uACR >300 mg/g) (19). Healthy volunteers were used as control in this study. Blood samples were collected the next morning after fasting. Blood samples were centrifuged to prepare serum samples, which were then frozen at -80°C.
2.3 Metabolomic analysis
2.3.1 Serum sample pretreatment
All serum samples were treated as previously described (20). The samples were thawed in ice water bath and was mixed by vortexing for 30s. Two hundred fifty microliters of water and 1200 µL acetonitrile-methanol (1:1, containing isotope internal standards) (CNW Technologies) were added into 50 µL sample and were vortexed for 30 s. After sonication in ice-water bath for 15min, samples were incubated at -40°C for 2 h. Then the samples were centrifuged at 12000 rpm and 4°C for 15 min, 1200 µL supernatant of each sample was transferred to a new Eppendorf tube and was dried with a centrifugal concentrator. One hundred twenty microliters acetonitrile (60%) was added into the Eppendorf tube to reconstitute the dried samples. The Eppendorf tube was vortexed until the powder was completely dissolved, followed by centrifugation at 12,000 rpm for 15 min at 4°C.
2.3.2 UPLC–MS/MS
The supernatant of each sample (60-70 µL) was transferred to glass vial for LC-MS/MS analysis. Mixture of standard metabolites were prepared as QC sample. The LC separation was carried out using an UPLC System (1290, Agilent), equipped with a Waters Atlantis Premier BEH Z-HILIC Column. Mobile phase A consisted of a mixture of H2O and acetonitrile (9:1), containing 10 mmol/L ammonium formate, while mobile phase B consisted of a mixture of H2O and acetonitrile (1:9), also containing 10 mmol/L ammonium formate. The auto-sampler temperature was set at 4°C and the injection volume was 1 µL. AB Sciex QTrap 6500 plus mass spectrometer was applied for assay development. Typical ion source parameters were as follows: IonSpray Voltage: +5500V/-4500V, Curtain Gas: 35 psi, Temperature: 400°C, Ion Source Gas 1: 50 psi, Ion Source Gas 2: 50psi.
Raw data files generated by LC-MS/MS were processed with SCIEX Analyst Work Station Software (1.7.3). Metabolites quantification was analyzed with BIOTREEBioBud (2.0.3). Multivariate analysis, including fold change, principal component analysis (PCA) and orthogonal partial least-squares discriminant analysis (OPLS-DA) and variable importance in the projection (VIP) values, were performed on the SIMCAV18.0.1 software package (Sartorius Stedim Data Analytics AB, Umea, Sweden). Heatmap of hierarchical clustering analysis was conducted in R (ggplot2) 3.3.5 package (Vienna, Austria).
2.4 Statistical analysis
SPSS25.0 was used for statistical analysis. The continuous variables of clinical characteristics among the study population were presented as means ± standard deviations for normally distributed data, while categorical variables were reported as frequencies. The chi-squared test was used for categorical variables. To ensure the validity of the student’s t-test, we rigorously verified the underlying assumptions, including the normality of distribution and homogeneity of variance between groups. For data conforming to both normal distribution and homogeneity of variance, Student’s t-tests were conducted. In cases where data exhibited normal distribution but heterogeneity of variance, Welch’s t-tests were applied. For data that did not meet the assumption of normal distribution, non-parametric tests (Mann-Whitney tests) were utilized. One-way ANOVA tests were conducted for data that adhered to normal distribution and homogeneity of variance. For data that exhibited normal distribution but heterogeneity of variance, Welch’s ANOVA tests were performed, with multiple comparisons corrected using the Dunnett T3 method. Non-parametric tests (Kruskal-Wallis tests) were applied to data that did not conform to normal distribution, with Dunn’s test used for post-hoc corrections. P <0.05 was considered statistically significant.
The metabolites with VIP >1 and P <0.05 were considered as significantly changed metabolites. Area Under Curve with values 0.8 displayed a very high prediction effect of identified metabolites on disease.
3 Result
3.1 Clinical data of population
Clinical data characteristics of 100 subjects were shown in Table 1. Twenty individuals were healthy, with an average age of 43.95 ± 8.47 years. Of these, ten were male and ten were female. As for patients with T2DM, the average age was 48.6, 57.2, 61.1 years among three groups, respectively. Data showed that there was a significant difference in age among control group, DM group, DN-1 group and DN-2 group (P < 0.05), and DN-2 group was significantly older than the others. Furthermore, there was no significant difference in sex among the four groups (P < 0.05) (Table 1). There were significant differences in drinking and smoking habits among the three groups (P < 0.05), suggesting that these factors may serve as independent contributors to DN. There was a significant difference in UACR among three groups (P < 0.05), the mean levels were 2.22 mg/g, 118.04 mg/g and 2183.37 mg/g, respectively. Furthermore, statistically significant differences were observed in u-AlB, CREA, LDH, and eGFR among the three disease groups (Table 1). The mean levels of u-ALB, CREA and LDH were the highest in the DN-2 group, the mean eGFR of the DN-2 patients was 49.96 mL/min/1.73m2. This suggested that the kidney damage is severely and renal function was significantly impaired. In addition, the duration of diabetes and age at diabetes onset in patients with DN was significantly difference than that in patients with diabetes (P < 0.05); the average of the latter was 7.78 years and 40.96 years. In terms of blood glucose, HbA1c, ALT, URCA, CHO, LDL, HDL and BMI, there was no significant difference between patients with diabetes and patients with DN (P > 0.05, Table 1). However, the contents of blood glucose in three diabetes group were significantly higher than that in healthy group (P < 0.05) (Table 1). Compared to control group, the levels of TG, AST were significantly higher in DN-2 group (P < 0.05).
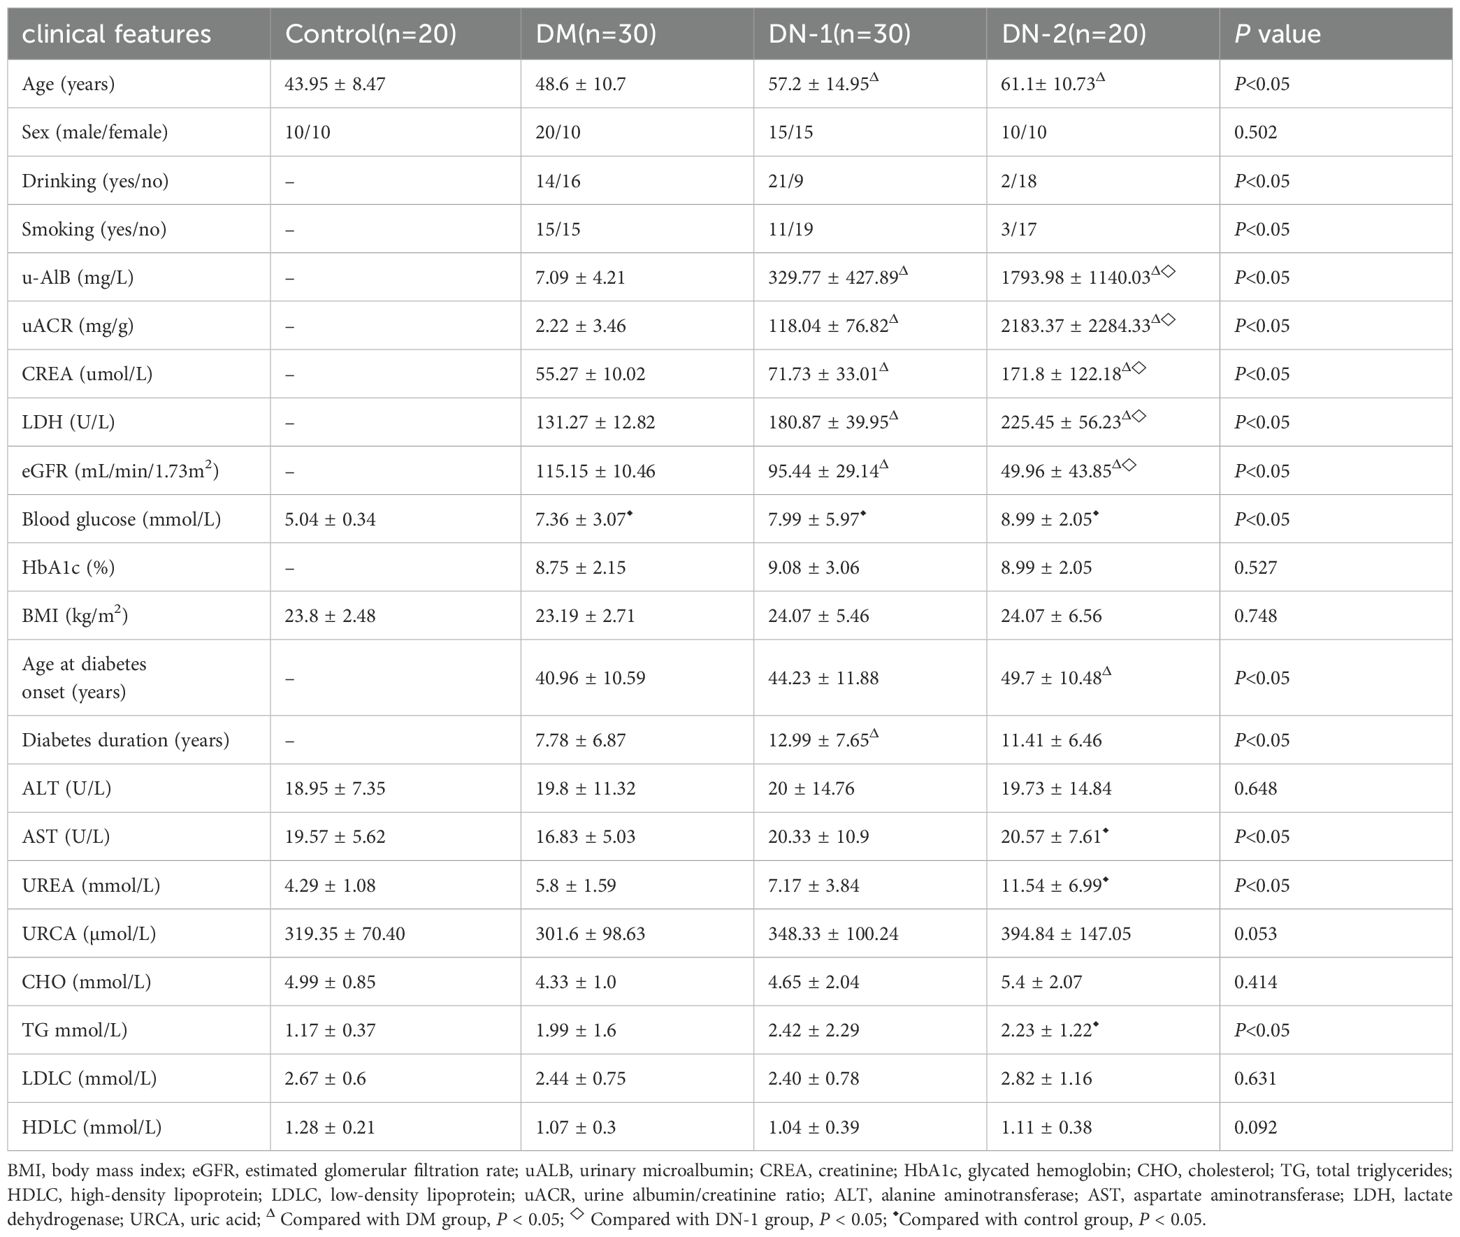
Table 1. Clinical characteristics of enrolled patients.
3.2 Alterations in serum metabolic profiles between disease and health groups
Metabolomics analysis is a systems biology approach that provides comprehensive metabolic information from biological samples. This method has been widely applied in the diagnosis and treatment of diabetes and its complications. To assess the metabolic profile changes between DM, DN, and normal health individuals, we conducted quantitative targeted metabolomics analysis using serum samples from each group. In the PCA plot, no significant separation was observed between the DM and control groups, but there were differences in the distribution trends of the two groups (Figure 1B). Additionally, we observed a clear separation between the DN-1 and DN-2 groups and the control group, with the separation of the DN-2 group being more pronounced (Figures 1C, D). This indicates that there are significant changes in the metabolic profiles between each disease group and the normal group, particularly in the DN groups (Figures 1A-D). Compared to the control group, there were 74 different metabolites in the DM group, among which 51 were obviously up-regulated and 23 were obviously down-regulated. Compared to the control group, there were 86 different metabolites in the DN-1 group, among which 71 were obviously up-regulated and 15 were obviously down-regulated. Compared to the control group, there were 107 different metabolites in the DN-2 group, among which 95 were obviously up-regulated and 12 were obviously down-regulated. Utilizing the Draw Venn Diagram platform for the intersection screening of differential metabolites among four groups, we identified 36 common differential metabolites in the three disease groups compared to the normal group (Figure 1E, Supplementary Table S1). The heatmap illustrates the expression profiles of these differentially expressed metabolites across all groups (Figure 1F). Among the metabolites that exhibited a high correlation with DN were lactic acid and L-ornithine, and their expression levels across different groups are depicted in Figures 1J, K, respectively. KEGG enrichment analysis revealed the top 15 differentially enriched metabolic pathways between each disease group and control group. Notably, the shared differential metabolic pathways among all disease groups compared to the control group included “Biosynthesis of amino acids,” “Arginine and proline metabolism,” and “Glycine, serine, and threonine metabolism” (Figures 1G, H).
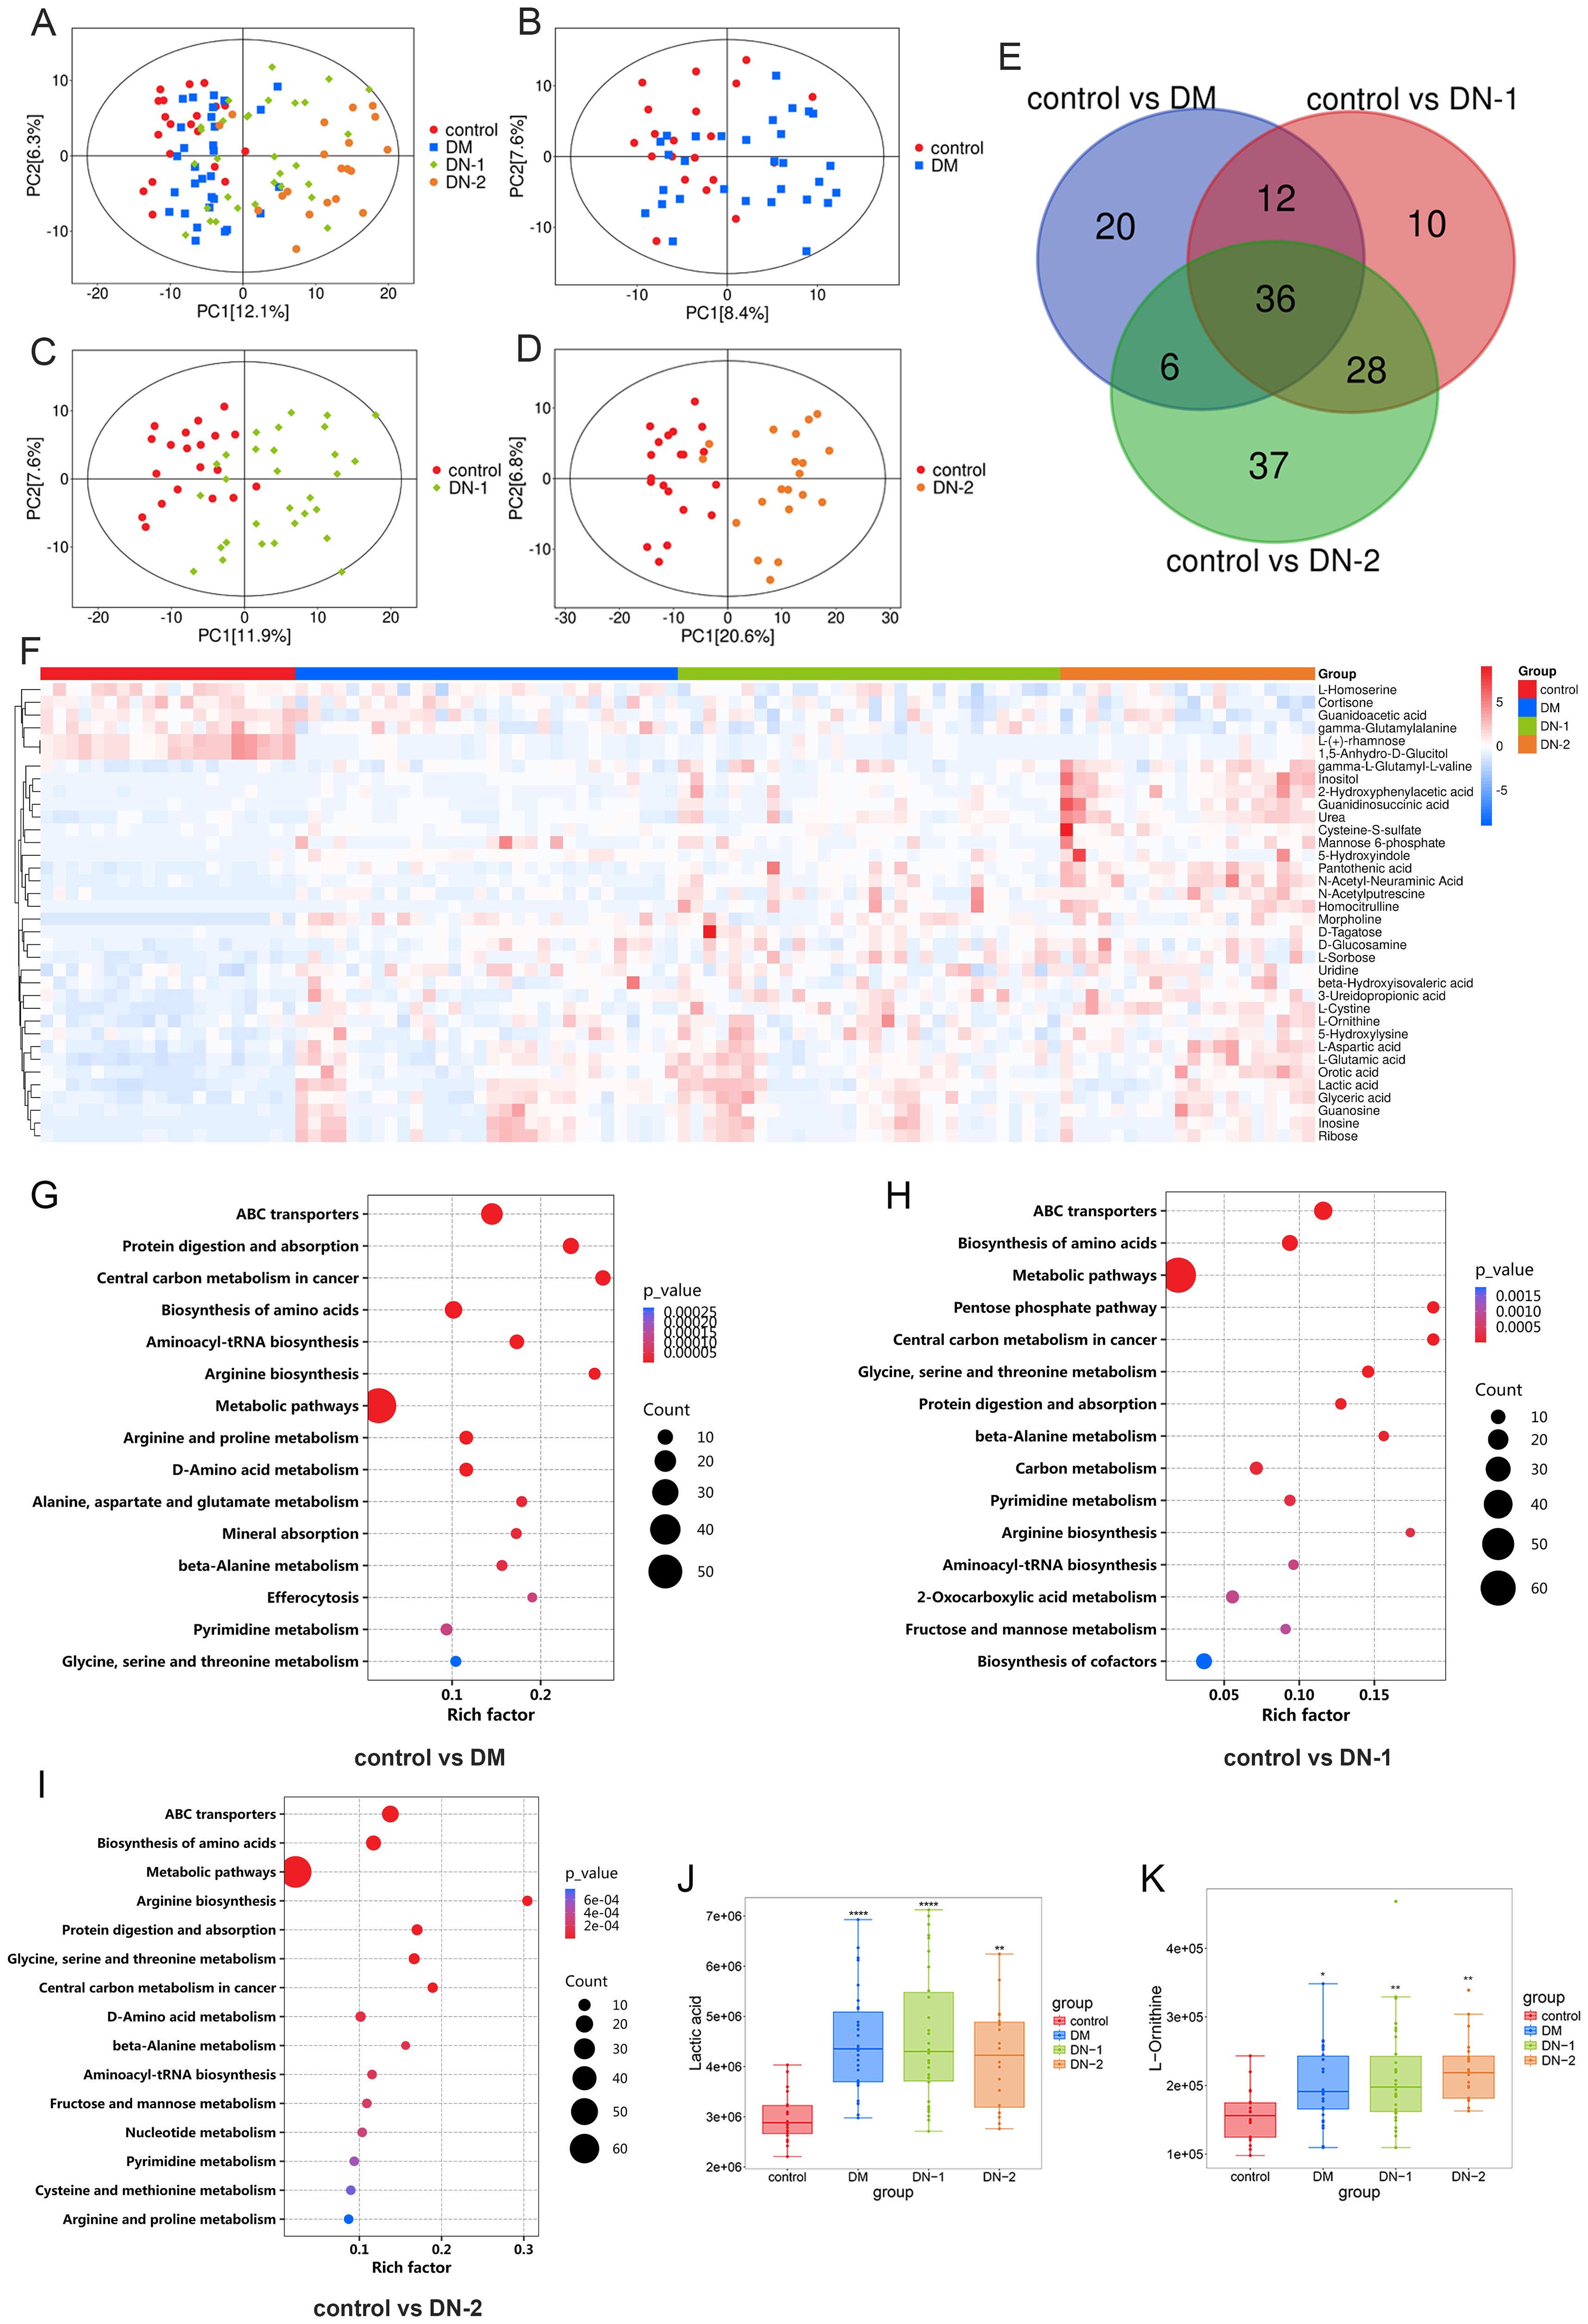
Figure 1. Metabolites composition and differences between disease and control groups. (A) PCA analysis of control, DM, DN-1 and DN-2 group; (B) PCA analysis of control vs. DM; (C) PCA analysis of control vs. DN-1; (D) PCA analysis of control vs. DN-2; (E) Venn diagram screening for common differential metabolites; (F) Heat map of the 36 differential metabolites; G-I. KEGG enrichment analysis of control vs. DM, control vs. DN-1 and control vs. DN-2; J-K. Expression levels of differential metabolites in different groups. *P < 0.05, **P < 0.01, ***P < 0.001, ****P < 0.0001.
3.3 Alterations in serum metabolic profiles between DN and DM groups
To understand the differences in metabolites between DN and DM, we statistically analyzed each DN group against the DM group. PCA showed notable changes in metabolites for both DN-1 and DN-2 compared to DM (Figures 2A, B). The metabolic profiling results revealed that, compared to the DM group, the DN-1 group exhibited 70 differential metabolites, comprising 55 upregulated and 15 downregulated metabolites. Moreover, the DN-2 group displayed 91 differential metabolites, with 81 upregulated and 10 downregulated metabolites. We employed a Venn diagram analysis to identify 50 common differentially expressed metabolites in DN-1 and DN-2 groups relative to the DM group (Figure 2C). The detailed information regarding these metabolites is provided in Supplementary Table S2. The volcano plot illustrates the expression profiles of the 50 differentially expressed metabolites across the three groups (Figure 2D). KEGG enrichment analysis revealed the top 15 significantly altered pathways in the comparisons of DM vs. DN-1 and DM vs. DN-2, respectively (Figures 2E, F). Notably, the commonly affected pathways included “Biosynthesis of amino acids”, “Cysteine and methionine metabolism” and “beta-Alanine metabolism” Furthermore, three metabolites associated with DN—L-tryptophan, L-alanine and adenine—were identified, and their expression levels in each group were visualized using violin plots (Figures 2G-I).
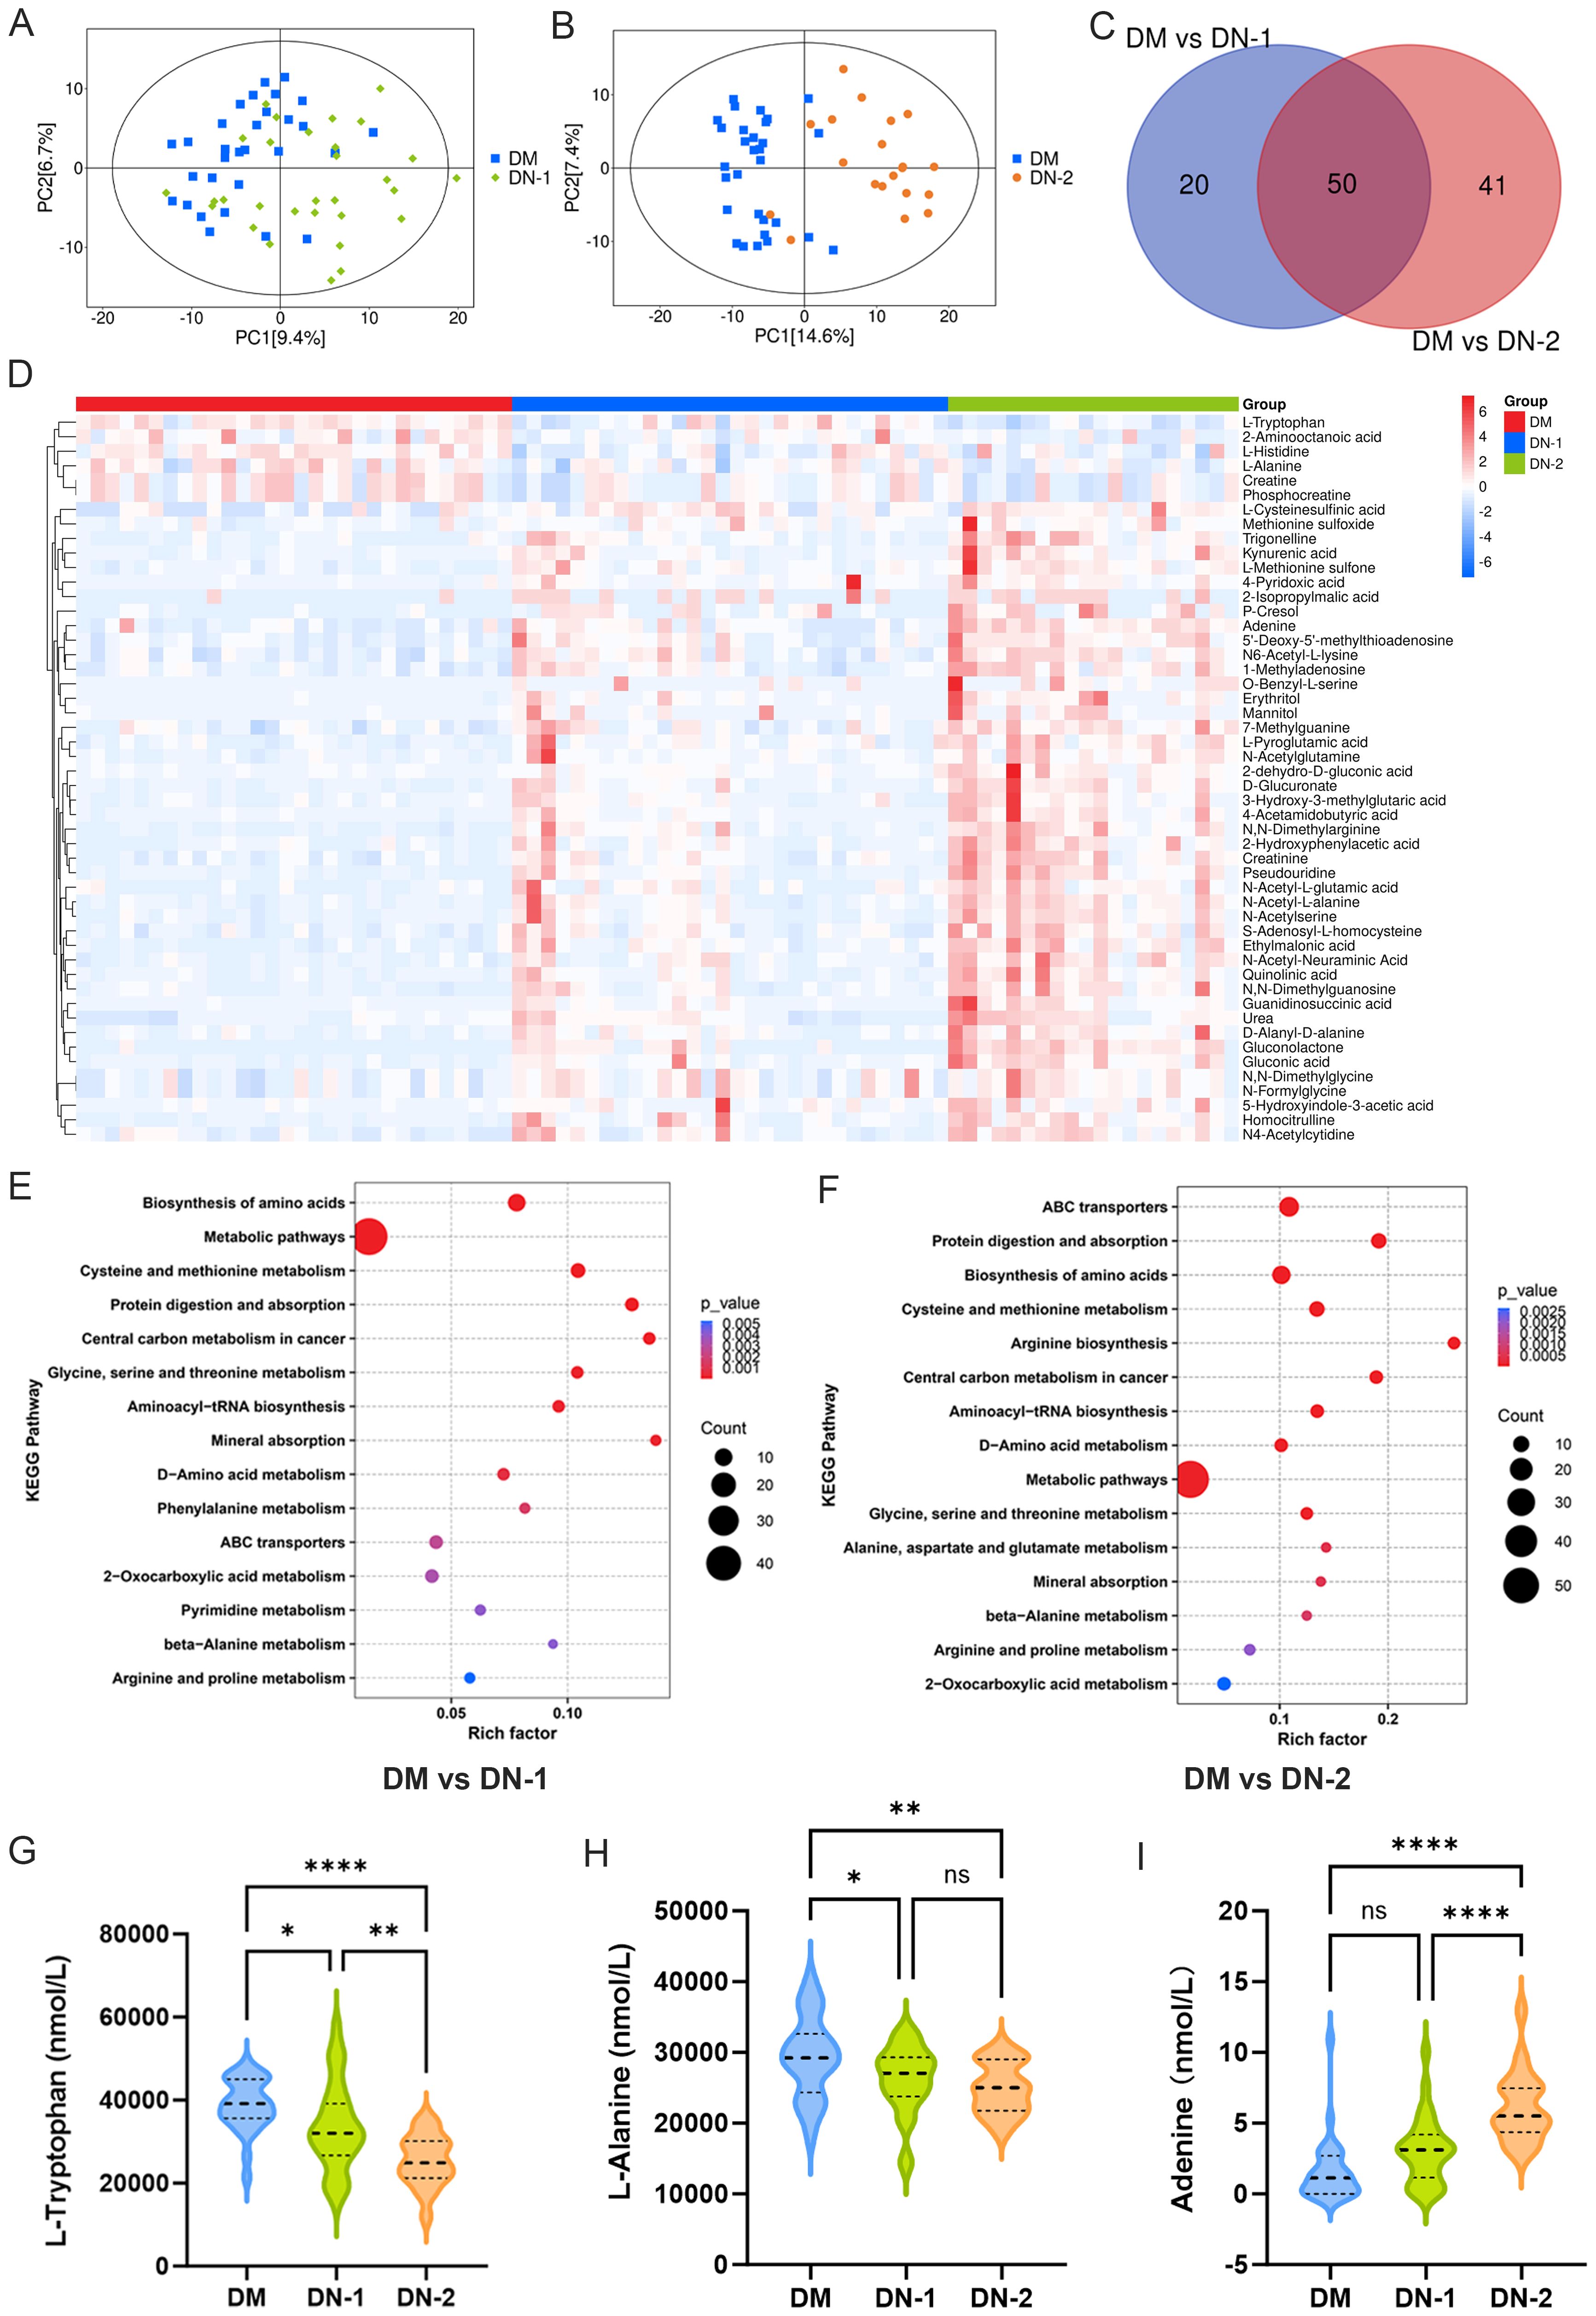
Figure 2. Metabolites composition and differences between diabetic nephropathy group and diabetic group. (A) PCA analysis of DM vs. DN-1; (B) PCA analysis of DM vs. DN-2; (C) Venn diagram screening for common differential metabolites; (D) Heat map of the 50 differential metabolites; E-F. KEGG enrichment analysis of DM vs. DN-1 and DM vs. DN-2; G-I. Expression levels of differential metabolites in different groups. *P < 0.05, **P < 0.01, ***P < 0.001, ****P < 0.0001.
3.4 Alterations in serum metabolic profiles between DN-1 and DN-2 groups
To investigate whether metabolic profiles varied among groups with different degrees of renal damage, we analyzed the metabolomic data from the DN-1 and DN-2 groups. In the PCA plot, while the DN-2 group did not fully separate from the DN-1 group, distinct distribution trends were observed between them (Figure 3A). A total of 71 differentially expressed metabolites were identified in the DN-2 group compared with the DN-1 group, including 57 up-regulated metabolites and 14 down-regulated metabolites. Information regarding the top 20 metabolites that exhibited statistically significant differences in the studies is detailed in Supplementary Table S3. A heatmap illustrated the top 20 significantly differential metabolites identified when comparing the DN-1 group to the DN-2 group (Figure 3D). Among these, adenine and cholecalciferol, two metabolites associated with DN, were selected for further analysis, and their expression levels across the groups are presented in the Figures 3B, C. KEGG enrichment analysis revealed the top 15 differential pathways, including “Protein digestion and absorption”, “mTOR signaling pathway” and “Phenylalanine metabolism” among others (Figure 3E).
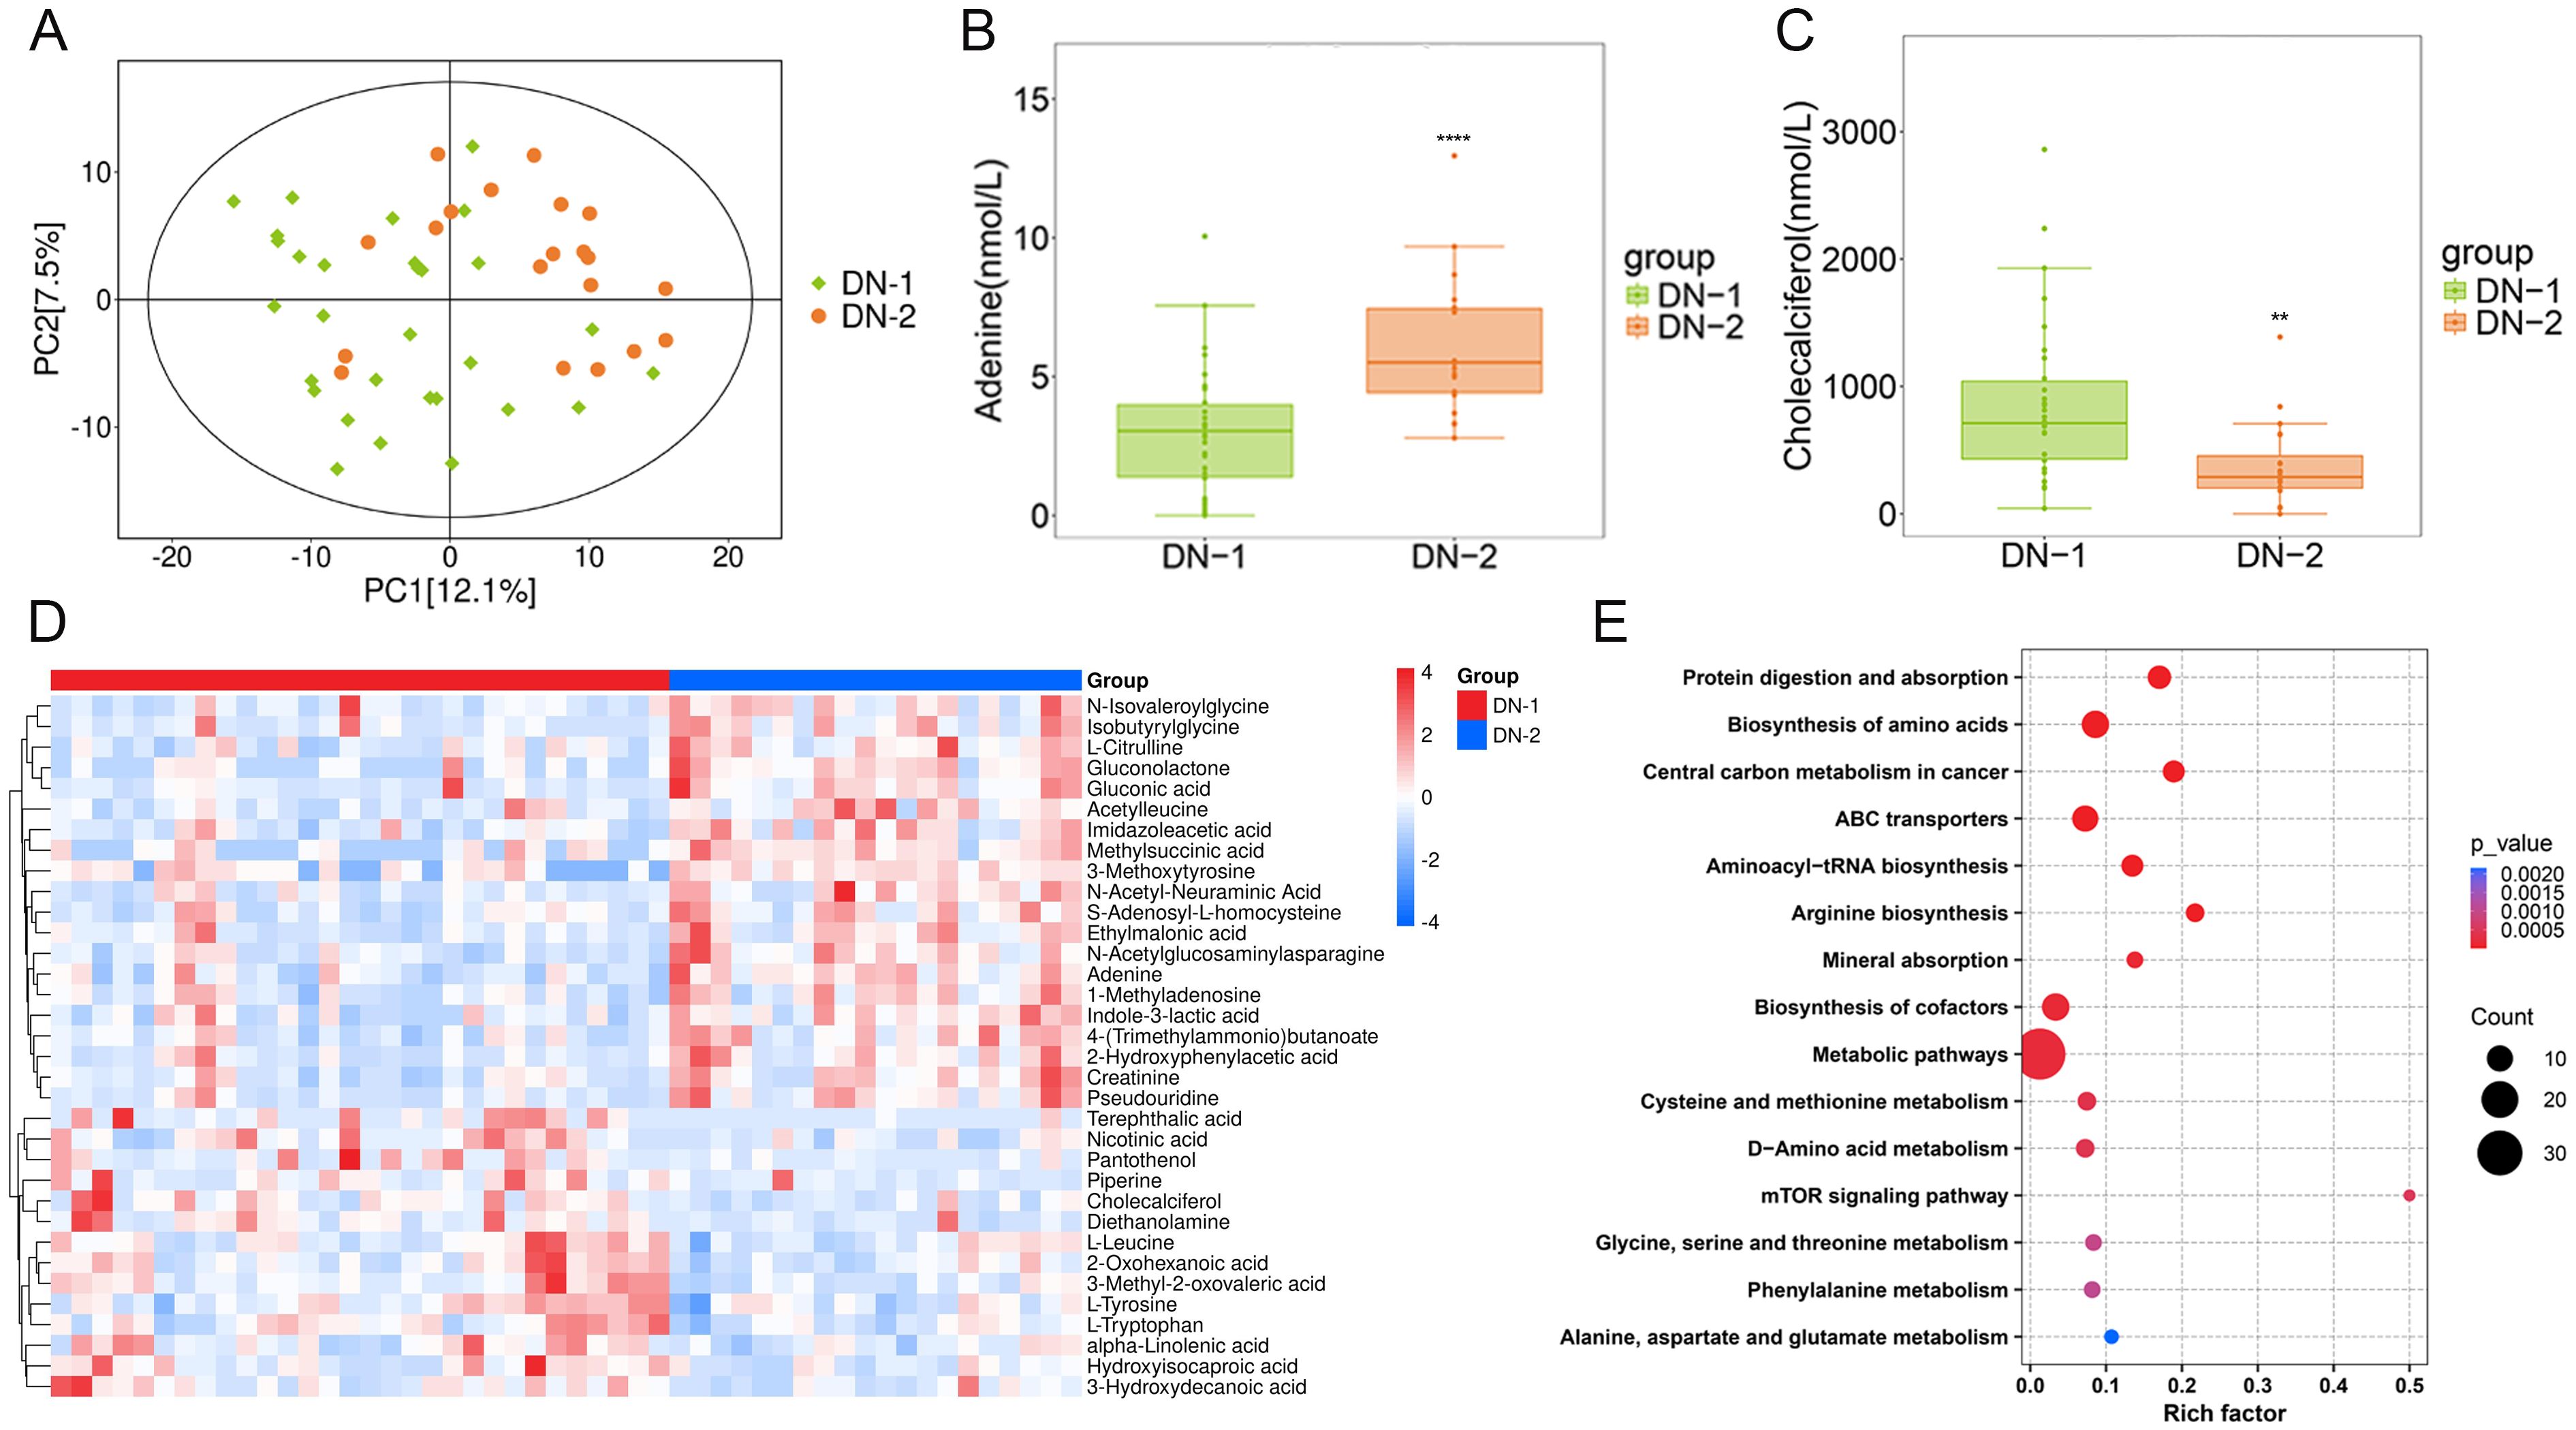
Figure 3. Metabolites composition and differences between groups with different degrees of renal injury. (A). PCA analysis of DN-1 vs. DN-2; (B, C). Expression levels of differential metabolites in different groups; (D). Heat map of the top 20 differential metabolites; (E). KEGG enrichment analysis of DN-1 vs. DN-2. *P < 0.05, **P < 0.01, ***P < 0.001, ****P < 0.0001.
4 Discussion
The present study provides valuable insights into the demographic and biochemical characteristics of patients with T2DM and DN. The significant differences observed in age, smoking, drinking, and biochemical markers such as uACR, u-AlB, CREA, and eGFR between the control, DM, and DN groups highlight the progressive nature of kidney damage in DN. These findings underscore the importance of early detection and intervention in managing T2DM to prevent the onset and progression of DN.
4.1 Metabolic alterations in DM
Metabolomics has been extensively utilized as a powerful technique to identify potential biomarkers for disease diagnosis and to elucidate the underlying mechanisms of disease occurrence (17, 21–25). To identify the metabolic targets between patients with diabetes, diabetic nephropathy, and healthy controls, this study employed quantitative targeted metabolomics. The results demonstrated that the metabolic profiles of both diabetic and diabetic nephropathy patients were markedly distinct from those of healthy controls. Lactate, as the end product of glycolysis, plays a crucial role in maintaining acid-base balance and energy metabolism within the body. Our data revealed significantly elevated lactate levels in the diabetic groups compared to the control group (Figure 1J), with a trend toward higher lactate levels in the DN-1 group relative to the DM group. Extensive research has established that patients with diabetic nephropathy exhibit abnormal lactate metabolism, and there is a significant correlation between urinary lactate levels and renal tubular injury (26). In DN, alterations in renal energy metabolism, such as mitochondrial dysfunction and impaired fatty acid oxidation, significantly influence disease progression (27, 28). An abnormal increase in lactate levels, potentially resulting from renal metabolic disorders, may contribute to the progressive renal injury observed in DN (26). Other study has demonstrated that lactic acid can drive epithelial-mesenchymal transition of DN through H3K14la/KLF5 pathway, and aggravate renal tubular fibrosis in patients with DN (29). The findings of these studies are in high consistency with the results of the present study, underscoring the critical role of lactate metabolism in the progression of diabetic kidney injury. In the present study, L-ornithine levels were significantly elevated in the disease group relative to the control group (Figure 1K). As a key amino acid in the urea cycle, L-ornithine plays an essential role in ammonia detoxification by facilitating its conversion to urea, thereby reducing blood ammonia levels (30). In DN, the impaired filtration and excretion functions of the kidney may affect the efficiency of the urea cycle, consequently influencing the metabolism of L-ornithine (31). The progression of DN is closely linked to a chronic inflammatory response. As a precursor of nitric oxide (NO), arginine plays a crucial role in regulating vascular tone and modulating immune responses. In DN, aberrant arginine metabolism can result in diminished NO production, potentially impairing renal blood flow and exacerbating the inflammatory state (32). L-ornithine is a metabolite of arginine and may indirectly influence the production of inflammatory mediators by modulating arginine metabolism. Notably, our metabolomic enrichment analysis revealed significant alterations in arginine and proline metabolism as well as arginine biosynthesis in each disease group relative to the control group (Figures 1G-I). These findings indicate that L-ornithine could impact arginine metabolism, resulting in decreased NO production, which in turn affects renal blood supply, exacerbates the inflammatory response and interstitial fibrosis, and ultimately contributes to kidney injury. Additionally, these results suggest that lactate and L-ornithine may serve as important biomarkers and therapeutic targets for DM and DN.
4.2 Key metabolites specific to DN
To further investigate potential metabolic differences between DN and DM patients, the metabolomic profiles of the DN-1 and DN-2 groups were compared with those of the DM group. The results demonstrated that the metabolic signatures of DN patients were markedly distinct from those of DM patients, particularly in amino acid metabolism. Tryptophan, an essential aromatic amino acid, plays a multitude of critical physiological roles in the human body. Our study demonstrated that L-tryptophan levels were significantly lower in DN groups compared to DM group (Figure 2G). Numerous studies have highlighted the importance of L-tryptophan in the early detection of DN. In a metabonomic analysis of serum and urine samples from 286 diabetic patients, Solini et al. found that the combination of c-glycotryptophan, pseudouridine, and acetyl-L-threonine was associated with a lower glomerular filtration rate (GFR) and enhanced the predictive value of clinical parameters (33). By analyzing the serum metabolite levels of 52 diabetic patients with chronic kidney disease across various stages, Zhou et al. discovered that tryptophan levels were significantly correlated with a rapid decline in GFR. Specifically, tryptophan levels decreased as renal lesions progressed, suggesting its potential as a prognostic marker for DN (34). These findings are consistent with our results. Furthermore, our findings revealed that L-alanine levels were significantly reduced in the DN groups relative to the DM group (Figure 2H). Co-administration of L-alanine and L-glutamine was observed to enhance renal function in alloxan-induced diabetic rats (35). In a separate study, L-alanine supplementation was demonstrated to significantly improve blood glucose levels and biochemical parameters, restore tissue antioxidant levels, and enhance liver and kidney function in alloxan-induced diabetic rats (36). L-alanine promoted insulin secretion in INS-1E cells across a range of concentrations, with the effect becoming more pronounced at higher doses. These findings suggest that L-alanine has a dose-dependent positive influence on insulin secretion function (37). These findings suggest that L-alanine may be implicated in the development and progression of DN through multiple mechanisms, including alterations in amino acid metabolism and improvements in renal function and insulin secretion. In the present study, adenine levels were significantly elevated in the DN group compared to the DM group (Figure 2I). Our data indicate that adenine plays a crucial role in the progression of DN. For instance, adenine has been shown to induce kidney damage in mouse and rat models of chronic kidney disease (38, 39). Renal pathological changes induced by adenine administration encompass glomerular sclerosis, renal tubular atrophy, interstitial fibrosis, and inflammatory cell infiltration (40, 41). The expression patterns of these metabolites across groups are detailed in Supplementary Table S3. These findings indicate that L-tryptophan, L-alanine, and adenine could serve as potential biomarkers for the early diagnosis of DN.
4.3 Key metabolites specifically associated with the progression of DN
To further investigate the metabolic markers that could predict DN progression, we conducted an in-depth analysis of the metabolic profiles of the DN-1 and DN-2 groups, revealing significant alterations in several metabolites. Previous studies have confirmed that adenine effectively activates the mTOR pathway (42), and inhibiting mTOR can prevent renal lesions induced by adenine (43, 44). Sharma et al. utilized spatial metabolomics and single-cell transcriptomics of human kidney biopsies to demonstrate that adenine is specifically localized in the diseased areas of blood vessels, renal tubules, and glomeruli in diabetic patients. This finding suggests that adenine may serve as a potential endogenous pro-fibrotic factor. By stimulating the mTOR pathway, adenine could enhance the production of extracellular matrix by renal tubular cells, which is closely associated with the progression of DN. These results indicate that adenine may be a promising biomarker for DN (45), aligning with our study’s findings. Our study revealed that the mTOR pathway was significantly dysregulated in the DN-2 group compared to the DN-1 group (Figure 3E), potentially due to the markedly elevated adenine levels observed in the DN-2 group (Figure 3B). Interestingly, in the present study, cholecalciferol levels were significantly lower in the DN-2 group compared to the DN-1 group (Figure 3C), which may be associated with the progression of DN. Top differential metabolites are shown in Figure 3D. Previous research has indicated that cholecalciferol exerts a protective effect on renal function (46, 47). Agarwal et al. conducted a double-blind, randomized, placebo-controlled trial to evaluate the safety and efficacy of oral paricalcitol in patients with stage 3–4 secondary chronic kidney disease. The study randomized participants to receive either oral paricalcitol or placebo. Patients with nephropathy who received paricalcitol demonstrated a significant reduction in proteinuria excretion (48). These findings indicate that adenine and cholecalciferol hold promise as potential biomarkers for predicting the progression of DN and novel therapeutic agents for mitigating the progression of DN.
Overall, this study systematically identified several key metabolites with potential for the early diagnosis of DM and its complication, DN. Specifically, six metabolites were found to exhibit significant alterations in both DM and DN: lactic acid, L-ornithine, L-tryptophan, L-alanine, adenine, and cholecalciferol. Among these, lactic acid and L-ornithine may serve as potential biomarkers for the early detection of DM. Further analysis revealed that changes in L-tryptophan, L-alanine, adenine, and cholecalciferol were independent of the underlying pathological state of DM and were strongly associated with the onset and progression of DN. Notably, L-tryptophan and L-alanine could potentially act as biomarkers for the early diagnosis of DN, whereas adenine and cholecalciferol not only hold promise as indicators for predicting DN progression but may also represent novel therapeutic targets for mitigating disease advancement. Collectively, these metabolites can be considered specific markers reflecting kidney injury and provide critical insights for the early intervention of DN.
4.4 Limitations
However, our study has some limitations. While we utilized quantitative targeted metabolomics to analyze metabolites, resource and technical constraints prevented us from implementing stringent quality control measures to further validate our results. We acknowledge the importance of external validation to enhance the reliability and robustness of our findings. Therefore, future studies will aim to externally validate our results using independent cohorts, and we plan to conduct surveys with larger sample sizes to further confirm our findings. Additionally, the average age of patients with DN was significantly higher than that of the healthy control group. This primarily reflects the inherent nature of DN as a chronic progressive disease, where the duration of the disease naturally extends as the condition worsens. With increasing severity of DN, both the disease course and patient age tend to increase correspondingly. The “disease course-age” association is a well-documented phenomenon in chronic disease cohort studies, which poses significant challenges for achieving perfect age matching between DN patients and healthy controls in cross-sectional studies. Future research employing prospective designs or incorporating more precisely age-matched control groups could help further validate these findings.
5 Conclusion
This study utilized a comprehensive metabolomics approach to elucidate metabolic alterations in patients with T2DM and DN compared to healthy controls. The results demonstrated significant differences in the metabolic profiles of these groups, particularly in key metabolites such as lactate and L-ornithine, which were markedly elevated in T2DM and DN patients. These metabolites are involved in critical pathways including energy metabolism and the urea cycle, suggesting their potential utility as biomarkers for early detection and progression prediction of DM. Additionally, the study identified specific amino acids like L-tryptophan and L-alanine, adenine, and cholecalciferol, whose altered levels in DN patients may serve as indicators of disease severity and progression. The dysregulation of these metabolites in DN highlights the importance of metabolic interventions in managing the disease. These findings not only enhance our understanding of the pathophysiology of DN but also provide a foundation for developing novel diagnostic tools and therapeutic strategies aimed at mitigating the progression of DN complications.
Data availability statement
The original contributions presented in the study are included in the article/Supplementary Material. Further inquiries can be directed to the corresponding authors.
Ethics statement
The studies involving humans were approved by the Ethics Committee of the First Affiliated Hospital of Henan University of Science and Technology. The studies were conducted in accordance with the local legislation and institutional requirements. The participants provided their written informed consent to participate in this study.
Author contributions
HC: Conceptualization, Investigation, Writing – original draft, Writing – review & editing. PD: Methodology, Writing – review & editing. TJ: Writing – review & editing. YiL: Writing – review & editing. YuL: Writing – review & editing. YaL: Investigation, Writing – review & editing. BY: Methodology, Writing – review & editing. JK: Methodology, Writing – review & editing. JD: Writing – review & editing. YM: Supervision, Writing – review & editing. XC: Supervision, Writing – review & editing. HJ: Funding acquisition, Supervision, Writing – review & editing.
Funding
The author(s) declare financial support was received for the research and/or publication of this article. This work was supported by the National major science and technology project Science and Technology Innovation 2030- “Research on the Prevention and Treatment of Cancer, cardiovascular and cerebrovascular diseases, respiratory and metabolic diseases” sub-project (NO. 2023ZD0508200).
Acknowledgments
The authors thank all doctors, nurses, and research staff at the First Affiliated Hospital, and College of Clinical Medicine of Henan University of Science and Technology for their participation in this study.
Conflict of interest
The authors declare that the research was conducted in the absence of any commercial or financial relationships that could be construed as a potential conflict of interest.
Generative AI statement
The author(s) declare that no Generative AI was used in the creation of this manuscript.
Any alternative text (alt text) provided alongside figures in this article has been generated by Frontiers with the support of artificial intelligence and reasonable efforts have been made to ensure accuracy, including review by the authors wherever possible. If you identify any issues, please contact us.
Publisher’s note
All claims expressed in this article are solely those of the authors and do not necessarily represent those of their affiliated organizations, or those of the publisher, the editors and the reviewers. Any product that may be evaluated in this article, or claim that may be made by its manufacturer, is not guaranteed or endorsed by the publisher.
Supplementary material
The Supplementary Material for this article can be found online at: https://www.frontiersin.org/articles/10.3389/fendo.2025.1581691/full#supplementary-material
References
1. Arneth B, Arneth R, and Shams M. Metabolomics of type 1 and type 2 diabetes. Int J Mol Sci. (2019) 20:2467. doi: 10.3390/ijms20102467
2. Rando MM, Guthoff M, Tiwari V, and Biscetti F. Editorial: diagnosis, prevention and treatment in diabetic nephropathy. Front Endocrinol. (2022) 13:1011665. doi: 10.3389/fendo.2022.1011665
3. Fu H, Liu S, Bastacky SI, Wang X, Tian XJ, and Zhou D. Diabetic kidney diseases revisited: A new perspective for a new era. Mol Metab. (2019) 30:250–63. doi: 10.1016/j.molmet.2019.10.005
4. Guo W, Song Y, Sun Y, Du H, Cai Y, You Q, et al. Systemic immune-inflammation index is associated with diabetic kidney disease in type 2 diabetes mellitus patients: evidence from nhanes 2011-2018. Front Endocrinol. (2022) 13:1071465. doi: 10.3389/fendo.2022.1071465
5. Tuttle KR, Bakris GL, Bilous RW, Chiang JL, de Boer IH, Goldstein-Fuchs J, et al. Diabetic kidney disease: A report from an ada consensus conference. Diabetes Care. (2014) 37:2864–83. doi: 10.2337/dc14-1296
6. Santoro D, Torreggiani M, Pellicanò V, Cernaro V, Messina RM, Longhitano E, et al. Kidney biopsy in type 2 diabetic patients: critical reflections on present indications and diagnostic alternatives. Int J Mol Sci. (2021) 22:5425. doi: 10.3390/ijms22115425
7. Oshima M, Shimizu M, Yamanouchi M, Toyama T, Hara A, Furuichi K, et al. Trajectories of kidney function in diabetes: A clinicopathological update. Nat Rev Nephrol. (2021) 17:740–50. doi: 10.1038/s41581-021-00462-y
8. Cordero-Pérez P, Sánchez-Martínez C, García-Hernández PA, and Saucedo AL. Metabolomics of the diabetic nephropathy: behind the fingerprint of development and progression indicators. Nefrologia. (2020) 40:585–96. doi: 10.1016/j.nefro.2020.07.002
9. Padberg I, Peter E, González-Maldonado S, Witt H, Mueller M, Weis T, et al. A new metabolomic signature in type-2 diabetes mellitus and its pathophysiology. PloS One. (2014) 9:e85082. doi: 10.1371/journal.pone.0085082
10. Würtz P, Tiainen M, Mäkinen VP, Kangas AJ, Soininen P, Saltevo J, et al. Circulating metabolite predictors of glycemia in middle-aged men and women. Diabetes Care. (2012) 35:1749–56. doi: 10.2337/dc11-1838
11. Sharma V, Khokhar M, Panigrahi P, Gadwal A, Setia P, and Purohit P. Advancements, challenges, and Clinical implications of integration of metabolomics technologies in diabetic nephropathy. Clin Chim Acta. (2024) 561:119842. doi: 10.1016/j.cca.2024.119842
12. American Diabetes Association. Microvascular complications and foot care: standards of medical care in diabetes-2019. Diabetes Care. (2019) 42:S124–s38. doi: 10.2337/dc19-S011
13. Gall WE, Beebe K, Lawton KA, Adam KP, Mitchell MW, Nakhle PJ, et al. Alpha-hydroxybutyrate is an early biomarker of insulin resistance and glucose intolerance in a nondiabetic population. PloS One. (2010) 5:e10883. doi: 10.1371/journal.pone.0010883
14. Zhang H, Zuo JJ, Dong SS, Lan Y, Wu CW, Mao GY, et al. Identification of potential serum metabolic biomarkers of diabetic kidney disease: A widely targeted metabolomics study. J Diabetes Res. (2020) 2020:3049098. doi: 10.1155/2020/3049098
15. Qian F, Zhao L, Zhang D, Yu M, Zhou W, and Jin J. Serum metabolomics detected by ldi-tof-ms can be used to distinguish between diabetic patients with and without diabetic kidney disease. FEBS Open Bio. (2023) 13:1844–58. doi: 10.1002/2211-5463.13683
16. Kang E, Li Y, Kim B, Huh KY, Han M, Ahn JH, et al. Identification of serum metabolites for predicting chronic kidney disease progression according to chronic kidney disease cause. Metabolites. (2022) 12:1125. doi: 10.3390/metabo12111125
17. Tan YM, Gao Y, Teo G, Koh HWL, Tai ES, Khoo CM, et al. Plasma metabolome and lipidome associations with type 2 diabetes and diabetic nephropathy. Metabolites. (2021) 11:228. doi: 10.3390/metabo11040228
18. Devi S, Nongkhlaw B, Limesh M, Pasanna RM, Thomas T, Kuriyan R, et al. Acyl ethanolamides in diabetes and diabetic nephropathy: novel targets from untargeted plasma metabolomic profiles of south asian Indian men. Sci Rep. (2019) 9:18117. doi: 10.1038/s41598-019-54584-2
19. Kidney Disease: Improving Global Outcomes (KDIGO) CKD Work Group. Kdigo 2024 clinical practice guideline for the evaluation and management of chronic kidney disease. Kidney Int. (2024) 105:S117–s314. doi: 10.1016/j.kint.2023.10.018
20. Dunn WB, Broadhurst D, Begley P, Zelena E, Francis-McIntyre S, Anderson N, et al. Procedures for large-scale metabolic profiling of serum and plasma using gas chromatography and liquid chromatography coupled to mass spectrometry. Nat Protoc. (2011) 6:1060–83. doi: 10.1038/nprot.2011.335
21. Fu X, Luo ZX, Yin HH, Liu YN, Du XG, Cheng W, et al. Metabolomics study reveals blood biomarkers for early diagnosis of chronic kidney disease and iga nephropathy: A retrospective cross-sectional study. Clin Chim Acta. (2024) 555:117815. doi: 10.1016/j.cca.2024.117815
22. Wang YN, Ma SX, Chen YY, Chen L, Liu BL, Liu QQ, et al. Chronic kidney disease: biomarker diagnosis to therapeutic targets. Clin Chim Acta. (2019) 499:54–63. doi: 10.1016/j.cca.2019.08.030
23. Liu C, Zhang C, He T, Sun L, Wang Q, Han S, et al. Study on potential toxic material base and mechanisms of hepatotoxicity induced by dysosma versipellis based on toxicological evidence chain (Tec) concept. Ecotoxicol Environ Saf. (2020) 190:110073. doi: 10.1016/j.ecoenv.2019.110073
24. Huan-Hua X, Zeng-Chun M, Qiao-Li S, Shi-Han Y, La J, Xiang-Mei C, et al. Synergistic effect and different toxicities of adjuvant components of realgar-indigo naturalis formula. Chin Herbal Medicines (CHM). (2018) 10:136–43. doi: 10.1016/j.chmed.2018.03.001
25. Li C, Li Y, Bai Z, Wang J, Li G, and Xiao X. Herb induced liver injury by xianling gubao tabl ets: A case assessed for causality using updated rucam and integrated evidence chain. Chin herbal Medicines. (2024) 16:301–9. doi: 10.1016/j.chmed.2023.10.005
26. Azushima K, Kovalik JP, Yamaji T, Ching J, Chng TW, Guo J, et al. Abnormal lactate metabolism is linked to albuminuria and kidney injury in diabetic nephropathy. Kidney Int. (2023) 104:1135–49. doi: 10.1016/j.kint.2023.08.006
27. Kang HM, Ahn SH, Choi P, Ko YA, Han SH, Chinga F, et al. Defective fatty acid oxidation in renal tubular epithelial cells has a key role in kidney fibrosis development. Nat Med. (2015) 21:37–46. doi: 10.1038/nm.3762
28. Kikuchi H, Sasaki E, Nomura N, Mori T, Minamishima YA, Yoshizaki Y, et al. Failure to sense energy depletion may be a novel therapeutic target in chronic kidney disease. Kidney Int. (2019) 95:123–37. doi: 10.1016/j.kint.2018.08.030
29. Zhang X, Chen J, Lin R, Huang Y, Wang Z, Xu S, et al. Lactate drives epithelial-mesenchymal transition in diabetic kidney disease via the H3k14la/klf5 pathway. Redox Biol. (2024) 75:103246. doi: 10.1016/j.redox.2024.103246
30. Sivashanmugam M JJ. Ornithine and its role in metabolic diseases: an appraisal. BioMed Pharmacother. (2017) 86:185–94. doi: 10.1016/j.biopha.2016.12.024
31. Shah VO, Townsend RR, Feldman HI, Pappan KL, Kensicki E, and Vander Jagt DL. Plasma metabolomic profiles in different stages of ckd. Clin J Am Soc Nephrol. (2013) 8:363–70. doi: 10.2215/cjn.05540512
32. You H, Gao T, Cooper TK, Morris SM Jr., and Awad AS. Diabetic nephropathy is resistant to oral L-arginine or L-citrulline supplementation. Am J Physiol Renal Physiol. (2014) 307:F1292–301. doi: 10.1152/ajprenal.00176.2014
33. Solini A, Manca ML, Penno G, Pugliese G, Cobb JE, and Ferrannini E. Prediction of declining renal function and albuminuria in patients with type 2 diabetes by metabolomics. J Clin Endocrinol Metab. (2016) 101:696–704. doi: 10.1210/jc.2015-3345
34. Chou CA, Lin CN, Chiu DT, Chen IW, and Chen ST. Tryptophan as a surrogate prognostic marker for diabetic nephropathy. J Diabetes Investig. (2018) 9:366–74. doi: 10.1111/jdi.12707
35. Ezeonwumelu IJ, Mode AM, Magaji UF, Nzoniwu NA, Tangaza MH, Tanimu FI, et al. Coadministration of L-alanine and L-glutamine ameliorate blood glucose levels, biochemical indices and histological features in alloxan-induced diabetic rats. J Food Biochem. (2022) 46:e14420. doi: 10.1111/jfbc.14420
36. Dandare SU, Ezeonwumelu IJ, Shinkafi TS, Magaji UF, Adio AA, and Ahmad K. L-alanine supplementation improves blood glucose level and biochemical indices in alloxan-induced diabetic rats. J Food Biochem. (2021) 45:e13590. doi: 10.1111/jfbc.13590
37. Liu Z, Jeppesen PB, Gregersen S, Chen X, and Hermansen K. Dose- and glucose-dependent effects of amino acids on insulin secretion from isolated mouse islets and clonal ins-1e beta-cells. Rev Diabetes Stud. (2008) 5:232–44. doi: 10.1900/rds.2008.5.232
38. Diwan V, Brown L, and Gobe GC. Adenine-induced chronic kidney disease in rats. Nephrol (Carlton). (2018) 23:5–11. doi: 10.1111/nep.13180
39. de Frutos S, Luengo A, García-Jérez A, Hatem-Vaquero M, Griera M, O’Valle F, et al. Chronic kidney disease induced by an adenine rich diet upregulates integrin linked kinase (Ilk) and its depletion prevents the disease progression. Biochim Biophys Acta Mol Basis Dis. (2019) 1865:1284–97. doi: 10.1016/j.bbadis.2019.01.024
40. Mo Y, Sun H, Zhang L, Geng W, Wang L, Zou C, et al. Microbiome-metabolomics analysis reveals the protection mechanism of α-ketoacid on adenine-induced chronic kidney disease in rats. Front Pharmacol. (2021) 12:657827. doi: 10.3389/fphar.2021.657827
41. Saleh MA, Awad AM, Ibrahim TM, and Abu-Elsaad NM. Small-dose sunitinib modulates P53, bcl-2, stat3, and erk1/2 pathways and protects against adenine-induced nephrotoxicity. Pharm (Basel). (2020) 13:397. doi: 10.3390/ph13110397
42. Hoxhaj G, Hughes-Hallett J, Timson RC, Ilagan E, Yuan M, Asara JM, et al. The mtorc1 signaling network senses changes in cellular purine nucleotide levels. Cell Rep. (2017) 21:1331–46. doi: 10.1016/j.celrep.2017.10.029
43. Nakano T, Watanabe H, Imafuku T, Tokumaru K, Fujita I, Arimura N, et al. Indoxyl sulfate contributes to mtorc1-induced renal fibrosis via the oat/nadph oxidase/ros pathway. Toxins (Basel). (2021) 13:909. doi: 10.3390/toxins13120909
44. Zhao Y, Zhao MM, Cai Y, Zheng MF, Sun WL, Zhang SY, et al. Mammalian target of rapamycin signaling inhibition ameliorates vascular calcification via klotho upregulation. Kidney Int. (2015) 88:711–21. doi: 10.1038/ki.2015.160
45. Sharma K, Zhang G, Hansen J, Bjornstad P, Lee HJ, Menon R, et al. Endogenous adenine mediates kidney injury in diabetic models and predicts diabetic kidney disease in patients. J Clin Invest. (2023) 133:e170341. doi: 10.1172/jci170341
46. Fishbane S, Chittineni H, Packman M, Dutka P, Ali N, and Durie N. Oral paricalcitol in the treatment of patients with ckd and proteinuria: A randomized trial. Am J Kidney Dis. (2009) 54:647–52. doi: 10.1053/j.ajkd.2009.04.036
47. Chau YY and Kumar J. Vitamin D in chronic kidney disease. Indian J Pediatr. (2012) 79:1062–8. doi: 10.1007/s12098-012-0765-1
Keywords: diabetic nephropathy, metabolites, serum, biomarkers, UPLC-MS/MS
Citation: Chen H, Du P, Jiang T, Li Y, Li Y, Liu Y, Yang B, Kang J, Duan J, Ma Y, Chen X and Jiang H (2025) Identification of potential biomarkers for diabetic nephropathy via UPLC-MS/MS-based metabolomics. Front. Endocrinol. 16:1581691. doi: 10.3389/fendo.2025.1581691
Received: 22 February 2025; Accepted: 13 August 2025;
Published: 01 September 2025.
Edited by:
Sang Youb Han, Inje University Ilsan Paik Hospital, Republic of KoreaReviewed by:
Jeong-Ho Kim, Seoul Clinical Laboratories (SCL), Republic of KoreaJeng-Yuan Yao, Xiamen Medical College, China
Copyright © 2025 Chen, Du, Jiang, Li, Li, Liu, Yang, Kang, Duan, Ma, Chen and Jiang. This is an open-access article distributed under the terms of the Creative Commons Attribution License (CC BY). The use, distribution or reproduction in other forums is permitted, provided the original author(s) and the copyright owner(s) are credited and that the original publication in this journal is cited, in accordance with accepted academic practice. No use, distribution or reproduction is permitted which does not comply with these terms.
*Correspondence: Hongwei Jiang, amlhbmdod0BoYXVzdC5lZHUuY24=; Xiangmei Chen, eG1jaGVuMzAxQDEyNi5jb20=