 Luojing Zhong
 Ruiyu Lin
 Baozhen Cao1
 Wen Wei
- 1Department of Endocrinology, Longyan First Affiliated Hospital of Fujian Medical University, Longyan, China
- 2Department of Physical Examination, Longyan First Affiliated Hospital of Fujian Medical University, Longyan, China
- 3The School of Clinical Medicine, Fujian Medical University, Fuzhou, China
Background: The relationship between thyroid hormone sensitivity and lipoprotein(a) (Lp(a)) is unclear. The purpose of this study is to illuminate the correlation between thyroid hormone sensitivity and Lp(a) in euthyroid patients with type 2 diabetes mellitus (T2DM).
Method: A cross-sectional study was conducted on 1097 patients with T2DM. The thyroid hormone sensitivity indices, the thyroid feedback quantile-based index (TFQI), the thyroid-stimulating hormone index (TSHI), the thyrotrophic T4 resistance index (TT4RI), and the free triiodothyronine(FT3)/free thyroxine (FT4) ratio were calculated. Linear and binary logistic regression analysis were performed to assess the relationship between thyroid hormone sensitivity indices and Lp(a). Restricted cubic splines were also used to evaluate the association between thyroid hormone sensitivity indices and Lp(a).
Result: Among the 1097 participants, the percentage of Lp(a)≥30 mg/dL was 20.3%. Linear regression analysis revealed that TFQI displayed a positive correlation with Lp(a) levels, whereas the FT3/FT4 ratio exhibited a negative correlation. The adjusted odds ratio (aOR)(95% confidence interval(CI)) for high Lp(a) level was increased with rising TFQI quartiles(Q3: aOR 1.49,95% CI 1.09-2.06; Q4: aOR 1.74, 95% CI 1.36-2.23) (P<0.05),with Q1 as the reference. By contrast,the aOR(95% CI) for high Lp(a) level was decreased with rising FT3/FT4 ratio quartiles (P<0.05). The robustness of these findings was further confirmed by restricted cubic spline analysis.
Conclusion: In euthyroid T2DM patients, decreased sensitivity to thyroid hormones was found to be linked with high Lp(a) level. Screening for thyroid hormone insensitivity and serum Lp(a) levels should be emphasized in euthyroid T2DM patients for early intervention and improved outcomes.
1 Introduction
Thyroid hormones are crucial determinants of overall energy expenditure and significant regulators of various lipid metabolic processes (1, 2).Numerous studies have demonstrated a causal relationship between thyroid dysfunction and dyslipidemia (1, 3, 4). However, prior research has indicated that thyroid hormone or thyroid-stimulating hormone (TSH) levels alone may not fully explain the relationship between the thyroid system and dyslipidemia (3–5), and comprehensive indices can systematically reflect thyroid hormone homeostasis regulation (6). Indices such as the TSH index (TSHI), thyrotrophic T4 resistance index (TT4RI), and thyroid feedback quantile-based index (TFQI) have been validated for assessing central sensitivity to thyroid hormones. By comprehensively considering the levels of TSH and thyroid hormones, these indices can more comprehensively reflect the feedback regulatory effects of thyroid hormones on the hypothalamus and pituitary gland (7). The free triiodothyronine (FT3)/free thyroxine (FT4) ratio reflects the peripheral bioavailability of thyroid hormones, potentially being a more precise and feasible indicator of thyroid hormone metabolic variability than FT3 or FT4 alone (8). A growing body of studies have shown that higher values of these composite indices are associated with dyslipidemia, metabolic syndrome (MS), nonalcoholic fatty liver disease(NAFLD), carotid plaque, and atherosclerosis (AS), even in euthyroid populations (6, 9–13). Duan et al. reported that the risk of resistance to thyroid hormones was positively correlated with high non-high-density lipoprotein cholesterol (non-HDL-C) levels in patients with type 2 diabetes mellitus (T2DM) (14). Non-HDL-C, calculated as total cholesterol (TC) minus high-density lipoprotein cholesterol (HDL-C), includes all plasma lipoproteins, such as low-density lipoprotein cholesterol (LDL-C), triglyceride (TG)-rich lipoprotein (TRL), TRL-remnants, and lipoprotein(a) (Lp(a)) (15). The findings indicates the pathogenic effect of reduced sensitivity to thyroid hormones on serum lipid metabolism.
Dyslipidemia and T2DM represent chronic conditions with profound public health implications (16). Among individuals with T2DM, the incidence of dyslipidemia is high. A study conducted in Ethiopia revealed a 59% prevalence of dyslipidemia among patients with T2DM (17), whereas research in Kenya observed an even higher rate of 86.1% among diabetic patients (18). Disordered lipid metabolism is a major contributor to atherosclerotic cardiovascular disease(ASCVD) risk in T2DM patients (19), who face approximately double the ASCVD risk compared to non-diabetic patients (20). ASCVD, a vascular complication of T2DM, is a leading cause of mortality. Despite the relatively good control of common risk factors, such as hyperlipidemia, hyperglycemia, hypertension, and smoking, the incidence of cardiovascular events remains high in patients with T2DM. It suggests the presence of residual cardiovascular risk (21). Dyslipidemia commonly observed in T2DM patients is characterized by elevated LDL-C, low HDL-C, and elevated TG. In addition to these common dyslipidemias, the fourth “clinical” category of lipid disorders, elevated Lp(a), constitutes an important component of residual cardiovascular risk in T2DM (22).
Lp(a), an LDL-cholesterol-like particle first identified by Dr. Kåre Berg in 1963 (23). Its concentration is predominantly genetically determined, exhibiting significant variations across populations (24). Though no universally recognized absolute risk threshold exists, approximately 20% to 25% of the global population has Lp(a) levels of 50 mg/dL or higher (24), conferring an elevated cardiovascular risk despite optimizing traditional risk factors (25), according to the European Atherosclerosis Society (EAS). High Lp(a) level constitute an independent risk factor for cardiovascular disease, capable of increasing the risk even when LDL-C levels are within the recommended range (21). Hence, screening patients with elevated Lp(a) can identify those needing more intensive cardiovascular risk management.This study aims to illuminate the correlation between thyroid hormone sensitivity and Lp(a) in euthyroid T2DM patients, providing new evidence for the role of impaired thyroid hormone sensitivity for serum atherogenic Lp(a) levels.
2 Methods
2.1 Study population
The current investigation was conducted as a cross-sectional study that included adult inpatients(≥18 years of age) who were diagnosed with T2DM in accordance with the criteria outlined by the American Diabetes Association (ADA) at Longyan First Affiliated Hospital of Fujian Medical University,Fujian,China between December 2022 and June 2024. The exclusion criteria included: (1) pregnant patients and those with other diabetes types; (2) individuals with acute complications of diabetes, such as diabetic ketoacidosis, hyperosmolar state and acute infection; (3) patients with maglingant tumors or life expectancy of less than 1 year; (4) patients with severe liver or renal diseases; (5) lack of essential data on FT3, FT4, TSH and Lp(a); (6) a history of thyroid surgery, antithyroid treatment, or with abnormal thyroid function. Ultimately, 1097 patients were recruited for the study (Figure 1).
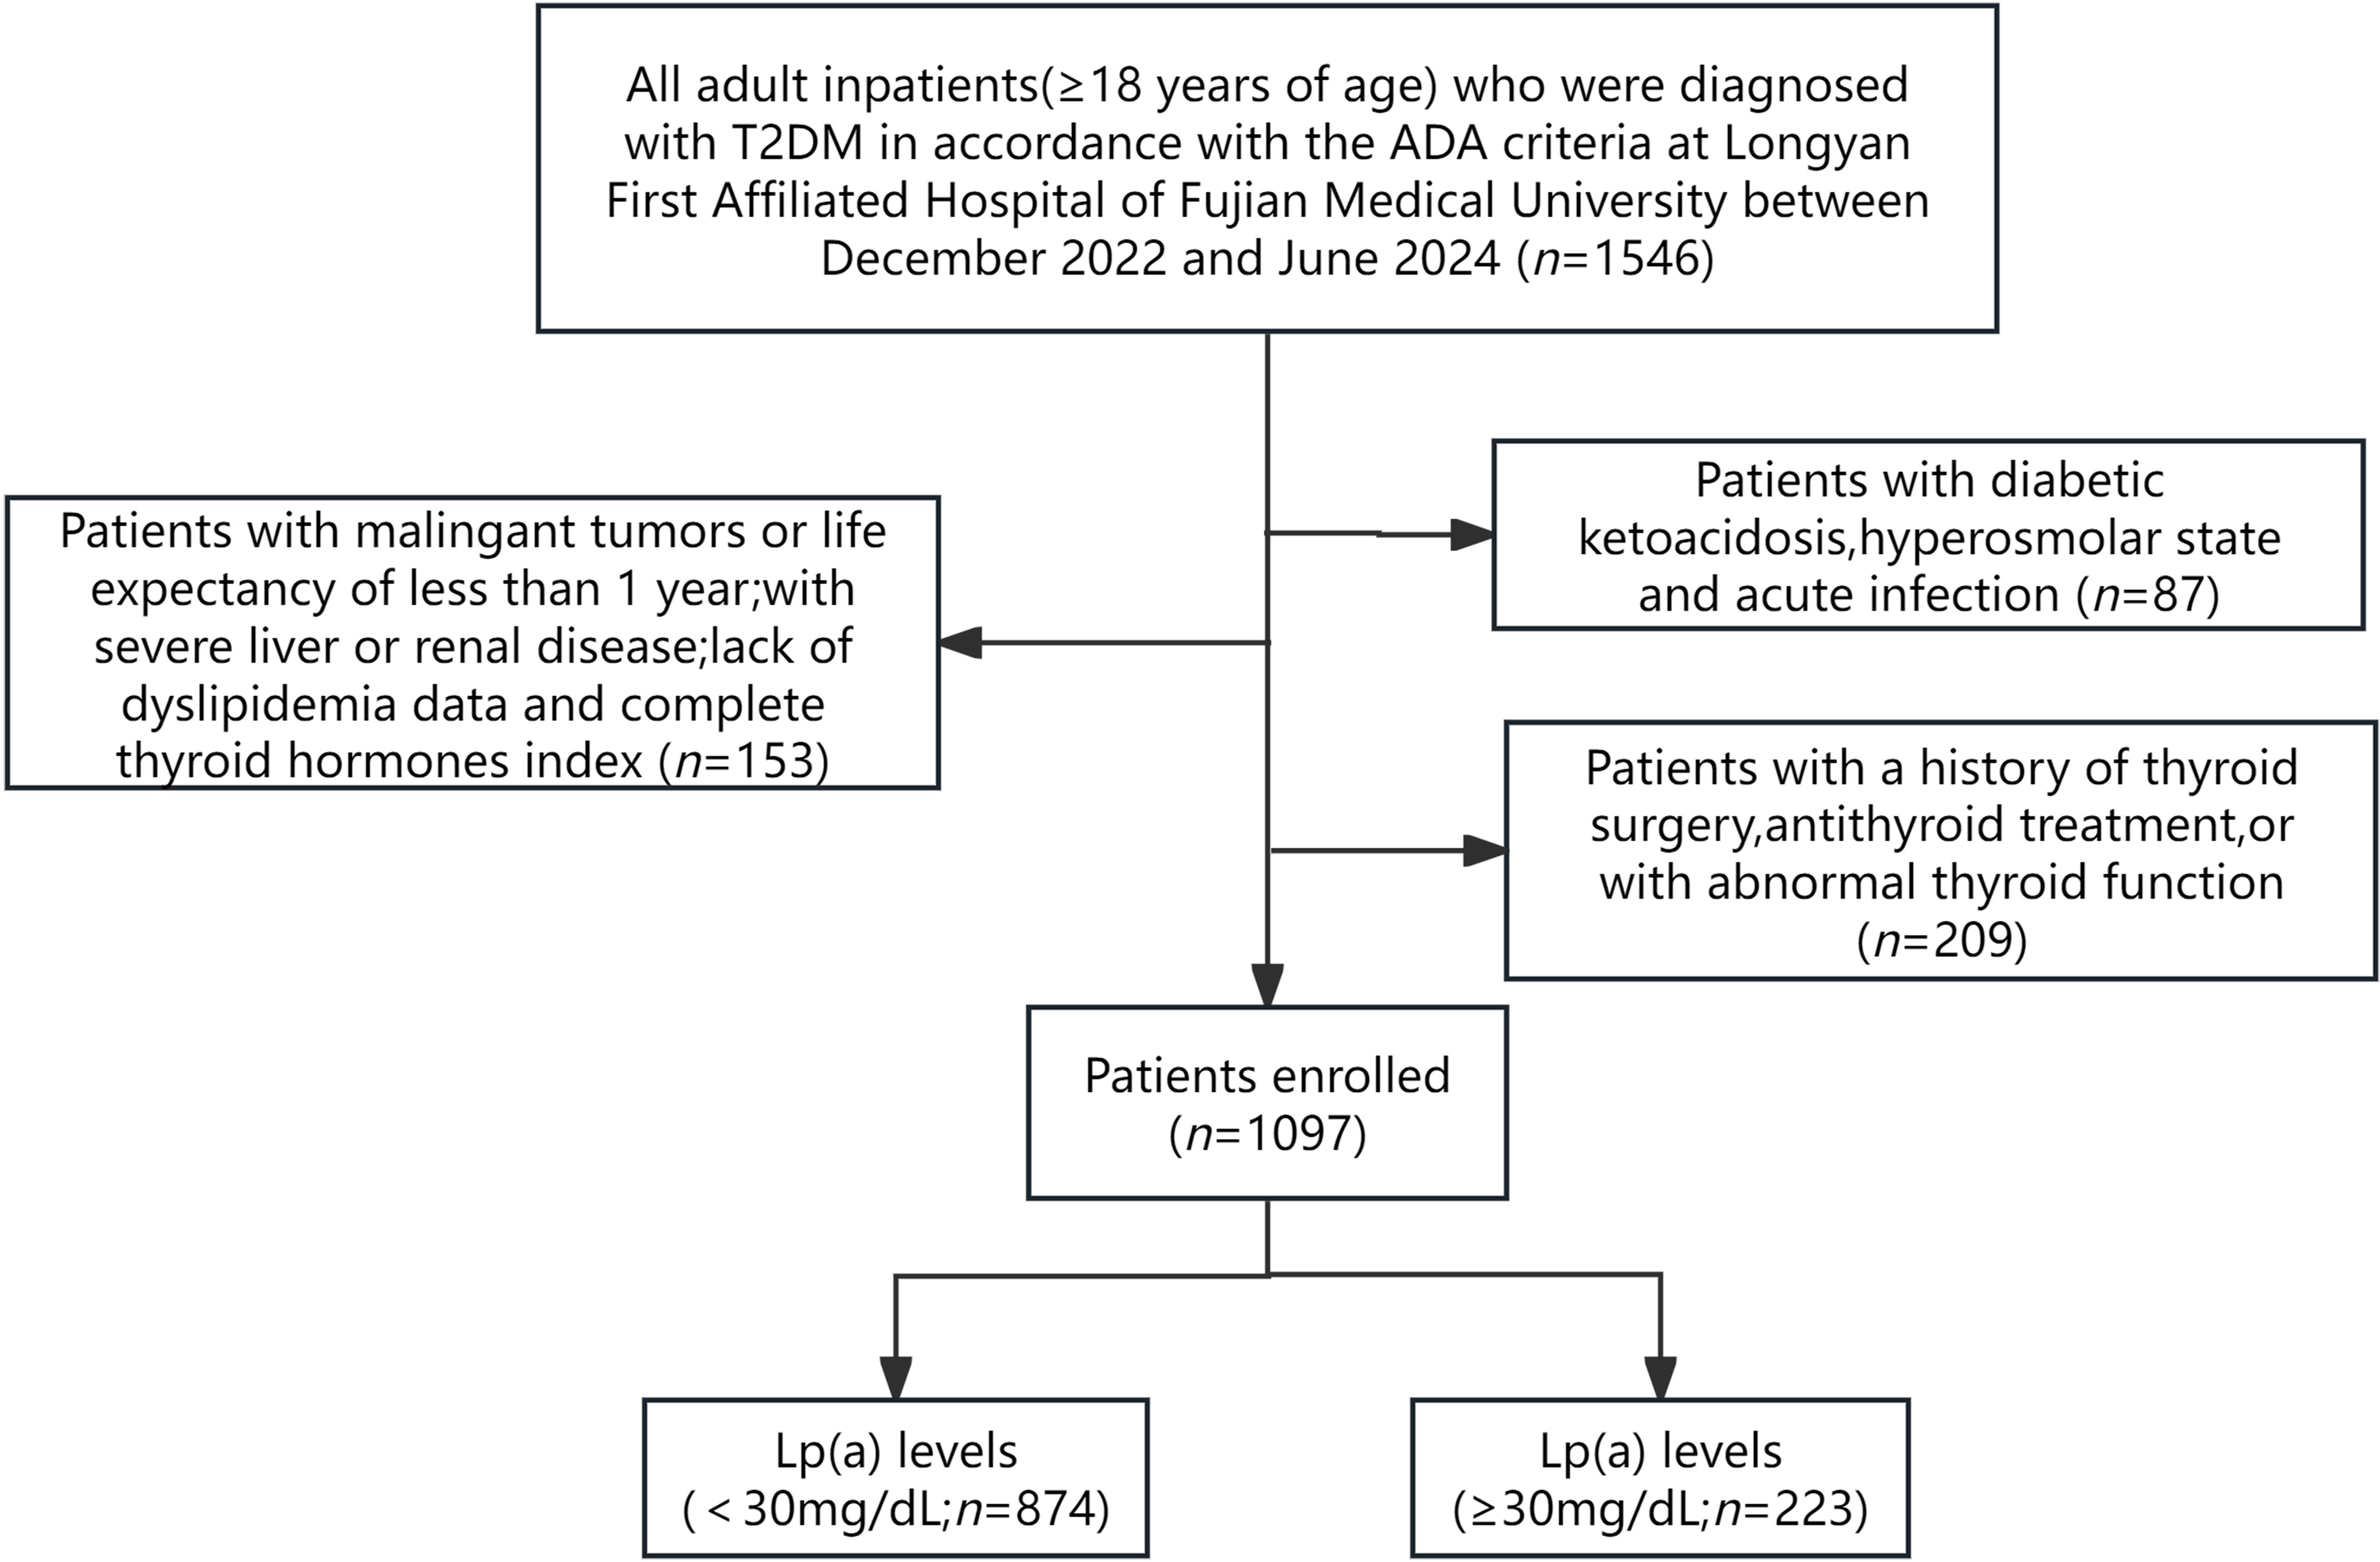
Figure 1. The flow of participants through the trial.
2.2 Clinical and biochemical measurements
Clinical data and biochemical examination results were received from the electronic health record system.Upon admission,standardized measurements of height,weight, and blood pressure (BP) were conducted by the nurse. After an overnight fast, blood samples were collected from participants and analyzed in the biochemistry laboratory at Longyan First Affiliated Hospital of Fujian Medical University. The biochemical parameters evaluated included fasting blood glucose (FBG),glycosylated hemoglobin (HbA1c), TC, TG, HDL-C, LDL-C, Lp(a), alanine aminotransferase(ALT), aspartate aminotransferase(AST),and serum creatinine.
Body mass index (BMI) was computed by dividing weight (kg) by the square of height (m). The estimated glomerular filtration rate (eGFR) was calculated using the serum creatinine level and the Chronic Kidney Disease Epidemiology Collaboration (CKD-EPI) 2009 equation (26). The diagnosis of diabetic retinopathy (DR) was established based on ophthalmological examination and adherence to the International Clinical Diabetic Retinopathy Disease Severity Scale (27). Diabetic nephropathy (DN) was diagnosed when the urinary albumin/creatinine ratio(ACR) was ≥30 mg/mmol or eGFR was <60 mL/min/1.73m², as defined by Kidney Disease improving Global Outcomes (KDIGO) (26, 28). Diabetic peripheral neuropathy (DPN) was diagnosed according to the Chinese guidelines for managing type 2 diabetes mellitus (29). Cardiovascular disease (CVD) encompassed stroke and/or coronary artery disease (CAD).
2.3 Measurement of Lp(a)
Upon admission, lipid profiles were assessed, with Lp(a) levels measured using an auto-immunoturbidimetry assay on an AU5800 Analyzer (Beckman Coulter, Brea, California). The intra-assay and inter-assay coefficients of variation were ≤4% and ≤10%, respectively. Based on previous literature (30) and the manufacturer’s instructions for our hospital’s Lp(a) kit, Lp(a) levels <30 mg/dL were deemed normal. We defined the Lp(a) levels ≥30 mg/dL as high Lp(a) level in this study.
2.4 Measurements of thyroid parameters
TSH levels were assayed using a third-generation immunoassay, while FT3 and FT4 levels were determined via competitive immunoassay methods. The reference intervals for FT3, FT4, and TSH were 3.53-7.37 pmol/L,7.98-16.02 pmol/L, and 0.56-5.91 mIU/L,respectively. Central indices of thyroid hormone sensitivity were calculated using the following formulas:
TFQI=cumulative distribution function(CDF)FT4-(1- CDF TSH);
TSHI=Ln TSH (μIU/mL)+0.1345×FT4 (pmol/L);
TT4RI=FT4 (pmol/L)×TSH (μIU/mL).
For TSHI, TT4RI, and TFQI, higher values implied lower central sensitivity to thyroid hormones (6). Conversely, the peripheral index of thyroid hormone sensitivity was calculated as below:
FT3/FT4 ratio= FT3(pmol/L)/FT4(pmol/L).
Higher ratios indicated greater peripheral sensitivity to thyroid hormones.
2.5 Statistical analysis
Data were presented as mean ± standard deviation or median (interquartile range) depending on the distribution of the continuous variable, and categorical variables were presented as number(%). The unpaired Student’s t test and the Mann-Whitney U test were utilized to assess differences in normally distributed and skewed distributed variables between the two groups, respectively. The Chi-square test was used for categorical variables, as appropriate.
The analysis of Cochran-Armitage was applied for comparing the levels of Lp(a) and the prevalence of T2DM patients with high Lp(a) level across the quartiles of thyroid parameters (TFQI:-0.861≤Q1<-0.309, -0.309≤Q2<-0.0368, -0.0368≤Q3<0.193, 0.193≤Q4 ≤ 0.961; FT3/FT4 ratio: 0.225≤Q1<0.373, 0.373≤Q2< 0.426,0.426≤Q3<0.483,0.483≤Q4 ≤ 0.676). Restricted cubic splines were used to detect the association between high Lp(a) level and thyroid hormone sensitivity indices. The association between Lp(a) and thyroid-associated variables was assessed by univariable and multivariable linear regression. To further evaluate the potential associations of high Lp(a) level with impaired thyroid hormone sensitivity,univariable and multivariable binary logistic regression model were performed. The results of the logistic regression analysis were presented as ORs and 95%CIs. The variance inflation factor was used to measure whether there was multicollinearity among thyroid-associated variables in the regression model. Model 1:crude model; Model 2:adjusted for age, sex and BMI; Model 3:adjusted for age, sex, BMI, DR, AST, eGFR, TG and HDL-C.
Statistical analyses were performed using R,version 4.0.3 software(R Foundation for Statistical Computing, Vienna, Austria),SPSS version 26.0 (IBM corp,Armonk,NY) and the Graphpad prism 10.1.2 software. Two-sided p values<0.05 were considered statistically significant.
3 Results
3.1 Baseline characteristics of the participants
A total of 1097 adults included in this study were grouped into two groups (Lp(a)<30 and ≥30mg/dL). The characteristics of the participants according to different Lp(a) levels are shown in Table 1. The majority were male (63.0%), and the average age was 57.6 years. The median duration of diabetes was 6.0 years, and the glycosylated hemoglobin (HbA1c) was 9.7% ± 2.3. Almost half of the patients had hypertension (45.9%; n=504),26.5% (n=273) had DR,13.0% (n=143) had DN,35.9% (n=394) had DNP, and 11.2% (n=123) had CVD.
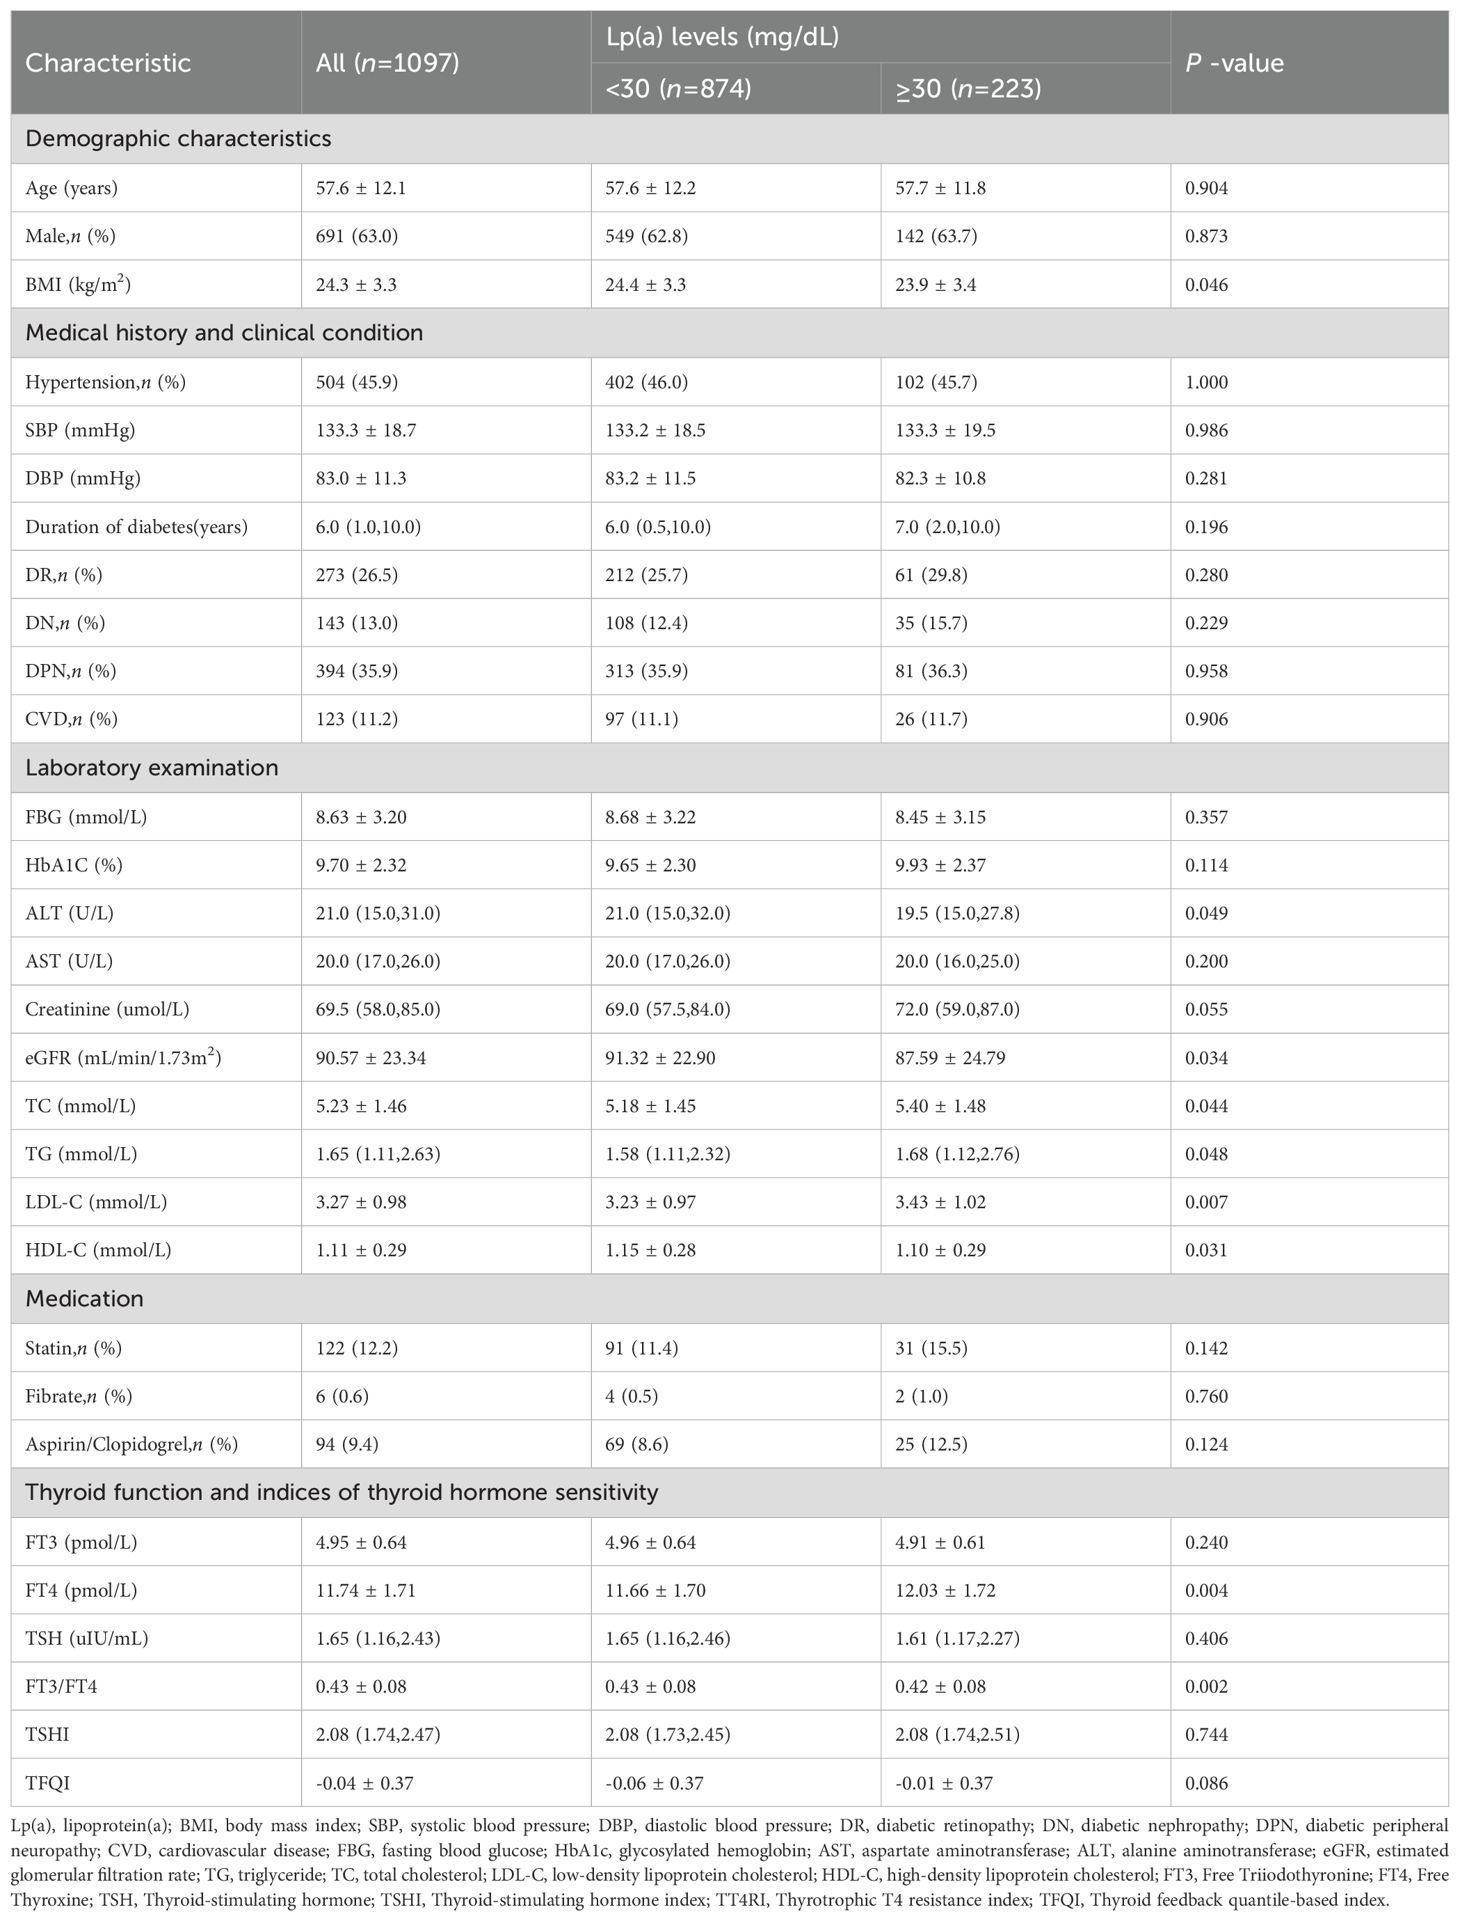
Table 1. Baseline characteristics of the participants.
The percentage of Lp(a)≥30 mg/dL was 20.3% (n=223). The levels of BMI, ALT, eGFR and HDL-C were significantly decreased in the high Lp(a) level group and increased in the normal Lp(a) level group (Lp(a)<30mg/dL)(P<0.05). Participants with high Lp(a) level exhibited higher TC,TG and LDL-C levels(P<0.05). Compared with patients in the Lp(a)<30 mg/dL group, those in the Lp(a)≥30 mg/dL group had higher FT4 levels and lower FT3/FT4 levels(P<0.01). The levels of FT3,TSH,TT4RI,TSHI,and TFQI did not differ between the two groups.
Furthermore, the levels of Lp(a) and the prevalence of high Lp(a) level significantly decreased from the lowest to highest quartiles of FT3/FT4 ratio (P for trend<0.01), while exhibited increasing trend from the lowest to highest quartiles of TFQI (Figure 2).
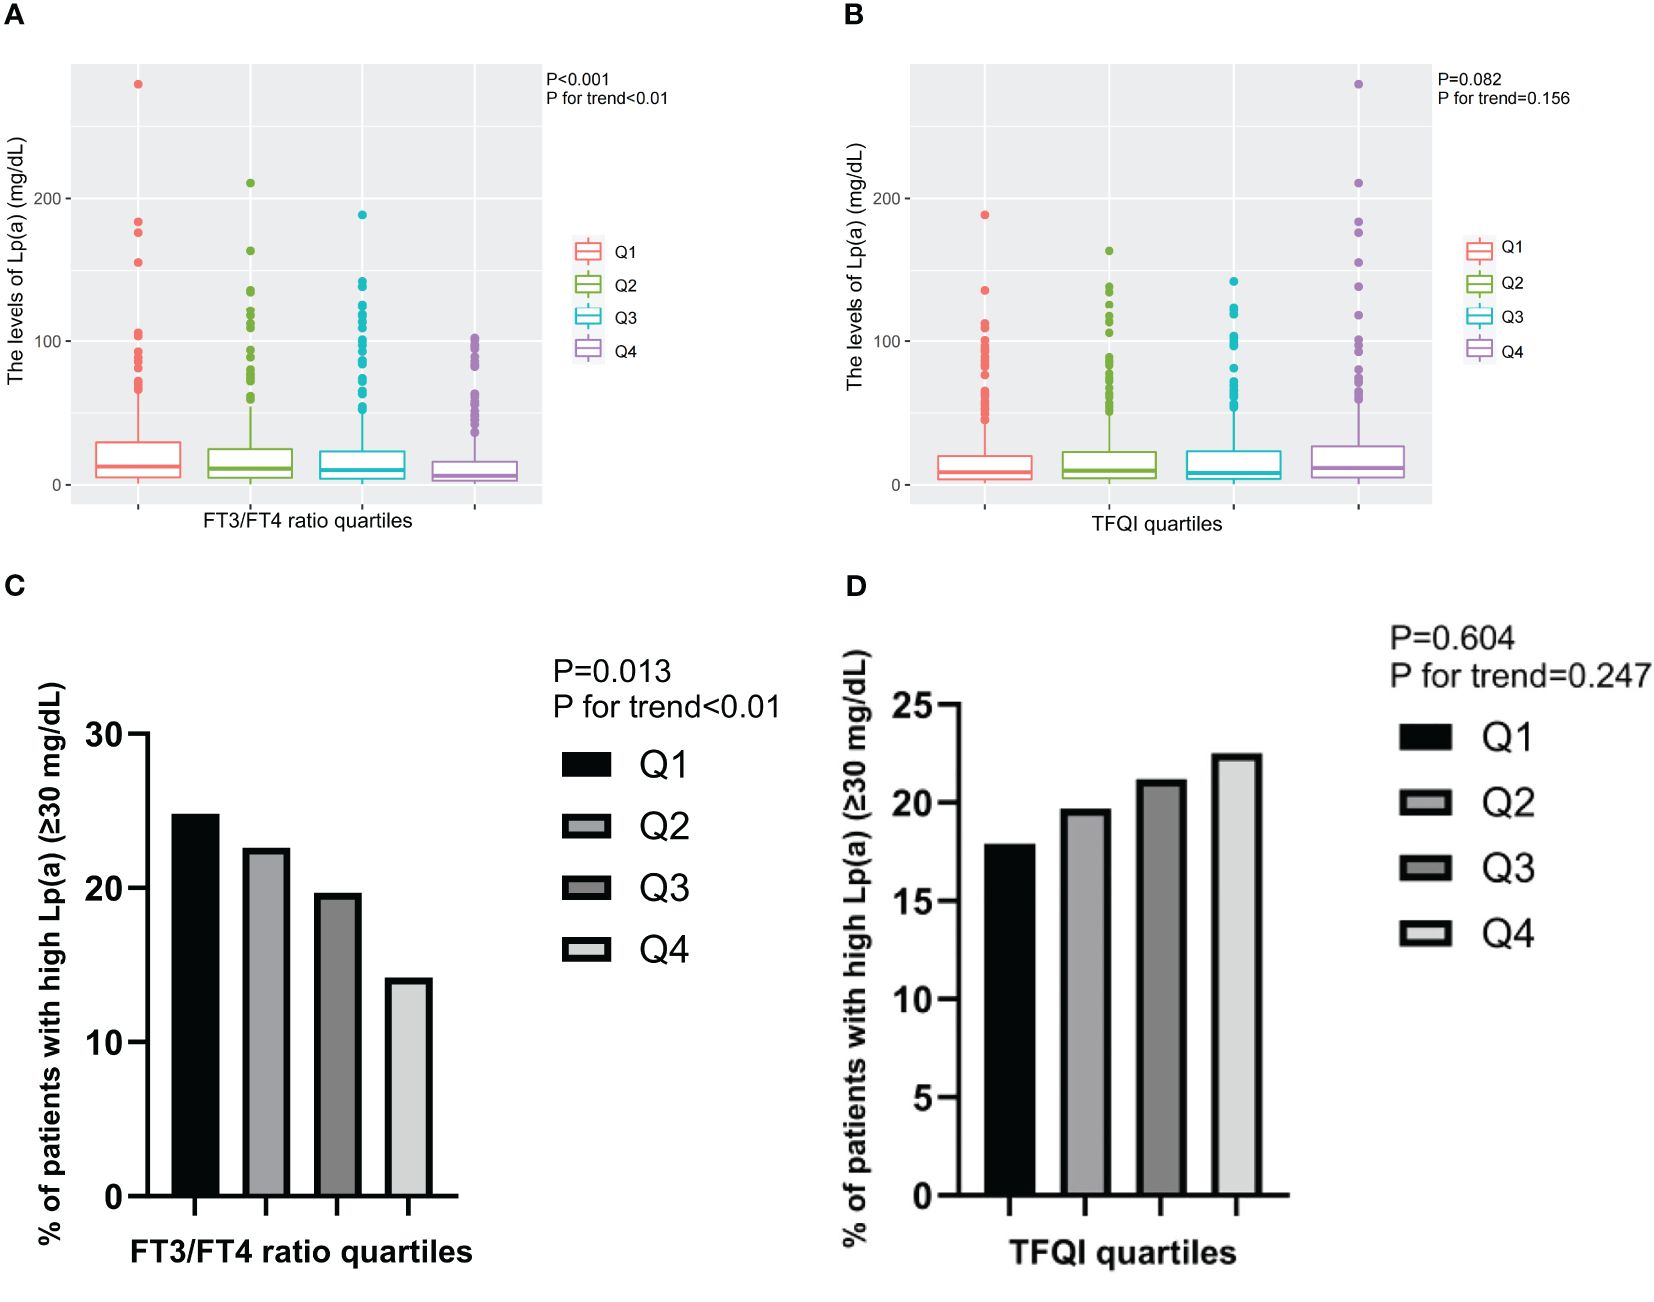
Figure 2. The levels of Lp(a) and the prevalence of T2DM patients with high Lp(a) level across the quartiles of thyroid parameters. (A) The levels of Lp(a) across the FT3/FT4 ratio quartiles. (B) The levels of Lp(a) across the TFQI quartiles. (C) The prevalence of T2DM patients with high Lp(a) level across the FT3/FT4 ratio quartiles. (D) The prevalence of T2DM patients with high Lp(a) level across the TFQI quartiles. Q1, the 1st quartiles; Q2, the 2nd quartiles; Q3, the 3rd quartiles; Q4, the 4th quartiles; Lp(a), lipoprotein(a); NS, P>0.05; FT3, Free Triiodothyronine; FT4, Free Thyroxine; TFQI, Thyroid feedback quantile-based index; T2DM, type 2 diabetes mellitus.
3.2 Association of thyroid related indicators with Lp(a) levels by linear regression analysis
Linear regression analysis indicated that FT4 and TFQI levels were positively associated with Lp(a) levels (Table 2) (all P<0.05). Age, gender, BMI, TG, HDL-C, DR, AST and eGFR were included as covariates in the multivariable analysis. The positive correlations remained after adjusting for covariates. Whereas, FT3/FT4 ratio levels were negatively associated with Lp(a) levels (all P<0.05). The negative relationships remained after full adjustment(all P<0.05). The univariable linear regression model between thyroid parameters and Lp(a) levels in euthyroid patients with T2DM was presented in Additional file: Supplementary Table S1.
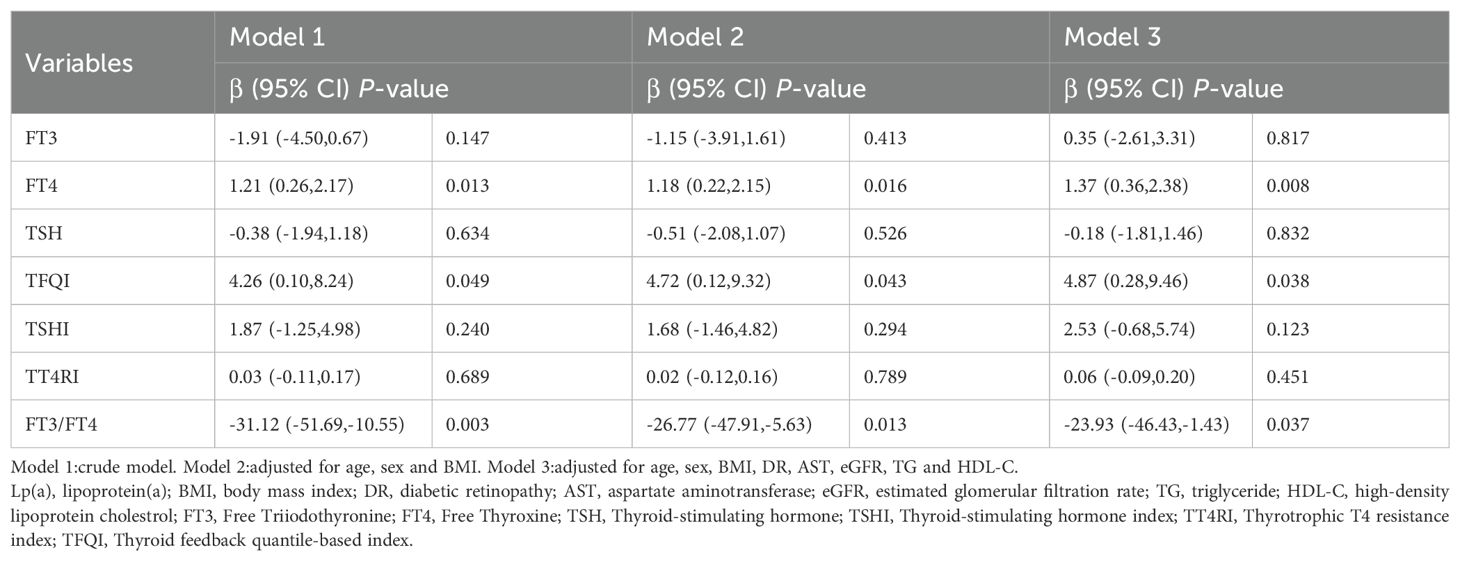
Table 2. Linear regression analysis for the association between Lp(a) levels and thyroid parameters in euthyroid patients with type 2 diabetes mellitus.
3.3 Association of thyroid related indicators with high Lp(a) level by logistic regression analysis
To explore the association between high Lp(a) level and thyroid related indicators, binary logistic regression analysis was applied for calculation (Table 3). For 1 SD increase in FT4 and TFQI,the ORs for high Lp(a) level were 1.16(95% CI 1.05-1.27) and 1.54(95% CI 1.01-2.35) after adjusting for confounding factors, respectively (Table 3) (all P<0.05). Whereas 1 SD increase in FT3/FT4 ratio had an OR of 0.08(95% CI 0.01-0.66) for high Lp(a) level by full adjustment (Table 3) (P<0.05). The association of high Lp(a) level with thyroid parameters in euthyroid patients with T2DM of univariable logistic regression model was presented in Additional file: Supplementary Table S2.
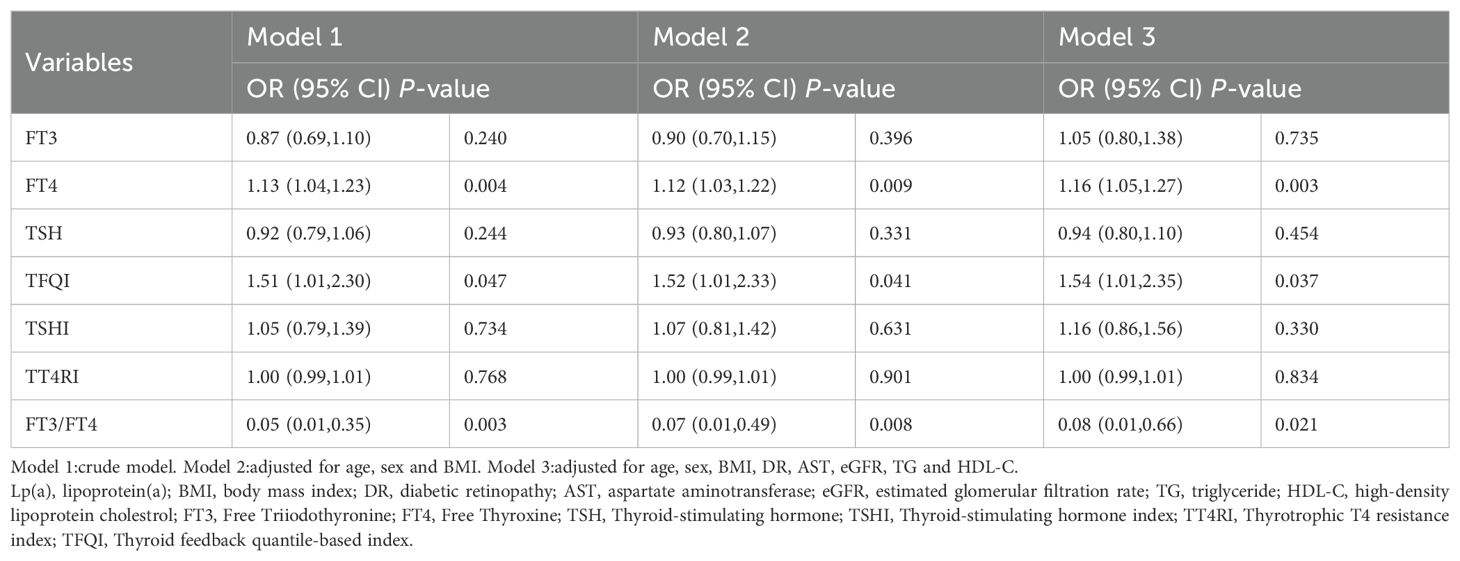
Table 3. Logistic regression analysis for the association between high Lp(a) level and thyroid parameters in euthyroid patients with type 2 diabetes mellitus.
The associations of TFQI and FT3/FT4 ratio quartiles with high Lp(a) level were shown in Figure 3. Compared with the Q1 TFQI levels, the Q3 and Q4 TFQI levels showed positive association with high Lp(a) level after adjustment (Q3: OR 1.49,95% CI 1.09-2.06; Q4: OR 1.74, 95% CI 1.36-2.23) (P<0.05). Instead, there was a negative correlation between the FT3/FT4 ratio and high Lp(a) level (Q2: OR 0.73,95% CI 0.59-0.99; Q3: OR 0.69,95% CI 0.50-0.91; Q4: OR 0.55,95% CI 0.34- 0.89)(P<0.05). However, no significant associations were observed between high Lp(a) level and FT3,TSH,TSHI and TT4RI.
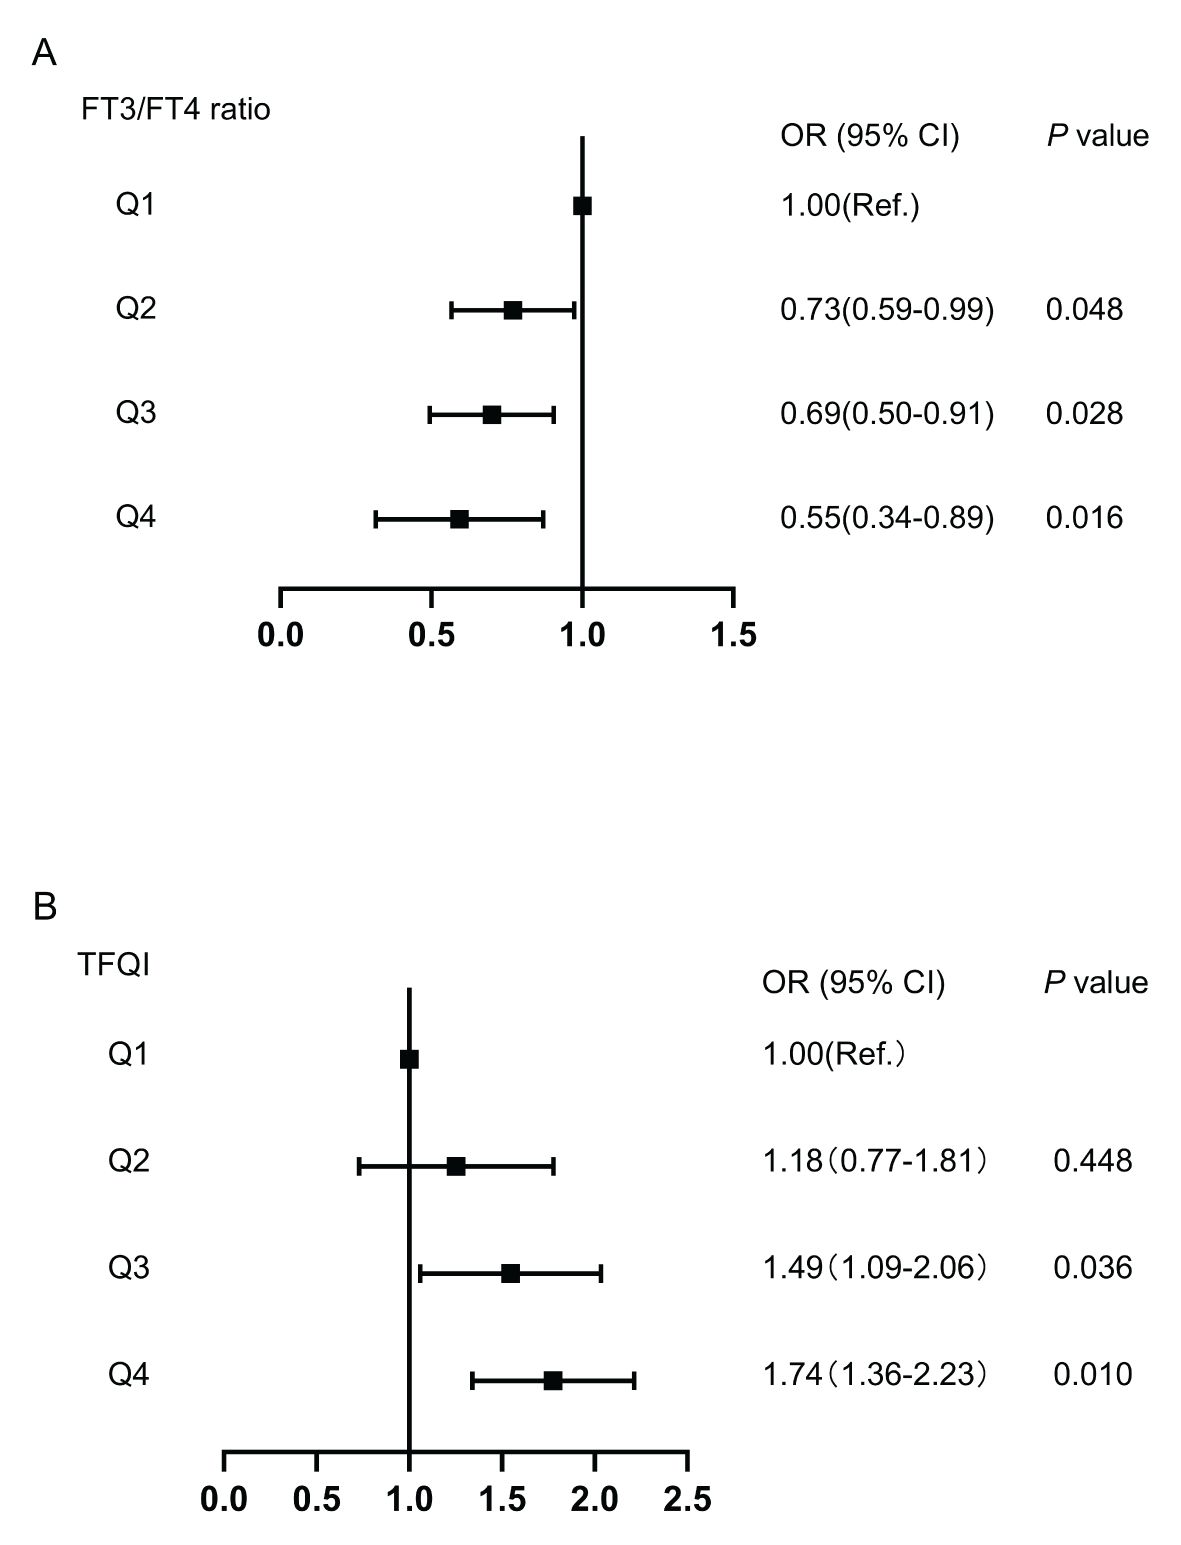
Figure 3. The forest maps of logistic regression analysis for the association between high Lp(a) level and quartiles of FT3/FT4 ratio and TFQI, with the 1st quartile as the reference. (A) The ORs for high Lp(a) level across FT3/FT4 ratio quartiles. (B) The ORs for high Lp(a) level across TFQI quartiles. Model was adjusted for age, sex, BMI, DR, AST, eGFR, TG and HDL-C. Q1, the 1st quartiles; Q2, the 2nd quartiles;Q3, the 3rd quartiles;Q4, the 4th quartiles; Lp(a), lipoprotein(a); BMI, body mass index; DR, diabetic retinopathy; AST, aspartate aminotransferase; eGFR, estimated glomerular filtration rate; TG, triglyceride; HDL-C, high-density lipoprotein cholesterol; FT3, Free Triiodothyronine; FT4, Free Thyroxine; TFQI, Thyroid feedback quantile-based index.
3.4 RCS analysis investigating the relationship between high Lp(a) level and TFQI and FT3/FT4 ratio
We visualized the association between high Lp(a) level and TFQI and FT3/FT4 ratio using RCS analysis in Figure 4. After adjusting for the covariates including age, gender, BMI, TG, HDL-C, DR, AST and eGFR, there was a linear correlation between high Lp(a) level and thyroid hormone sensitivity indices in our study population. We found that the higher the FT3/FT4 ratio, the lower the high Lp(a) level. Conversely, the higher the TFQI, the higher the high Lp(a) level (nonlinear: FT3/FT4 ratio, P=0.6451;TFQI, P=0.6585). The restricted spline curves of the FT3/FT4 ratio and TFQI odds ratio of high Lp(a) level of univariable logistic regression model were presented in Additional file: Supplementary Figure S1.
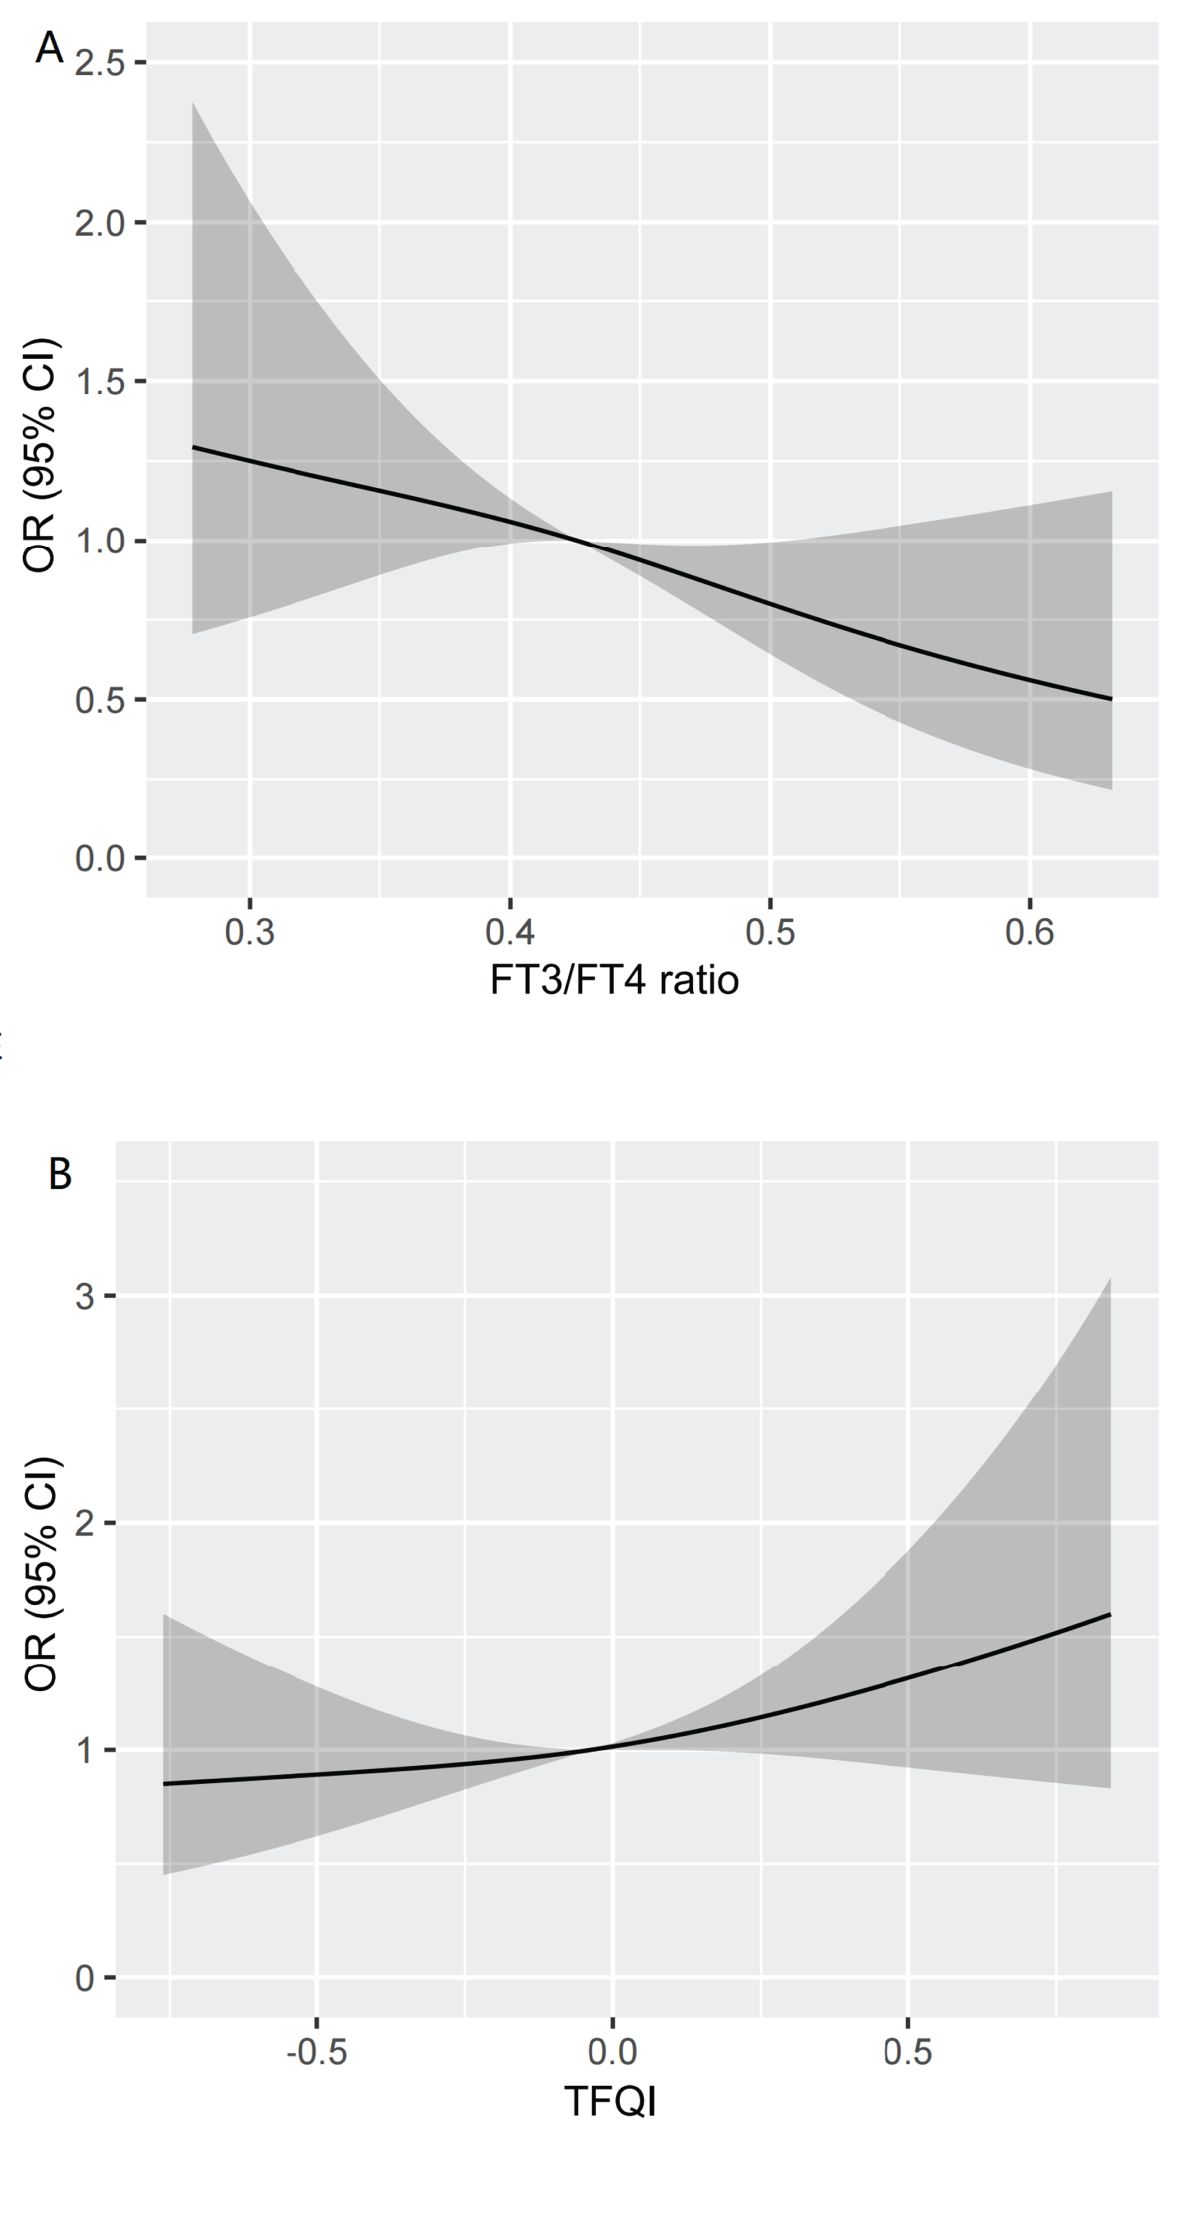
Figure 4. Restricted spline curve of the FT3/FT4 ratio and TFQI odds ratio of high Lp(a) level after adjusting for the covariates including Age, gender, BMI, TG,HDL-C,DR,AST and eGFR. (A) The restricted spline curve of the FT3/FT4 ratio odds ratio of high Lp(a) level. (B) The restricted spline curve of the TFQI odds ratio of high Lp(a) level. Abbreviations: Lp(a), lipoprotein(a); BMI, body mass index; DR, diabetic retinopathy; AST,aspartate aminotransferase; eGFR, estimated glomerular filtration rate; TG, triglyceride; HDL-C, high-density lipoprotein cholesterol; FT3, Free Triiodothyronine; FT4, Free Thyroxine; TFQI, Thyroid feedback quantile-based index.
4 Discussion
To the best of our knowledge, this present study was the first study to investigate the association between thyroid hormone sensitivity and Lp(a) levels in euthyroid patients with T2DM. We found that Lp(a) levels were significantly positively associated with TFQI. Conversely, a negative association was noted between the Lp(a) levels and FT3/FT4 ratio, even after adjusting for multiple confounding factors, suggesting that increased Lp(a) levels were associated with decreased sensitivity to thyroid hormones in euthyroid patients with T2DM.
The association between thyroid hormone sensitivity and lipid metabolism was investigated in previous studies. Liu et al (31) conducted an analysis of the correlations between thyroid hormone sensitivity indices and lipid parameters (including TC, TG, HDL-C, and LDL-C), revealing that the likelihood of dyslipidemia positively aligns with TFQI, TSHI, and TT4RI, while inversely correlates with the FT3/FT4 ratio in individuals with coronary heart disease. Duan et al (14) have documented that the likelihood of elevated non-HDL-C levels exhibits a direct relationship with TFQI,TSHI, and TT4RI, while simultaneously demonstrating an inverse association with the FT3/FT4 ratio in T2DM patients. A recent study, involving a substantial sample size, further suggested that among euthyroid adults, a diminished sensitivity to thyroid hormones is linked to elevated RC levels (12). Hence, thyroid hormone sensitivity emerges as a significant factor in relation to dyslipidemia, indicating that periodic screening of thyroid hormones sensitivity indices in euthyroid patients with T2DM is recommended to facilitate early intervention of dyslipidemia. In line with previous studies, our study revealed that TFQI displayed a positive correlation with Lp(a) levels, whereas the FT3/FT4 ratio exhibited a negative correlation. We also found that in euthyroid patients with T2DM, the prevalence and risk of high Lp(a) level increased as thyroid hormone sensitivity decreased. For instance, for each one-unit increase in the TFQI, the risk of high Lp(a) level increases by 54%.Conversely, for each one-unit increase in the FT3/FT4 ratio, the risk of high Lp(a) level decreases by 8%. Lp(a) in serum constitutes a unique lipoprotein produced by hepatic synthesis. This lipoprotein is characterized as a heterogeneous glycoprotein, specifically an apoB100-containing lipoprotein that undergoes covalent attachment to apoprotein(a) (32). Numerous studies have provided compelling evidence suggesting that an increased level of Lp(a), serves as a primary contributor to the risk of ASCVD, myocardial infarction, and stenosis of the aortic valve (33). The results of our study provided additional support for thyroid hormone resistance as a standalone risk factor contributing to atherogenic lipid profiles and unfavorable cardiovascular outcomes. Consequently, timely identification of thyroid hormone resistance or lipid abnormalities is crucial in prevention and treatment approaches, and reducing the incidence and advancement of these conditions in euthyroid patients with T2DM.
In our research, we observed elevated TFQI levels in individuals with high Lp(a) level, suggesting a state of central resistance to thyroid hormones. To demonstrate the presence of mild central thyroid hormone resistance, we employed three composite indices in this study. Notably, TFQI, a novel index first introduced by Laclaustra et al. in 2019 for detecting acquired thyroid hormone resistance (6), exhibiting greater stability compared to TSHI and TT4RI in assessing thyroid hormone sensitivity (6). Beyond its strong correlation with diabetes and metabolic syndrome, a prospective study revealed that TFQI was independently associated with all-cause mortality in euthyroid individuals (34). In our study, the level of TSHI and TT4RI did not differ among euthyroid patients with T2DM with or without lipid abnormality. This could be attributed to TFQI as a better induce in assessing central sensitivity to thyroid hormones compared to TSHI and TT4RI,and further research is needed to verify this issue. Previous studies have indicated that relatively high TSH levels was positively associated with unfavorable lipid concentration and cardiovascular risks in enthyroid people (2, 35). This is differ to our findings. The differences in research results may be attributable to differences in study populations, sample sizes, and confounding factors. Therefore, it is recommended that euthyroid patients with T2DM undergo regular screening for central sensitivity to thyroid hormones, especially the level of TFQI, to minimize the potential for unfavorable clinical occurrences.
Clinically, thyroid function is assessed by measuring serum levels of FT3, FT4, and TSH. TSH promotes the synthesis and release of FT4. Subsequently, FT4, which affects TSH production by the pituitary gland through a feedback loop, is converted into the active FT3 hormone in thyroid and peripheral tissues, and the FT3/FT4 ratio reflects the proportion of this conversion (36). As such, the two-way feedback regulation of the hypothalamus-pituitary-thyroid (HPT) axis results in relatively complex effects of thyroid hormones (37). In our study, FT4 levels were higher in the high Lp(a) level group and FT4 levels were an independent risk factor for high levels of Lp(a). In our study, neither TSH nor FT3 levels were significantly correlated with the levels of Lp(a). This indicates a stronger correlation between FT4 and Lp(a) levels, compared to FT3 and TSH. As a marker indicating the conversion rate from FT4 to FT3, FT3/FT4 ratio was observed to negatively related to the Lp(a) levels, which could verify the speculation that FT4 exerts more pathogenic effects in the occurrence and aggravation of lipid abnormality. Hence, the euthyroid patients with T2DM should pay attention to the detection of FT4 levels to reduce the risk of adverse clinical events.
The strength of our research is the presentation of further evidence indicating central and peripheral thyroid hormone resistance as an independent risk factor for elevated Lp(a) concentrations in euthyroid patients with T2DM, which holds significant implications for T2DM patients at heightened risk of ASCVD. It is essential to acknowledge the limitations of this study. First, being a cross-sectional analysis, it does not allow for the establishment of a direct causal link between Lp(a) levels and thyroid hormone sensitivity. Additional studies are required to ascertain causality. Second, despite adjusting for multiple confounding factors, we cannot fully rule out the likelihood that serum Lp(a) levels might be impacted by other factors, such as dietary intake, smoking status, physical activity, socioeconomic status, as well as inflammatory or genetic markers, which we did not collect in this study. Third, our analysis, the participants were predominantly Chinese adults, and the data from a single tertiary hospital in China. This not only introduces genetic and ethnic homogeneity but may also introduce institutional or regional bias. Additionally, the sample was limited to patients with T2DM,which will limit the generalizability of the study findings.Furthermore, the size of the sample in this study is relatively small. Consequently, future research endeavors with larger sample sizes are necessitated.
5 Conclusion
This study demonstrated the association of reduced sensitivity to thyroid hormone with high Lp(a) level in euthyroid patients with T2DM. The results of this study emphasize the importance of monitoring thyroid hormone sensitivity and maintaining it at a good level to prevent the occurrence of dyslipidemia in euthyroid patients with T2DM, thereby reduce the overall burden of CVDs. Further research is needed to clarify the underlying mechanisms of this association and prospective cohort studies are needed to explore the causal relationship between reduced sensitivity to thyroid hormone and high Lp(a) level, to pave the way for potential therapeutic interventions targeting diabetes-related CVD risk.
Data availability statement
The raw data supporting the conclusions of this article will be made available by the authors, without undue reservation.
Ethics statement
Written informed consent was obtained from the individual(s) for the publication of any potentially identifiable images or data included in this article.
Author contributions
LZ: Writing – original draft, Writing – review & editing, Data curation, Methodology, Visualization. RL: Investigation, Writing – review & editing. BC: Investigation, Writing – review & editing. WZ: Investigation, Writing – review & editing. MT: Resources, Supervision, Writing – review & editing. WW: Formal Analysis, Supervision, Validation, Writing – review & editing, Conceptualization.
Funding
The author(s) declare that no financial support was received for the research and/or publication of this article.
Conflict of interest
The authors declare that the research was conducted in the absence of any commercial or financial relationships that could be construed as a potential conflict of interest.
Generative AI statement
The author(s) declare that no Generative AI was used in the creation of this manuscript.
Correction note
A correction has been made to this article. Details can be found at: 10.3389/fendo.2025.1654047.
Publisher’s note
All claims expressed in this article are solely those of the authors and do not necessarily represent those of their affiliated organizations, or those of the publisher, the editors and the reviewers. Any product that may be evaluated in this article, or claim that may be made by its manufacturer, is not guaranteed or endorsed by the publisher.
Supplementary material
The Supplementary Material for this article can be found online at: https://www.frontiersin.org/articles/10.3389/fendo.2025.1591108/full#supplementary-material
Supplementary Figure 1 | Restricted spline curve of the FT3/FT4 ratio and TFQI odds ratio of high Lp(a) level of univariable logistic regression model. (A) The restricted spline curve of the FT3/FT4 ratio odds ratio of high Lp(a) level. (B) The restricted spline curve of the TFQI odds ratio of high Lp(a) level.
Supplementary Table 1 | Univariable linear regression model for the association between Lp(a) levels and thyroid parameters in euthyroid patients with T2DM.
Supplementary Table 2 | Univariable logistic regression model for the association between high Lp(a) level and thyroid parameters in euthyroid patients with T2DM.
Abbreviations
ACR, albumin/creatinine ratio; ADA, American Diabetes Association; ALT, alanine aminotransferase; AST, aspartate aminotransferase; AS, atherosclerosis; ASCVD,atherosclerotic cardiovascular disease; BMI, body mass index; CAD, coronary artery disease; CDF, cumulative distribution function; CKD-EPI, Chronic Kidney Disease Epidemiology Collaboration; CVD, cardiovascular disease; DBP, diastolic blood pressure; DN, diabetic nephropathy; DPN, diabetic peripheral neuropathy; DR, diabetic retinopathy; eGFR, estimated glomerular filtration rate; EAS, European Atherosclerosis Socity; FBG, fasting blood glucose; FT3, Free Triiodothyronine; FT4, Free Thyroxine; HbA1c, glycosylated hemoglobin; HDL-C, high-density lipoprotein cholesterol; KDIGO, Kidney Disease Improving Global Outcomes; LDL-C, low-density lipoprotein cholesterol; Lp(a), lipoprotein(a); MS, metabolic syndrome; NAFLD, nonalcoholic fatty liver disease; non-HDL-C, non-high-density lipoprotein cholesterol; SBP, systolic blood pressure; T2DM, type 2 diabetes mellitus;TC, total cholesterol; TG, triglyceride; TFQI, Thyroid feedback quantile-based index; TG, triglyceride; TRL, triglyceride-rich lipoprotein;TSH, Thyroid-stimulating hormone; TSHI, Thyroid-stimulating hormone index; TT4RI, Thyrotrophic T4 resistance index.
References
1. Kim B. Thyroid hormone as a determinant of energy expenditure and the basal metabolic rate. Thyroid. (2008) 18:141–4. doi: 10.1089/thy.2007.0266
2. Bulum T, Kolarić B, and Duvnjak L. Insulin sensitivity modifies the relationship between thyroid function and lipid profile in euthyroid type 1 diabetic patients. Endocrine. (2012) 42:139–45. doi: 10.1007/s12020-012-9598-y
3. Liu XQ, Rahman A, Bagdade JD, Alaupovic P, and Kannan CR. Effect of thyroid hormone on plasma apolipoproteins and apoA- and apoB-containing lipoprotein particles. Eur J Clin Invest. (1998) 28:266–70. doi: 10.1046/j.1365-2362.1998.00274.x
4. Beukhof CM, Massolt ET, Visser TJ, Korevaar TIM, Medici M, de Herder WW, et al. Effects of thyrotropin on peripheral thyroid hormone metabolism and serum lipids. Thyroid. (2018) 28:168–74. doi: 10.1089/thy.2017.0330
5. Mavromati M and Jornayvaz FR. Hypothyroidism-associated dyslipidemia: potential molecular mechanisms leading to NAFLD. Int J Mol Sci. (2021) 23:22. doi: 10.3390/ijms222312797
6. Laclaustra M, Moreno-Franco B, Lou-Bonafonte JM, Mateo-Gallego R, Casasnovas JA, Guallar-Castillon P, et al. Impaired sensitivity to thyroid hormones is associated with diabetes and metabolic syndrome. Diabetes Care. (2019) 42:303–10. doi: 10.2337/dc18-1410
7. Lu Y, Wang J, An Y, Liu J, Wang Y, Wang G, et al. Impaired sensitivity to thyroid hormones is associated with hyperuricemia in a Chinese euthyroid population. Front Endocrinol (Lausanne). (2023) 14:1132543. doi: 10.3389/fendo.2023.1132543
8. Sun M, Yu L, Zhao X, Ren L, Liu X, Gang X, et al. Correlation between thyroid hormone sensitivity and diabetic peripheral neuropathy in euthyroid patients with type 2 diabetes mellitus. Sci Rep. (2024) 14:19603. doi: 10.1038/s41598-024-70673-3
9. Du J, Zhao X, Xu X, Zhang Z, and Zhang X. Association between thyroid parameters and subclinical atherosclerosis in hospitalised euthyroid patients with type 2 diabetes mellitus. Diabetes Metab Syndr Obes. (2023) 16:3163–71. doi: 10.2147/dmso.S429941
10. Yu N, Wang L, Zeng Y, Zhao Y, Chen S, Pan H, et al. The association of thyroid hormones with coronary atherosclerotic severity in euthyroid patients. Horm Metab Res. (2022) 54:12–9. doi: 10.1055/a-1718-6283
11. Liu Y, Li Z, Yang T, Li L, Yu L, Liu F, et al. Impaired sensitivity to thyroid hormones and carotid plaque in patients with coronary heart disease: A RCSCD-TCM study in China. Front Endocrinol (Lausanne). (2022) 13:940633. doi: 10.3389/fendo.2022.940633
12. Mehran L, Delbari N, Amouzegar A, Hasheminia M, Tohidi M, and Azizi F. Reduced sensitivity to thyroid hormone is associated with diabetes and hypertension. J Clin Endocrinol Metab. (2022) 107:167–76. doi: 10.1210/clinem/dgab646
13. Lai S, Li J, Wang Z, Wang W, and Guan H. Sensitivity to thyroid hormone indices are closely associated with NAFLD. Front Endocrinol (Lausanne). (2021) 12:766419. doi: 10.3389/fendo.2021.766419
14. Duan XY, Fu JL, Sun LN, Mu ZJ, and Xiu SL. Association between sensitivity to thyroid hormones and non-high-density lipoprotein cholesterol levels in patients with type 2 diabetes mellitus. World J Diabetes. (2024) 15:2081–92. doi: 10.4239/wjd.v15.i10.2081
15. Chinese Elderly Type 2 Diabetes Prevention and Treatment of Clinical Guidelines Writing Group, Geriatric Endocrinology and Metabolism Branch of Chinese Geriatric Society, Geriatric Endocrinology and Metabolism Branch of Chinese Geriatric Health Care Society, Geriatric Professional Committee of Beijing Medical Award Foundation, , and National Clinical Medical Research Center for Geriatric Diseases (PLA General Hospital). Clinical guidelines for prevention and treatment of type 2 diabetes mellitus in the elderly in China (2022 edition). Zhonghua Nei Ke Za Zhi. (2022) 61:12–50. doi: 10.3760/cma.j.cn112138-20211027-00751
16. Newman CB, Blaha MJ, Boord JB, Cariou B, Chait A, Fein HG, et al. Lipid management in patients with endocrine disorders: an endocrine society clinical practice guideline. J Clin Endocrinol Metab. (2020) 12:105. doi: 10.1210/clinem/dgaa674
17. Kebede WM, Gizachew KD, and Mulu GB. Prevalence and Risk Factors of Dyslipidemia among Type 2 Diabetes Patients at a Referral Hospital, North Eastern Ethiopia. Ethiop J Health Sci. (2021) 31:1267–76. doi: 10.4314/ejhs.v31i6.23
18. Hirsi AM, Abdi AA, Peris A, Jacinto A, Muhammad P, Nur IA, et al. Patterns and factors associated with dyslipidemia among patients with diabetes mellitus attending hoima regional referral hospital, Uganda. Int J Gen Med. (2025) 18:73–86. doi: 10.2147/ijgm.S494941
19. Ma CX, Ma XN, Guan CH, Li YD, Mauricio D, and Fu SB. Cardiovascular disease in type 2 diabetes mellitus: progress toward personalized management. Cardiovasc Diabetol. (2022) 21:74. doi: 10.1186/s12933-022-01516-6
20. Wang C, Xie Z, Huang X, Wang Z, ShangGuan H, and Wang S. Prevalence of cardiovascular disease risk factors in Chinese patients with type 2 diabetes mellitus, 2013-2018. Curr Med Res Opin. (2022) 38:345–54. doi: 10.1080/03007995.2021.2022382
21. Vinci P, Di Girolamo FG, Panizon E, Tosoni LM, Cerrato C, Pellicori F, et al. Lipoprotein(a) as a risk factor for cardiovascular diseases: pathophysiology and treatment perspectives. Int J Environ Res Public Health. (2023) 18:20. doi: 10.3390/ijerph20186721
22. Yu B, Hu X, Liu J, Nie Z, Ren Luo Bu C, Li G, et al. Lipoprotein(a) as a Higher Residual Risk for Coronary Artery Disease in Patients with Type 2 Diabetes Mellitus than without. Int J Gen Med. (2023) 16:3383–91. doi: 10.2147/ijgm.S423458
23. Berg K. A new serum type system in man–the LP system. Acta Pathol Microbiol Scand. (1963) 59:369–82. doi: 10.1111/j.1699-0463.1963.tb01808.x
24. Varvel S, McConnell JP, and Tsimikas S. Prevalence of elevated lp(a) mass levels and patient thresholds in 532–359 patients in the United States. Arterioscler Thromb Vasc Biol. (2016) 36:2239–45. doi: 10.1161/atvbaha.116.308011
25. O’Donoghue ML, Fazio S, Giugliano RP, Stroes ESG, Kanevsky E, Gouni-Berthold I, et al. Lipoprotein(a), PCSK9 inhibition, and cardiovascular risk. Circulation. (2019) 139:1483–92. doi: 10.1161/circulationaha.118.037184
26. Seidu S, Barrat J, and Khunti K. Clinical update: The important role of dual kidney function testing (ACR and eGFR) in primary care: Identification of risk and management in type 2 diabetes. Prim Care Diabetes. (2020) 14:370–5. doi: 10.1016/j.pcd.2020.02.006
27. Wilkinson CP, Ferris FL 3rd, Klein RE, Lee PP, Agardh CD, Davis M, et al. Proposed international clinical diabetic retinopathy and diabetic macular edema disease severity scales. Ophthalmology. (2003) 110:1677–82. doi: 10.1016/s0161-6420(03)00475-5
28. Adeera SL, Rudolf WB, and Josef C. Chapter 1: definition and classification of CKD. Kidney Int Suppl (2011). (2013) 3:19–62. doi: 10.1038/kisup.2012.64
29. Jia W, Weng J, Zhu D, Ji L, Lu J, Zhou Z, et al. Standards of medical care for type 2 diabetes in China 2019. Diabetes Metab Res Rev. (2019) 35:e3158. doi: 10.1002/dmrr.3158
30. Chen Z, Jiang C, Qu H, Liang S, Yang J, Wu H, et al. Association of lipoprotein(a) and major adverse cardiovascular events in patients with percutaneous coronary intervention. Arch Med Sci. (2019) 15:1375–80. doi: 10.5114/aoms.2018.79401
31. Liu Y, Ma M, Li L, Liu F, Li Z, Yu L, et al. Association between sensitivity to thyroid hormones and dyslipidemia in patients with coronary heart disease. Endocrine. (2023) 79:459–68. doi: 10.1007/s12020-022-03254-x
32. Nicholls SJ, Tang WH, Scoffone H, Brennan DM, Hartiala J, Allayee H, et al. Lipoprotein(a) levels and long-term cardiovascular risk in the contemporary era of statin therapy. J Lipid Res. (2010) 51:3055–61. doi: 10.1194/jlr.M008961
33. Thomas PE, Vedel-Krogh S, Kamstrup PR, and Nordestgaard BG. Lipoprotein(a) is linked to atherothrombosis and aortic valve stenosis independent of C-reactive protein. Eur Heart J. (2023) 44:1449–60. doi: 10.1093/eurheartj/ehad055
34. Sun H, Zhu W, Liu J, An Y, Wang Y, and Wang G. Reduced sensitivity to thyroid hormones is associated with high remnant cholesterol levels in chinese euthyroid adults. J Clin Endocrinol Metab. (2022) 108:166–74. doi: 10.1210/clinem/dgac523
35. Bakker SJ, ter Maaten JC, Popp-Snijders C, Slaets JP, Heine RJ, and Gans RO. The relationship between thyrotropin and low density lipoprotein cholesterol is modified by insulin sensitivity in healthy euthyroid subjects. J Clin Endocrinol Metab. (2001) 86:1206–11. doi: 10.1210/jcem.86.3.7324
36. Chen X, Zhou Y, Zhou M, Yin Q, and Wang S. Diagnostic values of free triiodothyronine and free thyroxine and the ratio of free triiodothyronine to free thyroxine in thyrotoxicosis. Int J Endocrinol. (2018) 2018:4836736. doi: 10.1155/2018/4836736
Keywords: lipoprotein(a), sensitivity to thyroid hormones, type 2 diabetes mellitus, thyroid feedback quantile-based index, free triiodothyronine/free thyroxine ratio
Citation: Zhong L, Lin R, Cao B, Zhong W, Tu M and Wei W (2025) Impaired sensitivity to thyroid hormones is associated with high lipoprotein(a) level in euthyroid patients with type 2 diabetes mellitus. Front. Endocrinol. 16:1591108. doi: 10.3389/fendo.2025.1591108
Received: 10 March 2025; Accepted: 02 June 2025;
Published: 25 June 2025; Corrected: 10 July 2025.
Edited by:
Davide Gnocchi, University of Bari Medical School, ItalyReviewed by:
Sandra Incerpi, Roma Tre University, ItalySuman Bharti, Washington University in St. Louis, United States
Saurabh Mishra, Cleveland Clinic, United States
Mritunjay Kumar Mishra, GMERS Medical College, India
Copyright © 2025 Zhong, Lin, Cao, Zhong, Tu and Wei. This is an open-access article distributed under the terms of the Creative Commons Attribution License (CC BY). The use, distribution or reproduction in other forums is permitted, provided the original author(s) and the copyright owner(s) are credited and that the original publication in this journal is cited, in accordance with accepted academic practice. No use, distribution or reproduction is permitted which does not comply with these terms.
*Correspondence: Wen Wei, MTgxMzkwOTg5QHFxLmNvbQ==; Mei Tu, dG0xMzg1OTU5NjYyOEAxNjMuY29t