 Subin Hada
 Charles C. Solvason
 Mario R. Eden
- Department of Chemical Engineering, Auburn University, Auburn, AL, USA
In this work, multivariate characterization data such as infrared spectroscopy was used as a source of descriptor data involving information on molecular architecture for designing structured molecules with tailored properties. Application of multivariate statistical techniques such as principal component analysis allowed capturing important features of the molecular architecture from enormous amount of complex data to build appropriate latent variable models. Combining the property clustering techniques and group contribution methods based on characterization (cGCM) data in a reverse problem formulation enabled identifying candidate components by combining or mixing molecular fragments until the resulting properties match the targets. The developed methodology is demonstrated using molecular design of biodiesel additive, which when mixed with off-spec biodiesel produces biodiesel that meets the desired fuel specifications. The contribution of this work is that the complex structures and orientations of the molecule can be included in the design, thereby allowing enumeration of all feasible candidate molecules that matched the identified target but were not part of original training set of molecules.
Introduction
The impacts on the environment related to fossil raw materials are the driving force for sustainable development concepts and their use in industry. This also has implications for the design of chemical products and their production routes. Biofuels, mainly ethanol used in gasoline engines and fatty acid alkyl esters (biodiesel) as well as their blends with petro-diesel used in diesel engines, are some of the few alternatives that do not required significant new infrastructure or change on the part of consumers or auto manufacturers. Recently, biodiesel has attracted much attention as an important renewable energy source and is expected to grow higher than gasoline demand growth (Janaun and Ellis, 2010).
Because of its biological origin, biodiesel has many advantages compared to its petroleum derived counterparts such as renewability, biodegradability, reduction of most regulated exhaust emissions due to lack of sulfur, etc. However, due to the inverse relationship between oxidative stability and low-temperature operability, the design of an optimal fuel for all environments can be a rather difficult task (Knothe et al., 2005). Moreover, feedstock logistics and competition with food markets result in biorefineries having to use multiple feedstocks to produce biodiesel blends that meet stringent environmental and fuel performance targets. As a result, design of an optimal fuel for all environments can be a quite difficult task.
In this paper, within the computer-aided molecular design (CAMD) framework, a characterization-based method was combined with chemometric and property clustering techniques in reverse problem formulation (RPF) to molecularly design biodiesel additives that correspond to particular set of desired physico-chemical properties.
Biodiesel
Any type of feedstock that contains free fatty acids and/or triglycerides such as vegetable oil, waste oil, animal fat, and waste grease can be converted into biodiesel (alkyl ester) through alkali-catalyzed, acid-catalyzed, and enzyme-catalyzed processes. Figure 1 represents an acid-catalyzed transesterification reaction where R1, R2, and R3 represents long chain fatty acid radicals of the mixed triglycerides used whereas R′ represents alkyl radical of the alcohol used (Knothe et al., 2005). Figure 2 shows a typical triglyceride structure of soybean oil that is made up of mixed fatty acid fragments and a glycerol fragment. Glycerol is the main byproduct in the biodiesel production. Transesterification does not alter the fatty acid composition of the feedstocks and this composition plays an important role in some critical parameters of biodiesel.
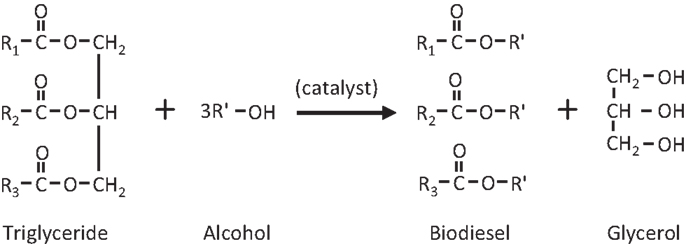
Figure 1. Overall stoichiometric transesterification reaction scheme.
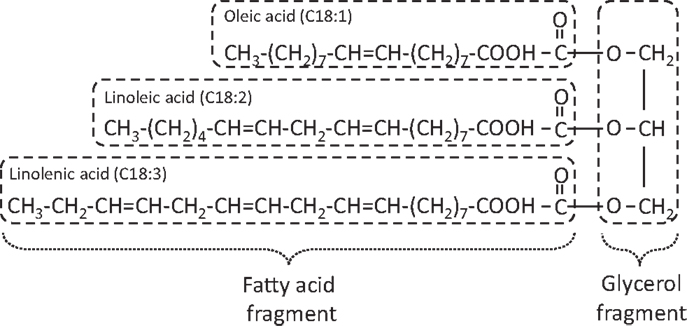
Figure 2. A typical triglyceride molecule with different fatty acid chains of soybean oil.
Since the fatty acid profile varies with different feedstock, the final quality (physical and chemical fuel properties) of the biodiesel product varies depending upon the parent feedstock used (Canakci and Sanli, 2008; Knothe, 2008; Moser, 2009). A feedstock dependent fuel property is one of the technical difficulties associated with biodiesel that have limited its wide usability. Fatty acids vary in their carbon chain length and in the number of double bonds (unsaturation level), and are represented by C XX:Y where “XX” is the number of carbon atoms and “Y” is the number of double bonds. The fatty acid distributions of some feedstock commonly used in biodiesel production are shown in Table 1 (Canakci and Sanli, 2008).
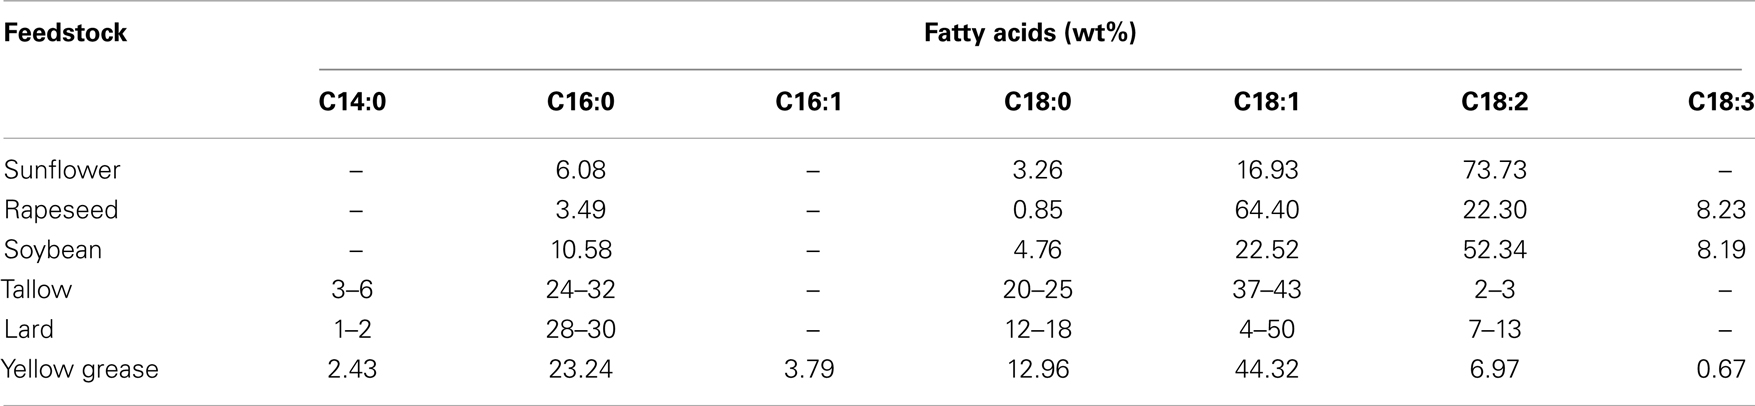
Table 1. Fatty acid profiles of some common biodiesel feedstock.
Technical Difficulties with Biodiesel Use
Although, biodiesel, because of its biological origin, has many advantages compared to its petroleum counterparts, it has several technical problems that have persisted to the present and have impaired its use and commercialization. Three major limitations are oxidative stability, low-temperature operability, and increased nitrogen oxide (NOx) exhaust emissions (Knothe et al., 2005). Simultaneous solution of these problems has proven difficult as improvements in one area tend to impair another (Knothe et al., 2005). For example, there exist an inverse relationship between oxidative stability and low-temperature operability; structural factors that improve oxidative stability adversely influence low-temperature operability and vice versa (Moser, 2009). Therefore, the design of an optimal fuel for all climate and seasonal conditions of a region can be a challenge.
Several approaches are possible for improving the fuel properties of biodiesel (Ribeiro et al., 2007; Knothe, 2009; Boshui et al., 2010). Modification of the fatty acid composition through physical processes or uses of additives are the most prevalent (Wang et al., 2005). Figure 3 presents an overview of the various approaches (A–E) that have been explored (Knothe, 2009). Fuel additives, such as antioxidants, cetane enhancers, or cold-flow improvers have become indispensable tools not only to alleviate the drawbacks described above, but also to assure that any fuel blend will meet international and regional standards regardless of origin. However, it is also equally important to ensure that the formulations of these additives cover a blend of biodiesels originating from multiple feedstocks.
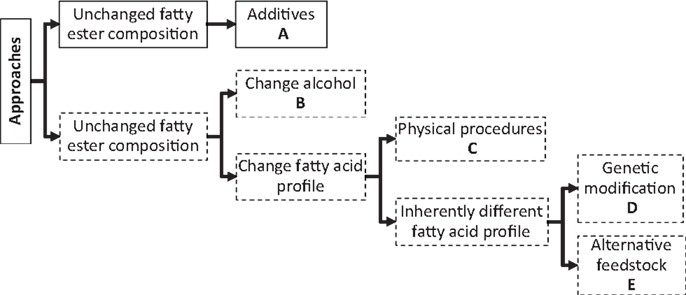
Figure 3. Approaches to improving biodiesel fuel properties.
In addition, to ensure a uniform quality of biodiesel produced from vegetable oils or animal fats, the final products must meet stringent international and regional quality requirements such as ASTM D 6751 in the U.S. and EN 14214 in Europe. These standards identify the parameters the pure biodiesel (B100) must meet before being used as a pure fuel or being blended with petroleum based diesel fuel. Table 2 provides the specifications for biodiesel and diesel (Knothe, 2009).
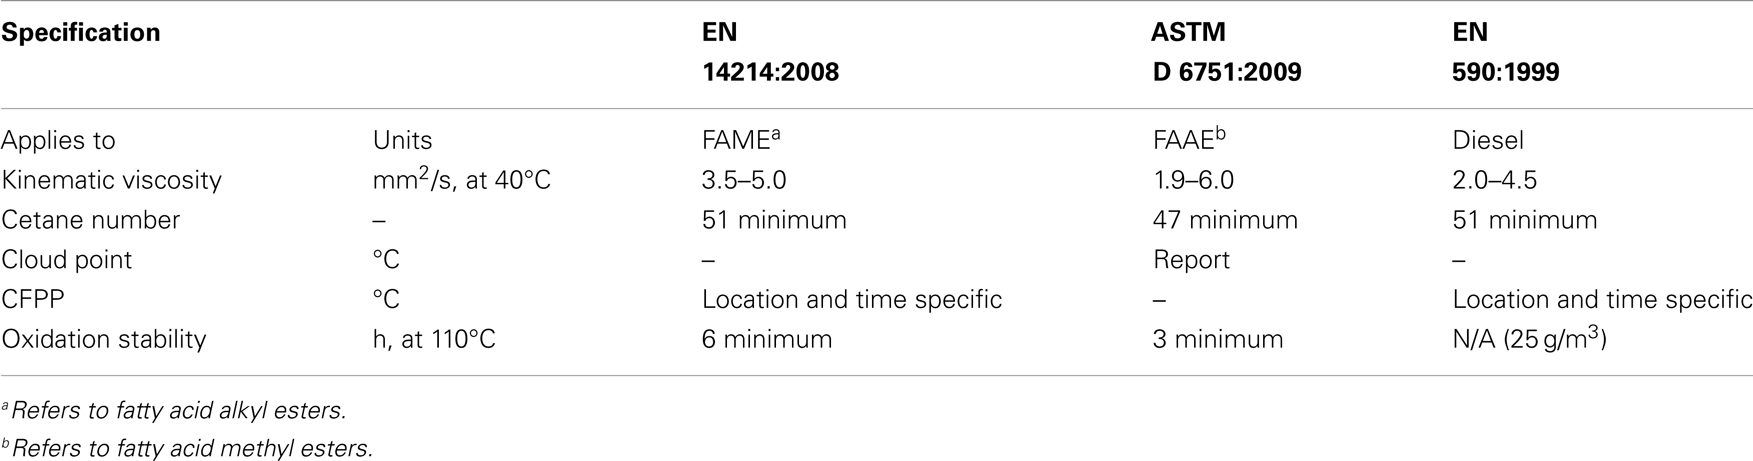
Table 2. Specifications for biodiesel and diesel.
Therefore, it is desired to molecularly design biodiesel additives to account for the unintended effect on other fuel properties in the neat and the blend fuel in order to achieve the performance properties of the petroleum based fuel. In this way, biofuels can be formulated that are adaptable to a range or blend of feedstocks and the desirable fuel characteristics like oxidative stability and wide operating temperature range.
Methodology
In this work, we aim to identify all possible compounds which, when added to off-spec biodiesel, results in a fuel that satisfies performance standards such as ASTM D6751. To meet this end, multivariate characterization data obtained from infrared (IR) spectroscopy of common additives were combined with decomposition and property clustering techniques in a RPF. In this approach, the fuel additive property targets are identified in the first reverse problem followed by molecular design to match the targets. The characterization data consists of multitude of attributes/properties of interest (such as cetane number, melting point, and kinematic viscosity) to ensure adequate performance. To facilitate an efficient design, we consolidated these various properties into a principal property domain using principle component analysis (PCA) techniques. Finally, characterization-based group contribution (cGC) parameters are then used to build novel additives that match the fuel specifications in the principal property space.
Characterization Techniques
By exploiting the fact that molecules absorb specific frequencies that are characteristic of their structure, vibrational spectroscopy can be used to elucidate chemical constituents, and the orientation and alignment of molecules (Socrates, 2004). For example, IR and near-infrared (NMR) spectroscopy based characterization contain large quantities of descriptor data involving information on molecular architecture at atomic-, nano-, and micro-scales to describe physical properties and attribute of chemical products. They provide specific information on the presence of functional groups, information on the orbital configurations of the electrons, and details of the carbon–hydrogen structure of the chemical products. The added structural information available from this characterization can also be used to distinguish some orientation specific information in various isomer geometries.
Some common characterizations used to quantify molecular architectures at other length scales include nuclear magnetic resonance (NMR) and x-ray diffraction (XRD) (Workman and Weyer, 2008). An IR based characterization technique was applied to a training set of molecules used to explore a set of property attributes. Solvason (2011) proposed a general guide for managing the complexity of the information through a systematic method for determining, which specific information on molecular architecture will be necessary to build appropriate models for a specific application as shown in Figure 4.
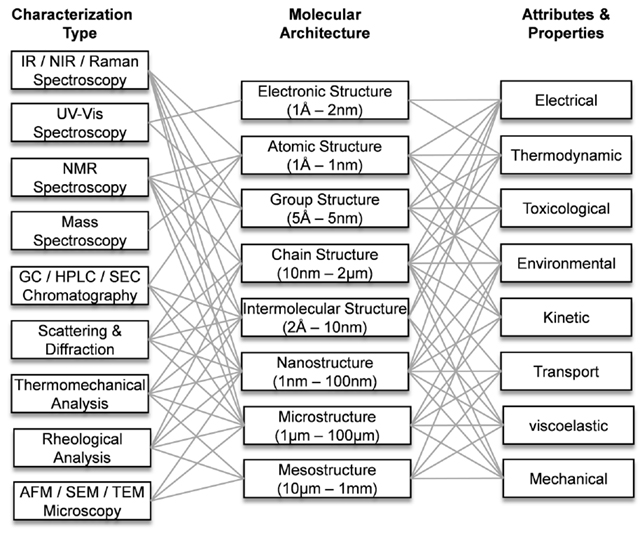
Figure 4. An overview of the interconnectivity of characterization techniques, molecular architecture, and physical properties and attributes of chemical and material products.
Figure 5 is an IR spectrum of a butylated hydroxytoluene (BHT) molecule and its molecular structure showing first and second order group contribution (GC) groups. IR spectra of such molecules contain large quantities of descriptor data involving information on molecular architecture. In addition, there is a high probability that many of the descriptor variables will be correlated, i.e., that some variables will be linear functions of other variables. Managing such complexity of information to design chemical products and to build appropriate models for a specific application will require a systematic method for capturing important features of the molecular architecture. In order, to decompose large quantities of information, and identify systematic patterns and important features of the molecular architecture in such multivariate data, multivariate statistical techniques such as PCA is used (Gabrielsson, 2002; Eriksson et al., 2006). Appropriate latent variable (LV) property models are developed using principal component regression (PCR) to predict the underlying fundamental structure–property relationships.
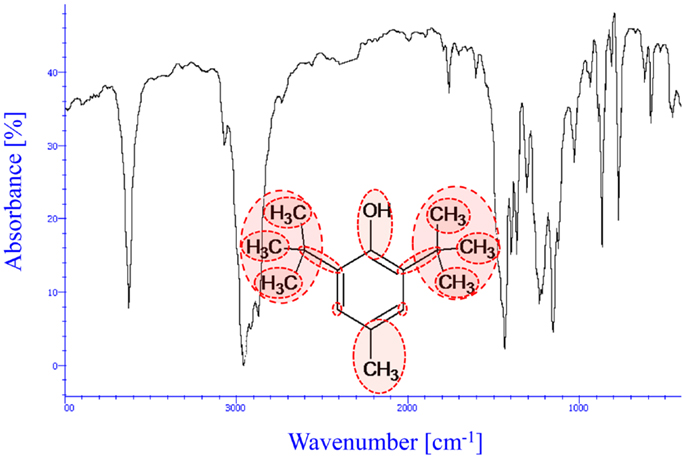
Figure 5. Infrared spectra and molecular structure of butylated hydroxytoluene molecule.
Chemometric Technique
Chemometrics is the science of extracting chemically relevant information by data-driven means and employs multivariate statistics, applied mathematics, and computer science (Wold, 1995). The use of chemometric techniques such as PCA and PCR facilitate data compression and model reduction to solve both descriptive and predictive applications, respectively. Data compression and model reduction are critical elements of multi-scale modeling. Using PCA, a large number of correlated variables are transformed into a smaller number of uncorrelated variables called principal components (PCs) (Eriksson et al., 2006). The PCA projection to a lower dimensional subspace gives:
where are the variable averages, which originated from the pre-processing step (such as mean center and unit variance scale), T is the score matrix, and PT is the transposed loading matrix. In this way, the data matrix X, containing H highly correlated descriptor variables is transformed into the score matrix, T, containing only A (where, A < K) mutually independent LVs for M samples considered. Scores, t, whose weights are given by loadings, p, are linear combinations of the original H variables, have better properties (orthogonality) and also span the multidimensional space of XM×H.
It may be important to pre-treat variables in order to transform raw-data into a form suitable for analysis. Equally important is to check and remove any outlier prior to the calibration of a model. Hotelling’s T2, a multivariate generalization of Student’s t-test, is a powerful measure of a multidimensional outlier (Jackson, 1991). The prediction of response variables (Y) from new predictor variables (T) is obtained employing the PCR as:
where is the regression coefficient matrix. Here, instead of the columns of Y are regressed onto the large and highly correlated columns of X, in PCR, the columns of Y are regressed onto the reduced and mutually independent LVs T.
In order to solve a design problem in a single domain, all of the physico-chemical attributes/properties are converted to principal properties (PP) by using the regression coefficients (B) from the calibration model in Eq. (2) as:
B−1 is the generalized inverse or pseudo-inverse of a matrix .
In order to utilize the LVs in the property clustering algorithm, it is important that the LV structures follow a linear mixing rule. This can be achieved by standardizing the data structure to obtain a new matrix, QM×A, containing standardized principal property, qi, as shown in Figure 6.
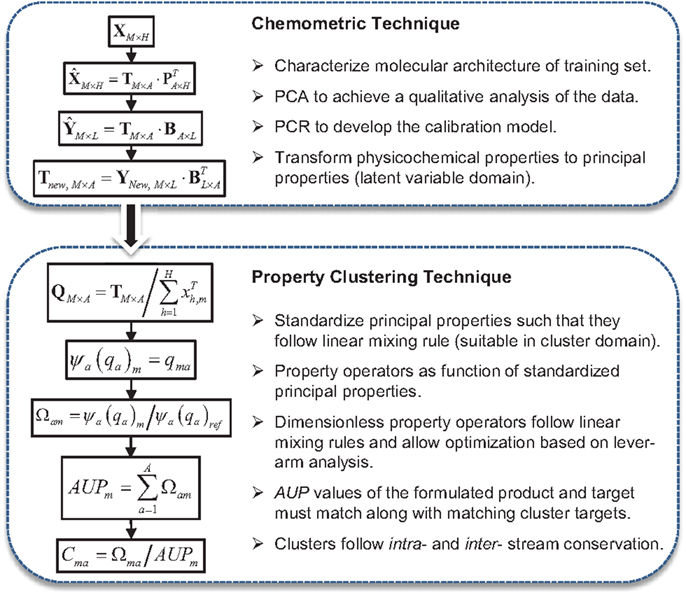
Figure 6. An overview on the methodology for combining chemometric and property clustering techniques.
Property Clustering Technique
Properties are not conserved entities and mixing of properties is not necessarily linear. Property clustering technique utilizes conserved quantities called clusters that are tailored to ensure intra- and inter-stream conservation, thus enabling the use of additive rules. The clusters are obtained by mapping property relationships into a low dimensional domain, thus allowing for visualization of the problem (Shelley and El-Halwagi, 2000). The clustering approach utilizes property operators, ψ, which must follow linear mixing rules, although the property operators itself may be non-linear. In Eq. (4), the property is described by a general linear mixing rule:
where, xi is the fractional contribution of component i, yj is the jth property.
For instance, specific volume can be used as the property operator to describe density since mixing of density does not meet the linear criteria imposed by Eq. (4). Because the non-linearities are hidden in the property operators, the problem formulation and its solution are simplified by the use of such variable transformation.
Since the properties may have various functional forms and units, the operators are normalized into a dimensionless form by dividing by an arbitrary reference operator and then summarized to yield an Augmented Property Index (AUP) as:
A cluster is then defined by dividing the non-dimensionalized property by the AUP, as:
The cluster points can then be mapped onto the ternary diagram by the coordinate transformations from ternary to Cartesian using the Pythagorian theorem. Details are explained somewhere else (Shelley and El-Halwagi, 2000; Eden et al., 2004).
Figure 6 is a schematic diagram that summarizes the steps of combining chemometric and property clustering techniques to facilitate the variable transformation, model calibration, property integration, and problem visualization in reduced space.
Characterization-Based Group Contribution Method
Almost all CAMD frameworks have used GC based property prediction methods to evaluate the generated compound with respect to a specified set of desired properties (Harper et al., 1999; Marrero and Gani, 2001; Gani, 2004; Eljack et al., 2008). Group contribution methods (GCM) are powerful product/molecular design tools, which allow predicting physical properties of molecules from the structural information alone (Joback and Reid, 1987; Constantinou and Gani, 1994; Marrero and Gani, 2001). An additive three level GC property estimation model, which estimates the property of a compound as a linear combination of the appropriate descriptor contributions is as follows:
where, Ni, Mj, and Ok are the number of first-, second-, and third-order groups of types i, j, and k, respectively. However, any application of GC relies on the availability of groups to describe the structure as well as tables giving the contributions of each group, and there are many attributes, which cannot be estimated by GCM. For instance, cetane number is an important performance indicator for biodiesel, but GCM parameters are not available to describe this fuel attribute. Furthermore, not all possible atomic arrangements and structures can be represented in GCM.
The cGC method (cGCM) utilizes the principal property parameters to capture molecular architecture information provided by characterization data, thereby alleviating the need for available conventional regression-based property parameters used in GCM (Hada et al., 2011; Solvason, 2011). Since the multivariate projection-based regression retains better memory of the structure of the training set data to predict molecules with similar properties and structures, cGCM often exhibit rich attribute-property relationships than traditional GCM. Moreover, cGCM captures the effects of molecular architecture on the product’s properties and attributes. The CAMD achieved using cGCM is termed cCAMD.
The principal property (Tnew) of any new compound based on cGCM can be calculate from characterization data (Xnew) of new compound and the loading values (P) obtained from PCA on training set molecules represented by Eq. (1):
The physical property (Ynew) of the compound can then be estimated using the regression coefficient from Eq. (2).
Principal properties can be mapped from principal property space to cluster space utilizing property clustering technique as described in Section “Property Clustering Technique” and Figure 6.
Reverse Problem Formulation in CAMD
A powerful chemical product design framework is achieved by integrating LV methods within property cluster domain and by decomposing design problem into two reverse problems. The first reverse problem identifies product quality/performance requirements and second identifies substructural molecular building blocks. Figure 7 shows the two required solutions of CAMD systematically and efficiently.
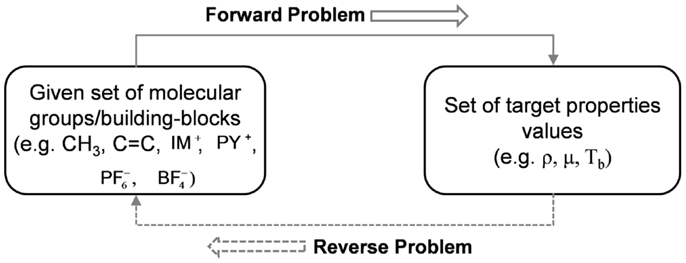
Figure 7. Forward and reverse problems in computer-aided molecular design.
Molecular Design of Biodiesel Additives
Since cetane number, cold flow, kinematic viscosity, and oxidation stability are critical properties for the operation of a fuel in a diesel engine; Knothe (2008) proposed a three-dimensional plot of the cetane number, melting point, and kinematic viscosity to describe the optimum properties to meet the ASTM D6751 fuel requirements. Although cetane number is a fuel attribute; not a fundamental property, it will, however, be referred as a property in this paper to be consistent with the other properties. Figure 8 visually represents this required biodiesel property space by volume of the shaded rectangular box (Knothe, 2008).
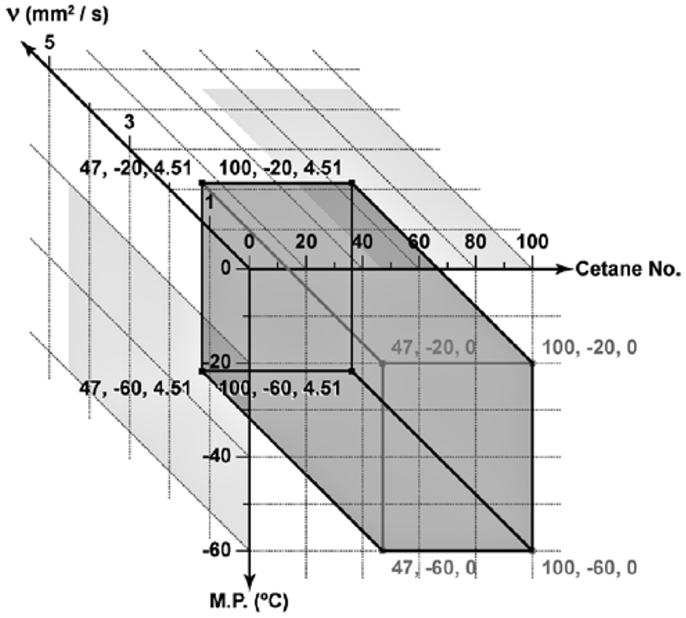
Figure 8. Plot of the minimum and maximum values for cetane number, melting point, and kinematic viscosity to meet the specifications for bio-fuel and its blend (Knothe, 2008).
For the purpose of this case study, Table 3 represents the range of target fuel property specifications for biodiesel. Values in Table 3 are much more stringent property constraint criteria and would lead to a smaller box than the one defined in Figure 8. Here, kinematic viscosity of 6.0 mm2/s at 40°C is the maximum limit in ASTM D6751 (Table 2).
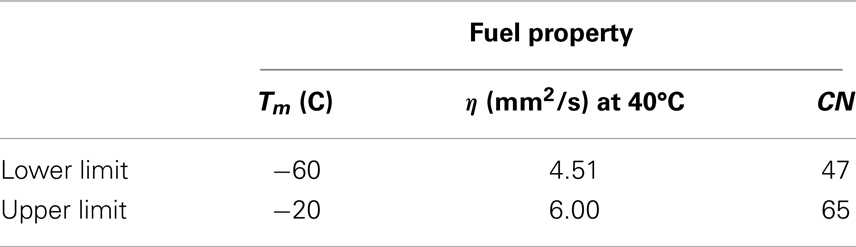
Table 3. Biodiesel target properties.
Types of Additives
Different additives that are commercially available to improve diesel fuel performance are selected as the training set molecules (Suppes et al., 2001; Ribeiro et al., 2007). Antioxidant additives can help to slow the degradation process and improve fuel stability. Cold-flow enhancers can improve the cold-flow properties to solve the low-temperature operability problem. Cetane improvers can help improve ignition properties thereby reducing NOx emission. Table 4 shows some of the available additives in the literature used as training set in this formulation study.

Table 4. Commercially available diesel additives and their estimated properties.
Additive Property Estimation
Since many additives are proprietary products, their physical–chemical properties are not readily available and therefore, experimental data such as melting point temperature, viscosity, and cetane number are difficult to find. Therefore, for the commercially available additive compounds, these properties are estimated using structural information alone. The estimated values are later used as the measured values for property model calibration. However, the property values used in the calibration would normally be measured in an industrial setup.
Melting temperature
The normal melting point temperature (Tm, K) values were estimated using a GC expression (Constantinou and Gani, 1994; Marrero and Gani, 2001):
where, Ni, Mj, and Ok are the number of first-, second-, and third-order groups of types i, j and k, respectively.
Viscosity
The dynamic viscosity (η, mPa.s) values at 300 K were estimated using the GC plus (GC+) method. GC+ combines the GC method and the atom-connectivity indices (CI) method (Conte et al., 2008).
where, F(η*) is a function of viscosity for all missing GC groups/fragments.
where, F(η)k is a function of the viscosity contribution for a missing GC group/fragment, k; K is the number of missing groups/fragments; n is the number of times a missing group/fragment appears in the molecule; and d is a constant (Conte et al., 2008).
where, Ai represents the occurrences of the ith atom in the molecular structure; ai is the contribution of atom i; and b and c are adjustable parameters. The zero-order (atomic) connectivity index (υχ0) and the first-order (bond) connectivity index (υχ1) are defined by Hall and Kier (2001).
where, L is the number of atoms in the hydrogen suppressed graph, M is the number of bonds in the graph, and βk are the bond indices defined by atomic indices δυ [the values can be found in Conte et al. (2008)]. The kinematic viscosity can be converted into dynamic viscosity through the density.
Cetane number
The correlation used for estimation of the cetane number of additives is from Lapuerta et al. (2009).
where, Ndb is the number of double bonds and Nc is the number of carbon atoms in the molecule. Table 4 tabulates the estimated properties for different type of additives considered.
Characterization of the Additive Molecules
Infrared spectroscopy based characterization was used to determine the chemical constituents or molecular structures of the additive training set that describe the orientation, constituents, and alignment of these molecules. Using the NIST Webbook (Stein, 2010), the complete IR spectral region (4,000–400) cm−1 for 12 additives including antioxidants, cetane enhancers, and cold-flow improvers were obtained. Ideally, both IR and NIR data would be available for the training set to provide better predictions, but unfortunately the availability of NIR data for the components of interest is severely limited.
Figure 9 is IR spectra of the diesel additive molecules tabulated in Table 4 that serve as the descriptors of their molecular architecture. The IR spectra were translated to discrete variables by a process of digitization. In this process, each spectrum is fragmented into small equal fragments (2 cm−1 resolution) along the wavelength axis resulting with 1801 frequencies (descriptor variables).
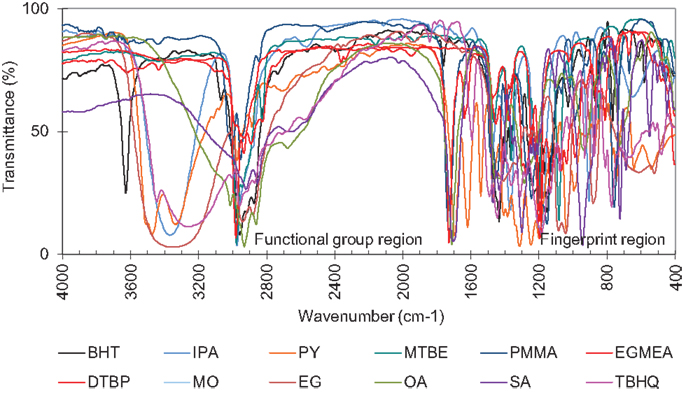
Figure 9. Infrared spectra of diesel additive molecules.
Additive IR Data Analysis
The PC scores were used to describe the variation in the multivariate characterization data with a minimum of variables to elucidate the underlying structure of the data. PCs captured the most variation possible in the smallest number of dimensions and consolidate multiple property effects into single, underlying LVs, which are devoid of collinearity. The first three PCs that captured about 70% of the total variance of the standardized IR data (Figure 10) were selected. This way, the data matrix X, containing 1801 highly correlated descriptor variables is transformed into three mutually independent LVs.
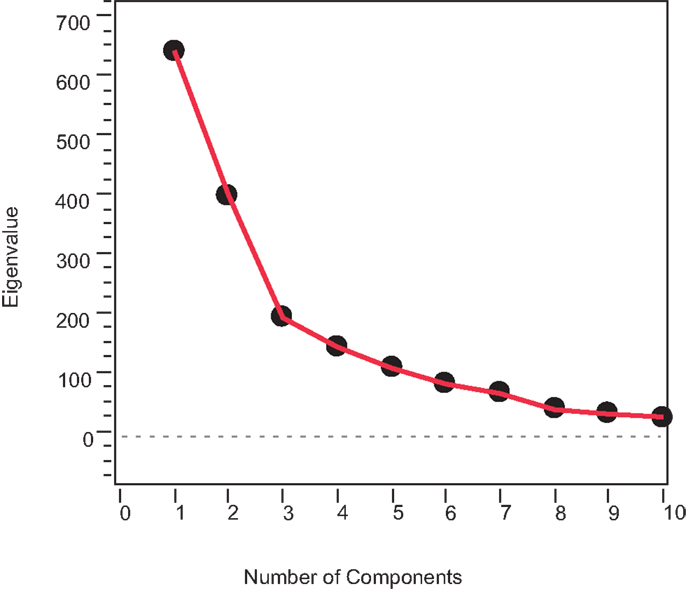
Figure 10. Scree plot for PCA on additive IR data.
Ideally, the optimum numbers of PCs are selected using the cross-validation techniques such as leave-one-out. However, to demonstrate the advantages of visualization of the problem and its solution in a reduced cluster space (ternary diagram), only three PCs that result in three PPs are selected. If an algebraic method is used, optimum number of PCs must be selected.
Latent Variable Model Development
Non-linear regression models that describe response variables Y (the fuel properties) subjected to the descriptor variables X (IR data) values are obtained using the three PCs using PCR. Here, the use of PCA for variable reduction followed by multiple regression for calibration model development could be considered as a non-linear PCR (NPCR). NPCR resulted in second order regression models for melting point (Eq. 16) and kinematic viscosity (Eq. 17), whereas, a third-order regression model was developed for cetane number (Eq. 18). The generalized forms of these LV property models are as follows:
The left hand sides (LHS) of the above models are forced to have a particular form such that the respective properties follow linear additive rules as described by the general GC model equation (Eq. 7). The property operators, ψ, are described by the LHS terms in Eqs (16) through (18). Table 5 tabulates the regression coefficients for the LV models represented by Eqs (16) through (18). The reference values for property operators in Eqs (16) through (18) are 0.06, −0.02, and −0.05, respectively.
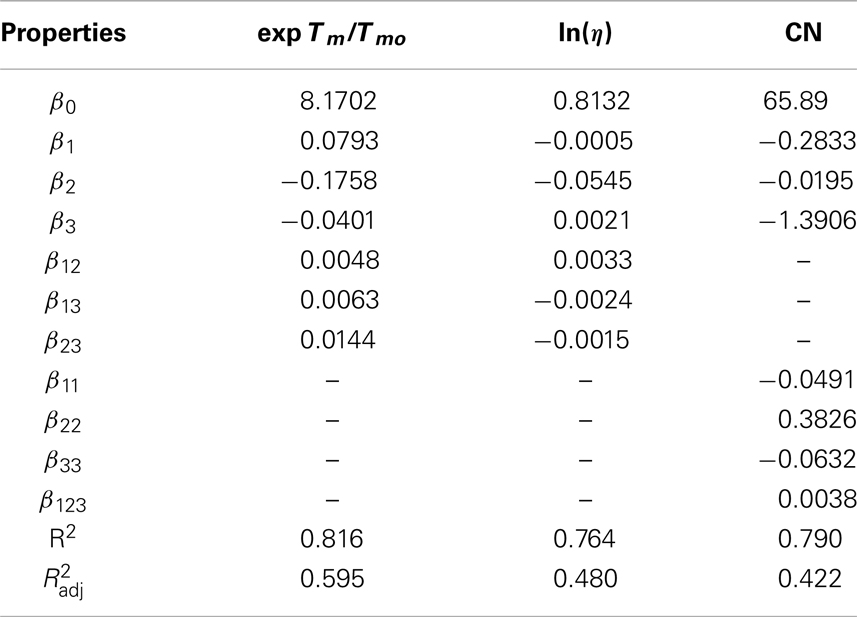
Table 5. Model coefficients using PCR.
Following the steps illustrated in Figure 6, all the physical properties (pi) were converted to PPs (ti) in order to solve the design problem in a single reduced space. The PPs (ti) values are then converted to standardized PPs (qi) as described in Section “Chemometric Technique” and Figure 6. The minimum and maximum standardized PPs that correspond to physical properties in Table 3 are in Table 6.
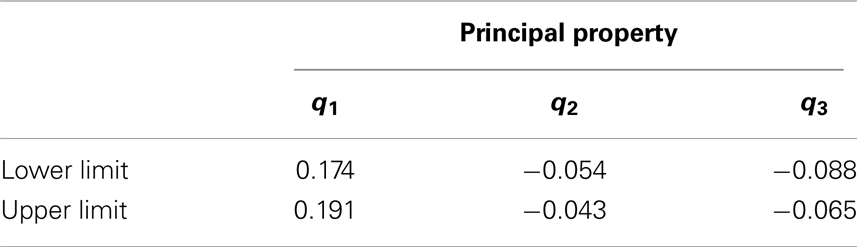
Table 6. Biodiesel target standardized principal properties.
In order to ensure that the target property space is properly explored, a feasibility region on the ternary diagram was evaluated. The feasibility region was mapped from the three-dimensional volume (Figure 8) to a two-dimensional area in ternary space utilizing the property clustering technique (illustrated in Figure 6). The feasibility region was evaluated by the six unique points described by Eq. (19).
where Ω is the normalized principal property operator. Figure 11 shows the biodiesel target feasibility region described by Table 6 and Eq. (19). In Figure 11, the crude biodiesel along with the petro-diesel property values are also mapped onto the cluster space as shown. Here, the properties of a crude biodiesel feedstock were picked arbitrarily such that it does not meet the fuel specification target properties defined in Table 6. The standardized principal property values are tabulated in Table 7.
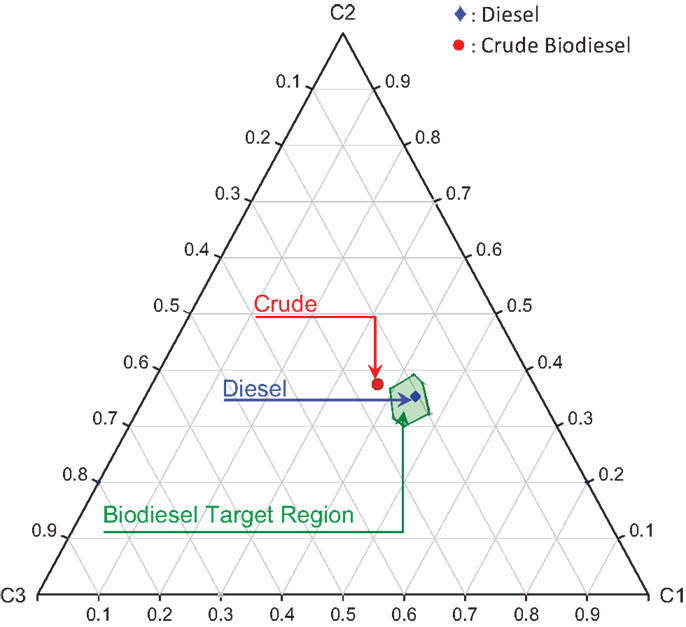
Figure 11. Target feasibility region and crude biodiesel in cluster space.
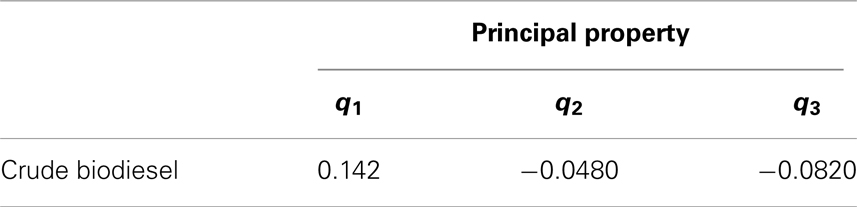
Table 7. Crude biodiesel properties.
Evaluation of Desired Additive Feasibility Region
An infinite number of possible additives may exist that could be mixed with crude biodiesel. However, it is difficult to narrow down the feasible additive candidates that result the final mixture products meet the target biodiesel properties. Since the property cluster formulation enables linear mixing and lever arm analysis of the PPs, it is straightforward to identify the feasibility region for the additives. The region bounded by the black dash lines (shaded area) in Figure 12 represents the entire principal property search space for the additive molecules. The corresponding principal property ranges are presented in Table 8. The additive feasibility region will serve as the property target region in the additive molecular design algorithm.
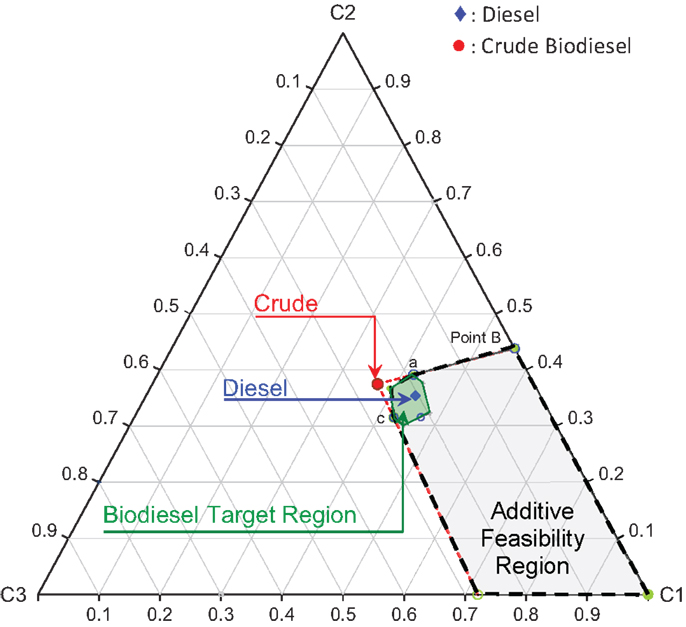
Figure 12. Desired additive design feasibility region in cluster space.
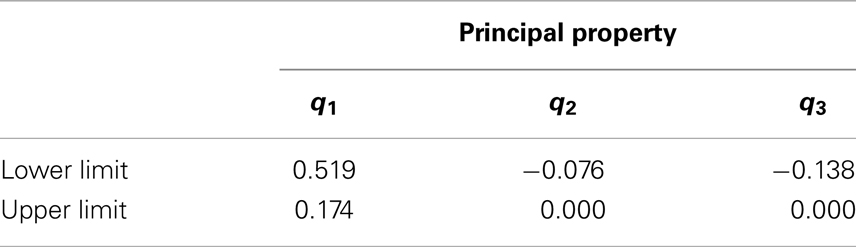
Table 8. Biodiesel additive standardized principal property feasibility region.
Enumeration of Desired Additive Molecules
The characterization-based molecular groups/fragments are linearly combined to formulate a molecule. The property of the formulated molecule is determined by the individual contributions of each molecular group that make-up the molecule. Twenty-three molecular groups (N = 23) were selected from the additive training set. Some of the groups are the fundamental building blocks present in every additive molecule and represents first-order contributions while the rest are larger groups and represents higher level of contributions. These selected molecular groups are considered to be a set of basic groups, which represent the chemical make-up of the training set and are listed in Table 9. The IR descriptor data (X matrix) for the molecular fragments tabulated in Table 9 were compiled from Socrates (2004). The principal property contributions of each group are evaluated using the loading matrix (PT) obtained from the PCA of the training set data as described by Eq. (8). The standardized score values (qi) are calculated as described previously. The results are tabulated in Table 9.
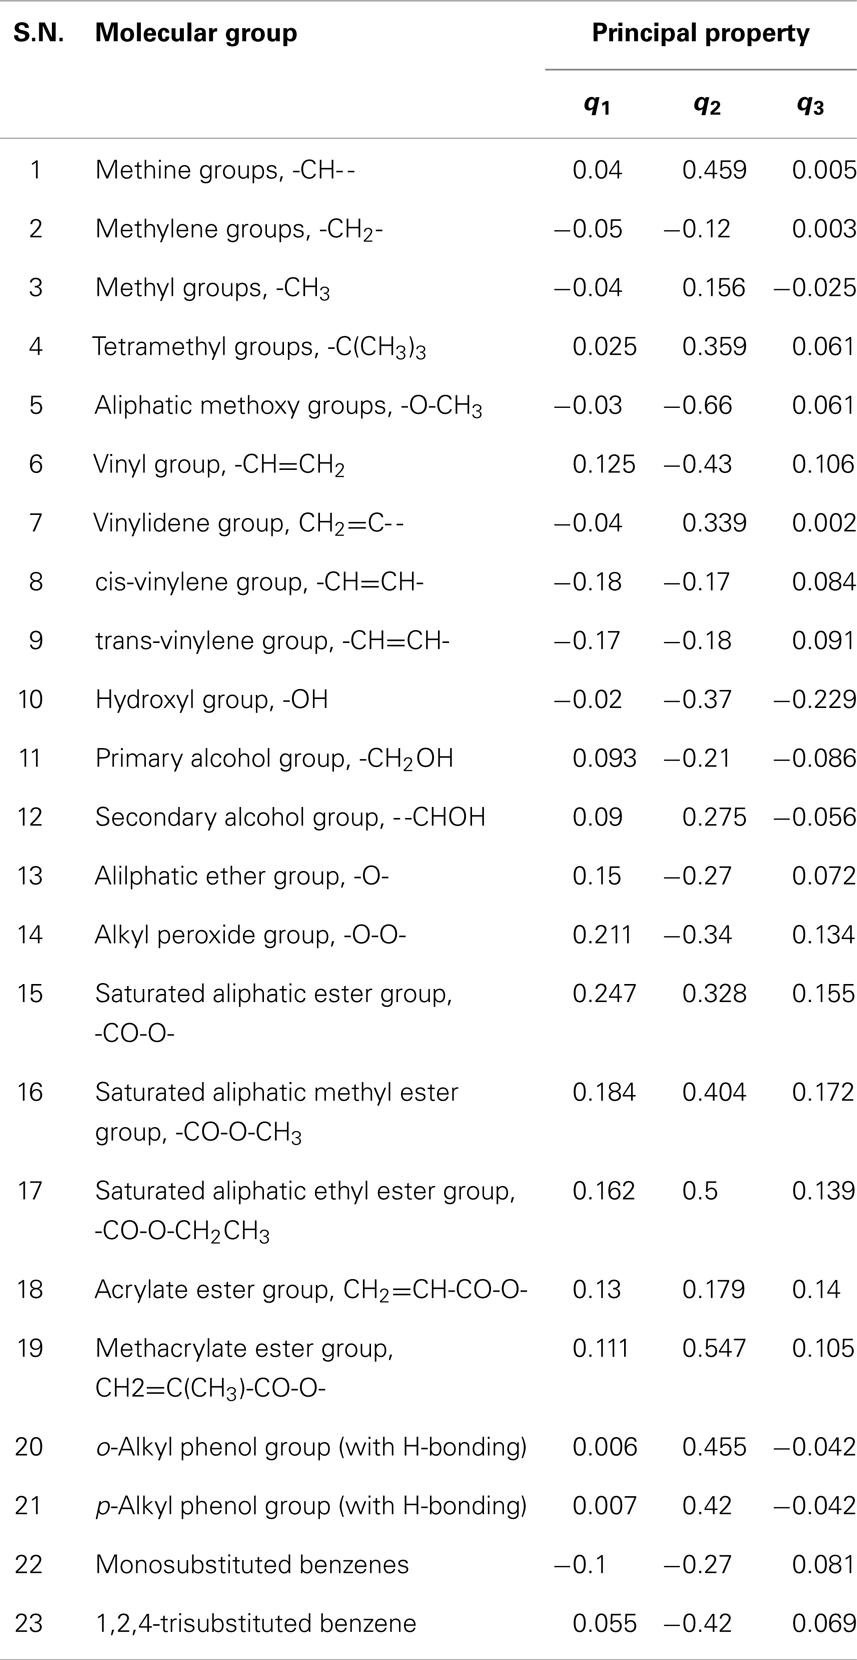
Table 9. Molecular groups and their standardized principal property contributions.
A combinatorial property model like a GCM based algorithm using Visual Basics for Application (VBA) code was used to enumerate all potential molecules from the characterization-based groups in Table 9 that satisfied the target property constraints described in Table 8. Using the group based property model, molecular groups, or fragments are added together analogous to inter-stream conservation. A maximum number of similar groups, Ng = 2, was selected such that progressive combinations of similar groups are added until the maximum is reached. Then, the enumerated candidate molecules were screened for structural constraints to ensure that a stable, connected molecule was formed. One such structural constraint is to check the number of unused bonds in a generated molecule, i.e., the free bond number (FBN) (Eljack et al., 2008).
where, ng is the number of occurrences of group g, Ng is the total number of first-order groups, FBNg is the unique FBN associated with group g, and NRing is the number of rings in the formulation. For an electronically complete molecular formulation, the FBN must be equal to zero. A FBN of zero indicates that the electron valency shells of all atoms in the molecule have been satisfied, which, in most cases, indicates one of the minimum energy configurations of the atoms in the molecule. The candidate molecular structures identified from the IR spectroscopic characterization data, that fall within the feasibility region for the additive properties in Figure 12 and satisfy all the constraints, are presented in Table 10. The feasible candidate molecules are mapped onto the cluster space and are shown in Figure 13.
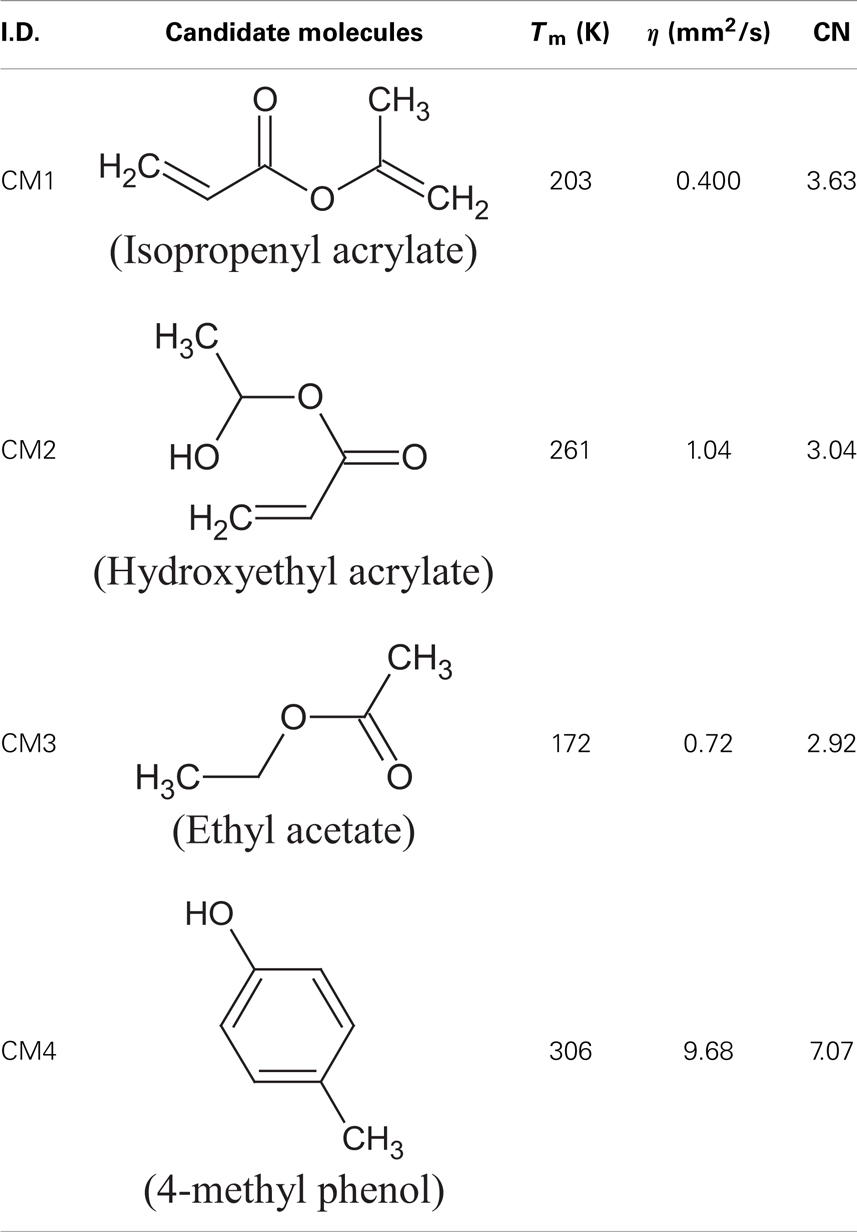
Table 10. Results from characterization-based molecular design.
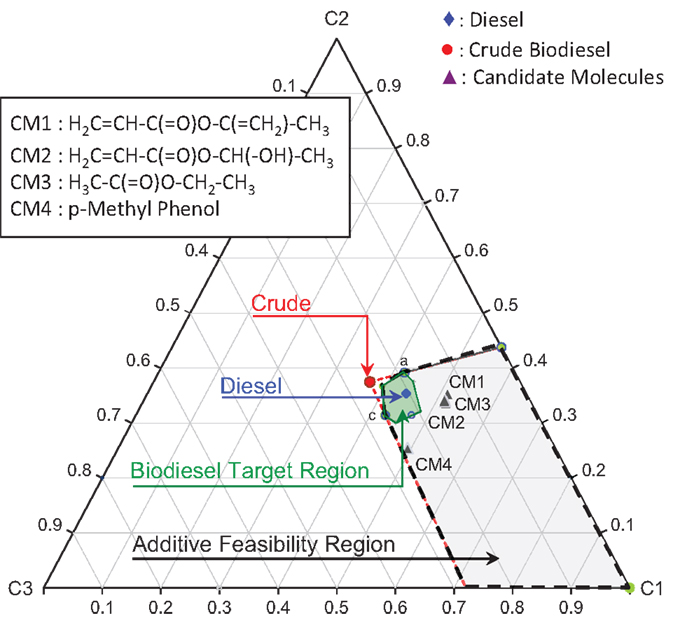
Figure 13. Cluster diagram for biodiesel blending problem.
In addition, solubility parameters can be used as a simple method to predict and calculate the dissolving power of the above candidate additive molecules in biodiesel as a further screening criterion. As a general rule, two substances with close solubility parameters (δ) should be mutually soluble (Krevelen and Nijenhuis, 2009). In the thermodynamics of solution, the Hansen solubility parameters related to dispersion force (δd), polar interaction (δp), and hydrogen bond interaction (δh) have been conveniently used to estimate the solubility or miscibility between two compounds. These parameters can be estimated from additive GCs (Krevelen and Nijenhuis, 2009). The total Hansen solubility parameter (equivalent to Hildebrand solubility parameter) can be expressed as:
Table 11 tabulates the solubility parameters and molar volumes of the additives and a common fatty acid methyl ester (FAME). Since linoleic acid (C18:2) represents a major constituent in the fatty acid profile (Table 1), it is used to check the solubility of the candidate additive molecules in methyl ester (biodiesel). Additives with lower a solubility parameter than FAME were considered miscible in most proportions with FAME (δ ≤ 16 MPa1/2). Based on this criterion, the candidates CM1 and CM3 satisfied the screening criteria and were considered feasible solutions.
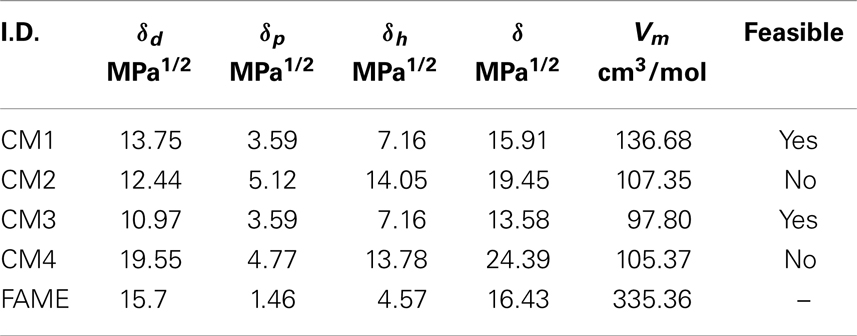
Table 11. Additive solubility in FAME at 25°C.
From Table 11, it can be inferred that among the Hansen parameters, the high dispersion parameter values (δd) have the major attractive factor for FAME and the additive molecules involved in the process of solubilization. These interactions arise from induced dipoles and their strength is related to the polarizabilities of the molecules (dipole moment of FAME, CM1, and CM3 molecules are primarily from the dipole moment of the carbonyl group). The polar parameter (δp) and the hydrogen bonding parameter (δh) of FAME, CM1, and CM3 are comparatively low.
Furthermore, density functional theory (DFT) calculations were performed for the CM1 and CM3 additive molecules to optimize their geometry. Using the B3LYP method with the 6311++G(3df,3dp) basis set the lowest energy conformer for each molecule is presented in Figure 14. The estimated dipolar moments of CM1, CM3, and FAME are 1.54, 2.11, and 4.51, respectively. This is in agreement with the polar parameters obtained with Hansen’s theory (Table 11). The difference between dipole moments (|μFAME–μAdditive|) is at a minimum for CM1, which corresponds to the better affinity between CM1 and FAME and to the highest solubility limits of this additive. Consequently, we can conclude that both the polarity and spatial configurations of feasible additive molecules are involved in the process of solubilization.
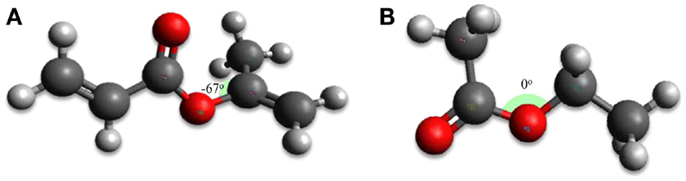
Figure 14. Spatial representation of candidate additive molecules according to B3LYP/6311++G(3df,3dp) calculations: (A) isopropenyl acrylate (CM1), and (B) ethyl acetate (CM3).
It should be noted that the limited amount of data and supporting characterization information available in the training set (and thus the molecular fragments available for molecular design) impacts the chemical stability/feasibility of the molecules that are generated in this step. Additional training set data can improve the quality of the predictions and thus increase the application range but would not require a different optimization methodology.
Conclusion
Multivariate characterization techniques such as IR combined with decomposition techniques like PCA and PCR can be used to describe a set of representative molecules and to find the underlying LV models that describe the molecule’s properties. Data-driven modeling and optimization strategies combined with property clustering techniques and cGC methods in a RPF can be effectively used to identify novel additives molecules with tailored properties. In addition, the use of visualization tools such as the property clustering technique facilitated the formulation of the problem and as part of its solution algorithms in a lower dimensional space when three properties could define the problem. The approach differs from conventional techniques because it is non-iterative, avoids the combinatorial explosion when multiple components are involved, and avoids the difficulty of formulating and solving the mixed integer non-linear programs.
Conflict of Interest Statement
The authors declare that the research was conducted in the absence of any commercial or financial relationships that could be construed as a potential conflict of interest.
References
Boshui, C., Yuqiu, S., Jianhua, F., Jiu, W., and Jiang, W. (2010). Effect of cold flow improvers on flow properties of soybean biodiesel. Biomass Bioenergy 34, 1309–1313. doi: 10.1016/j.biombioe.2010.04.001
Canakci, M., and Sanli, H. (2008). Biodiesel production from various feedstocks and their effects on the fuel properties. J. Ind. Microbiol. Biotechnol. 35, 431–441. doi:10.1007/s10295-008-0337-6
Constantinou, L., and Gani, R. (1994). New group contribution method for estimating properties of pure compounds. AIChE J. 40, 1697–1710. doi:10.1002/aic.690401011
Conte, E., Martinho, A., Matos, H. A., and Gani, R. (2008). Combined group-contribution and atom connectivity index-based methods for estimation of surface tension and viscosity. Ind. Eng. Chem. Res. 47, 7940–7954. doi:10.1021/ie071572w
Eden, M. R., Jørgensen, S. B., Gani, R., and El-Halwagi, M. M. (2004). A novel framework for simultaneous separation process and product design. Chem. Eng. Process. 43, 595–608. doi:10.1016/j.cep.2003.03.002
Eljack, F. T., Solvason, C. C., Chemmangattuvalappil, N., and Eden, M. R. (2008). A property based approach for simultaneous process and molecular design. Chin. J. Chem. Eng. 16, 424–434. doi:10.1016/S1004-9541(08)60100-7
Eriksson, L., Johansson, E., Kettaneh-Wold, N., and Wold, S. (2006). Multivariate and Megavariate Data Analysis Basic Principles and Applications (Part I). UMea: Umetrics Academy, 425.
Gabrielsson, J., Lindberg, N.-O., and Lundstedt, T. (2002). Multivariate methods in pharmaceutical applications. J. Chemometrics 16, 141–160. doi:10.1002/cem.697
Gani, R. (2004). Chemical product design: challenges and opportunities. Comput. Chem. Eng. 28, 2441–2457. doi:10.1016/j.compchemeng.2004.08.010
Hada, S., Solvason, C. C., and Eden, M. R. (2011). “Molecular design of biofuel additives for optimization of fuel characteristics,” in 21st European Symposium on Computer Aided Process Engineering, eds A. C. Pistikopoulos, E. N. Georgiadis, and M. C. Kokossis (Amsterdam: Elsevier), 1633–1637.
Hall, L. H., and Kier, L. B. (2001). Issues in representation of molecular structure the development of molecular connectivity. J. Mol. Graph. Model. 20, 4–18. doi:10.1016/S1093-3263(01)00097-3
Harper, P. M., Gani, R., Kolar, P., and Ishikawa, T. (1999). Computer-aided molecular design with combined molecular modeling and group contribution. Fluid Phase Equilib. 15, 337–347. doi:10.1016/S0378-3812(99)00089-8
Janaun, J., and Ellis, N. (2010). Perspectives on biodiesel as a sustainable fuel. Renew. Sustain. Energ. Rev. 14, 1312–1320. doi:10.1016/j.rser.2009.12.011
Joback, K. G., and Reid, R. C. (1987). Estimation of pure-component properties from group-contributions. Chem. Eng. Commun. 57, 233–243. doi:10.1080/00986448708960487
Knothe, G. (2008). “Designer” biodiesel: optimizing fatty ester composition to improve fuel properties. Energy & Fuels 22, 1358–1364. doi:10.1021/ef700639e
Knothe, G. (2009). Improving biodiesel fuel properties by modifying fatty ester composition. Energy Environ. Sci. 2, 759. doi:10.1039/b903941d
Knothe, G., Gerpen, J., and Van Krahl, J. (2005). The Biodiesel Handbook. Champaign, IL: AOCS Press.
Krevelen, D. W. V., and Nijenhuis, K. T. (2009). Properties of Polymers. Their Correlation with Chemical Structure; their Numerical Estimation and Prediction from Additive Group Contributions, 4th Edn. Amsterdam: Elsevier Science.
Lapuerta, M., Rodríguez-Fernández, J., and De Mora, E. F. (2009). Correlation for the estimation of the cetane number of biodiesel fuels and implications on the iodine number. Energy Policy 37, 4337–4344. doi:10.1016/j.enpol.2009.05.049
Marrero, J., and Gani, R. (2001). Group-contribution based estimation of pure component properties. Fluid Phase Equilib. 183–184, 183–208. doi:10.1016/S0378-3812(01)00431-9
Moser, B. R. (2009). Biodiesel production, properties, and feedstocks. In vitro Cell. Dev. Biol. Plant 45, 229–266. doi:10.1007/s11627-009-9204-z
Ribeiro, M., Pinto, A. C., Quintella, C. M., Rocha, G. O., Teixeira, L. S. G., Guarieiro, L. N., et al. (2007). The role of additives for diesel and diesel blended (ethanol or biodiesel) fuels: a review. Energy & fuels 21, 2433–2445. doi:10.1021/ef070060r
Shelley, M. D., and El-Halwagi, M. M. (2000). Component-less design of recovery and allocation systems: a functionality-based clustering approach. Comput. Chem. Eng. 24, 2081–2091. doi:10.1016/S0098-1354(00)00578-0
Socrates, G. (2004). Infrared and Raman Characteristic Group Frequencies: Tables and Charts, 3rd Edn. Chichester: John Wiley & Sons Ltd., 366.
Solvason, C. C. (2011). Integrated Multiscale Product Design using Property Clustering and Decomposition Techniques in a Reverse Problem Formulation. Auburn University. Available from: http://etd.auburn.edu/handle/10415/2889
Stein, S. E. (2010). “NIST Mass Spec Data Center, NIST Standard Reference Database Number 69 (IR and Mass Spectra),” in NIST Chemistry WebBook, eds P. J. Linstrom and W. G. Mallard (National Institute of Standards and Technology). Available from: http://webbook.nist.gov
Suppes, G. J., Goff, M., Burkhart, M. L., and Bockwinkel, K. (2001). Multifunctional diesel fuel additives from triglycerides. Energy & Fuels 15, 151–157. doi:10.1021/ef000122c
Wang, P. S., Tat, M. E., and Van Gerpen, J. (2005). The production of fatty acid isopropyl ester and their use as a diesel engine fuel. J. Am. Oil Chem. Soc. 82, 845–849. doi:10.1007/s11746-005-1153-7
Keywords: systems engineering, chemical product design, additive design, optimization, chemometric technique, reverse problem formulation, property clustering
Citation: Hada S, Solvason CC and Eden MR (2014) Characterization-based molecular design of bio-fuel additives using chemometric and property clustering techniques. Front. Energy Res. 2:20. doi: 10.3389/fenrg.2014.00020
Received: 24 January 2014; Accepted: 22 May 2014;
Published online: 10 June 2014.
Edited by:
Andre Bardow, RWTH Aachen University, GermanyReviewed by:
Arunprakash T. Karunanithi, University of Colorado Denver, USAAthanasios I. Papadopoulos, Centre for Research and Technology Hellas, Greece
Copyright: © 2014 Hada, Solvason and Eden. This is an open-access article distributed under the terms of the Creative Commons Attribution License (CC BY). The use, distribution or reproduction in other forums is permitted, provided the original author(s) or licensor are credited and that the original publication in this journal is cited, in accordance with accepted academic practice. No use, distribution or reproduction is permitted which does not comply with these terms.
*Correspondence: Mario R. Eden, Department of Chemical Engineering, Auburn University, 210 Ross Hall, Auburn, AL 36849-5127, USA e-mail:ZWRlbm1hckBhdWJ1cm4uZWR1