 Qing Wang
 Christian Edward Shaffer
 Puneet K. Sinha
- EC Power, State College, PA, USA
In this paper, we investigate the controlling design parameters of large-format Li-ion batteries on safety while undergoing nail penetration. We have identified three critical design parameters that control the safety during the nail penetration process: nail diameter (Dnail), single sheet foil area (Afoil), and cell capacity (Qcell).Using commercial AutoLion™ software, we have investigated two typical design problems related to the selection of cell thickness and aspect ratio, namely, (1) the safety ramifications of increasing cell capacity via greater cell thickness for a fixed footprint and (2) the effect of aspect ratio, or single sheet foil size, on safety at a given capacity. For a fixed footprint, our results indicate that the safety of the cell can be predicted by . For a given cell capacity, our results indicate that typically a larger single sheet foil area leads to a greater likelihood for thermal runaway due to its effect of making the heating more local in nature; however, for small cells (~5 Ah) and large nails (~20 mm), the greater aspect ratio can lead to a safer cell, as the greater surface area strongly cools the global heating of the cell.
Introduction
The use of large-format Li-ion batteries is typically favored in kilowatt hour and megawatt hour scale applications, such as automotive, defense, and stationary energy storage backup for various reasons, including simplification of the pack and BMS design and a minimization of the inactive material and components in the pack. However, given that larger cells inherently contain greater energy, the use of such large cells come with greater safety concerns, particularly given the history of such concerns with Li-ion batteries in portable electronics (Kageyama, 2006; Doughty and Roth, 2012; Gough, 2014). There are various forms of shorts that can occur in Li-ion batteries, including internal shorts due to manufacturing defect and external shorts when a low-resistance conductor contacts the positive and negative terminals. Regardless of the specific type of short, if the internal battery temperature reaches a dangerously high level (typically ~150–250°C), thermal runaway ensues, whereby a set a positive feedback chemical reaction causes the cell to catch fire or potentially ignite in a violent reaction (Doughty and Roth, 2012). One common test that is required for the certification of large-format Li-ion cells, including several UL and SAE standards, is the nail penetration test (Safety Issues for Li-Ion Batteries, 2012), whereby a nail is driven through a charged Li-ion cell in order to force a short.
Several authors have investigated the nail penetration process in the literature (Kitoh and Nemoto, 1999; Tobishima and Yamaki, 1999; Tobishima et al., 2000; Wu et al., 2004; Doh et al., 2008; Doughty, 2010; Hatchard et al., 2014). Generally speaking, the physics of nail penetration are poorly understood, as nail penetration experiments typically provide little insight into the underlying fundamental physics. Likewise, several authors have simulated the nail penetration process, aiming to gain fundamental insight into the process (Hatchard et al., 2001; Kim et al., 2007; Spotnitz et al., 2007; Takami et al., 2009; Cai et al., 2011; Orendorff et al., 2011; Zhao et al., 2015a). With notable exception of Zhao et al. (2015a), however, most of these models make some gross simplifying assumption as to the location and value of the heat source during the shorting process, or utilize a one dimensional model. As outlined by Zhao et al. (2015a,b) and experimentally demonstrated by Hatchard et al. (2014), both of these simplifications are inappropriate when investigating the nail penetration process, as the coupled electrochemical–thermal physics are truly 3D in nature, and the heat source can be global, local, or mixed in nature.
In this paper, using commercial AutoLion™software, our specific aim is to build upon the fundamental understanding of the nail penetration process and to investigate the dominant controlling design parameters of large-format cell safety upon nail penetration; the impact of secondary design factors that have lesser influence on predicting cell safety are left for future work. We unveil what is, to the best of our knowledge, heretofore unknown trends in large-format Li-ion battery cell safety, based on design parameters.
Theory
In this work, our commercial AutoLion-3D™software is utilized for all simulations. AutoLion-3D™is a CFD-based thermally coupled battery (TCB) model that resolves the three-dimensional distribution of species, reaction, temperature, materials utilization or state of charge, and current, among other parameters. The TCB model is a multi-scale, physics-based model that simultaneously calculates both electrochemical and thermal effects of Li-ion battery operation. Early models using this approach were developed by Wang and co-workers, using what is now called “computational battery dynamics” to fully capture electrochemical and thermal behavior ranging from the microscopic material level to the macroscopic pack level (Gu and Wang, 2000; Wang and Srinivasan, 2002; Srinivasan and Wang, 2003).
In this work, we simulate a stacked electrode type large-format prismatic cell, as shown in Figure 1. All cells have multiple negative, copper current collectors with porous electrodes coated on each side (graphite active material) and multiple positive aluminum current collectors with porous electrodes coated on each side (Ni0.33Co0.33Mn0.33 active material). These double coated current collectors are stacked in multiple layers with separators between anode and cathode to make the cell. Reversible electrochemical reactions occur at the surface of the active material particles within the electrode, for the negative and positive electrodes, respectively, where Li is inserted or extracted from the active material particles. EC Power’s three-dimensional volume averaged electrochemistry and transport model is utilized. The governing equations include solid-phase conservation of charge, electrolyte-phase conservation of charge, electrolyte-phase species conservation, and species conservation in the active material particles.
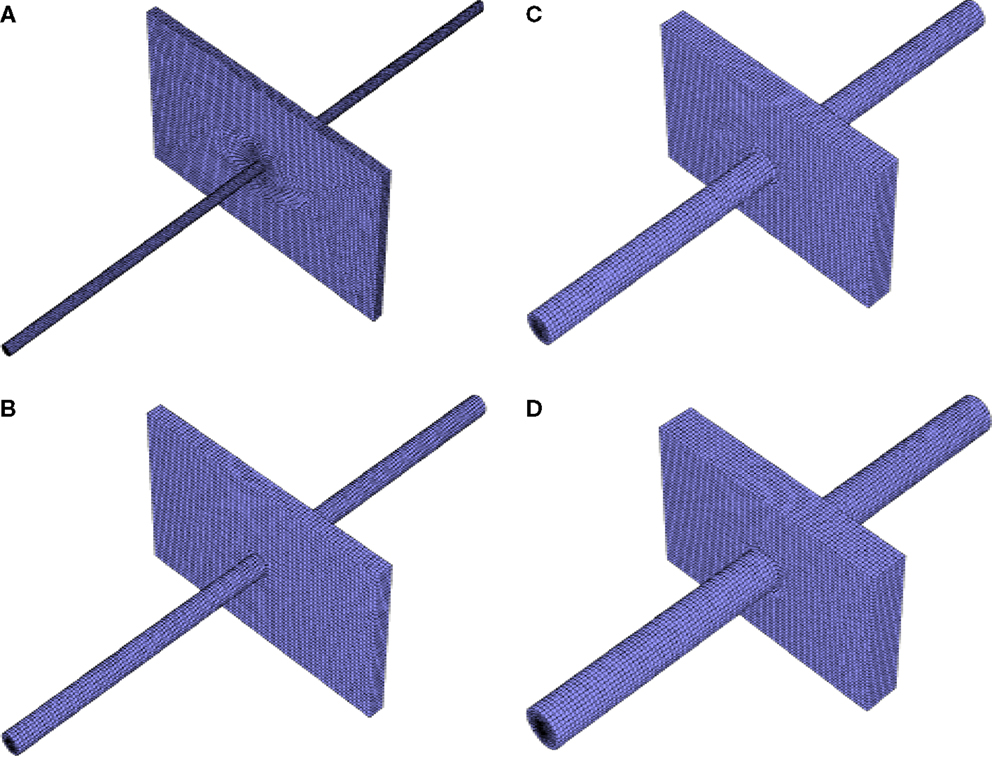
Figure 1. Example meshes used for simulation: (A) 5 Ah cell with 5 mm diameter nail, (B) 10 Ah cell with 10 mm diameter nail, (C) 20 Ah cell with 15 mm diameter nail, (D) 30 Ah cell with 20 mm diameter nail, all small single sheet foil area.
In this paper, we have coupled AutoLion™with ANSYS Fluent CFD solver, which is used to solve the conservation of energy equation in 3D in the large-format cell. Butler–Volmer kinetics is used to model the electrochemical reactions. The AutoLion™database is utilized for property values for the exchange current densities, diffusivities, conductivities, and all other physico-chemical properties.
The smallest thermal mesh size used in this study was ~200,000 cells. The maximum was roughly 450,000. Four example meshes are shown in Figure 1. The differential scheme for Energy equation was second order upwind scheme, and first order implicit in time. An energy equation tolerance of 1.0 × 10⁻¹² was used for all simulations herein. More explicit details of the electrochemical modeling equations used in this work, and an explicit description of the shorting model and implementation (including the critical convergence criteria used) have already been covered at great length in Luo and Wang (2011), Kalupson et al. (2013), and Zhao et al. (2015a), and will not be repeated here for brevity. The reader is referred to these references for additional detail.
The validated AutoLion™database correlations are not disclosed publicly. However, Figure 2 gives the SOC-dependent 10s, 10C-rate internal battery resistance of the 5 Ah baseline and energy cells used in this study (at 25°C). These internal resistances are predicted a result of the AutoLion™database properties, and in good agreement with the internal resistance measurements of cells of this active material and specific energy (Albertus et al., 2008). The database properties lead to an accurate prediction of a commercial cell.
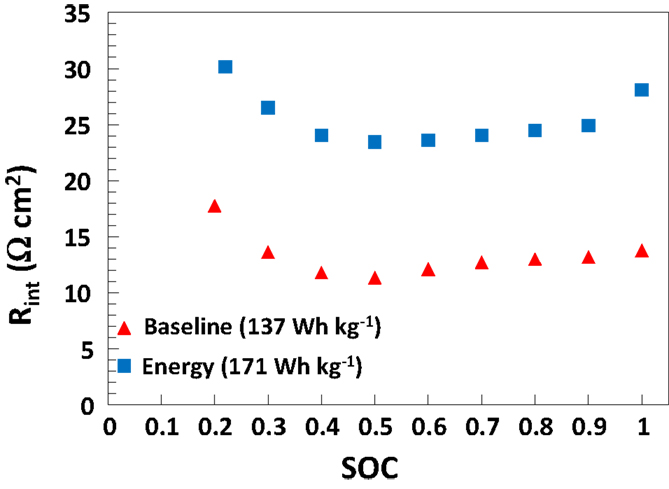
Figure 2. Cell internal area specific resistance [((OCV − V)/I) × Aactive] based on 10C-rate, 10s pulse discharge current versus cell SOC at 25°C, as predicted by AutoLion™ (using the AutoLion™ database) for both baseline and energy 5 Ah medium cells.
Figure 3 gives a general description of the factors that control the safety of large-format Li-ion batteries undergoing shorting. Fundamentally, there are strongly coupled electrochemical, geometric, and thermal effects that together determine the shorting current, heat generation (W L−1, both overall, and locality), and heat dissipation during the short. These three factors largely determine the maximum local temperature reached during shorting, which is the determining factor as to whether or not thermal runaway ensues. Regardless of the root cause, for most common commercial materials, when the maximum local temperature reaches ~150–250°C, electrolyte decomposition occurs, followed by potentially O2 release from cathode active material, leading to thermal runaway. In our model, we do not simulate the thermal runaway reactions; rather, our aim is to accurately predict the maximum local temperature up to the point of thermal runaway, and use this temperature as a metric of cell safety, assuming thermal runaway ensues after this threshold temperature is reached.
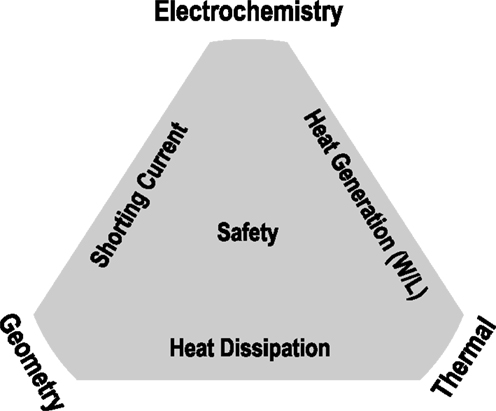
Figure 3. Generalized triad of factors that dictate large-format Li-ion battery safety.
As we will demonstrate in the results that follow, within the assumptions made and listed in the next section, the safety of a large-format Li-ion battery undergoing nail penetration is largely determined by four parameters: cell capacity (Qcell), single sheet foil area (Afoil), cell surface area (Asurf), and nail diameter (Dnail). Together, these parameters largely dictate the coupled electrochemical and thermal response of the battery to nail penetration.
Figure 4 depicts the circuit that occurs within a negative foil/anode/separator/cathode/positive foil sandwich upon nail penetration. The short resistance, Rshort, is from the penetrated nail and corresponding contact resistance. The internal resistance, Rint, is the resistance of the single sandwich, which grows over time, as electrolyte and particle stoichiometry gradients grow. A larger single sheet foil area, Afoil, directly leads to a reduction in the internal resistance of a single electrochemical sandwich, and a greater shorting current. Further, it has previously been demonstrated that a larger nail diameter, Dnail, leads to more global heating, due to its larger thermal mass to absorb I2Rshort heating and an enhanced ability to reject heat axially through the nail (Shaffer et al., 2012; Kalupson et al., 2014; Zhao et al., 2015a). Generally speaking, for a given cell internal structure (electrode thicknesses, porosities, etc.), Afoil and Dnail largely determine the locality (global, local, or mixed) of the heating, and a greater cell capacity accentuates the local or global nature of the heating, simply by having greater energy to be dissipated during the short.
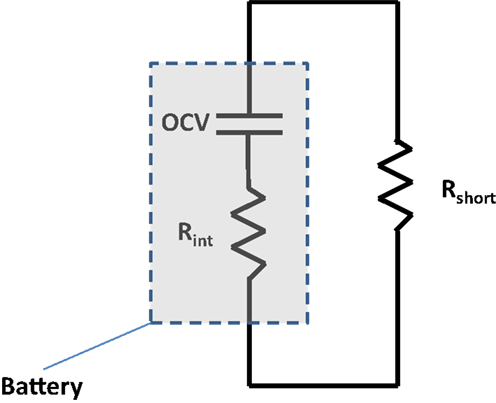
Figure 4. Generalized diagram describing physics of nail shorting process.
It is widely understood that a larger cell capacity leads to more dangerous conditions upon nail penetration or short, all other factors remaining unchanged. This very fact succinctly summarizes the tremendous safety concern for large-format cells. The physical reason for this is fundamentally simple: a larger cell capacity means more energy, and hence, greater energy to be discharged during the short. Finally, the surface area of the cell, Asurf, also plays a very important role in cell safety; a larger Asurf means greater heat can be rejected from the surface of the cell via convection. As we will demonstrate later, however, the cell surface area is only a critical parameter if global heating occurs; if local heating is dominant, surface area is of far less importance.
Because most standard stacked electrode type Li-ion batteries have large aspect ratio (in this study, we use aspect ratios between 7 and 77), to a good approximation, the surface area is proportional to the single sheet foil area. This being the case, the problem statement can be simplified, and the cell safety can be predicted by only three parameters: cell capacity (Qcell), single sheet foil area (Afoil), and nail diameter (Dnail). In the results that follow, we clearly demonstrate the controlling effects of these parameters using stacked electrode types of cells using illustrative examples that are indicative of common well-defined design problems. However, these results hold largely for cylindrical cells as well, where Afoil can be taken as the area of the outer-most wound of the rolled cell design. Note that in this study, for the sake of brevity, we have limited the scope of this paper to the maximum local temperature rise in a cell with nail penetration without regards to the time scale required to reach this maximum local temperature. However, the time scale at which dangerous conditions upon shorting occur is also a very important topic as it relates to safety. As such, we shall cover this aspect in a later paper.
Results and Discussion
In all simulations that follow, we assume the following:
• Stainless steel nail of length 275 mm, centered in each cell, with half of the nail sticking out from each edge of the cell.
• No shutdown separator, ceramic coated safety layer, PTC, or any other safety device.
• Natural convection cooling from all exterior surfaces (cell and nail); h = 20 W m−2 K−1 and ambient/initial temperature of 25°C.
• All cells are stacked electrode design (SED), i.e., non-wound, with a soft shell pouch casing.
• Before short, the cells are fully charged (SOC = 1).
The bulk of the simulations carried out in this paper use the parameters of the baseline cell internal structure given in Table 1. The 1C-rate, 25°C specific energy of the baseline 5 Ah/10,400 mm2 foil area pouch cell is 137 Wh kg−1, and is appropriate for blended power and energy applications, such as plug-in hybrid electric vehicles (PHEVs). In Section “Cell Capacity with Fixed Footprint,” we compare results of the baseline cell with that of a cell with the internal structure given in Table 2. This second cell is more typical of that used in an energy application with a 1C-rate, 25°C specific energy of 171 Wh kg−1 for the 5 Ah/10,400 mm2 foil area pouch cell. The correlations used for active material properties, electrolyte properties, etc., are taken from the AutoLion™materials database. The three different single sheet foil dimensions and areas primarily used in the simulations were as follows: small foil area: Afoil = 80 mm × 130 mm = 10,400 mm2, medium foil area: Afoil = 120 mm × 196 mm = 23,520 mm2, and large foil area: Afoil = 163 mm × 226 mm = 36,838 mm2. In Section “Cell Single Sheet Foil Area”, we also simulated a small/medium foil area: Afoil = 100 mm × 162 mm = 16,200 mm2.
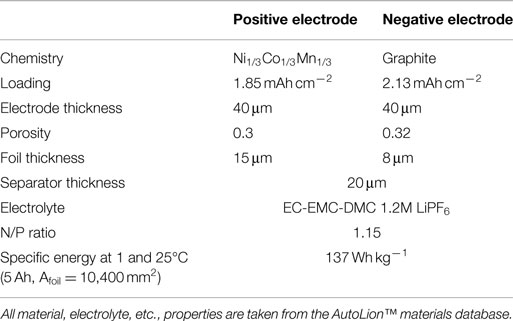
Table 1. Baseline cell internal structure design parameters.
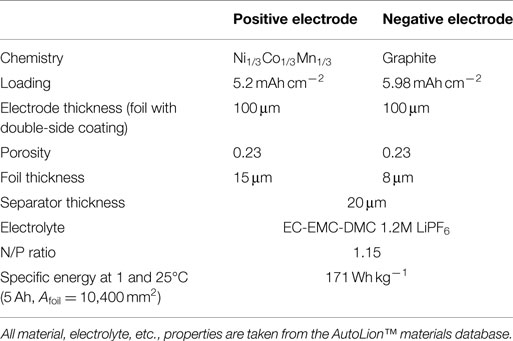
Table 2. Cell internal structure and design parameters for alternative energy cell used for some simulations in Section “Cell Capacity with Fixed Footprint.”
Finally, Table 3 gives the test matrix used for all cells with the baseline internal structure. A total of 56 simulations were carried out with the baseline structure: 4 cell capacities (5, 10, 20, 30 Ah) × 4 nail diameters (5, 10, 15, 20 mm) × 3 (small, medium, and large) single sheet foil areas, plus 8 additional simulations using the small/medium Afoil: 5 and 10 Ah cells both with 5, 10, 15, and 20 mm diameter nails. An additional 16 simulations [(4 capacities 5, 10, 20, 30 Ah) × 4 nail diameters (5, 10, 15, 20 mm)] using the medium foil area but with the energy cell internal structure given in Table 2 were carried out for use in Section “Cell Capacity with Fixed Footprint” only. Other than the results explicitly listed as “energy cell” in Figures 7 and 8, all other results reflect the baseline cell internal structure given in Table 1.
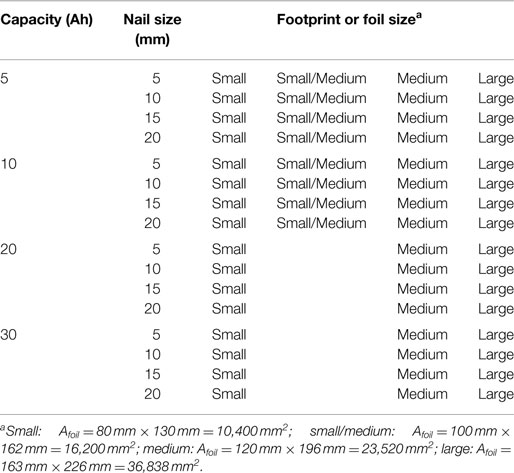
Table 3. Test matrix for baseline internal cell structure.
Effect of Nail Diameter (Dnail) and Cell Capacity on Cell Safety
Before we discuss the design implications of cell thickness and single sheet foil area on cell safety, in this section, we briefly and quantitatively highlight the parametric effect of nail diameter and cell capacity. Figure 5 shows the maximum local temperature during short for the (a) small foil area, (b) medium foil area, and (c) large foil area. Each curve is for a given cell capacity. From close analysis of our large test matrix, we have determined that for a given foil area (one subplot) and a given cell capacity (one curve), the maximum local temperature correlates well with . The coefficients of determination (R2 values) for a linear curve fit range from 0.85 for the small Afoil, 30 Ah cell, to 0.99 for the small Afoil, 10 Ah cell. Hence, in Figure 5, we plot the maximum local temperature versus .
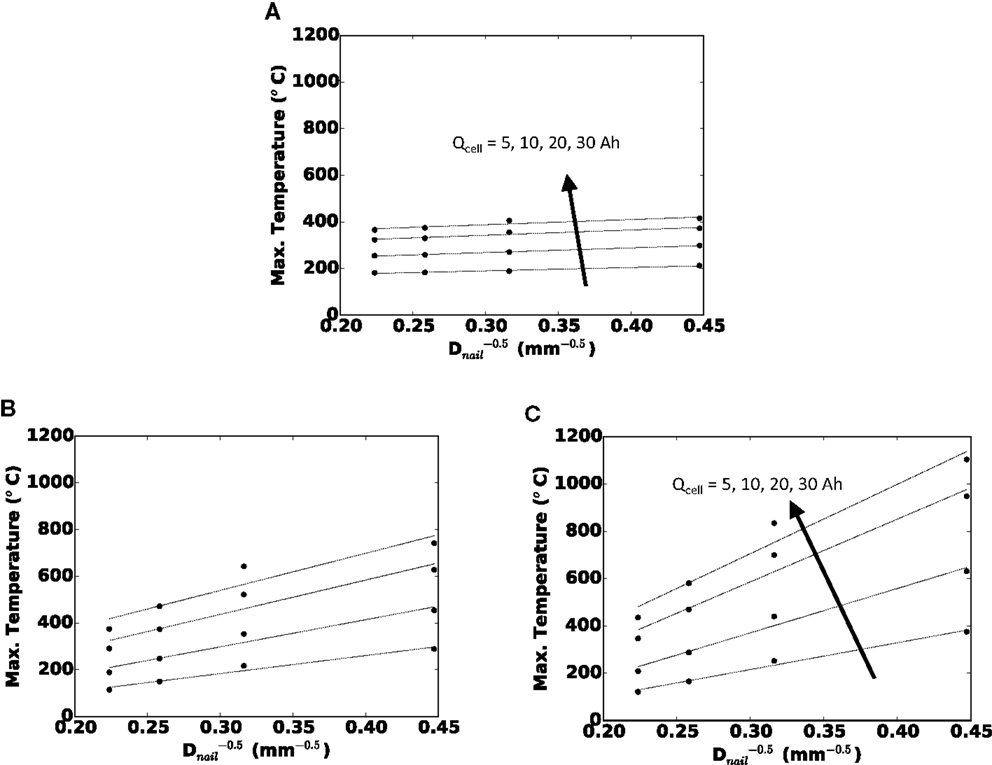
Figure 5. Maximum local temperature versus () for (A) small Afoil, (B) medium Afoil, and (C) large Afoil.
In Figure 6, we quantify the effect of cell capacity on maximum local temperature in the cell for (a) small, (b) medium, and (c) large foil areas. Each curve is for a given nail diameter. Because each subplot is for a fixed cell footprint area, a greater cell capacity along the x-axis is due to thicker cell (more SED layers). Along each curve, the foil area and nail diameter are unchanged, so the shorting current and locality of the short are largely unchanged. Likewise, along each curve, to a good approximation, the cell surface area is unchanged, and therefore, the ability to reject heat from the cell surface is unchanged. Hence, the more dangerous temperature reached with increasing the capacity in these plots is solely a function of greater energy being stored within the cell. Finally, note that there is an approximately linear trend of maximum local temperature with increasing cell capacity. The coefficients of determination (R2 values) for a linear curve fit range from 0.93 for the small Afoil cell with 5 mm diameter nail, to 0.99 for the large Afoil cell with 20 mm diameter nail.
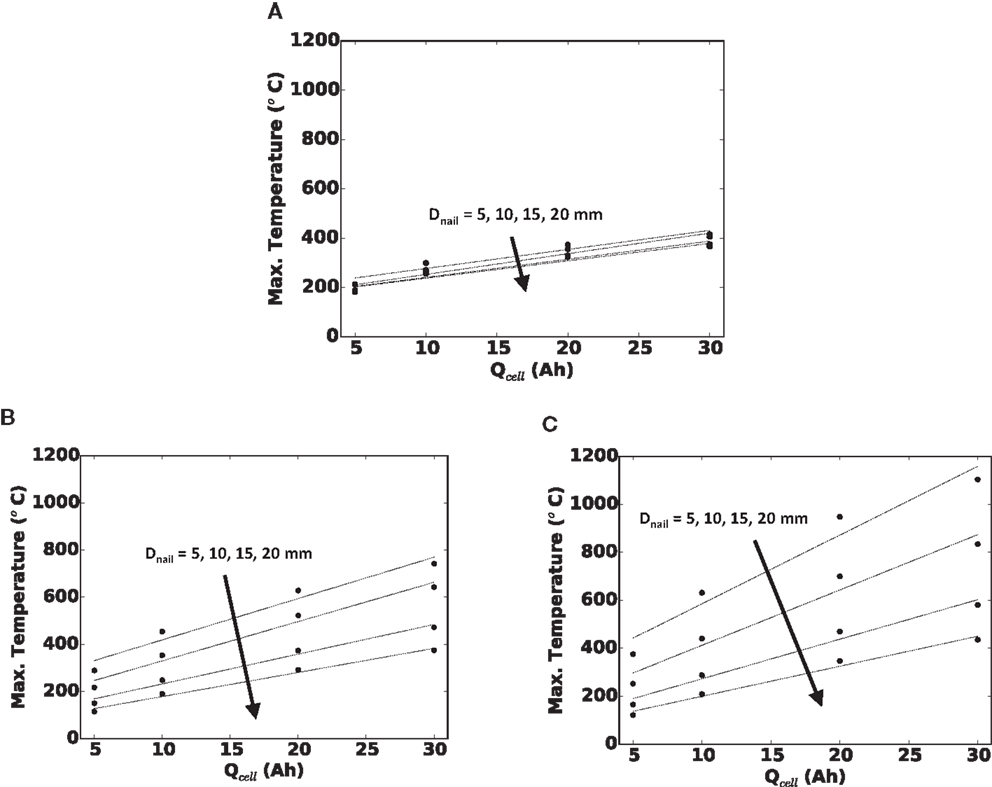
Figure 6. Maximum local temperature versus cell capacity (Qcell) for (A) small Afoil, (B) medium Afoil, and (C) large Afoil.
Cell Capacity with Fixed Footprint
The parametric results from the last section can be generalized into a well-posed design problem. If a cell must fit within a given footprint, what is the quantitative effect on safety if we make the cell thicker to increase the capacity? An unchanged footprint means an unchanged Afoil, and to a good approximation, an unchanged Asurf. In the previous section, we observed the maximum local cell temperature being roughly proportional to , and approximately linearly proportional to cell capacity, when all other parameters were held constant. Therefore, if the cell capacity is increased by increasing cell thickness but with a fixed footprint, we should expect the maximum local temperature to correlate well with for all nail diameters and cell capacities. This is precisely what is shown in Figure 7 for the small foil size (footprint area) used in this study, where a coefficient of determination (R2) of 0.86 was calculated for the baseline cell.
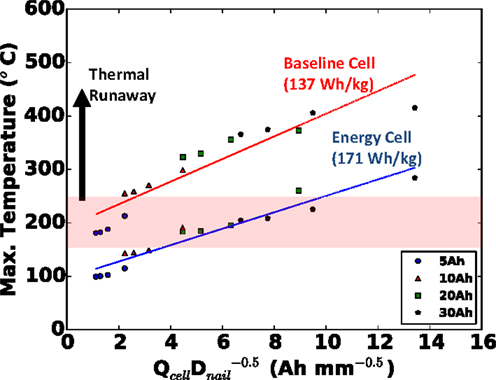
Figure 7. Generalized safety design map for cell with fixed footprint (small Afoil), indicating safety hazard of cells of different capacity (thickness) penetrated with nails of different diameter. Both baseline (red) and alternative energy (blue) cells shown.
For good measure, in addition to our baseline blended power/energy cell of 137 Wh kg−1, in Figure 7, we also plot the same results of the energy cell (171 Wh kg−1, internal design given in Table 2) with the same small foil area. Note that with the thinner and more porous electrodes of the baseline cell design, more layers (13 versus 5 for the energy cell) must be used to retain the same capacity. Clearly in Figure 7 we see that the baseline blended energy/power cell is more dangerous than the energy cell for the same cell capacity and nail diameter, but that it still correlates well with , with a coefficient of determination (R2) value of 0.92. Figure 8 highlights that the internal design of the baseline cell directly leads to a higher C-rate than the energy cell (up to 3×) upon short, as predicted by the TCB model; in Figure 8, this comparison is made for the 20 mm diameter nail and 5 Ah cell. This greater C-rate leads to overall a more dangerous condition for the baseline cell at a given .
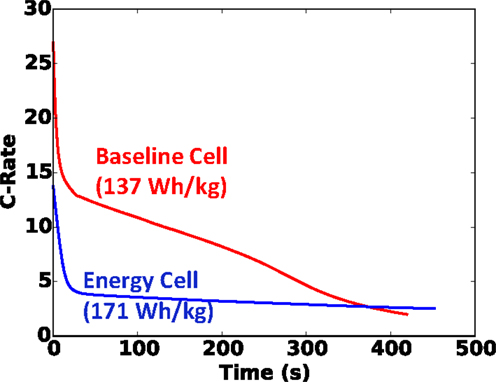
Figure 8. C-rate versus time for baseline and energy 5 Ah cells shorted with 20 mm diameter nail. Nail penetration occurs at t = 0.
We should note, though we have not shown it here, in addition to predicting the effects of cell design (power versus energy) on safety, AutoLion™software can also be used to investigate the effects of materials on safety (e.g., high rate/low capacity material versus low rate/high capacity material). From a design perspective, the value of Figure 7 should not be understated. This plot is an example of a safety design map – results, which were generated within a few days’ time – that allows a cell designer to predict a priori, the safety of a cell in a cost-effective manner. Specifically, from the design map developed in this section, we have shown that for a given footprint, safety can be predicted based on .
Cell Single Sheet Foil Area
The second design problem that we will investigate is choosing an appropriate single sheet foil area to design a cell of a given capacity. Note that for a fixed capacity, the cell aspect ratio coincides with the foil area, as the cell must be stretched in order to retain the same capacity. The single sheet foil area of the cell is an interesting design parameter because of its opposite effect on the thermal and electrochemical physics. A greater surface area (Asurf approximately proportional to Afoil) via larger aspect ratio directly leads to enhanced ability to reject heat from the cell surface. However, as discussed in the Section “Theory,” a greater foil area also leads to greater shorting current and a more dangerous concentrated local heating in proximity of the nail. Therefore, a larger single sheet foil area presents a safety tradeoff in terms of design.
Figure 9 shows the maximum shorting temperature versus single sheet foil area for (a) 5 Ah, (b) 10 Ah, (c) 20 Ah, and (d) 30 Ah cells. For a given capacity, a larger foil area indicates a stretching of the cell, making it thinner (fewer stacked foils), resulting in a larger aspect ratio. For smaller 5 and 10 mm nail diameters, the data show that Tmax always increases with larger Afoil, which is indicative of local heating. However, the most interesting thing about Figure 9 is the observed declining maximum local temperature with larger foil area for smaller cell capacities and larger nails. Namely, for the 5 Ah cell lower Tmax is observed with increasing foil area with 20 mm diameter nail between small (10,400 mm2) and medium (23,520 mm2) foil sizes. The maximum temperature increases, however, from the medium to the large (36,838 mm2) foil size. Also for the 5 Ah cell, but the 15 mm diameter nail, the same trend is observed, but with the minimum Tmax occurring at the small/medium foil size (16,200 mm2). For the 10 Ah cell, the same behavior is observed. We believe both increasing and decreasing curves with larger foil area are an artifact of the tradeoff discussed in the previous paragraph, namely, the opposing effect of Afoil on cell safety (Tmax), under local and global heating conditions.
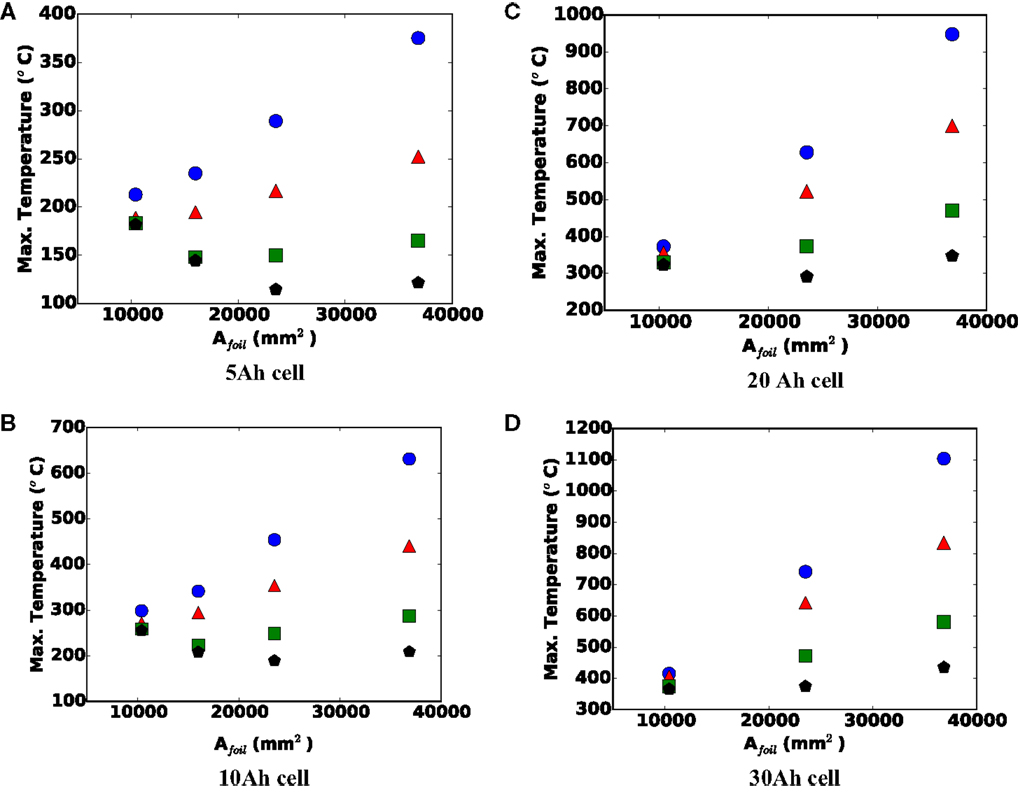
Figure 9. Maximum local temperature versus single sheet foil area for (A) 5, (B) 10, (C) 20, and (D) 30 Ah cells. Blue circle = 5 mm nail, red triangle = 10 mm nail, green square = 15 mm nail, and black pentagon = 20 mm nail.
For larger capacity cells, there is more energy to drive the short, and for smaller diameter nails, the short will be inherently more local in nature; therefore, the effect of larger foil area has minimal effect on the ability to reject heat from the locally hot region of the shorted cell. Under these conditions, the larger Afoil will more strongly increase the shorting current and local heat generation, leading to a more dangerous condition. For smaller capacity cells (5 and 10 Ah) and larger diameter nails (15 and 20 mm), as long as the cell heating remains largely global in nature, a larger Afoil will enhance heat rejection, and make the cell safer. However, at some point, further increasing the Afoil leads to a transition to local heating, after which further increase in Afoil leads to more localized heating, and a more dangerous cell. This explains the downward, then upward nature of the 15 and 20 mm curves in Figures 9A,B for example.
To underscore this local versus global heating in Figure 10, we show the difference between maximum local and cell average temperatures during shorting event for the two extreme cases in Figure 9A (5 Ah cell): (a) 5 mm nail and largest foil area and (b) 20 mm nail and smallest foil area. Clearly, the 5 mm nail and large Afoil combination exhibits very localized heating, with up to 320°C differences between local maximum and cell average values, while the 20 mm nail and small Afoil combination exhibits largely global heating, with <20°C spread between maximum local and cell average temperatures over the entire shorting event.
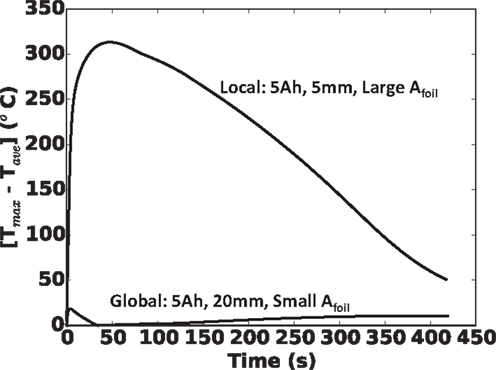
Figure 10. Local temperature profiles for 5 Ah cell with largest foil area and 5 mm nail (top curve), and 5 Ah cell with smallest foil area and 20 mm nail (bottom curve). Top curve demonstrates a typical local heating and bottom curve demonstrates a typical global heating.
Before closing, we should emphasize that as noted in the theory section, we have assumed in this work that there are no shutdown separators, safety layers, or other safety devices designed into the cell. We should point out that, in reference to local versus global heating as shown in Figure 10, we believe a shutdown separator may be effective in maintaining cell safety under global heating conditions (Figure 10, bottom curve), but not under local heating conditions (Figure 10, top curve). The rationale for this is simple. For a global heating as given in Figure 10, bottom curve, as the shutdown temperature is reached gradually across the cell, ion-carrying path (through the separator) is likewise shutdown, before a dangerous local temperature is reached. For local heating, such as in Figure 10, top curve, the shutdown temperature is reached locally, near the hot spot and begins to locally shut off the current carrying path. However, the bulk of the cell (at cooler temperature, e.g., locations 2 and 3 in Figure 10, top curve) continue to carry current to the short, which continues to generate a tremendous amount of heat, maintaining the dangerous condition. Further discussion of this is given in Shaffer et al. (2012) and Zhao et al. (2015a).
Summary and Conclusion
In this paper, we have used the commercial TCB software AutoLion-3D™to investigate design implications of large-format Li-ion cells on safety, specifically under nail penetration test. In doing so, we have virtually designed, meshed, and simulated the nail penetration of 72 different cell/nail combinations. To simulate all 72 cases, it took ~1 week with standard computing equipment.
Three critical design parameters were identified and their effect on cell safety was investigated using illustrative design problems: foil area, nail diameter, and cell capacity. With the other two parameters held constant, it was determined that the cell maximum local temperature, which directly leads to thermal runaway, increased roughly proportional to cell capacity and with . In terms of cell design, we quantitatively investigated the effect of varying cell capacity for a fixed footprint (via thickness) and choosing appropriate foil area for a cell of given capacity. From these numerical experiments, the following conclusions were made:
1. With a fixed footprint (foil area), it was found that the likelihood of the cell to go into thermal runaway correlated quite well with . Further, we demonstrated that this correlation held for cells with two internal designs: the baseline cell with blended power/energy design and a second cell with energy design. The baseline cell was found to be more dangerous, and demonstrated a substantially (up to 3×) greater C-rate upon short.
2. Generally speaking, the cell becomes more dangerous with increasing single sheet foil area (thinner, larger footprint cells). However, for smaller capacity cells and larger nails, we observed a safer condition with larger foil area, under some conditions. Physically, this is due to overwhelming increase of surface area and heat rejection capability coupled with a generally more global heating under these conditions.
Conflict of Interest Statement
The authors declare that the research was conducted in the absence of any commercial or financial relationships that could be construed as a potential conflict of interest.
Acknowledgments
Partial support of this work by the Department of Energy CAEBAT program under Awards DE-EE0006425 and NCI-1-40497-02 is gratefully acknowledged.
References
Albertus, P., Couts, J., Srinivasan, V., and Newman, J. (2008). II. A combined model for determining capacity usage and battery size for hybrid and plug-in hybrid electric vehicles. J. Power Sources 183, 771–782. doi: 10.1016/j.jpowsour.2008.05.012
Cai, W., Wang, H., Maleki, H., Howard, J., and Lara-Curzio, E. (2011). Experimental simulation of internal short circuit in Li-ion and Li-ion-polymer cells. J. Power Sources 196, 7779. doi:10.1016/j.jpowsour.2011.04.024
Doh, C., Kim, D., Kim, H., Shin, H., Jeong, Y., Moon, S., et al. (2008). Thermal and electrochemical behavior of C/LixCoO2 cell during safety test. J. Power Sources 175, 881. doi:10.1016/j.jpowsour.2007.09.102
Doughty, D. (2010). SAE J2464 “EV & HEV Rechargeable Energy Storage System (RESS) Safety and Abuse Testing Procedure.” SAE Technical Paper 2010-01-1077. SAE International. doi:10.4271/2010-01-1077
Doughty, D., and Roth, E. P. (2012). A general discussion of Li ion battery safety. Electrochem. Soc. Interface 21, 37–44.
Gu, W. B., and Wang, C. Y. (2000). Thermal-electrochemical modeling of battery systems. J. Electrochem. Soc. 147, 2910. doi:10.1149/1.1393625
Hatchard, T., MacNeil, D., Basu, A., and Dahn, J. (2001). Thermal model of cylindrical and prismatic lithium-ion cells. J. Electrochem. Soc. 148, A755. doi:10.1149/1.1377592
Hatchard, T. D., Trussler, S., and Dahn, J. R. (2014). Building a “smart nail” for penetration tests on Li-ion cells. J. Power Sources 247, 821. doi:10.1016/j.jpowsour.2013.09.022
Kalupson, J., Luo, G., and Shaffer, C. E. (2013). “AutoLion™: a thermally coupled simulation tool for automotive Li-ion batteries,” in SAE Technical Paper 2013-01-1522 (Detroit, MI: SAE International World Congress and Exhibition).
Kalupson, J., Wang, Q., Zhao, W., Sinha, P., Shaffer, C.E., and Wang, C.Y. (2014). “Cell- and pack-level simulation of large-format Li-ion battery safety events,” in 225th ECS Meeting, Abstract# 160, Orlando, FL.
Kim, G., Pesaran, A., and Spotnitz, R. (2007). A three-dimensional thermal abuse model for lithium-ion cells. J. Power Sources 170, 476. doi:10.1016/j.jpowsour.2007.04.018
Kitoh, K., and Nemoto, H. (1999). 100 Wh large size Li-ion batteries and safety tests. J. Power Sources 81-82, 887. doi:10.1016/S0378-7753(99)00125-1
Luo, G., and Wang, C. Y. (2011). “A multidimensional, electrochemical-thermal coupled lithium-ion battery model,” in Lithium-Ion Batteries: Advanced Materials and Technologies, Chap. 7 (CRC Press), 303–326.
Orendorff, C., Roth, E., and Nagasubramanian, G. (2011). Experimental triggers for internal short circuits in lithium-ion cells. J. Power Sources 196, 6554. doi:10.1016/j.jpowsour.2011.03.035
Shaffer, C. E., Wang, C. Y., Luo, G., and Zhao, W. (2012). “Safety analysis design of lithium-ion battery EV pack through computer simulation,” in Battery Safety (Las Vegas, NV: Knowledge Foundation Conference).
Spotnitz, R., Weaver, J., Yeduvaka, G., Doughty, D., and Roth, E. (2007). Simulation of abuse tolerance of lithium-ion battery packs. J. Power Sources 163, 1080. doi:10.1016/j.jpowsour.2006.10.013
Srinivasan, V., and Wang, C. Y. (2003). Analysis of electrochemical and thermal behavior of Li-ion cells. J. Electrochem. Soc. 150, A98. doi:10.1149/1.1526512
Takami, N., Inagaki, H., Kishi, T., Harada, Y., Fujita, Y., and Hoshina, K. (2009). Electrochemical kinetics and safety of 2-volt class Li-ion battery system using lithium titanium oxide anode. J. Electrochem. Soc. 156, A128. doi:10.1149/1.3043441
Tobishima, S., Takei, K., Sakurai, Y., and Yamaki, J. (2000). Lithium ion cell safety. J. Power Sources 90, 188. doi:10.1016/S0378-7753(00)00409-2
Tobishima, S., and Yamaki, J. (1999). A consideration of lithium cell safety. J. Power Sources 81-82, 882. doi:10.1016/S0378-7753(98)00240-7
Wang, C. Y., and Srinivasan, V. (2002). Computational battery dynamics (CBD)-electrochemical/thermal coupled modeling and multi-scale modeling. J. Power Sources 110, 364. doi:10.1016/S0378-7753(02)00199-4
Wu, M., Chiang, P., Lin, J., and Jan, Y. (2004). Correlation between electrochemical characteristics and thermal stability of advanced lithium-ion batteries in abuse tests – short-circuit tests. Electrochim. Acta 49, 1803. doi:10.1016/j.electacta.2003.12.012
Zhao, W., Luo, G., and Wang, C. Y. (2015a). Modeling nail penetration process in large-format Li-ion cells. J. Electrochem. Soc. 162, A207–A217. doi:10.1149/2.1071501jes
Keywords: Li-ion battery, safety, large-format battery, simulation, nail penetration
Citation: Wang Q, Shaffer CE and Sinha PK (2015) Controlling factors of cell design on large-format Li-ion battery safety during nail penetration. Front. Energy Res. 3:35. doi: 10.3389/fenrg.2015.00035
Received: 19 June 2015; Accepted: 21 July 2015;
Published: 21 August 2015
Edited by:
Partha P. Mukherjee, Texas A&M University, USAReviewed by:
Zhengjun Zhang, Tsinghua University, ChinaHongchang Pang, Dalian University of Technology, China
Copyright: © 2015 Wang, Shaffer and Sinha. This is an open-access article distributed under the terms of the Creative Commons Attribution License (CC BY). The use, distribution or reproduction in other forums is permitted, provided the original author(s) or licensor are credited and that the original publication in this journal is cited, in accordance with accepted academic practice. No use, distribution or reproduction is permitted which does not comply with these terms.
*Correspondence: Christian Edward Shaffer, EC Power, 341 Science Park Road, State College, PA 16803, USA,Y2VzaGFmZmVyQGVjcG93ZXJncm91cC5jb20=