 Yaqin Qiao
 Junfeng Rong
 Hui Chen
 Chenliu He1
 Qiang Wang
- 1Key Laboratory of Algal Biology, Institute of Hydrobiology, Chinese Academy of Sciences, Wuhan, China
- 2University of Chinese Academy of Sciences, Beijing, China
- 3SINOPEC Research Institute of Petroleum Processing, Beijing, China
For the large-scale cultivation of microalgae for biodiesel production, one of the key problems is the determination of the optimum time for algal harvest when algae cells are saturated with neutral lipids. In this study, a method to determine the optimum harvest time in oil-producing microalgal cultivations by measuring the maximum photochemical efficiency of photosystem II, also called Fv/Fm, was established. When oil-producing Chlorella strains were cultivated and then treated with nitrogen starvation, it not only stimulated neutral lipid accumulation, but also affected the photosynthesis system, with the neutral lipid contents in all four algae strains – Chlorella sorokiniana C1, Chlorella sp. C2, C. sorokiniana C3, and C. sorokiniana C7 – correlating negatively with the Fv/Fm values. Thus, for the given oil-producing algae, in which a significant relationship between the neutral lipid content and Fv/Fm value under nutrient stress can be established, the optimum harvest time can be determined by measuring the value of Fv/Fm. It is hoped that this method can provide an efficient way to determine the harvest time rapidly and expediently in large-scale oil-producing microalgae cultivations for biodiesel production.
Introduction
The limiting supply, increasing cost, and ever increasing environmental pollution and health problems from conventional fossil fuels is placing an increasing demand on biodiesel to replace some fossil fuel usage (Hill et al., 2006; Hu et al., 2006; Hu et al., 2008; Amaro et al., 2011). With this in mind, microalgae have attracted considerable attention in recent years as potential sources of renewable fuel, due to their fast growth rate, high adaptability to environment conditions, and their no competition with crops for arable land and potable water (Santos et al., 2011). Microalgae have been promising feedstock for biodiesel production (Zhang et al., 2014b). The green microalgae genus Chlorella (Chlorophyta), which are capable of photoautotrophic, mixotrophic, and heterotrophic growth with high biomass accumulation, appears to contain good candidate strains for biodiesel production (Petkov and Garcia, 2007).
The cell metabolism of microalgae varies with the change in growth conditions. Nitrogen (N) starvation is one of the most effective environmental stresses and stimulates the accumulation of lipids in many microalgae (Illman et al., 2000). The general principle is that the lack of N limits protein biosynthesis, and the fixed carbon from photosynthesis will then channeled into high energy density compounds such as triglycerides and/or starch (Scott et al., 2010). With limited N supply, Chlorella could accumulate doubled or even tripled amount of lipid (Converti et al., 2009; Widjaja et al., 2009). However, even though cultivation with N limiting media results in an increase in the lipid content on a per cell weight basis, it also lowers the total biomass productivity significantly, resulting in decreased lipid productivity. A two-stage cultivation strategy has then been proposed by Zhu et al. (2014) to avoid this problem, in which a full-strength medium was used in the first stage to promote algal cell growth and to accumulate biomass, then the cells were subjected to N-starvation conditions in the second stage to trigger the target product accumulation (Zhu et al., 2014).
For the application of microalgae in biodiesel production, there remain many problems that need to be solved, and development of an effective method to ascertain the optimum time for algal harvest to obtain high neutral lipid productivity is one of the most important challenges. The chlorophyll-fluorescence measurement has been utilized for decades for non-invasive analyses of stress-induced perturbations to photosynthesis (Schreiber, 1978; Conroy et al., 1986). The maximum quantum efficiency of photosystem II (PSII, Fv/Fm) measured under dark-adapted conditions represents the theoretical capacity for light energy absorbed by PSII to be utilized in photosynthesis. The Fv/Fm value, which remains relatively constant under normal conditions, reflects the potential quantum efficiency of PSII and is used as one of the most sensitive indicators of the photosynthetic performance, which decreases when exposed to stress (Maxwell and Johnson, 2000; Oxborough, 2004). The Fv/Fm value was got with no extra agent add to the algae suspension and no harm to the algae influencing the downstream apply of microalgae. And the measurement of Fv/Fm was performed in action light that is the optimal light condition for algae growth for a few minutes and only no more one second saturation pulse. So Fv/Fm value was rapid and no-invasive parameter to characterize microalgae.
In this study, it was found that the lipid content increased with the decreasing Fv/Fm in the green algae Chlorella sp. C2 treated by N starvation, which is consistent with the reports in our previous study (Zhang et al., 2013). On this basis, four oil-producing green algae strains – Chlorella sorokiniana C1, Chlorella sp. C2, C. sorokiniana C3, and C. sorokiniana C7 – were cultivated and treated under N-starvation conditions to investigate the relationship between neutral lipid accumulation and the Fv/Fm values. A significant negative correlation between the neutral lipid contents and the Fv/Fm values was found for all four algal strains. Then, a method to determine the optimum harvest time in oil-producing microalgae cultivation by measuring Fv/Fm only was established and validated in lab-scale cultivation. This could provide a rapid and inexpensive way to determine the harvest time in large-scale oil-producing microalgae cultivation for biodiesel production.
Materials and Methods
Growth Conditions and N-Starvation Treatment
The N-sufficient medium (N+) used was full-strength BG11 medium (Tran et al., 2014). The N-deficient medium (N−) was BG11 without NaNO3. Alga strains C. sorokiniana C1, Chlorella sp. C2, C. sorokiniana C3 and C. sorokiniana C7 in the exponential phase were each inoculated with an initial OD700 of 0.05 into a 1 l flask containing 500 ml BG11 medium at controlled temperature of 25°C, under continuous illumination of white fluorescence light at 70 μmol m−2 s−1, and bubbled continuously with filtered air. For the N-starvation treatment, the cells were harvested during the middle exponential growth phase (OD700 approximately 0.8, about 1.1 × 10⁷ cells ml−1) and centrifuged 3 min at 3,000 g at room temperature (about 25°C). The pellet was then washed and resuspended in the N-medium to OD700 0.8. Then, cultivation of the cultures was continued with the same light, temperature, and air supply as the N-sufficient medium.
Fluorescence Microscope Analysis
Microscopic visualization of algae cells were carried out using a confocal scanner (Zeiss LSM 710 NLO) and fluorescence microscope (OLYMPUS system microscope BX53, Japan) as described previously (Zhang et al., 2013). The lipid bodies were stained with the fluorescent dye, Bodipy 505/515 (Invitrogen Molecular Probes, Carlsbad, CA, USA) with a final labeling concentration of 1 mM, according to Cooper et al. (2010). Confocal laser scanning microscopy (CLSM) analysis was carried out as previously described in Zhang et al. (2013, 2014a). Fluorescence microscope analysis of the green bodipy fluorescence was excited at 488 nm and detected at 505–515 nm. The red auto-fluorescence of the chloroplasts was simultaneously detected at 650–700 nm.
Thin Layer Chromatography Analysis of Lipid
The cell lipids were extracted and thin layer chromatography (TLC) analyzed according to Reiser and Somerville (1997) with minor modifications as described by Zhang et al. (2013).
Flow Cytometry Analysis
Flow cytometry (FCM) analysis was used to visualize the florescence of lipid in large number cells level. Five hundred microliters of cells (1.1 × 10⁷ cells ml−1) were stained with Bodipy 505/515 at 37°C for 30 min under dark condition and then analyzed by FACS Aria Flow Cytometer (Becton Dickinson, San Jose, CA, USA) equipped with a laser emitting at 488 nm and an optical filter FL1 (530/30 nm). And Flow Jo software (Tree Star, San Carlos, CA, USA) was used to analysis the collected data from Flow Cytometer.
Pigments Quantification
Total pigments were extracted with 100% methanol. One milliliter of cells (1.1 × 10⁷ cells ml−1) was collected and centrifuged at 3,000 g for 3 min at room temperature. The pellet was resuspended in 1 ml of 100% methanol for 12 h. And the pigment concentrations were determined spectrophotometrically and calculated according to the formula developed by Lichtenthaler (1987) as chlorophyll a (Chl a) (microgram per milliliter) = 16.72 A665.2–29.16 A652.4, chlorophyll b (Chl b) (microgram per milliliter) = 34.09 A652.4–15.28 A665.2, total chlorophylls (Chl a + b) (microgram per milliliter) = 1.44 A665.2 + 24.93 A652.4, total carotenoids (Car) (microgram per milliliter) = (1000 A470 − 21.63 Chl a − 104.96 Chl b)/221.
Chl Fluorescence Analysis
A Dual-PAM-100 Chl fluorometer (Walz, Germany) was used for all Chl fluorescence measurements. Cells were fully dark-adapted for 15 min before the measurement of Initial (Fo) and maximum Chl fluorescence level. The maximum quantum yields of PSII electron transport was calculated as Fv/Fm = (Fm − Fo)/Fm according to Genty et al. (1989).
Photosynthetic Steady-State Oxygen Evolution and Dark Respiration Rates Measurement
Photosynthetic oxygen evolution and dark respiration rates were measured using a Clark-type oxygen electrode (Oxylab 2, Hansatech, UK) at 20°C as described by Zhang et al. (2013). The dark respiration rates were measured with 10 μM NaHCO3 in cell suspensions (2 ml) under dark condition and the oxygen evolution rates were measured with cell suspensions (2 ml) illuminated at a quantum flux density of 600 μmol m−2 s−1. The collected data were the rate of oxygen changes (μmol O2 min−1). The chlorophyll (Chl a) contents were determined as described in above 2.5 pigments quantification. And the result of oxygen evolution and dark respiration rates were expressed with the rate of oxygen released (oxygen evolution μmol O2 mg−1 Chla h−1) and consumption (respiration rate μmol O2 mg−1Chla h−1).
Assessment of Lipid Peroxidation and ROS Scavenging Enzyme Activity Assays
The malondialdehyde (MDA) level, and the enzyme activities of catalase (CAT), peroxidase (POD), and superoxide dismutase (SOD) were measured according to Shi et al. (2009) as described by Zhang et al. (2013).
Lab-Scale (3L) Cultivation
The lab-scale cultivation was performed in a 3 l photobioreactor (Zhang et al., 2014a). The four algal strains were inoculated with an initial OD700 of 0.05 into the photobioreactor flask containing 2 l BG11 medium at controlled temperature of 25°C, under continuous illumination of white fluorescence light at 70 μmol m−2 s−1, and bubbled continuously with filtered air. Cells reached their mid logarithmic growth phase (about 0.8 at OD700) were harvested by centrifugation for 3 min at 3,000 g at room temperature. The algae pellets were then washed and resuspended in N-medium to OD700 0.8. Then, cultivation of the cultures continued under the same growth conditions.
Statistical Analysis
Each result shown represents at least the mean of three independent biological replicates. The statistical analysis of the collected data was made using SPSS-13. The correlation between the variables was analyzed with Pearson’s correlation.
Results
N Starvation Stimulates Neutral Lipid Accumulation in Chlorella sp. C2
To understand the regulation of neutral lipid accumulation in Chlorella sp. C2, the cell neutral lipid levels at various time intervals of N depletion were extracted and examined using TLC. As shown in Figure 1A, neutral lipid accumulation in both N− (Figure 1A, lanes 1, 2) and N+ medium (Figure 1A, lanes 5, 6) were undetectable during the first 2 days of cultivation, which came into sight after 2 days in the cells cultured in N-medium (Figure 1A, lane 3), and significant accumulation could be observed after 8 days of N starvation (Figure 1A, lane 4). While as contrast, only a trace amount of neutral lipids could be detected in N repletion medium grown cells (Figure 1A, lane 8) even after 8 days.
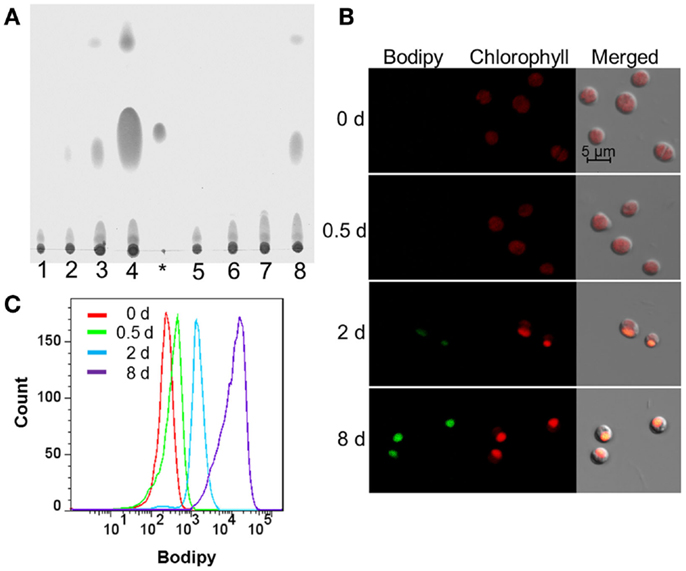
Figure 1. Lipid accumulation of Chlorella sp. C2 in N+ or N− medium. (A) TLC analysis of lipid accumulation. Lanes 1–4, cells in N- medium at 0, 0.5, 2, and 8 days after being resuspended, respectively; asterisk symbol, glyceryl trioleate as loading control; lanes 5–8, cells in N+ medium at 0, 0.5, 2, and 8 days after being resuspended, respectively. (B) CLSM analysis of lipid accumulation after resuspended, respectively, in N- medium at 0, 0.5, 2, and 8 days. The size of the scale bar is shown directly in the image. (C) FCM analysis of lipid accumulation after resuspended, respectively, in N-medium at 0, 0.5, 2, and 8 days.
A CLSM analysis was used to visualize the neutral lipid accumulation of the algal cells cultured in N-medium at different stages. In accordance with the TLC (Figure 1A) analysis, Figure 1B shows that no green Bodipy 505/515 fluorescence could be detected at 0 day (Figure 1B) and 0.5 day (Figure 1B) after N-treatment, while a weak green fluorescence was first detected after 2 days (Figure 1B) and a strong green fluorescence signal was observed after 8 days of treatment (Figure 1B). Moreover, to further characterize the neutral lipid accumulation during N starvation at statistical level, a group of Chlorella sp. C2 cells (>10,000) at different stages were analyzed using FCM. Compared with day 0, the Bodipy fluorescence intensity of the cell populations at days 0.5, 2, and 8 of N starvation showing a constant increase, indicating constantly increasing levels of neutral lipid (Figure 1C). Thus, as in Chlorella sp. C3 (Zhang et al., 2013), days 0, 0.5, 2, and 8 of N- treatment could be defined as the control stage (Cs), pre-oil droplet formation stage (PDFs), oil droplet formation stage (ODFs), and late-oil droplet formation stage (LDFs), respectively. These were also the key stages in the further tests.
N Starvation Damages Photosynthesis System
Nitrate is one of the most important elements contributing to algae growth, so its depletion may dramatically change the physiological activity. As a stressor, the N starvation will not only induce lipid accumulation but also lead to the depression of photosynthesis. As shown in Figure 2A, all the pigment contents, including Chl a, Chl b, Chl a + b, and carotenoid (Car), had a significant decrease before the ODFs and then decreased continuously during neutral lipid accumulation in N-medium.
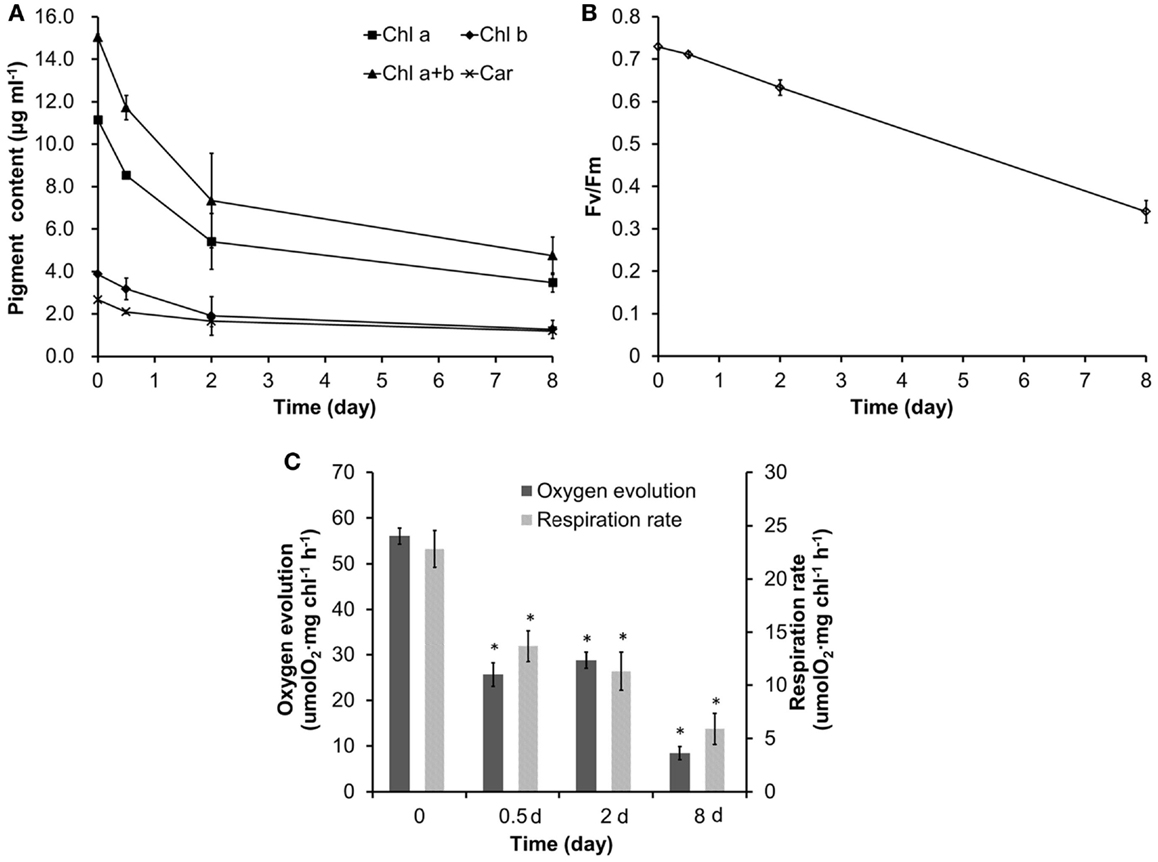
Figure 2. The variation of photosynthetic physiology in Chlorella sp. C2 during lipid droplet formation. (A) Pigment content. (B) The maximum photochemical efficiency of PSII (Fv/Fm). (C) Steady-state oxygen evolution and in dark respiration. All data points in the current and following figures represent the means of three replicated studies in each independent culture, with the SD of the means (*p < 0.05; **p < 0.01).
In photosynthetic organisms, nutrient stresses could be generally detected with a decrease in the Fv/Fm value, as the Fv/Fm value in healthy cells has been reported to be constant (Conroy et al., 1986; Genty et al., 1989; Maxwell and Johnson, 2000), but decreases under various stresses (Conroy et al., 1986; Lu et al., 1999; Lee et al., 2013; Zhang et al., 2013). Figure 2B shows the Fv/Fm value declined linearly during oil droplet formation, suggesting that the algae cell was under environmental stress.
Rates of steady-state photosynthetic oxygen evolution and dark respiration were examined to further understand the variation in photosynthesis of Chlorella sp. C2 during N-induced oil droplet formation. Compared with the untreated cells, both the photosynthetic oxygen evolution rate and the respiration rate of the N starved cells reduced significantly during oil droplet formation (Figure 2C), indicating that severe damage to the photosynthetic apparatus, as well as to the respiratory apparatus, had occurred.
Most stresses in oxygenic photosynthetic organisms would ultimately lead to oxidative stress (Elstner, 1991). Lipid peroxidation level, the most commonly accepted indicator of oxidative stress (Apel and Hirt, 2004; Zhang et al., 2013), could be estimated by measuring the formation of MDA in cells. During oxidative stress, ROS, including •, and H2O2, levels increase (Apel and Hirt, 2004), and the antioxidant enzyme, including SOD, POD, and CAT, will be induced or activated in cells (Ali et al., 2005). As shown in Figure 3, N starvation induced an increase in the MDA level in the cells. The relative activities of SOD and CAT dramatically increased at the PDFs and dropped gradually at the ODFs and LDFs. By contrast, the relative activities of POD declined slightly at the PDFs, and then increased at the ODFs and LDFs. Therefore, this suggests that POD, CAT, and SOD play important roles in scavenging ROS and reducing MDA in Chlorella sp. C2 cells under N starvation at different stages (Figure 3).
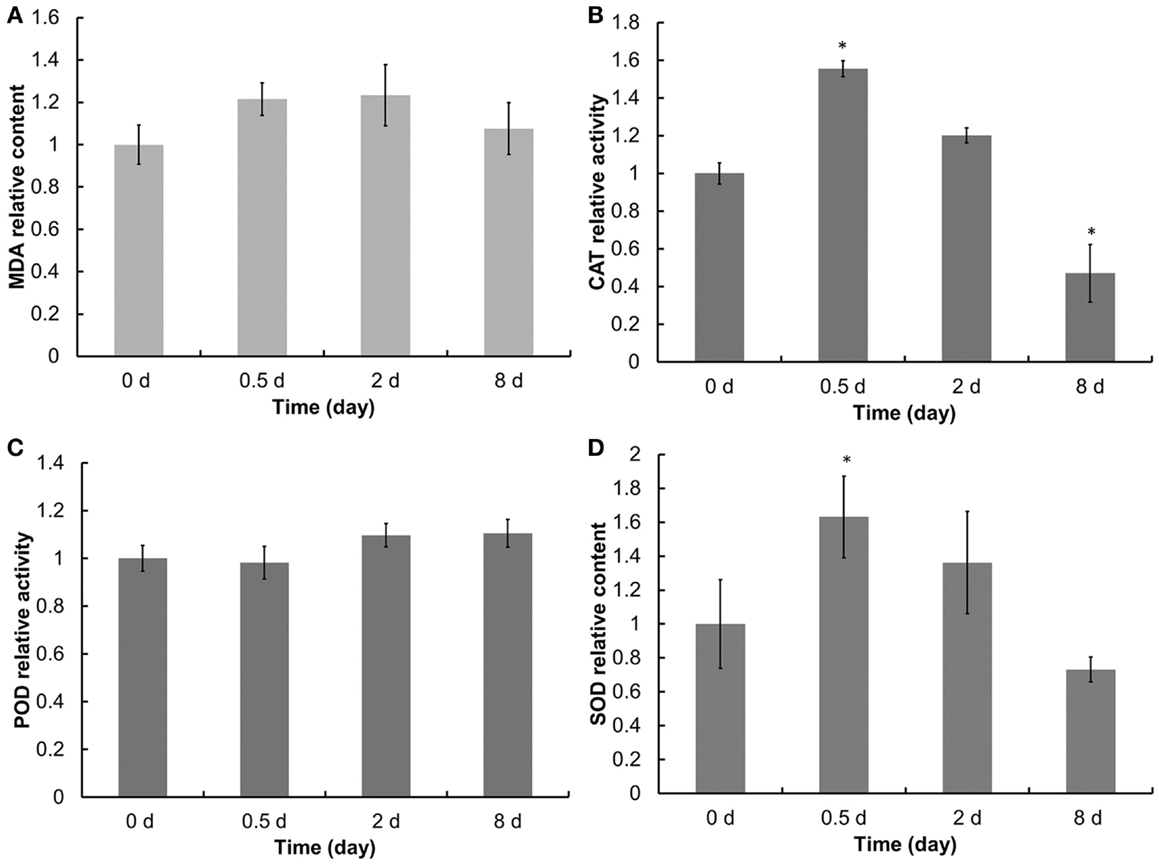
Figure 3. Lipid peroxidation level and antioxidant enzymes activities of Chlorella sp. C2 during OD formation. (A–D) represents the MDA content, CAT, POD, and SOD activities, respectively.
The above results suggest that both the neutral lipid accumulation and the damage to the photosynthetic system might be caused by N starvation-induced oxidative stress. Furthermore, as the most sensitive indicator for stress response under unfavorable conditions, the Fv/Fm value decreased linearly (Figure 2B) along with the increasing triacylglycerol (TAG) accumulation (Figure 1) under N starvation. So it is predicted that the Fv/Fm value may be an excellent indicator for identifying the level of N-induced TAG accumulation and could provide a non-invasive and quick tools of determining the timing for microalgae harvest if a significant relationship existed between the Fv/Fm value and the TAG content.
Fv/Fm Value Can be Used to Estimate Neutral Lipid Levels in the Four Oil-Production Algae
Besides Chlorella sp. C2, three further oil-producing green algae strains – C. sorokiniana C1, C. sorokiniana C3, and C. sorokiniana C7 – were selected to identify the relationship between the Fv/Fm value and the neutral lipid level. During N-starvation treatment, the neutral lipid levels in cells of all four strains rose gradually with the prolongation of N-depletion stress (Figure 4, green fluorescence). However, Chl auto-fluorescence (Figure 4 red fluorescence) signals became more heterogeneous as the chloroplast shapes became abnormal. Moreover, in accordance with the fluorescence microscope results (Figure 4), the TLC results also showed that increasing neutral lipid levels were detected with time (Figure 5A). The relative contents of neutral lipid were measured using Image J (v1.41, NIH), and it was seen that the contents had significantly positive association with time under N starvation in all four algae (Figure 5B, r > 0.9, p < 0.01, correlation test by SPSS-13). As show in Figure 6, the values of Fv/Fm in all four algae declined linearly during N starvation, and the Fv/Fm values were significant negatively correlated with time (correlation test, r < −0.9, p < 0.01). Notably, during N starvation, the significant negative linear correlations appeared between the Fv/Fm values and relative lipid content in all four algae (Figure 7, correlate test, r > 0.9, p < 0.01). Therefore, for these four oil-rich algae, in which we have established the relationship between the neutral lipid content and the Fv/Fm values, the neutral lipid level under N starvation can be got indirectly by measuring the Fv/Fm value. This can therefore be used to determine the optimal harvest time of microalgae for lipid production.
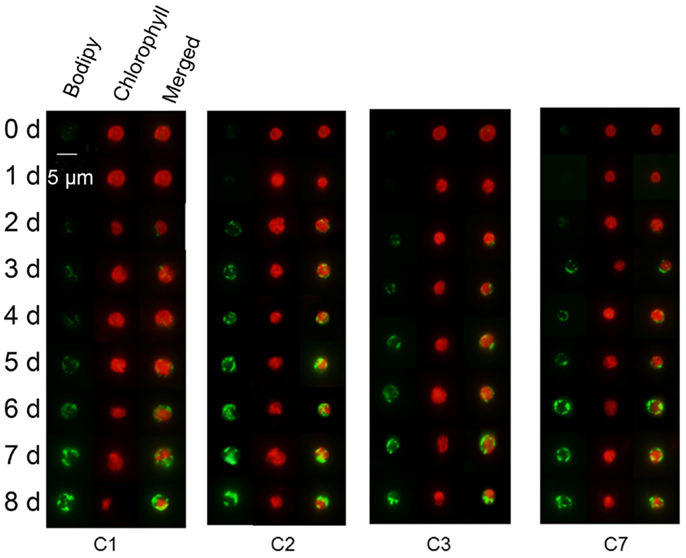
Figure 4. Representative fluorescence microscope analysis of Chlorella sorokiniana C1 (C1), Chlorella sp. C2 (C2), Chlorella sorokiniana C3 (C3), and Chlorella sorokiniana C7 (C7) labeled in vivo with Bodipy 505/515. Bodipy 505/515 (green) was excited with an argon laser at 488 nm and detected at 505–515 nm. Chl autofluorescence (red) was detected simultaneously at 650–700 nm. The cells were stained after resuspended, respectively, in N-medium for 0–8 days. The size of the scale bar is shown directly in the image.
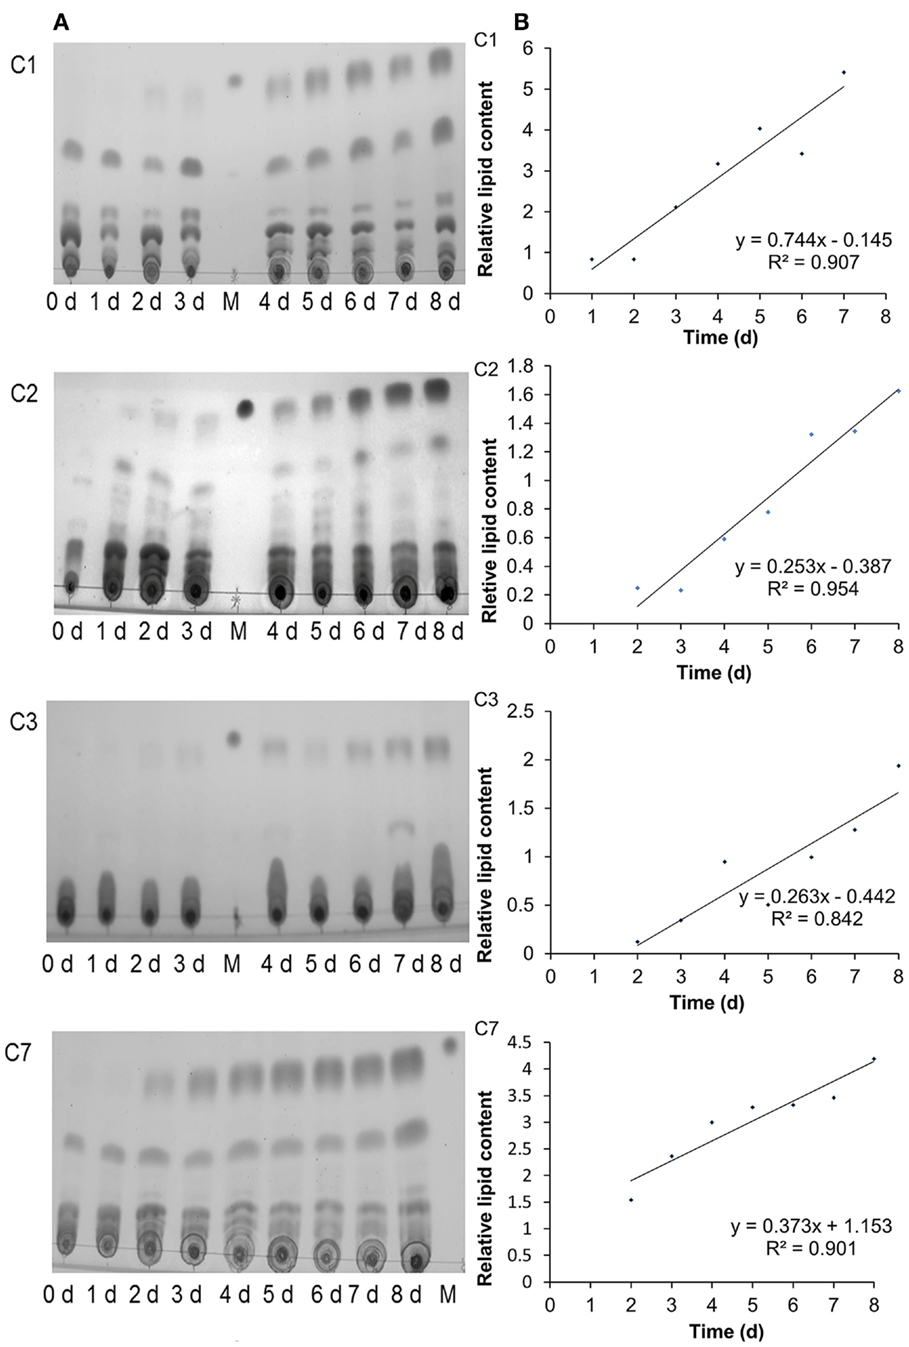
Figure 5. TLC analysis of the neutral lipid accumulation in Chlorella sorokiniana C1 (C1), Chlorella sp. C2 (C2), Chlorella sorokiniana C3 (C3), and Chlorella sorokiniana C7 (C7) cells under N starvation. The neutral lipid accumulation was detected at 0–8 days after N starvation. M symbol, glyceryl trioleate as loading control (A). The variation of the relative neutral lipid content with the prolog of N-starvation time (B).
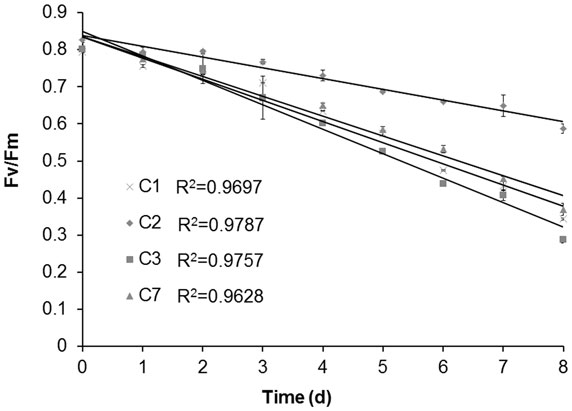
Figure 6. The variation of maximum photochemical efficiency of PSII (Fv/Fm) of Chlorella sorokiniana C1 (C1), Chlorella sp. C2 (C2), Chlorella sorokiniana C3 (C3), Chlorella sorokiniana C7 (C7) with the prolog of N-starvation time.
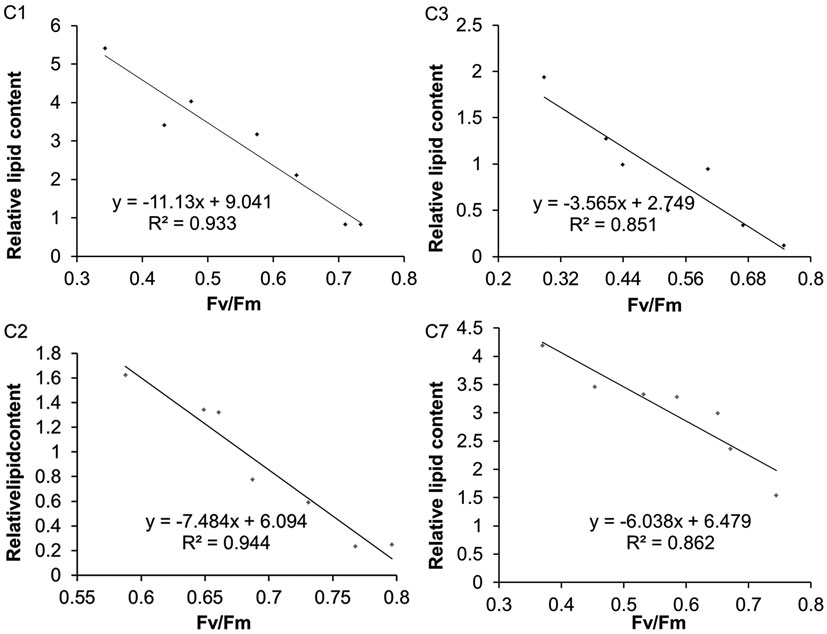
Figure 7. The correlation between Fv/Fm and relative neutral lipid content in Chlorella sorokiniana C1 (C1), Chlorella sp. C2 (C2), Chlorella sorokiniana C3 (C3), and Chlorella sorokiniana C7 (C7) under N starvation.
Lab-Scale Experiments Demonstrated the Application of the Fv/Fm Index for Determining the Harvest Time in a Given Oil-Producing Algae Cultivation
To further test the practicability of using the Fv/Fm value for determining the harvest time in a given oil-producing algae, lab-scale experiments using four algal strains were performed in 3 l bioreactors. During the N-starvation time, the algae were collected at random time points to detect the neutral lipid accumulation and the Fv/Fm values. Similar to our previous results, the accumulation of neutral lipids increased with the decreasing Fv/Fm values in all four algae in the 3 l bioreactors (Figure 8). This indicated that the Fv/Fm value could be an indicator for determining the neutral lipid level in a given oil-producing algae cultivated in a 3 l or even larger scale bioreactor. Furthermore, for a given oil-rich microalgae, this indicates that if the relationship between the neutral lipid content and the Fv/Fm value under nutrient stress can be established, the optimum harvest time for lipid production in cultivations under nutrient stress can be determined by measuring the Fv/Fm value.
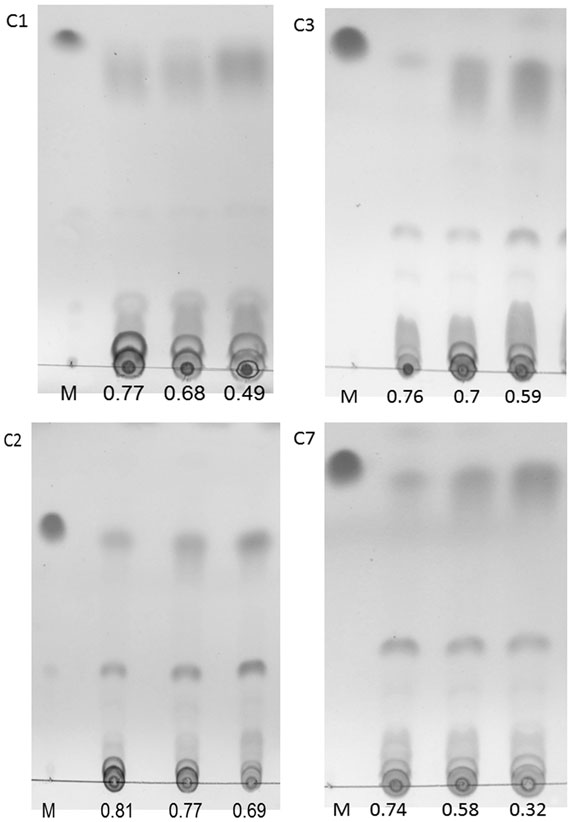
Figure 8. TLC analysis of the neutral lipid accumulation in Chlorella sorokiniana C1 (C1), Chlorella sp. C2 (C2), Chlorella sorokiniana C3 (C3), and Chlorella sorokiniana C7 (C7) cells under N starvation with the decreasing of Fv/Fm. The algae were collected randomly in time scale.
Discussion
One of the challenges of microalgae biodiesel production is the measurement of lipid content to determine the optimum harvest time obtaining high levels of lipids. In order to determine the lipid accumulation level in microalgae cells, lipid extraction and detection are required using traditional technology. TLC and the gravimetric method are the two most commonly used methods for lipid-content detection (Bligh and Dyer, 1959; Reiser and Somerville, 1997). However, the lipid extraction and detection steps used are complicated, need many organic reagents, resulting in environmental toxicity, and are laboring intensive and expensive. Recently, fluorescent probes such as the lipophilic probes Nile red (Cooksey et al., 1987) and BODIPY 505/515 (Cooper et al., 2010), which can measure the neutral lipid level in intact cells without lipid extraction, have been used to estimate lipid accumulation. However, there are also some disadvantages of these florescent probes, namely, the relatively high cost of time and money for staining and detecting the fluorescent probe, and the potential errors caused by the different permeability of the fluorescent probe into diverse microalgae cells. Therefore, a simple and low-cost method is needed to establish the lipid level to then determine the optimum harvest time rapidly and expediently in oil-producing microalgae cultivations. In our study, we established a new method by measuring the chlorophyll-fluorescence parameter Fv/Fm.
Under N-starvation condition, microalgae cells preferentially degraded nitrate containing macromolecules, resulting in a decrease of total nitrogen content as well as the accumulation of excess carbon in the form of lipids (Dawes, 1976). In this article, the lipid content was linearly increased after 2 days of N-starvation treatment (Figures 1 and 5). N depletion also induced the decrease of Fv/Fm values, which may be a consequence of reduced photosynthetic pigment (Figures 2 and 4). Previous studies also reported the decrease in Fv/Fm values under osmotic, light, and nutrient stress (Lu et al., 1999; Beardall et al., 2001). Under N-starvation condition, the neutral lipid accumulation increasing and Fv/Fm decreasing occurs simultaneously. So we predicted there may be some relationship between lipid increasing and Fv/Fm decreasing. The result shows that the lipid increasing was negatively correlative with Fv/Fm decreasing. Therefore, Fv/Fm may be a tool to determine the lipid accumulation for microalgae under N starvation. A previous research reported the use of PAM fluorometry to measure the biosynthesis of neutral lipid under nutrient stress (White et al., 2011). So the measurement of Fv/Fm for the determination of harvest time is a feasible method. The Fv/Fm value was obtained from specimens in the dark-adapted state, and the measurement could be completed within a few seconds using a single saturating pulse. So this procedure is simple, rapid, non-invasive, low-cost, and highly appropriate for large-scale application.
Even though Fv/Fm can be a parameter to determine lipid content, there were some interesting reports. A study using the Fv/Fm value as a screening tool for oil-rich mutant microalgae reported that under stress conditions, for different algae, algae with high remaining Fv/Fm values also have a high total lipid content, thus presenting a positive correlation (R2 = 0.906) between the lipid content and the Fv/Fm value (Huangfu et al., 2013). Similar phenomenon was also observed in naturally occurring microalgae strains (Pan et al., 2011). In our study, the Fv/Fm values were significantly negatively correlated with the relative lipid content (Figure 7, r < −0.9, p < 0.01), and the result was verified in a 3 l scale culture by testing samples at random time points (Figure 8). The difference of our negative correlation and the previous positive correlation report may be because that the previous report focused on the comparison of different algae, while we concentrate on the comparison of the given algae at different stress time. Under stress condition, the Fv/Fm value decreased and the lipid content increased. However, for different algae or mutants under same stress, the alga with higher remaining Fv/Fm value behaved a higher toleration to the stress and has a higher potential photosynthesis for fixing more carbon and supplying more energy and carbon source for lipid production. So the remaining Fv/Fm was positive correlation with lipid content. As for our study, Fv/Fm value is the most sensitive indicator for stress response under unfavorable conditions, and neutral lipid accumulation coupled with N starvation-induced oxidative stress (Zhang et al., 2013). With the decreasing of Fv/Fm under N starvation, the lipid content continuously accumulated to saturated point with a slower and slower rate. Therefore, for the given algae, comparison with the stress time, the Fv/Fm value was negative correlation with lipid content. Thus, we predicted that for a given oil-producing algae under stress conditions, there is a negative relationship between the Fv/Fm value and the TAG content that can be used to estimate the TAG content and thus determine the optimum harvest time for lipid production.
In summary, we have established a simple and convenient method to determine the harvest time of microalgae under stress conditions for lipid production. For the technological process shown in Figure 9, for a given oil-rich microalgae, we can establish the relationship between the lipid content and the Fv/Fm value, thus obtaining a range for the Fv/Fm value around the lipid saturation point. When cultivating algae on a large scale for oil production, we can determine the optimum harvest time by measuring the Fv/Fm value and referring it to the established relationship.
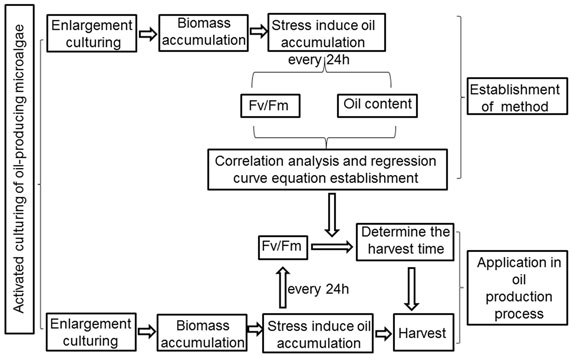
Figure 9. Technique flow diagram of the application of method that determination of the harvest time of oil-producing microalgae cultivation using Fv/Fm in oil production process.
Author Contributions
YQ was responsible for study conception and design, data collection and analysis, manuscript writing, and final approval of the manuscript; JR for study conception and design, data collection and analysis, and final approval of the manuscript; HC for data collection and analysis, manuscript writing, and final approval of the manuscript; CH for data analysis and final approval of the manuscript; and QW for conception and design, critical revision and manuscript writing, and final approval of the manuscript. All authors read and approved the final manuscript.
Conflict of Interest Statement
The authors declare that the research was conducted in the absence of any commercial or financial relationships that could be construed as a potential conflict of interest.
Acknowledgments
This work was supported jointly by the National Program on Key Basic Research Project (2012CB224803, 2011CB200902), the National Natural Science Foundation of China (31300030, 31270094), the Natural Science Foundation of Hubei Province of China (2013CFA109), Sinopec (S213049), and the Knowledge Innovation Program of the Chinese Academy of Sciences (Y35E05).
References
Ali, M. B., Yu, K. W., Hahn, E. J., and Paek, K. Y. (2005). Differential responses of anti-oxidants enzymes, lipoxygenase activity, ascorbate content and the production of saponins in tissue cultured root of mountain Panax ginseng C.A. Mayer and Panax quinquefolium L. in bioreactor subjected to methyl jasmonate stress. Plant Sci. 169, 83–92. doi: 10.1016/j.plantsci.2005.02.027
Amaro, H. M., Guedes, A. C., and Malcata, F. X. (2011). Advances and perspectives in using microalgae to produce biodiesel. Appl. Energy 88, 3402–3410. doi:10.1016/j.apenergy.2010.12.014
Apel, K., and Hirt, H. (2004). Reactive oxygen species: metabolism, oxidative stress, and signal transduction. Annu. Rev. Plant Biol. 55, 373–399. doi:10.1146/annurev.arplant.55.031903.141701
Beardall, J., Young, E., and Roberts, S. (2001). Approaches for determining phytoplankton nutrient limitation. Aquat. Sci. 63, 44–69. doi:10.1007/PL00001344
Bligh, E. G., and Dyer, W. J. (1959). A rapid method of total lipid extraction and purification. Can. J. Biochem. Physiol. 37, 911–917. doi:10.1139/o59-099
Conroy, J. P., Smillie, R. M., Kuppers, M., Bevege, D. I., and Barlow, E. W. (1986). Chlorophyll a fluorescence and photosynthetic and growth responses of Pinus radiata to phosphorus deficiency, drought stress, and high CO2. Plant Physiol. 81, 423–429. doi:10.1104/pp.81.2.423
Converti, A., Casazza, A. A., Ortiz, E. Y., Perego, P., and Del Borghi, M. (2009). Effect of temperature and nitrogen concentration on the growth and lipid content of Nannochloropsis oculata and Chlorella vulgaris for biodiesel production. J. Chem. Eng. Process. 48, 1146–1151. doi:10.1016/j.cep.2009.03.006
Cooksey, K. E., Guckert, J. B., Williams, S. A., and Callis, P. R. (1987). Fluorometric-determination of the neutral lipid-content of microalgal cells using nile red. J. Microbiol. Methods 6, 333–345. doi:10.1016/0167-7012(87)90019-4
Cooper, M. S., Hardin, W. R., Petersen, T. W., and Cattolico, R. A. (2010). Visualizing “green oil” in live algal cells. J. Biosci. Bioeng. 109, 198–201. doi:10.1016/j.jbiosc.2009.08.004
Dawes, E. (1976). “Endogenous metabolism and the survival of starved prokaryotes,” in The Survival of Vegetative Microbes, eds Gray T.R.G. and Postgate J.R. (Cambridge: Cambridge University Press), 19–53.
Elstner, E. F. (1991). “Mechanisms of oxygen activation in different compartments of plant cells,” in Active Oxygen/Oxidative Stress in Plant Metabolism, eds Pell E. J. and Steffen K. L. (Rockville, MD: American Society of Plant Physiologists), 13–25.
Genty, B., Briantais, J. M., and Baker, N. R. (1989). The relationship between the quantum yield of photosynthetic electron-transport and quenching of chlorophyll fluorescence. Biochim. Biophys. Acta 990, 87–92. doi:10.1016/S0304-4165(89)80016-9
Hill, J., Nelson, E., Tilman, D., Polasky, S., and Tiffany, D. (2006). Environmental, economic, and energetic costs and benefits of biodiesel and ethanol biofuels. Proc. Natl. Acad. Sci. U.S.A. 103, 11206–11210. doi:10.1073/pnas.0604600103
Hu, Q., Sommerfeld, M., Jarvis, E., Ghirardi, M., Posewitz, M., Seibert, M., et al. (2008). Microalgal triacylglycerols as feedstocks for biofuel production: perspectives and advances. Plant J. 54, 621–639. doi:10.1111/j.1365-313X.2008.03492.x
Hu, Q., Zhang, C., and Sommerfeld, M. (2006). Biodiesel from algae: lessons learned over the past 60 years and future perspectives. PSA Abstracts. J. Phycol. 42, 12–12. doi:10.1111/j.1529-8817.2006.20064201.x
Huangfu, J. Q., Liu, J., Sun, Z., Wang, M. F., Jiang, Y., Chen, Z. Y., et al. (2013). Antiaging effects of astaxanthin-rich alga Haematococcus pluvialis on fruit flies under oxidative stress. J. Agric. Food Chem. 61, 7800–7804. doi:10.1021/jf402224w
Illman, A. M., Scragg, A. H., and Shales, S. W. (2000). Increase in Chlorella strains calorific values when grown in low nitrogen medium. Enzyme Microb. Technol. 27, 631–635. doi:10.1016/S0141-0229(00)00266-0
Lee, C. W., Lim, J. H., and Heng, P. L. (2013). Investigating the spatial distribution of phototrophic picoplankton in a tropical estuary. Environ. Monit. Assess. 185, 9697–9704. doi:10.1007/s10661-013-3283-3
Lichtenthaler, H. K. (1987). “Chlorophylls and carotenoids: pigments of photosynthetic biomembranes,” in Methods in Enzymology, ed. Lester Packer R. D. (San Diego: Academic Press), 350–382.
Lu, C. M., Torzillo, G., and Vonshak, A. (1999). Kinetic response of photosystem II photochemistry in the cyanobacterium Spirulina platensis to high salinity is characterized by two distinct phases. Aust. J. Plant Physiol. 26, 283–292. doi:10.1071/PP98119
Maxwell, K., and Johnson, G. N. (2000). Chlorophyll fluorescence–a practical guide. J. Exp. Bot. 51, 659–668. doi:10.1093/jexbot/51.345.659
Oxborough, K. (2004). Imaging of chlorophyll a fluorescence: theoretical and practical aspects of an emerging technique for the monitoring of photosynthetic performance. J. Exp. Bot. 55, 1195–1205. doi:10.1093/Jxb/Erh145
Pan, Y. Y., Wang, S. T., Chuang, L. T., Chang, Y. W., and Chen, C. N. (2011). Isolation of thermo-tolerant and high lipid content green microalgae: oil accumulation is predominantly controlled by photosystem efficiency during stress treatments in Desmodesmus. Bioresour. Technol. 102, 10510–10517. doi:10.1016/j.biortech.2011.08.091
Petkov, G., and Garcia, G. (2007). Which are fatty acids of the green alga Chlorella? Biochem. Syst. Ecol. 35, 281–285. doi:10.1016/j.bse.2006.10.017
Reiser, S., and Somerville, C. (1997). Isolation of mutants of Acinetobacter calcoaceticus deficient in wax ester synthesis and complementation of one mutation with a gene encoding a fatty acyl coenzyme a reductase. J. Bacteriol. 179, 2969–2975.
Santos, C. A., Ferreira, M. E., da Silva, T. L., Gouveia, L., Novais, J. M., and Reis, A. (2011). A symbiotic gas exchange between bioreactors enhances microalgal biomass and lipid productivities: taking advantage of complementary nutritional modes. J. Ind. Microbiol. Biotechnol. 38, 909–917. doi:10.1007/s10295-010-0860-0
Schreiber, U. (1978). Chlorophyll fluorescence assay for ozone injury in intact plants. Plant Physiol. 61, 80–84. doi:10.1104/pp.61.1.80
Scott, S. A., Davey, M. P., Dennis, J. S., Horst, I., Howe, C. J., Lea-Smith, D. J., et al. (2010). Biodiesel from algae: challenges and prospects. Curr. Opin. Biotechnol. 21, 277–286. doi:10.1016/j.copbio.2010.03.005
Shi, S., Tang, D., and Liu, Y. (2009). Effects of an algicidal bacterium Pseudomonas mendocina on the growth and antioxidant system of Aphanizomenon flos-aquae. Curr. Microbiol. 59, 107–112. doi:10.1007/s00284-009-9404-0
Tran, T. H., Govin, A., Guyonnet, R., Grosseau, P., Lors, C., Damidot, D., et al. (2014). Influence of the intrinsic characteristics of mortars on their biofouling by pigmented organisms: comparison between laboratory and field-scale experiments. Int. Biodeterior. Biodegradation 86, 334–342. doi:10.1016/j.ibiod.2013.10.005
White, S., Anandraj, A., and Bux, F. (2011). PAM fluorometry as a tool to assess microalgal nutrient stress and monitor cellular neutral lipids. Bioresour. Technol. 102, 1675–1682. doi:10.1016/j.biortech.2010.09.097
Widjaja, A., Chien, C.-C., and Ju, Y.-H. (2009). Study of increasing lipid production from fresh water microalgae Chlorella vulgaris. J. Taiwan Inst. Chem. Eng. 40, 13–20. doi:10.1016/j.jtice.2008.07.007
Zhang, X., Chen, H., Chen, W., Qiao, Y., He, C., and Wang, Q. (2014a). Evaluation of an oil-producing green alga Chlorella sp. C2 for biological DeNOx of industrial flue gases. Environ. Sci. Technol. 48, 10497–10504. doi:10.1021/es5013824
Zhang, X., Rong, J., Chen, H., He, C., and Wang, Q. (2014b). Current status and outlook in the application of microalgae in biodiesel production and environmental protection. Front. Energy Res. 2:32. doi:10.3389/fenrg.2014.00032
Zhang, Y. M., Chen, H., He, C. L., and Wang, Q. (2013). Nitrogen starvation induced oxidative stress in an oil-producing green alga Chlorella sorokiniana C3. PLoS ONE 8:e69225. doi:10.1371/journal.pone.0069225
Keywords: chlorophyll fluorescence, harvest time, oil-producing microalgae, neutral lipid, photosynthesis
Citation: Qiao Y, Rong J, Chen H, He C and Wang Q (2015) Non-invasive rapid harvest time determination of oil-producing microalgae cultivations for biodiesel production by using chlorophyll fluorescence. Front. Energy Res. 3:44. doi: 10.3389/fenrg.2015.00044
Received: 28 July 2015; Accepted: 18 September 2015;
Published: 05 October 2015
Edited by:
P. C. Abhilash, Banaras Hindu University, IndiaReviewed by:
Jason Ryan Hattrick-Simpers, University of South Carolina, USAShanmugaprakash Muthusamy, Kumaraguru College of Technology, India
Copyright: © 2015 Qiao, Rong, Chen, He and Wang. This is an open-access article distributed under the terms of the Creative Commons Attribution License (CC BY). The use, distribution or reproduction in other forums is permitted, provided the original author(s) or licensor are credited and that the original publication in this journal is cited, in accordance with accepted academic practice. No use, distribution or reproduction is permitted which does not comply with these terms.
*Correspondence: Qiang Wang, Key Laboratory of Algal Biology, Institute of Hydrobiology, Chinese Academy of Sciences, 7 South Donghu Road, Hubei Province, Wuhan 430072, China,d2FuZ3FpYW5nQGloYi5hYy5jbg==