 Sebastian Teir
 Toni Auvinen2
 Heljä Peltola
- 1VTT Technical Research Centre of Finland Ltd., Espoo, Finland
- 2Outotec Dewatering Technology Center, Lappeenranta, Finland
- 3Department of Energy Technology, School of Engineering, Aalto University, Espoo, Finland
- 4Outotec Research Center, Pori, Finland
In this work, experiments were performed to determine the filterability of calcium carbonate produced with an alternative calcium carbonate production concept. The concept uses steelmaking slag as raw material and has potential to fix CO2 emissions and utilize steelmaking slag, simultaneously. As calcium carbonate is precipitated in a solution containing ammonium chloride, calcium chloride, and ammonia, the product needs to be washed and hence filtered. In this work, different separation processes, including washing, filtering, and drying, were tested on two calcium carbonate slurries produced from steel converter slag and CO2 by a laboratory-scale pilot facility, with the aim of obtaining a solid product with a low chloride content using a minimum amount of washing water. The order of maximum filtration rates achievable of the calcium carbonate slurries was determined by experimental work. The tests included pressure filtration and vacuum filtration and the test series contained altogether 21 different filtration cycles with varying combinations of filtering, washing, and drying steps. The filtered cakes were analyzed by their residual moisture content, chloride content, and conductivity, and the filtrates by their residual solids content, chloride content, and conductivity. Pressure filtration gave a high capacity (400–460 kg/m2h) and a low cake residual moisture content (12–14 wt-%). Vacuum filtration gave slightly higher filtration rates (500–610 kg/m2h at the lowest residual chloride contents of the cakes), but the cake residual moisture also stayed higher (25–26 wt-%). As the vacuum filtration tests used a filter cloth with higher permeability than that of the pressure filtration tests, a slightly higher filtration rate was expected. However, both filtration technologies seem suitable for filtering and washing calcium carbonate prepared with the studied method as a residual chloride content as low as 10 ppm of the filtered solids can be achieved with quite a small amount of washing water and the filtration rate is fast.
Introduction
Calcium carbonate is the most commonly used filler material in paper making (Naydowski et al., 2001). Ground calcium carbonate (GCC) is manufactured by grinding high quality limestone to very small sizes and is mostly used as a pigment, included as an externally applied coating in coated papers. Therefore, GCC has a broad distribution of shapes and sizes, which reduces their optical performance (Clark, 1992). Precipitated calcium carbonate (PCC) is also used in papermaking as a coating and filler material. In conventional production of synthetic (i.e., precipitated) calcium carbonate, flue gas containing CO2 is bubbled though a hydrated lime slurry (calcium hydroxide), from which calcium carbonate precipitates. By adjusting the precipitation process parameters, the shape and size of the crystals produced can be controlled to optimize their optical properties for use in paper making. PCC is normally also brighter than GCC, since organic impurities and some metal oxides can be separated during the PCC production process (Naydowski et al., 2001). The production of PCC binds CO2 as carbonate, but CO2 is also emitted when limestone is calcined for providing lime for the process. PCC production requires also relatively pure limestone. To minimize transportation costs, the limestone is calcined before transportation to the PCC production facility, which is normally located at the paper mill site.
An alternative production concept for calcium carbonate production is being developed that omits the need for fresh limestone and its calcination (Eloneva et al., 2009). This concept has the potential to reduce CO2 emissions and simultaneously utilize steelmaking slag. In this process, calcium is selectively extracted from steelmaking slag using ammonium salt solutions in the extraction step:
Calcium carbonate is subsequently precipitated in the carbonator by bubbling CO2-containing flue gas through the solution:
The calcium carbonate is separated by filtration, and the solvent is returned to the extractor, as the ammonium salt is regenerated in the carbonator (Figure 1). Both the calcium carbonate and the unreacted part of the slag from the extractor (slag residue) are washed in order to remove solvent remnants (mainly ammonium salt). Laboratory experiments have shown that calcium carbonate purity up to 99.8 wt-% can be achieved (Eloneva et al., 2009). Similarly, the particle shape can be adjusted – both rhombohedral and scalenohedral calcite can be produced, as well as aragonite. A pilot facility of the concept was recently completed at Aalto University, enabling production of 5–10 kg batches of calcium carbonate (Said and Järvinen, 2015). Although the particles that have been produced with the pilot so far are coarser than those required for paper applications (typically P50 <~1–2 μm for filling applications), the calcium carbonate could be subsequently ground and possibly be an alternative to GCC in coating applications (Teir et al., 2015). As grinding is expected to result in a broad particle size distribution, the calcium carbonate is not necessarily suitable as an alternative to PCC in filler applications, where a narrow particle size distribution is needed.
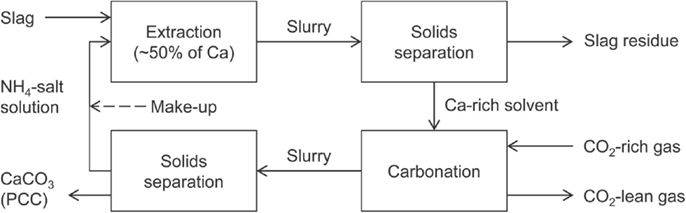
Figure 1. The studied concept for producing calcium carbonate from CO2-rich gas and slag.
One challenge of the concept presented in Figure 1 is that the produced calcium carbonate is precipitated in a solution of ammonia and ammonium chloride, which raises concern that chloride may be embedded in the product and hinders its commercial use. However, the maximum chloride content that can be allowed in a PCC product is not clear as there does not seem to be any standard or guideline available for this. For comparison, commercial PCC is also produced as a by-product of ammonia production in the Solvay process (Ciullo, 1996). As the calcium carbonate is produced in presence of sodium chloride, the Solvay PCC product contains 0.10% NaCl (Table 1), which has contributed to the Solvay PCC process being less used than the conventional carbonation process (Mattila and Zevenhoven, 2014a). Also ESAPA (2004) reports difficulties with commercializing calcium carbonate containing chloride impurities. According to ESAPA, attempts were made to recover CaCO3 produced as a by-product from brine purification for a Solvay process, but the chloride content in the effluent to be treated and impurities remaining after treatment were found to be problematic. Due to these impurities, the product could not compete with more pure products available on the market. In the conventional PCC production process, PCC is precipitated in water and requires no further purification.
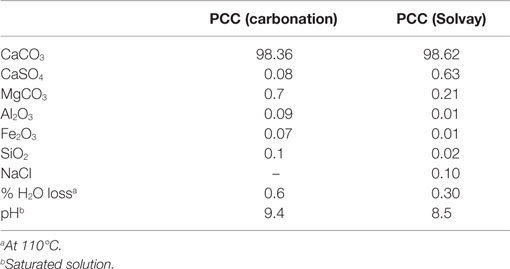
Table 1. Chemical composition of PCC products by process (unit: %, Statton, 2012).
Although no detailed product quality assessment has yet been performed on the calcium carbonate produced by the studied concept, the analyses performed so far indicate that the chloride can be removed by washing and does not end up in the product (Mattila et al., 2012). According to the best knowledge of the authors, the only published data on filtration and washing performance is that of Hudd (2014), who performed washing experiments of PCC (commercial rhombohedral calcite) and ammonia chloride mixtures using both a vacuum filter and pressure filter. Hudd studied a staged filtration, with both countercurrent and crosscurrent flow of washing water, so the experimental parameters for each filtration stage were kept constant. Hudd assumed that the filtered cake needs to be separated from the filter cloth and mixed with washing water after which the mixture is filtered again, and the procedure is repeated using either fresh or recycled washing water a few times. Although a low chloride content in the calcium carbonate can be achieved with this method, it requires a relatively large amount of washing water.
The objective of the work presented here was to select suitable filtration technologies and determine the maximum filtration rates achievable for the calcium carbonate slurries produced with the new concept. The focus was on minimizing the amount of residual chloride (i.e., solvent remnants of the ammonium chloride solution) on the carbonate product by varying the parameters for filtration and washing while keeping the filtration rate high. In order to minimize the use of washing water, a different washing approach than that used by Hudd was tested: washing water was added directly on top of the filtered cake, after which the water was pressed through the cake. The concentration of possible metals leached from steel slag was not studied here as this can be minimized by managing process parameters (Mattila and Zevenhoven, 2014b). The tests included pressure filtration and vacuum filtration, and the test series contained altogether 21 different filtration cycles with varying combinations of filtering, washing, and drying steps. The filtered cakes were analyzed by their residual moisture content, chloride content, and conductivity, and the filtrates by their residual solids content, chloride content, and conductivity.
Materials and Methods
Production of Calcium Carbonate for Filtration Tests
The steelmaking slag used in the experiments was steel converter slag from Raahe steel plant in Finland. The steel converter slag had been ground to a particle size <250 μm. The chemical composition of the slag was analyzed by X-ray fluorescence (XRF) spectroscopy (Table 2).

Table 2. Summary of the XRF analysis of steel converter slag (only compounds found in amounts ≥0.1 wt-% listed).
The pilot facility at Aalto University was used for preparing two batches of calcium carbonate slurry for subsequent filtration tests. The pilot facility consists of three reactors of 200 l volume each, connected to two stages of filtration (a full description of the test facility can be found in Said and Järvinen, 2015). So far, both rhombohedral calcite and aragonite has been successfully produced with the pilot plant (Said and Järvinen, 2015). Therefore, one batch of each calcium carbonate type was produced. The parameters are summarized in Table 3 and the procedure was as follows: first, a batch of 17 kg of steel slag was mixed with 170 l, 1M NH4Cl (aq) solvent to selectively dissolve calcium from the slag at room temperature (~20°C). The mixture was agitated for 1 h at 200 rpm, after which the Ca-rich solution was separated from the residual slag through 1-μm filter bags. To maximize the removal of solid particles, the filtrate was further pumped through a series of filters consisting of two 1-μm filters and one 0.45-μm filter. After filtration, 150 l of the Ca-rich solution was pumped to a carbonation reactor, where it was heated up to the desired temperature. After reaching the targeted temperature, pure CO2 gas was bubbled through the solution, forming a slurry containing calcium carbonate precipitate. After carbonation, the slurry from the reactor was preliminarily filtered using an identical filtration system as described above for separating the PCC from the liquid. Both slurries were produced with identical parameters except for the carbonation reactor temperature, which was set to 20°C for precipitating rhombohedral calcite and 55°C for producing aragonite (Table 3). After preliminary filtration, the moist calcium carbonate solids and 100 l additional filtrate were transported in separate containers to Outotec Dewatering Technology Center for further filtration tests. The particle size distributions of the produced calcium carbonates were measured using a laser diffraction particle size analyzer.
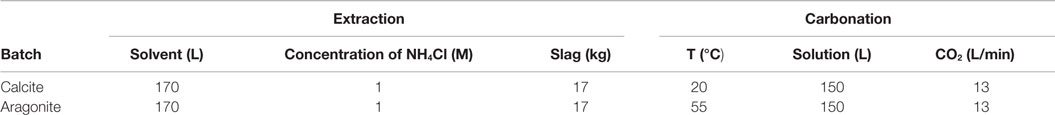
Table 3. Summary of calcium carbonate batch production parameters.
Test Methods for Filtration and Washing
When choosing a process suitable for solid–liquid separation of calcium carbonate, for this concept, the requirements for efficient washing must be taken into consideration. In addition, the liquid content of the product should also be as low as possible to maximize the recovery of ammonium chloride and minimize the need for make-up. Solid–liquid separation processes considered in this work were processes that allow large-scale (~100,000 tpa) separation of calcium carbonate at the lowest possible cost considering the requirements: efficient filtration for particle sizes <100 μm, minimum amount of liquid in product, and efficient washing of the product. A comparative performance of the main types of commercial solid–liquid separation processes (Table 4) is given by Couper et al. (2010). Sedimentation, centrifugation, liquid cyclones, screens, and ultrafiltration have both poor wash possibilities and poor removal of liquid from the solid product. In contrast, vacuum drum filters, horizontal pressure filters, and basket centrifuges are good at removing liquids from the solid product and have excellent wash possibilities. For the experimental work, vacuum filtration and pressure filtration were selected, since both are well suited for large quantities of solids. However, as the pilot facility at Aalto was only able to produce about 5 kg PCC per day (one batch), only small, laboratory-size equipment was used for the test series (0.5–2.7 l of slurry filtered per test). The pressure filtration and vacuum filtration were separately optimized for minimizing the chloride content, while keeping the filtration rate as high as possible. In order to minimize the use of washing water, a different washing approach than Hudd (2014) was tested: washing water was added directly on top of the filtered cake, after which the water was pressed through the cake.
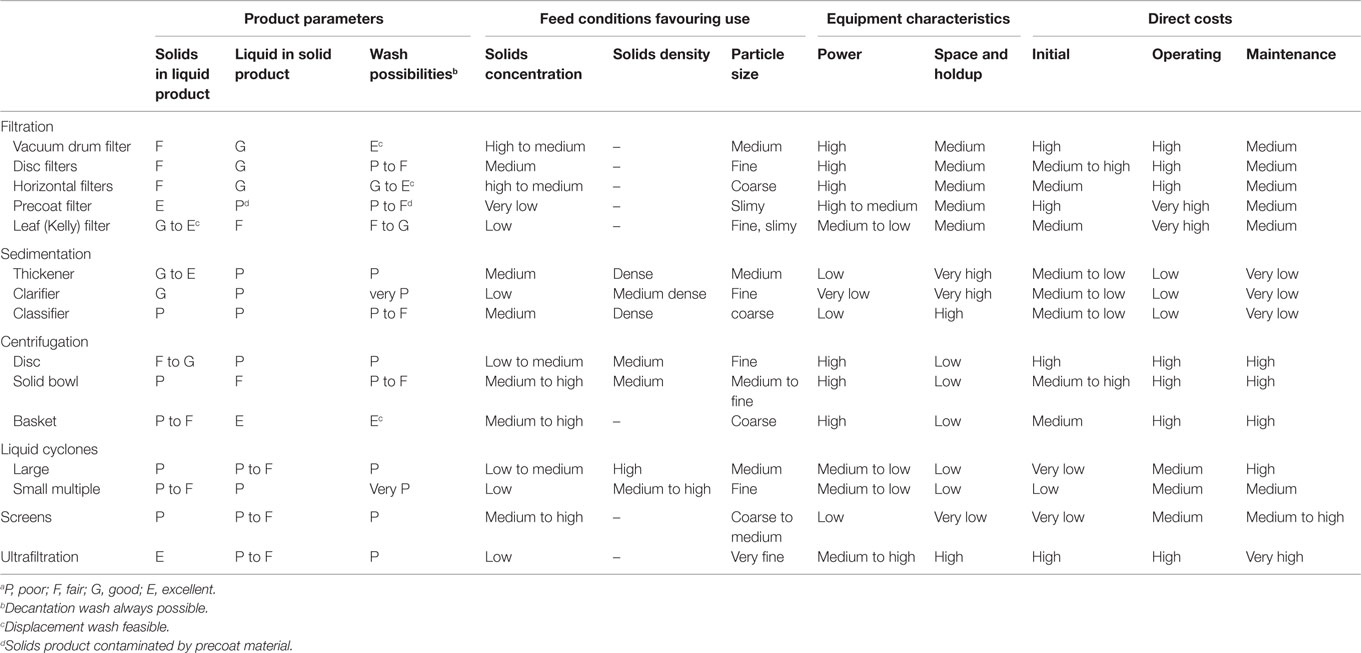
Table 4. Comparative performance of solid–liquid separation equipmenta (Couper et al., 2010).
Pressure Filtration Tests
The pressure filtration test cycle is schematically presented in Figure 2. In pressure filtration, the slurry is fed into a filter chamber by pumping. Part of the filtrate passes through a filter cloth and exits beneath the chamber. Pressure is produced by pumping water or air over a diaphragm that expands and presses the slurry, removing more liquid out of the slurry. This is also referred to as the first pressing. After the first pressing, solids can be washed if needed. In washing of the solids, the washing liquid is fed into the empty space above the cake that has been formed inside the chamber as a result from the first pressing. Then the washing liquid is pressed through the cake (the second pressing). After the cake has been pressed, it is air dried with pressurized air, after which the cake is mechanically removed from the filter cloth (“solids discharge” in Figure 2). The cake, i.e., filtered solids, is then ready for further processing. For the experiments, an Outotec Labox 100 test unit was used with an AINO K11 filter cloth having the filtration area of 0.01 m2. The filter cloth has a permeability of 0.08 m3/m2 min (air permeability measured at 200 Pa). While industrial-scale filter units normally consist of several filter chambers run in parallel, the test unit had only one chamber (Figure 3). Parameters that were varied were chamber depth, temperature, wash liquid (water) volume, pressure, and the quantity of slurry used (Table 5). Air was employed as pressing media. The produced cake was further analyzed with various analytical methods (see Analysis Methods).
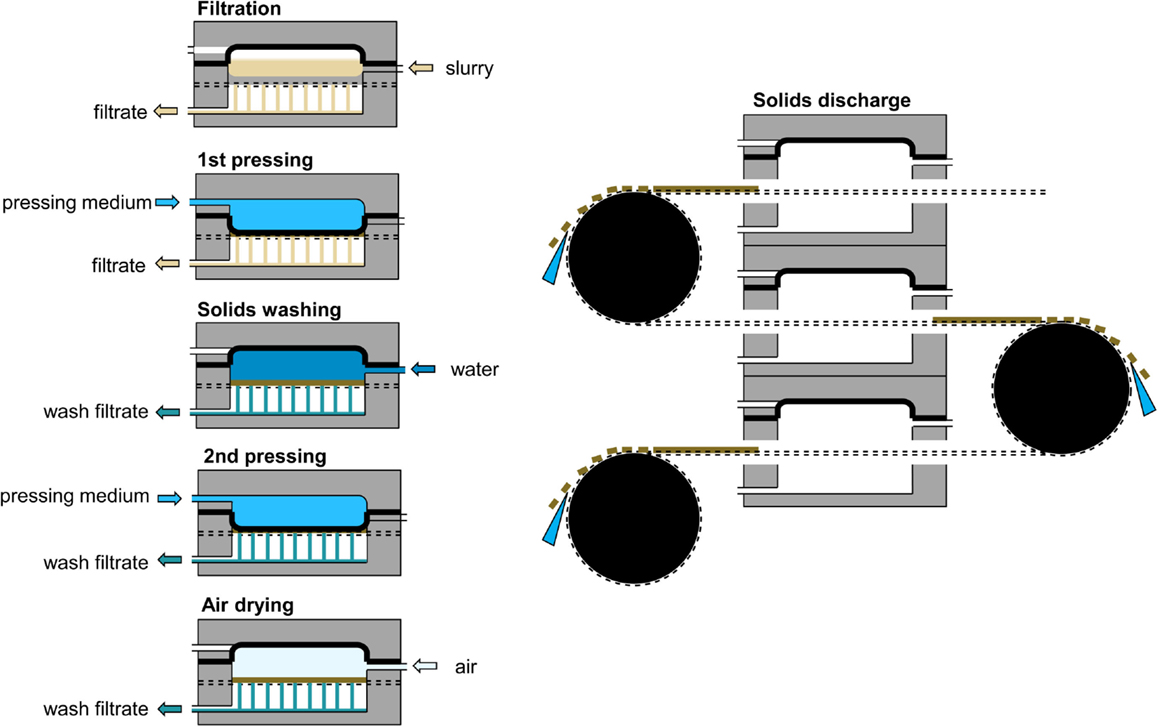
Figure 2. Pressure filtration test cycle.
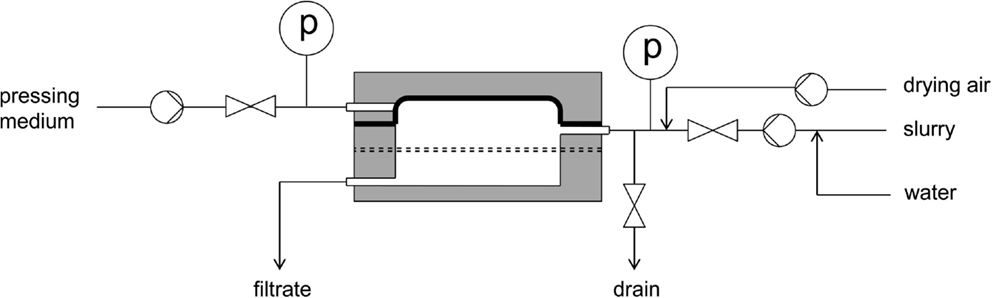
Figure 3. Test unit setup for pressure filtration.
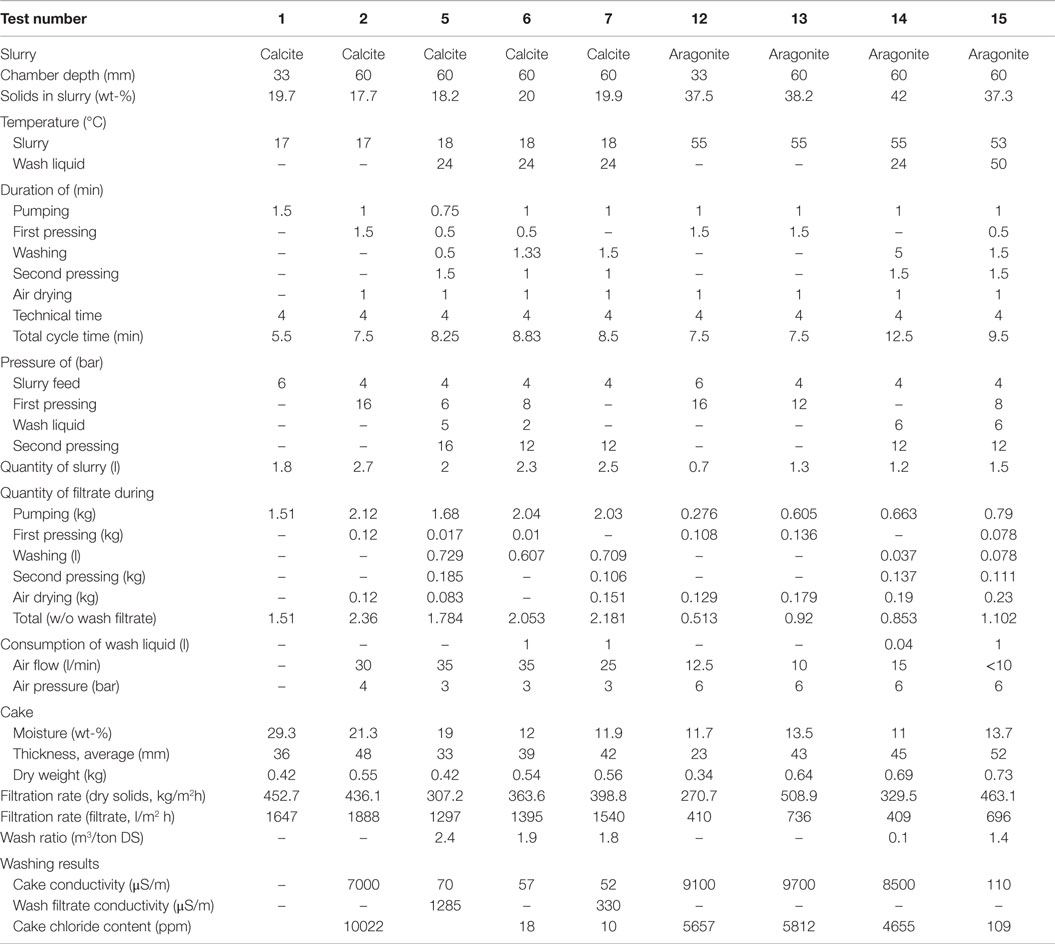
Table 5. Parameters used in the pressure filtration tests.
Vacuum Filtration
In vacuum filtration, liquid is drawn out from the slurry through a filter cloth by forming a vacuum on the opposite side of the filter cloth. The slurry sample is poured into a cylinder on top of the filter cloth, and then vacuum is applied to the slurry underneath it. The solid is trapped by the filter, and the liquid is drawn by the vacuum through the filter into the flask below. The time period that there is excess water on the cake is called the filtration time. When the excess water has been sucked out of the cake, the vacuum is turned off, the mother liquid is collected, and then the cake can be washed. Washing is done by turning the vacuum back on and by pouring the washing liquid on the cake carefully to ensure its equal distribution on the cake. When there is no more washing liquid on the cake surface, the cake drying begins. Washing can be performed in multiple stages and also in a co-current or a counter current mode. In the experiments, an Outotec Larox® Büchner (BVB) test unit was used with a filtration area of 0.01 m2. An ARTO S11 filter cloth, which is the tightest filter cloth available for the test equipment, was used. The filter cloth has a permeability of 0.3 m3/m2 min (air permeability at 200 Pa). During filtration, the vacuum was kept at 0.5 bar for all experiments. The Büchner test unit setup is illustrated in Figure 4. Parameters that were varied were slurry volume, temperature, and wash liquid (water) volume (Table 6).
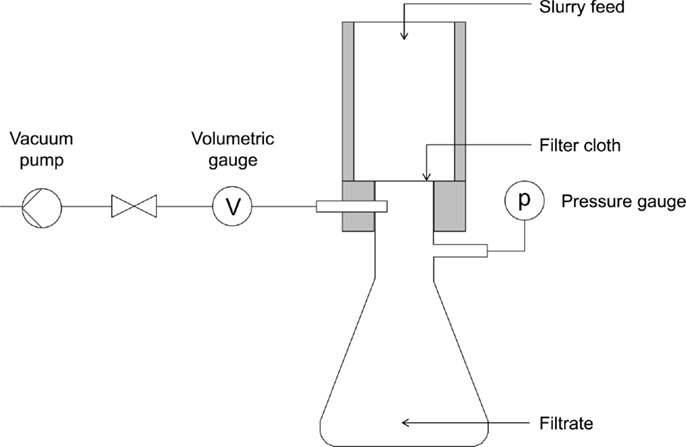
Figure 4. Test unit setup for vacuum filtration.
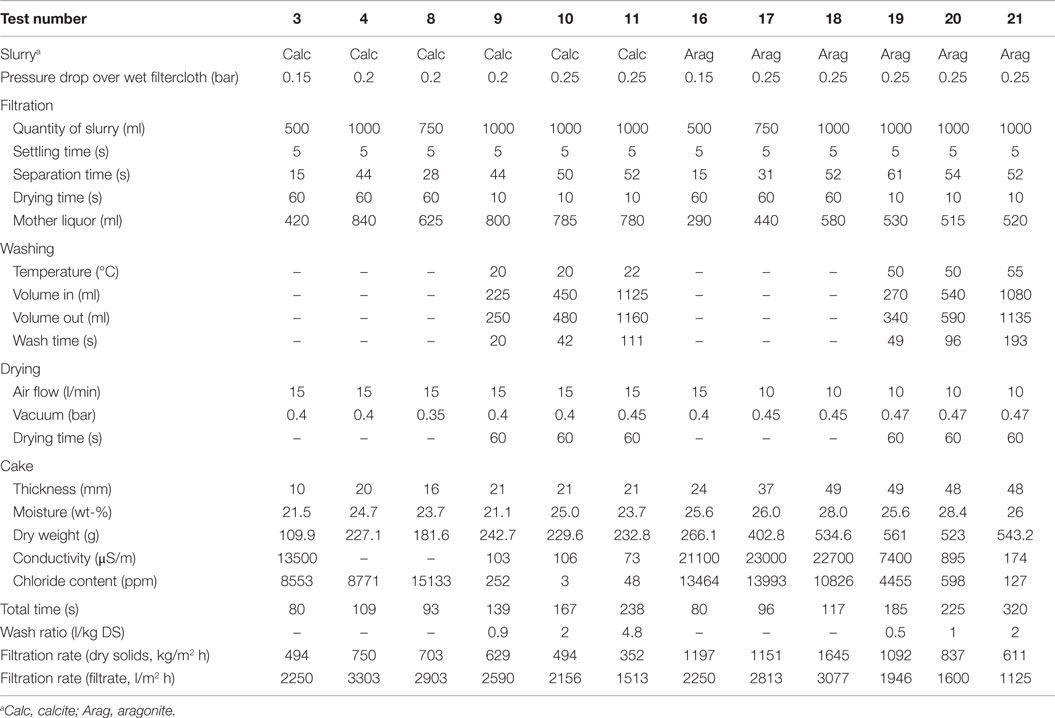
Table 6. Parameters used in the vacuum filtration tests.
Analysis Methods
The moisture contents of the filtered cakes were analyzed from ~50 g of filtered samples (wet samples), which were dried in a laboratory oven at 60°C in air. The drying time was 38 h 15 min. The moisture contents were calculated from the mass losses of the samples. The filtrate solids contents were measured by pouring 100 ml of filtrate through a filter paper. The paper with solids on was then dried in the oven overnight at 105°C and weighed.
The chloride contents were determined as follows. A pre-weighed sample (~10 g) of the dry cake was mixed with 100 ml ion exchanged water. The suspension was stirred vigorously with a magnetic stirrer for 60 min. The suspension was filtered and the chloride content of the clear solution was analyzed by an ion chromatograph (IC). In the case of the lowest chloride contents, potentiometric titration with AgNO3 was used instead of ion chromatography. In these analyses, increased sample weights (~25 g) were also used. The chloride contents corresponding to both wet cake and dry cake were calculated from the analyzed chloride content of the solution. The assumption for measuring the chloride contents by this manner was that all the chlorides in the filtered cake are water soluble. It was also assumed that the chlorides were situated on the particle surfaces, and not locked inside the particles, so they were able to dissolve into water during stirring of the suspension. Two stirring times (30 and 60 min) were tested before starting the analysis series, and they were found to give almost identical results. For the analysis series, the longer stirring time (60 min) was adopted.
As the chloride analyses were performed at another location, Outotec Research Center, at the end of the filtration test series, conductivities of the filtrates were measured online for getting instant indications of the washing results during the tests. The conductivities were measured with a HANNA instruments conductivity meter. The cake conductivity was measured after mixing dry cake in the ratio of 1:1 with distilled water.
Solid samples of the washed and dried cakes from the pressure filtration tests were analyzed using a scanning electron microscope (SEM) equipped with energy-dispersive x-ray spectroscopy (EDS), as well as with X-ray diffraction (XRD).
Results
The moist carbonate samples and the filtrate were transported by road from the Aalto pilot plant to the Outotec premises for the filtration tests. The results from the particle size analysis of the produced calcium carbonate showed a wide size distribution of particles, with P50 <41 μm and P80 <84 μm for the calcite batch (Figure 5) and P50 <27 μm and P80 <50 μm for the aragonite batch (Figure 6). These samples had already been pre-filtered at Aalto, so the solid contents needed to be altered to simulate the solid contents of the slurry at a full-scale facility before filtration. It is very likely that a thickener would be used for raising the solid contents of the slurry prior to filtration to about 20–40 wt-%. However, the performance of a thickener was not included in these tests, so different solid concentrations were chosen for the two slurries. Some of the liquid had leaked from the calcite containers, resulting in a solids content of 60 wt-% for the calcite slurry. The calcite sample was therefore diluted to the solids content of 25 wt-% for the filtration experiments with its own NH4Cl filtrate that was delivered with the samples. The moisture content of the aragonite batch was at 40 wt-% solids, so this batch was used without dilution. The pressure filtration tests were performed with the filter cloth AINO K11 while the vacuum filtration tests were performed with the filter cloth ARTO S11 (the tightest filter cloth for Büchner at the moment) and a vacuum of 0.5 bar. Both filter cloths produced a very clear filtrate for both the calcite and the aragonite slurry. AINO K11 gave filtrates with <10 mg/l solids, while ARTO S11 gave filtrates with ~10–15 mg/l solids. No cake cracking was observed in any of the vacuum filtration tests.
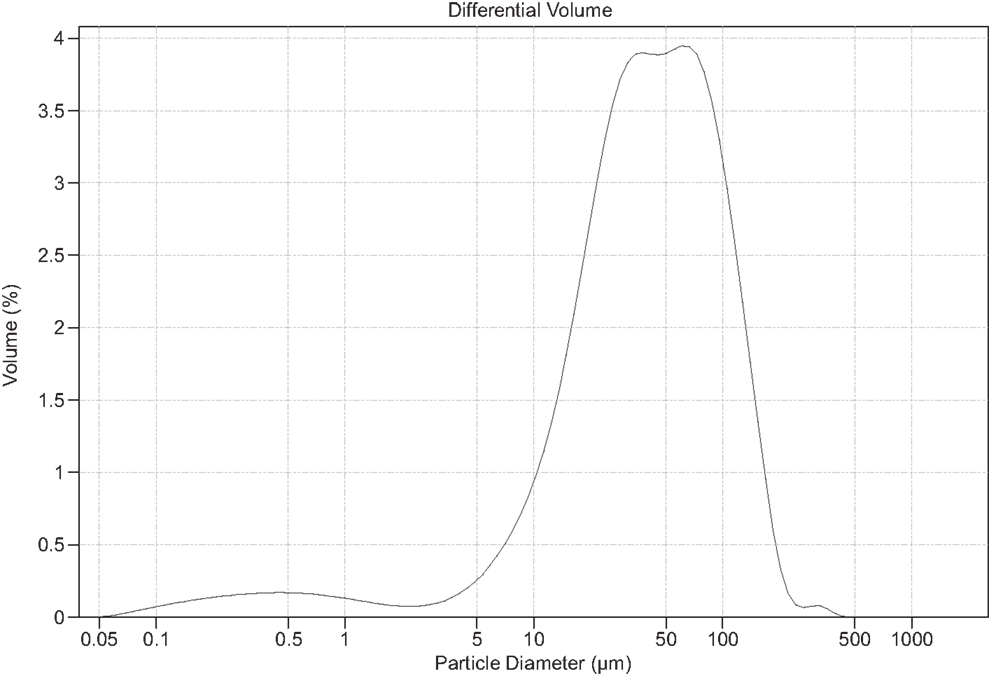
Figure 5. Particle size distribution of the solids in the calcite slurry.
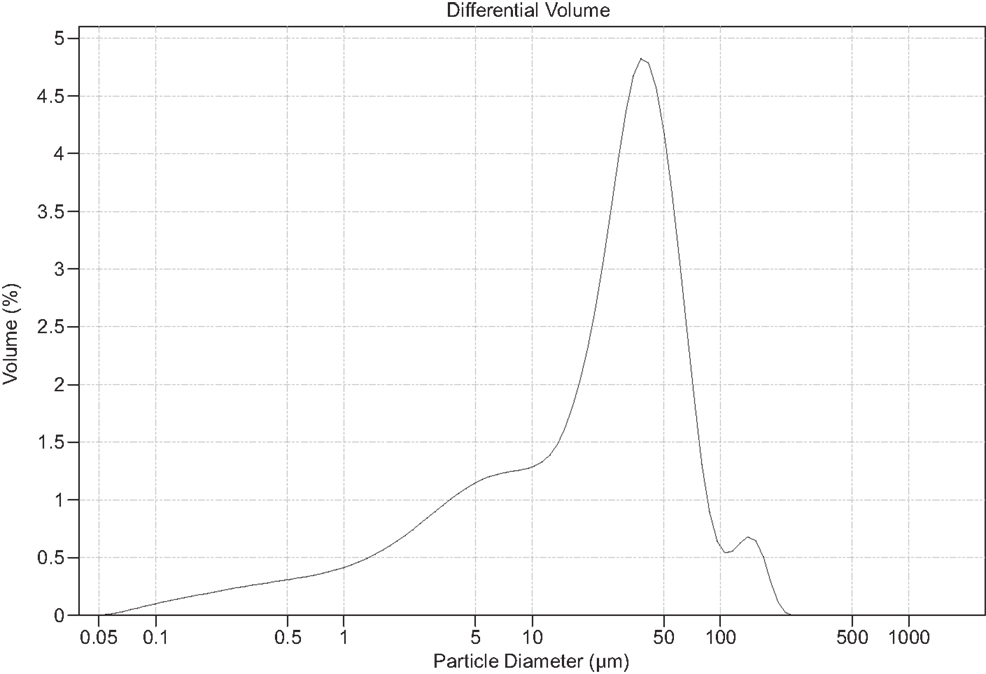
Figure 6. Particle size distribution of the solids in the aragonite slurry.
Pressure Filtration
A detailed listing of the parameters used in each pressure filtration experiment is given in Table 5.
Tests with Calcite Slurry
The first tests were performed using the calcite slurry. The initial test run with a 33-mm chamber showed that the slurry filtered very easily (test number 1, Table 5). The chamber was full after ~40 s of pumping, and the cake solids content was above 70 wt-% even without pressing and drying. Pressing or drying was not performed due to a leakage of pressing air in the test unit caused by a mishap in the unit assembly.
As the slurry was found to be easily filtered, test number 2 was performed with a 60-mm filter chamber and the pumping pressure was reduced to 4 bar. Pressing was then performed with 16-bar pressure, followed by 1 min air drying with 4-bar pressure, which resulted in a cake conductivity of 7000 μS/m indicating a high salt concentration (the analyses carried out later verified a high cake chloride content of 10022 ppm) and that subsequent washing is needed.
Test runs number 5–7 were performed with solids washing using various pressures and pressure schemes: test number 6 was performed with a higher pressure in the first pressing (8 vs. 5 bar in test number 5) and a lower washing liquid pressure (2 vs. 5 bar in test number 5). Test run number 7 was performed without the first pressing, and the wash liquid was introduced right after the slurry feed. Washing filtrate samples were taken at the beginning of washing, after 45 s of washing and during pressing. The conductivity measurements of these samples are shown in Figure 7. Test number 7 produced the highest filtration rate with washing: 399 kg/m2h. The cake produced with this test had the lowest chloride content (10 ppm) and a low moisture content (12 wt-%).
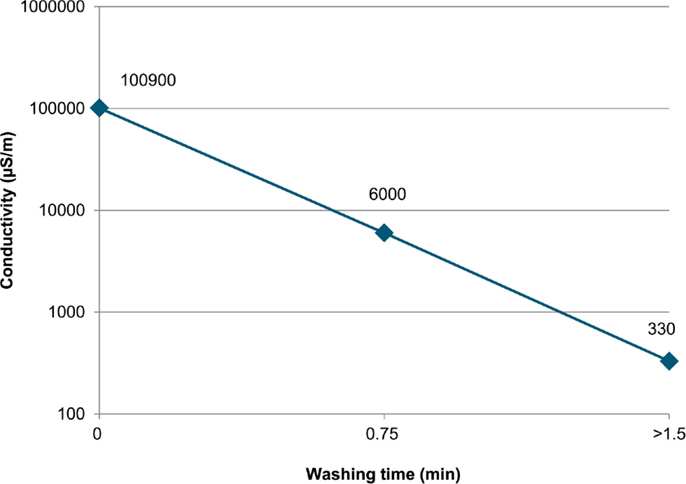
Figure 7. Wash filtrate conductivity during solids washing in Test run #7 (>1.5 min means that this sample was taken during pressing, after a washing time of 1.5 min).
Tests with Aragonite Slurry
The first test run with aragonite (test number 12, Table 5) showed that the aragonite slurry was about as easy to filter as the calcite slurry. Further tests were therefore performed using the higher 60-mm chamber instead of the 33-mm chamber used in test number 12. Pressures were also lowered in the slurry feed to 4 bar (6 bar in test number 12) and in the last pressing to 12 bar (16 bar in test number 12). Test run number 13 was also performed without solids washing while the filtration cycle was the same as in test number 12. Test number 12 resulted in a cake conductivity of 9100 μS/m (which corresponded to a cake chloride content of 5700 ppm), which indicated that subsequent washing is needed.
Test runs number 14 and 15 were performed with solids washing using room temperature water (Table 5). Washing was performed right after the slurry feed, without the first pressing. It was observed that the washing liquid could not penetrate the cake. After 5 min of washing, only ~40 ml of washing liquid had been introduced to the cake although a relatively high pressure of 6 bar had been used. Test run number 15 was performed with solids washing after the first pressing. The temperature of the wash liquid was also raised to ~50°C, in order to simulate real process conditions (aragonite is produced at a temperature of 50°C or more). A slurry feed of 1 min was followed by 0.5 min first pressing with 8-bar pressure. Then washing liquid was introduced to the cake with 6-bar pressure. After 1.5 min, 1 l of wash liquid had been introduced to the cake, and the cake conductivity was measured to be 110 μS after washing. Test run number 15 gave a filtration rate of 463 kg/m2h with the final chloride content of 109 ppm and moisture content of 14 wt-% in the cake.
Vacuum Filtration
A detailed listing of the parameters used in each pressure filtration experiment is given in Table 6.
Tests with Calcite Slurry
Büchner vacuum filtration tests were included as it was observed in the first pressure filter tests that the calcite slurry was very easy to filter. Test runs number 3, 4, and 8 were performed without solids washing and varying the slurry sample volume with 500–1000 ml for finding the volume giving the maximal filtration rate (Table 6). Larger slurry samples gave higher rates, and therefore 1000 ml was selected for subsequent washing tests.
The optimal wash ratio was tested by varying the washing liquid volume in test run numbers 9, 10, and 11 [0.9, 2.0, and 4.8 l/kg DS (dry solids), respectively]. The filtration cycle was otherwise equal in all three runs: after filtration there was 10 s intermediate drying, followed by solids washing and 60 s final drying (Table 6). The washing liquid temperature was ~20°C in all tests. The cake conductivity dropped from the original 13,500 μS/m without washing to ~100 μS/m with 1 l/kg DS wash ratio. Higher wash ratios did not affect the cake conductivity much (Figure 8). The chloride analyses varied somewhat, giving the lowest chloride content in the cake with the wash ratio of 2.0 l/kg DS. The filtration rate dropped from 629 kg/m2h for 0.9 l/kg DS wash ratio to 352 kg/m2h for 4.8 l/kg DS (Figure 9). The moisture contents in the cakes were 21–25 wt-%.
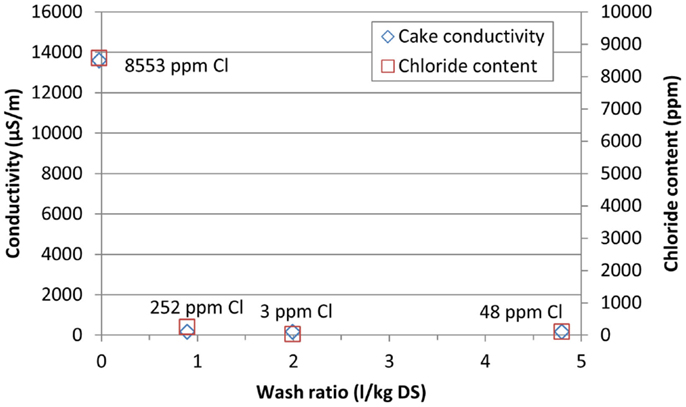
Figure 8. Conductivity and final chloride content of the calcite cake with vacuum filtration using different wash ratios.
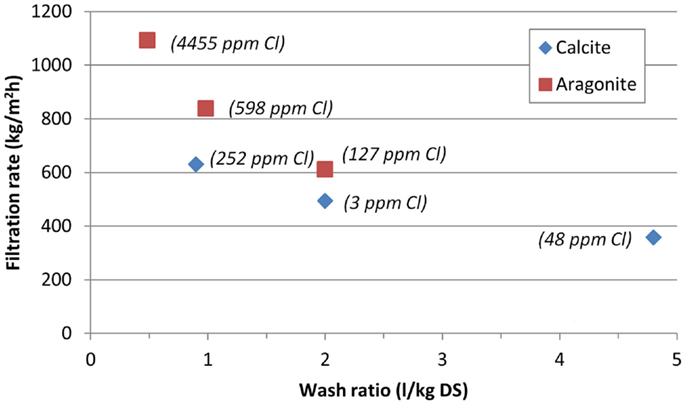
Figure 9. Filtration rate of the washing tests of calcium carbonate cakes with vacuum filtration. The final chloride content of the cakes added as text next to the corresponding samples.
Tests with Aragonite Slurry
Test runs number 16–21 were performed using the aragonite slurry preheated to a temperature of ~55°C (Table 6). The slurry sample volume was varied in test runs number 16–18 without solids washing between 500 and 1000 ml, respectively, in order to find the volume giving the maximal filtration rate. Again, larger slurry samples gave higher rates, so 1000 ml was selected for the subsequent washing tests.
Different solids washing ratios were tested in test run numbers 19, 20, and 21 (0.5, 1.0, and 2.0 l/kg DS, respectively) with a washing water temperature of ~50°C (Table 6). Before solids washing, the separation phase was followed by 10 s intermediate drying. After washing, 60 s of drying was performed. Figure 10 shows how the cake conductivity and chloride content dropped with higher wash ratios, with the lowest content of 127 ppm Cl for the 2 l/kg DS wash ratio. The filtration rate dropped from 1092 kg/m2h for 0.5 l/kg DS wash ratio to 611 kg/m2h for 2.0 l/kg DS (Figure 9). The moisture contents in the cakes were 26–28 wt-%. Since the aragonite slurry required much more washing time than calcite slurry, a washing ratio of 5 l/kg was not tested as it would have significantly increased the washing time thus lowering the filtration rate.
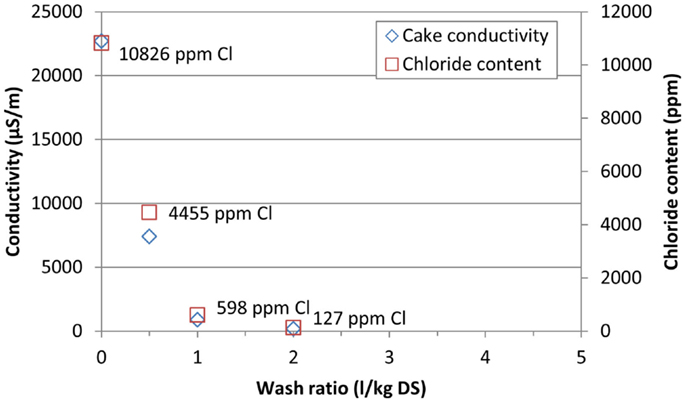
Figure 10. Conductivity and final chloride content of the aragonite cake with vacuum filtration using different wash ratios.
Mineralogy and Morphology of the Filtered and Washed Cakes
The SEM image of solids from the filtered, washed, and dried calcium carbonate cakes show that the calcite batch contained mostly rhombohedral calcite, somewhat agglomerated (Figure 11, left-hand image). The only identified crystal structure in the XRD analyses was calcite (Figure S1 in Supplementary Material). However, the XRD analyses of the aragonite sample identified both aragonite and calcite phases, with calcite being the dominating phase1 (Figure S2 in Supplementary Material). The SEM image of the aragonite sample shows needle-shape crystals (typical for aragonite) embedded in large blocks of (probably calcite) agglomerates (Figure 11, right-hand image). While the EDS analysis for the calcite solids identifies only the expected elements contained in calcite (Figure 12, left-hand image), the EDS spectrum from the aragonite solids also identifies traces of chloride (Figure 12, right-hand image).
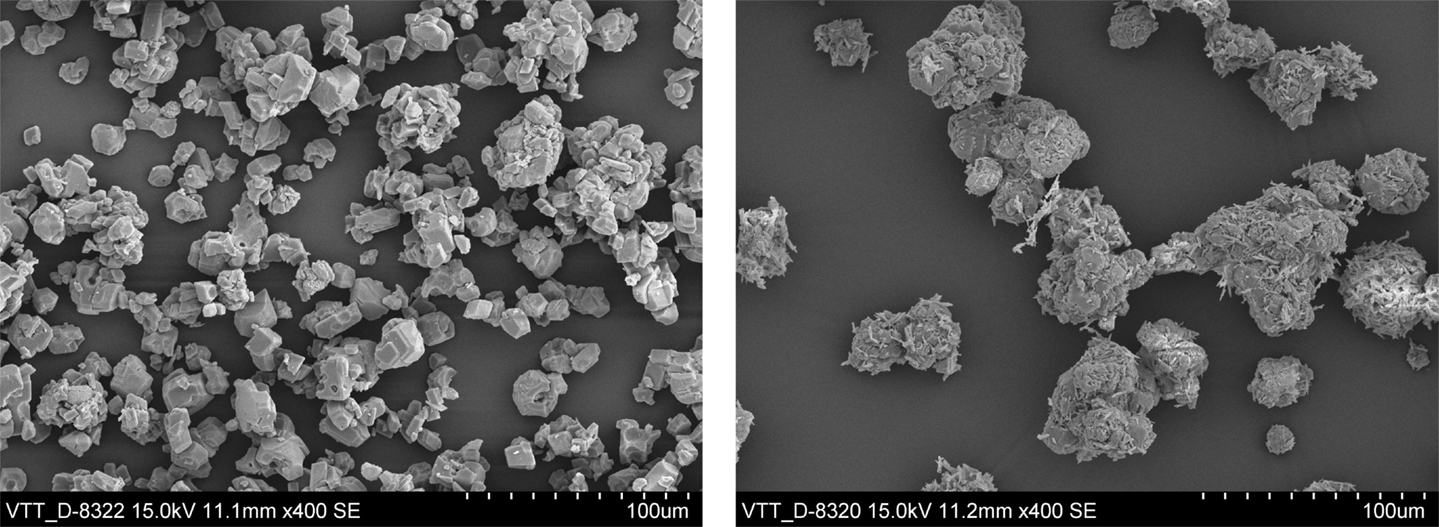
Figure 11. SEM images of solids separated by pressure filtration from the calcite slurry (test number 5, left) and from the aragonite slurry (test number 15, right).
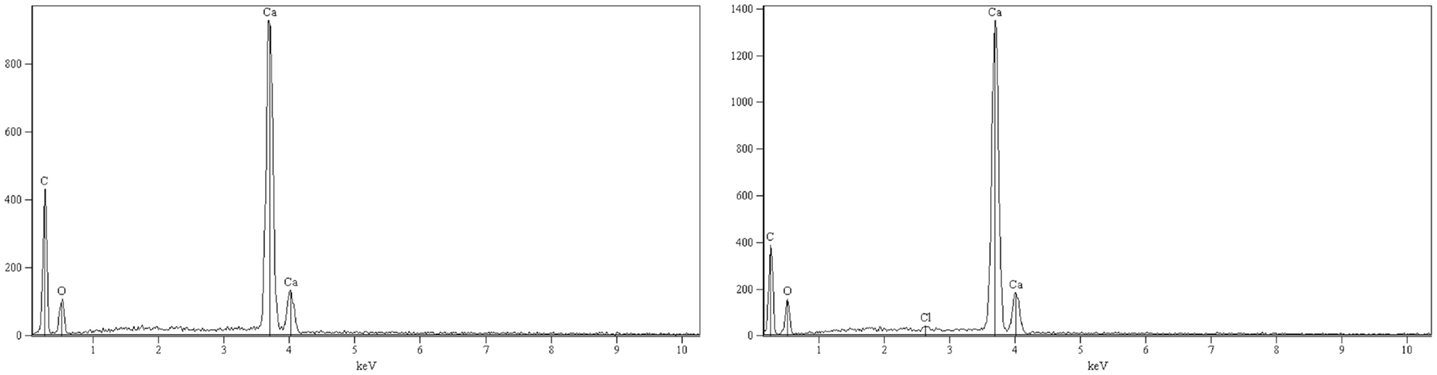
Figure 12. EDS spectra of solids separated by pressure filtration from the calcite slurry (left) and from the aragonite slurry (right).
Discussions and Conclusion
The experimental results show that both the calcium carbonate slurries produced with the studied concept are easy to filter with pressure filtration and with vacuum filtration. Pressure filtration gave a high capacity (400–460 kg/m2h) and a low cake residual moisture content (12–14 wt-%). Vacuum filtration gave slightly higher filtration rates (500–610 kg/m2h at the lowest chloride contents of the cakes), but the cake residual moisture also stayed higher (25–26 wt-%). However, vacuum filtration used a filter cloth with slightly higher permeability, which is expected to give a higher filtration rate. The cake thickness achieved (up to 5 cm) is similar to that of industrial scale filters.
For calcite, the washing liquid penetrated the cake easily, even with a low wash water pressure. The results show that washing of the calcite slurry can be performed either directly after the slurry feed, or after an intermediate (or first) pressing. The chloride content of the calcite cake can be dropped from 10000 ppm to ~10 ppm using a 2 l/kg DS wash ratio. This is an important result when considering industrial scale-up of the process. Although Hudd (2014) assumed that multiple filtration stages would be needed, the results presented here show that the residual chloride content of the calcium carbonate can be minimized using filtration and washing in a single stage, without the need for multiple filtration and washing stages. However, the acceptable level of chloride in calcium carbonate for paper applications is yet to be determined.
High capacities were achieved also for the aragonite slurry, with both filtration technologies carrying out the washing treatment at 55°C. However, SEM images revealed that the aragonite batch was not the best representative of aragonite. Previous experiences at similar parameters with the Aalto pilot facility had yielded typical aragonite needle-shaped particles (Said and Järvinen, 2015). However, the previously reported aragonite precipitation had been performed for a shorter time (40 min) and at a slightly higher temperature (58°C) than the precipitation of the materials in this study. The longer reaction time with CO2 may have caused a lower final solution pH, causing calcium carbonate to dissolve and recrystallize as calcite. Previous (unreported) experiments for producing aragonite with the pilot facility have indicated that aragonite formation is sensitive to the volume flow of CO2. This may be partly due to the temperature of the incoming gas as it is not preheated before entering the reactor. It is also possible that the slurry underwent Ostwald ripening2 during transportation. However, due to the large agglomerations visible in the SEM images the more likely explanation is that the reheating of the aragonite slurry for the filtration tests had caused more calcium carbonate to precipitate as calcite, since it is well known that calcium carbonate is less soluble in water at higher temperatures. The precipitation of calcium carbonate during reheating had possibly formed bigger agglomerates that could have enclosed some of the solution. If this is the case, the chloride in the filter cake, which was detected both with EDS and the pulping method, comes from this enclosed solution, because filtration is not very efficient at removing solution enclosed by particle agglomerates. As we cannot rule out the possibility that our aragonite sample had been altered in the filtration testing, it is something that needs more attention in future experimental work.
The aragonite slurry was also more difficult to wash, and the test parameters that were successfully used for calcite filtration were not suitable for filtration of the aragonite batch. The difficulty in aragonite filtration could partly also be due to a thicker cake in the aragonite experiments. Using a temperature of 50°C for the washing water and higher pressure/vacuum, washing of the aragonite cake was also performed successfully with both filtration technologies, although the residual chloride content remained higher than that for the calcite cake. The cake residual chloride content with pressure filtration technology dropped from ~5700 to 109 ppm with 1.4 l/kg DS wash ratio. With vacuum filtration, the chloride content dropped from >13,000 to 127 ppm with 2.0 l/kg DS wash ratio.
The final chloride content in the cake produced from the aragonite slurry was higher (around 100 ppm) than that produced from the calcite slurry (around 10 ppm). This is probably due to the differences in particle size distribution of the solids in the two slurries, but also the different crystal morphologies. Although varying the wash ratio with 1–5 l/kg DS had little effect on the final chloride content of the calcite cake (Figure 8), it seems to have a larger effect on that of the aragonite cake (Figure 10). Sadly, either the filtration or the precipitation procedure had resulted in an unrepresentative aragonite sample, consisting both of calcite and aragonite. This became evident first weeks after the filtration experiments when SEM images were taken of the filtered batches. However, it does imply that the aragonite filtration needs to be performed immediately after precipitation, and that the temperature of the process needs to be controlled and monitored. Further testing with a representative aragonite sample is therefore required. Also further tests with calcite are recommended for evaluating the washing liquid consumption more accurately and the effect of particle size on the washing result.
In summary, the results showed that a low chloride content of the cake can be achieved with quite a small amount of washing water and the filtration rate is fast with both filtration methods tested. More work with larger filter units is needed for optimizing the filtration for a full-scale commercial filtration plant. It is very likely that a thickener would be an effective option for concentrating the slurry before the filter, due to the relatively large-sized particles. The selection of the filtration method depends also on possible additional requirements by the subsequent milling of calcium carbonate, required for grinding the produced calcium carbonate down to the particle sizes required by various paper applications. Possible milling options for the produced calcium carbonate include jet milling and vertical fine grinding mills. In jet milling, it is better to have a low moisture content in the cake as the moisture will evaporate during milling. In this case, pressure filtration would be preferred as the washing liquid penetrates the cakes very easily giving a lower residual moisture content in the cake than vacuum filtration. Further tests with pressure filtration could for instance be carried out with an Outotec PF 0.1 filtration unit as it allows easier control of the washing liquid volumes used. For vertical fine grinding mills both filtration options should be suitable as this mill type is less sensitive to cake moisture content. Therefore, further tests for both vacuum and pressure filtration are recommended to be performed with bigger test units. In addition, milling of the produced calcium carbonate should also be tested.
Author Contributions
ST wrote the main part of the final manuscript (based on TA’s report) and assisted in the analysis of the filtration results. TA performed the filtration experiments, participated in the analyses, and wrote the main part of the report of the filtration results. TK assisted with both the report and the manuscript and assisted in analysis of the results. HP coordinated the analysis work and participated in writing both the report and the final manuscript. AS made the calcium carbonate batches and provided the analyses for the steel slag, and assisted in the analysis of the results.
Conflict of Interest Statement
Author ST has filed a patent application related to the concept studied in this paper: Teir S, Eloneva S, Revitzer H, Zevenhoven R, Salminen J, Fogelholm C-J, PÖyliÖ E (2009) Method of producing calcium carbonate from waste and by-products. International application published under the patent cooperation treaty (PCT), WO 2009/144382, PCT/FI2009/050455.
The remaining co-authors declare that the research was conducted in the absence of any commercial or financial relationships that could be construed as a potential conflict of interest
Acknowledgments
This work was carried out in the Carbon Capture and Storage Program (CCSP) research program coordinated by CLEEN Ltd. with funding and support from Outotec Oyj and the Finnish Funding Agency for Technology and Innovation, Tekes. SSAB Europe Oy kindly provided the steelmaking slag for the experiments. Tom E. Gustafsson at VTT Expert Services is acknowledged for SEM imaging and EDS analyses.
Supplementary Material
The Supplementary Material for this article can be found online at http://journal.frontiersin.org/article/10.3389/fenrg.2016.00006
Footnotes
References
Ciullo, P. A. (1996). Industrial Minerals and Their Uses: A Handbook and Formulary. Westwood, NJ: Noyes Publications.
Clark, E. B. (1992). “Lime Used for Precipitated Calcium Carbonate (PCC) for the Paper Industry,” in Innovations and Uses for Lime, Vol. 1135, eds D. D. Walker, T. B. Hardy, D. C. Hoffman, and D. D. Stanley (Philadelphia, PA: American Society for Testing and Materials, ASTM STP), 1–7.
Couper, J. R., Penney, W. R., Fair, J. R., and Walas, S. M. (2010). Chemical Process Equipment – Selection and Design. Revised 2nd edition. Burlington, MA: Elsevier.
Eloneva, S., Teir, S., Revitzer, H., Salminen, J., Said, A., Fogelholm, C.-J., et al. (2009). Reduction of CO2 emissions from steel plants by using steelmaking slags for production of marketable calcium carbonate. Steel Res. Int. 80, 415–421. doi: 10.2374/SRI09SP028
ESAPA. (2004). IPPC BAT Reference Document – Large Volume Solid Inorganic Chemicals Family: Process BREF for Soda Ash. ESAPA – European Soda Ash Producers Association. Available at: http://www.cefic.org/Documents/Industry%20sectors/ESAPA_Soda_Ash_Process_BREF3.pdf
Hudd, H. (2014). Post-Treatment of Precipitated Calcium Carbonate (PCC) Produced from Steel Converter Slag. M.Sc. Thesis, Åbo Akademi University, Turku.
Mattila, H.-P., Grigaliūnaitė, I., and Zevenhoven, R. (2012). Chemical kinetics modeling and process parameter sensitivity for precipitated calcium carbonate production from steelmaking slags. Chem. Eng. J. 192, 77–89. doi:10.1016/j.cej.2012.03.068
Mattila, H.-P., and Zevenhoven, R. (2014a). “Production of precipitated calcium carbonate from steel converter slag and other calcium-containing industrial wastes and residues,” in Advances in Inorganic Chemistry, Vol. 66, Chap. 10. eds M. Aresta and R. van Eldik (Waltham, MA: Academic Press), 347–384. doi:10.1016/B978-0-12-420221-4.00010-X
Mattila, H.-P., and Zevenhoven, R. (2014b). Design of a continuous process setup for precipitated calcium carbonate production from steel converter slag. ChemSusChem 7, 903–913. doi:10.1002/cssc.201300516
Naydowski, C., Hess, P., Strauch, D., Kuhlmann, R., and Rohleder, J. (2001). “Calcium carbonate and its industrial application,” in Calcium Carbonate: From the Cretaceous Period into the 21st Century, eds F. W. Tegethoff, J. Rohleder, and E. Kroker (Basel: Birkhäuser Verlag), 197–311.
Said, A., and Järvinen, M. (2015). “Demonstration pilot plant for the production of precipitated calcium carbonate (PCC) from steelmaking slag and carbon dioxide,” in Proceedings from the 5th International Conference on Accelerated Carbonation for Environmental and Material Engineering (ACEME) (New York City). Available at: http://www3.aiche.org/proceedings/Conference.aspx?ConfID=ACEME-2015
Statton, P. (2012). “An overview of the North American calcium carbonate market,” in Presentation at the 23rd Annual Canadian Conference on Markets for Industrial Minerals (Quebec). Available at: http://roskill.com/wp/wp-content/uploads/2014/11/download-roskills-paper-on-the-north-american-calcium-carbonate-market.attachment1.pdf
Teir, S., Kotiranta, T., Parviainen, T., and Mattila, H.-P. (2015). “Case study for utilisation of CO2 from flue gases in PCC production from steelmaking slag,” in Proceedings from the 5th International Conference on Accelerated Carbonation for Environmental and Material Engineering (ACEME) (New York City). Available at: http://www3.aiche.org/proceedings/Conference.aspx?ConfID=ACEME-2015
Keywords: mineralization, carbon dioxide, CCU, utilization, filtration, PCC, GCC
Citation: Teir S, Auvinen T, Said A, Kotiranta T and Peltola H (2016) Performance of Separation Processes for Precipitated Calcium Carbonate Produced with an Innovative Method from Steelmaking Slag and Carbon Dioxide. Front. Energy Res. 4:6. doi: 10.3389/fenrg.2016.00006
Received: 06 November 2015; Accepted: 02 February 2016;
Published: 22 February 2016
Edited by:
Renato Baciocchi, University of Rome Tor Vergata, ItalyReviewed by:
Rafael Mattos Dos Santos, Sheridan College Institute of Technology and Advanced Learning, CanadaGiulia Costa, University of Rome Tor Vergata, Italy
Copyright: © 2016 Teir, Auvinen, Said, Kotiranta and Peltola. This is an open-access article distributed under the terms of the Creative Commons Attribution License (CC BY). The use, distribution or reproduction in other forums is permitted, provided the original author(s) or licensor are credited and that the original publication in this journal is cited, in accordance with accepted academic practice. No use, distribution or reproduction is permitted which does not comply with these terms.
*Correspondence: Sebastian Teir, c2ViYXN0aWFuLnRlaXJAdnR0LmZp