 Wilhelm Kuckshinrichs
 Thomas Ketelaer
 Jan Christian Koj
- Forschungszentrum Juelich, Institute for Energy and Climate Research – Systems Analysis and Technology Evaluation (IEK-STE), Juelich, Germany
Alkaline water electrolysis (AWE) is a mature hydrogen production technology and there exists a range of economic assessments for available technologies. For advanced AWEs, which may be based on novel polymer-based membrane concepts, it is of prime importance that development comes along with new configurations and technical and economic key process parameters for AWE that might be of interest for further economic assessments. This paper presents an advanced AWE technology referring to three different sites in Europe (Germany, Austria, and Spain). The focus is on financial metrics, the projection of key performance parameters of advanced AWEs, and further financial and tax parameters. For financial analysis from an investor’s (business) perspective, a comprehensive assessment of a technology not only comprises cost analysis but also further financial analysis quantifying attractiveness and supply/market flexibility. Therefore, based on cash flow (CF) analysis, a comprehensible set of metrics may comprise levelised cost of energy or, respectively, levelized cost of hydrogen (LCH) for cost assessment, net present value (NPV) for attractiveness analysis, and variable cost (VC) for analysis of market flexibility. The German AWE site turns out to perform best in all three financial metrics (LCH, NPV, and VC). Though there are slight differences in investment cost and operation and maintenance cost projections for the three sites, the major cost impact is due to the electricity cost. Although investment cost is slightly lower and labor cost is significantly lower in Spain, the difference can not outweigh the higher electricity cost compared to Germany. Given the assumption that the electrolysis operators are customers directly and actively participating in power markets, and based on the regulatory framework in the three countries, in this special case electricity cost in Germany is lowest. However, as electricity cost is profoundly influenced by political decisions as well as the implementation of economic instruments for transforming electricity systems toward sustainability, it is hardly possible to further improve electricity price forecasts.
Introduction
Alkaline water electrolysis (AWE) is a mature hydrogen production technology (Ursua et al., 2012) and there exists a range of economic assessments for available technologies. In most cases, these assessments focus on typical cost components such as investment, operation and maintenance (O&M), and decommissioning, which are commonly called technology cost (Bertuccioli et al., 2014; Noack et al., 2015). For new AWEs, which may be based on novel polymer-based membrane concepts (Koj et al., 2015), it is of prime importance that development comes along with new configurations and technical and economic key process parameters for AWE that might be of interest for further economic assessments.
In many cases, economic assessments for technologies focus on cost analysis. But, from an investor’s (business) perspective, a comprehensive economic assessment of a technology also comprises further financial analysis quantifying attractiveness and supply/market flexibility. Therefore, based on cash flow (CF) analysis, a comprehensible set of metrics may comprise levelized cost of energy or, respectively, levelized cost of hydrogen (LCH) for cost assessment, net present value (NPV) for attractiveness analysis, and variable cost (VC) for analysis of market flexibility.
Aiming to overcome these drawbacks and to contribute to economic assessment of AWE technology, this paper presents cost estimations for an advanced AWE technology and a financial analysis. Starting with a brief overview on the literature to AWE cost results (see AWE Cost Literature Overview), Section “Methodological Approach and Estimation of Key Parameters” defines the system boundaries for the technology assessment. Additionally, in Section “Methodological Approach and Estimation of Key Parameters,” the methodological frame for the analysis is presented focusing on the financial metrics, the projection of key performance parameters of advanced AWEs, and further financial and tax parameters. The specification of an electricity scenario is of major importance. The analysis comprises projections for the technology and electricity supply at three different sites (Germany, Austria, and Spain), all representing Western European countries, though the integration into international trade and material flows is different. The results for the cost, attractiveness, and market flexibility metrics are presented in Section “Financial Analysis for 6 MW AWE Hydrogen Generation.” Additionally, the relevance of key performance parameters for AWE assessment is exemplarily demonstrated by elasticities for LCH and VC. Finally, Section “Discussion” presents a discussion of main findings against the background of main assumptions and key data, and Section “Summary” identifies further methodological challenges.
AWE Cost Literature Overview
Alkaline water electrolysis investment cost estimations depend mainly on plant size and site-specific characteristics (Bertuccioli et al., 2014; Noack et al., 2015, Pellinger and Schmid, 2016; Shaner et al., 2016). Identifying a present range of 1,000–1,200 €2015/kW capacity, Bertuccioli estimated 1,100 €2015/kW as central investment cost and projected large potential for cost decrease up to 580 €/kW in 2030 (Bertuccioli et al., 2014).
With respect to economic analysis, many studies use the concept of LCH (Bertuccioli et al., 2014; Shaner et al., 2016). Depending on plant and site characteristics and on the terms for electricity supply, LCH in 2012 comprises 3.2 €/kg for Germany and 5.2 €/kg for UK. In the future, there is potential for cost decreases (development of technology and learning rates) lowering the investment cost. With respect to the main operating cost component electricity, projections need to identify technological trajectories. In addition, the projections must also deal with energy and climate policy aspects, as they are making future electricity cost highly uncertain.
Even if LCH analysis prevails, most present studies neglect financial and fiscal aspects. They also represent economic analysis as pure LCH analysis, ignoring other economic aspects relevant for decision-making, either for investment or for operating decisions.
Methodological Approach and Estimation of Key Parameters
From a methodological viewpoint, the economic assessment of a technology requires integration of the three dimensions time, space, and well-specified system boundaries equally guaranteeing relevance of the analysis and integrity of the results (Figure 1). The temporal system boundary reflects the time duration from “cradle to grave” which in economic terms covers investment in a technology, operation, and decommission. Investment is based on capital availability, either by equity or bank loans. Operation affords purchase of upstream products such as water or electricity. The spatial system boundary reflects the plant locations and the regional origin of upstream products. Additionally, according to the economic lifetime of the AWE technology, an electricity scenario is eminent in order to quantify cost (and possibly emission balances) for the base year and all subsequent years. The inputs have market prices and incentive schemes such as investment subsidies principally may prevail. Whereas hydrogen is the physical output, additionally, in business perspective there is also the monetary output “avoided tax on earnings,” which is in any case relevant (Figure 1).
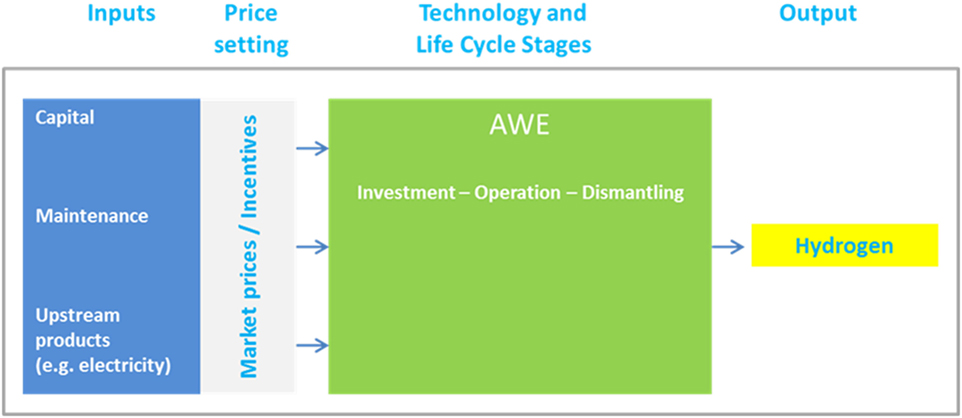
Figure 1. Techno-economical characterization of the alkaline water electrolysis (AWE) system boundaries.
From private perspective, two points attract attention:
• Financial and fiscal aspects
Financial aspects such as share of private equity or debt for investment in energy technologies deserve closer attention from a business perspective the higher the share of capital expenditure to total expenditures. On the one hand, equity and debt may require different returns, and on the other hand, only interest payments for debts are tax deductible. Furthermore, fiscal incentives such as investment subsidies or the crediting of tax redemptions need further attention (e.g., Chandrasekar and Kandpal, 2005; Simshauser, 2014).
• Discounting
For discounting in business, the weighted average cost of capital (WACC) concept is chosen. It reflects shares and returns of equity and debts and is used in many studies on energy technology cost (Burgess, 2011; Kost et al., 2013, Peter et al., 2013; Burwen, 2015, Taylor et al., 2015). Depending on the technology and the kind of investors, WACCs may vary considerably (Stubelj et al., 2014). Small-size investments in, e.g., PV installations typically have high shares of equity. The share of equity for large-size installations such as offshore wind parks, often requiring hundreds of m€2015, is typically much lower (30–40%). Accordingly, the share of debt for financing is much higher. The return on debt equals usual market conditions, whereas in the energy market the return on equity typically is higher, reflecting opportunity cost such as the expected returns on alternative investments (Peter et al., 2013). However, private household’s investments in, e.g., PV installations usually do not reflect “opportunity cost” comparisons. For discounting, the post-tax Vanilla WACC is chosen. The real WACC is a function of nominal returns on equity and debt interest rates and inflation. With the post-tax Vanilla WACC, tax on earnings should be directly incorporated into the cost formula (Allen Consulting Group, 2007).
The following subsections focus on the main methodical pillars for the analysis of life-cycle cost of an AWE. Therefore, the focus is on the metrics’ approach and the approaches to specify realistic projections of sensitive technical and economic parameters such as investment cost or future electricity cost. Sections “Financial Metrics for Technology Assessment” and “Key Parameters” discuss details on main metrics, key data, and their sources.
Financial Metrics for Technology Assessment
Generally, from private perspective, economic metrics assess business efforts to invest in a technology and run this technology. Accordingly, cost components such as project cost, O&M cost, financing cost, tax redemptions, and capital sources such as private equity and bank loans take center stage. In many cases, technology assessments focus on cost analysis. From an investor’s (business) perspective, a comprehensive economic assessment of a technology comprises analysis of cost, attractiveness, and supply/market flexibility (Figure 2) (Sousa de Oliveira et al., 2011; Sousa de Oliveira and Fernandes, 2012, Lee, 2016).
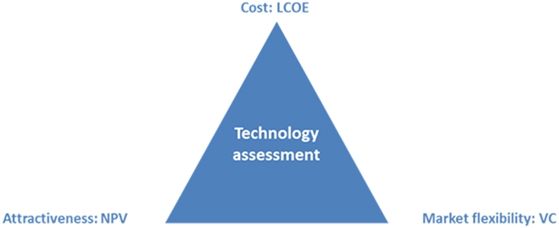
Figure 2. Assessment metrics.
Based on a CF analysis, cost metrics typically comprise indicators such as LCH (Darling et al., 2011; Harvego et al., 2012) (Table 1, Eq. 1). LCH represents a fundamental approach enabling to compare competing hydrogen technologies. This indicator may be interpreted as a break-even value indicating a price that is needed as revenue over the lifetime of the technology in order to justify an investment in a particular energy generation facility and covering all expenses and the payment of an acceptable return to investors. From private perspective, the expenditures for investment and the capital’s source are relevant. As private equity usually expects higher returns than is necessary for bank loans, this is important for financing cost. Also, fiscal aspects such as tax redemptions may be significant in assessing a technology investment. This is attended by the WACC approach (Table 1, Eq. 5), a discounting concept representing different capital sources (equity and bank loan).
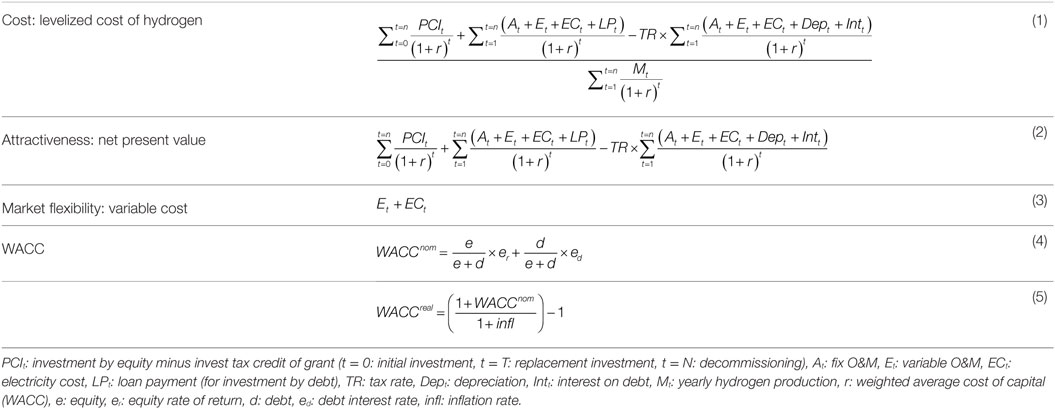
Table 1. Metrics formulas.
In order to assess attractiveness from investor’s perspective, the NPV is defined as the present value benefits less the present value cost (Table 1, Eq. 2) (White, 2011; Thakre, 2014, Cucchiella et al., 2015).
For operation, the flexibility of the technology in relation to market conditions is of special relevance. The VC denotes those cost components directly attributable to the operation of a plant (Table 1, Eq. 3) (Borenstein, 2000). VC characterizes the minimum-level market price for operating an AWE site. Lower prices result in operational losses. In contrast, fix cost covers those components attributable after investment irrespective of the operational time.
Key Parameters
Technology and Plant Characteristics
Alkaline water electrolysis technology for hydrogen production has a long tradition and became industrialized and a mature technology within the last decades. The first pressurized AWE was already built by Zdansky/Lonza in 1948 (Kreuter and Hofmann, 1998). It is estimated to be part of a future so-called “hydrogen economy” (Bockris, 2002; McDowall and Eames, 2006, Zeng and Zhang, 2010). Centerpieces of AWE are the electrolysis cells. Inside, the cells electrolysis is enabled by an electric current between the electrodes and a circulating aqueous potassium hydroxide solution. Migration of ions and the separation of both electrolysis products, hydrogen and oxygen, is enabled by a membrane. According to Bhandari et al. (2014) following chemical reactions take place within the cells:
Figure 3 shows the technical system boundaries for the AWE plant. For operation, essential upstream products beside electricity comprise deionized water, KOH solution, process steam, and nitrogen.

Figure 3. Technical characterization of the alkaline water electrolysis (AWE) plant and system boundaries.
Koj et al. (2015) analyzed and defined key technical plant parameters for an advanced commercial scale 6 MW AWE plant in comparison to a 3.5 MW state-of-the-art pressurized electrolysis. In contrast, the new developed electrolysis plant uses advanced polymer-based membranes. The advance plant, scaled-up to 6 MW, achieves higher hydrogen outputs with the same number of cells with equal diameters. Cell stacks are essential system components framing the electrolysis cells, were the electrolysis takes place. Moreover, there are further components necessary for the system assembly and operation comprising gas separator (for separating O2, H2, and small amounts of KOH), lye tank for potassium hydroxide (KOH), KOH filter, heat exchangers (for cooling O2, H2, and KOH), pumps (pumping of KOH and water), and power electronics. H2 compression, storage, and use are not considered. Additionally, selling the by-product O2 is not considered, as large-scale deployment of electrolysis capacities may go along with market saturation for O2 and strongly decreasing prices (Hermann et al., 2014). Table 2 shows the plant characteristics, and the functional unit is the physical output of 1 kg H2 at 33 bar and 40°C (Koj et al., 2015).
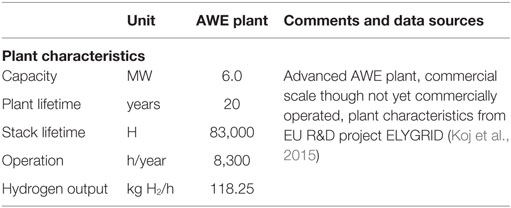
Table 2. Alkaline water electrolysis (AWE) technology and plant characteristic (cross-national).
With respect to key performance parameters, it is necessary to distinguish country-specific parameters from non-country-specific ones. Technological characteristics are by definition cross-national. Main parameters comprise expected plant lifetime (20 year), stack lifetime (83,000 h operation), operational time (8,300 h/year), and, respectively, hydrogen output (118.25 kg H2/h).
Correspondent specific demands are summarized in Table 3. Additionally, specific electricity demand is of particular importance not only from a technological point of view but also from the economic perspective. The technical process and plant characteristics hold irrespective the location in Germany, Spain, or Austria (Tables 2 and 3).
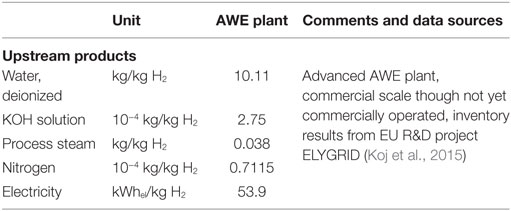
Table 3. Alkaline water electrolysis (AWE) technology and inventory (cross-national).
Cost Characteristics for Financial Analysis
In order to estimate AWE cost, the capacity increases from 3.5 to 6 MW, which is the basis for the technology study in Koj et al. must be considered.
While manufacturers do not share in-house data on cost breakdown, Figure 4 shows results gathered by literature review (Bertuccioli et al., 2014). The cost breakdown for the system cost shows that the stack contributes to half of the overall cost. In order to identify the cost impact of new polymer-based membranes, the stack level breakdown is necessary as well. Membranes contribute to 7% of the stack cost. Regarding the entire system cost, membranes only contribute 3.5%. Therefore, we argue the cost impacts introducing new membrane concepts is not of major relevance for the overall cost projection.
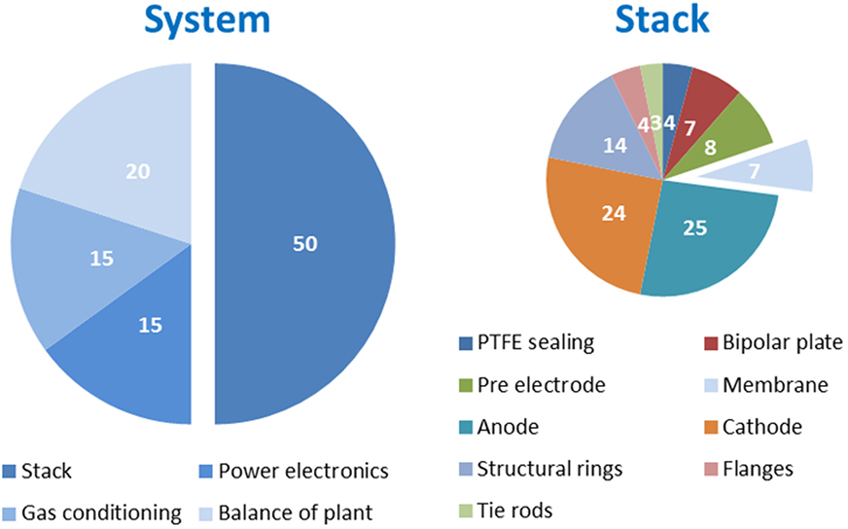
Figure 4. Alkaline system and stack cost breakdown (%) (Bertuccioli et al., 2014).
For plant upscaling from 3.5 to 6 MW, an engineering top-down approach for cost scaling is used (Eq. 6) (Eerev and Patel, 2012). It enables to estimate the cost of a given investment with different capacities, in our case the increase from 3.5 to 6 MW. α denotes the scaling exponent, which is in principle unknown. Often, a value of 0.6–0.7 is used as default (also referred to as six-tenths or seven-tenths rule) (Eerev and Patel, 2012). However, as AWE technology already has a high level of maturity, we carefully set a higher scaling exponent (0.85).
where x: new capacity, base: old capacity, and α: scaling exponent.
Cross-national parameter estimation only partly holds for cost specifications for the three sites (Table 4). We distinguish direct depreciable capital cost (investment components) from indirect ones (such as site preparation, engineering-design, and upfront permissions). The former is expected to have a world-market price whereas the latter has a high local content so that country-specific wage rates are relevant. In case of Spain, this is important as its wage rate index is approximately 0.62 (relative to Germany). Although defined by Koj et al. as commercial scale 6 MW plant, market prices for investment components are not available. Here, available information on investment components, cost structures, and average total investment cost (Bertuccioli et al., 2014) is used.
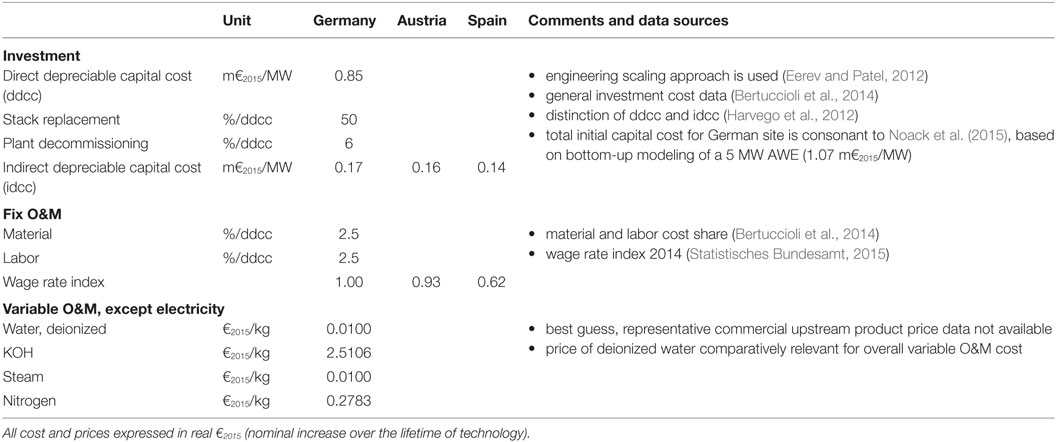
Table 4. Alkaline water electrolysis (AWE) technology cost and plant characteristics (except for electricity).
Specific investment cost ranges from 1.02 to 0.99 m€2015/MW (Germany, Spain); the slight difference is due to the local content for indirect depreciable capital cost. The result for top-down assessed total investment cost is consonant to results from Noack et al. (2015), who derived investment cost data based on bottom-up modeling a 5 MW AWE site in Germany for hydrogen generation (and underground storage). Stack replacement, decommissioning, and fix operation and maintenance (O&M) cost are defined as fixed percentage share of direct depreciable cost (Bertuccioli et al., 2014). VC accrues for upstream products and comprises deionized water, KOH, steam, and nitrogen. For electricity, country-specific cost is defined in the subsequent electricity scenario part.
Upstream Product: Electricity
For the upstream product electricity, a scenario approach is necessary, comprising the three dimensions time horizon, regions, and primary energy mix for electricity. The time horizon is from 2015 (base year) to 2035 (final year). It is chosen according to the projected economic lifetime of an AWE plant.
The regions that are covered are Germany, Spain, and Austria. These countries all represent Western European industries; however, the integration into international trade and material flows is different. The regional representation is important for electricity cost.
The focus on electricity generation mix is eminent. AWE demands considerable amounts of electricity, which in this study is supplied by the grid and which therefore shows country-specific electricity generation and emissions profiles. Focusing on the electricity mix reflects the question how to implement hydrogen generation in a present system still significantly relying—at least for some countries—on fossil electricity generation, although these systems presumably will decarbonize its electricity generation in the future. Germany and Spain both still rely extensively on fossil resources for electricity generation. On the other hand, average industrial electricity prices are higher in Spain than in Germany. Austria shows significant differences with respect to the generation mix that already mainly depends on renewable energies, i.e., hydro power. This is of special importance: there are country-specific conditions to get access to electricity and to what price.
For the deployment of non-carbon electricity generation technologies between 2015 and 2035, and implicitly, the electricity mix basic information is from the European “Trends to 2050” scenario (Capros et al., 2013). This study assesses a reference scenario for EU28. Based on main assumptions with respect to macroeconomic development, population, world fossil fuel prices, and further ones, a harmonized macroeconomic modeling approach is used to project the energy generation mix on EU member state level. Therefore, the results for the electricity generation mix on country level are consistently developed and harmonized against a set of macroeconomic assumptions for the European Union. Based on results for 2015 and 2035, we assume linear technology diffusion paths that signal the change from present generation to future electricity generation mix. As the countries start from different settings, the electricity generation mix in 2035 will still be different in its composition of decarbonized generation technologies.
With respect to electricity for hydrogen production and its base year price, the study avoids reflection on average specific industry electricity prices. These are by trend high or very high in most European countries, but also very heterogeneous across industries. Electricity prices differ considerably, which is mainly due to different generation technologies, heterogeneous regulation, and tax schemes in European countries [for an overview on different tax and pricing policies and regulation schemes in EU28 and further European countries, see Eurostat (2015a)]. For the sake of the study, instead, hydrogen plant operators are regarded as customers actively participating in power markets.
In most European countries, the electricity price can be split into three parts. A competitive part includes the cost for generation and distribution. A second part includes the cost for grid use, and a third part includes taxes and further charges.
For the three investigated countries, the competitive part is formed in a similar way. The electricity price is either a result of bilateral contracts between a producer and a consumer—in this case an industrial company—or it is a market price negotiated in different bilateral trading contract as over the counter trades or it originates from a product at an electricity exchange. It can be based on different products as futures/forward, day ahead trades and intraday trades. The composition depends on the strategy of the company. Depending on the selling organization, distribution cost differs as well. Because of these different possibilities, there is no way to determine one single price for 1 year that is valid for a whole sector. Therefore, prices for generation and distribution can only be average prices based on surveys. Eurostat is publishing such survey data every 6 month (Eurostat, 2015b).
To get a better understanding about the differences in electricity prices in Austria, Germany, and Spain, a more detailed view on their national regulation schemes is useful focusing on the regulation for grid use as well as on taxes and further charges. In Austria and Germany, these price parts depend on the electricity demand, the electricity intensity, and the grid level. In Spain, those factors do not have an effect on the calculation of the electricity prices. For the calculation of the electricity price in Austria and Germany, the specification of the electrolysis plant is necessary as to know how much electricity will be demanded and, therefore, which price category might be reasonable.
Based on data from the Austrian, regulation agency (E-Control) (E-Control, 2015), the German association for energy and water (BDEW) (BDEW, 2015), and Eurostat (Eurostat, 2015b), it can be shown that an electrolysis plant, actively participating in the electricity markets of the three respective countries differ. In Austria, the AWE can be connected to the grid levels 4–6. Therefore, the electricity price varies between 7.64 €2015ct/kWh (grid level 4) and 10.13 €2015ct/kWh (grid level 6). For the German site, the electricity price depends on the classification of the company that will operate the AWE. Either the company is classified as an energy-intensive company or as a non-energy-intensive company. The difference in the electricity price amounts to 6.02 €2015ct/kWh (6.26 vs. 12.27 €2015ct/kWh), mainly depending on the fact if the AWE operator has to pay the EEG levy. In Spain, it is not clear if the tax of the National Energy Commission is already included in the competitive part of the electricity price or not. Thus, both prices are given. The difference is less than 0.02 €2015ct/kWh (Table 5).
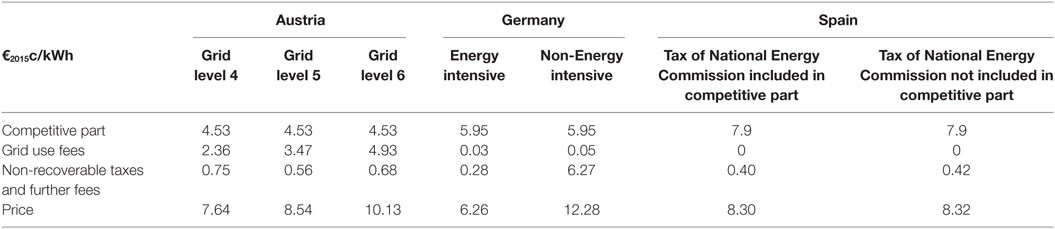
Table 5. Base year (2015) electricity price components for Austria, Germany, and Spain (53 GWh/a).
The LCH uses the price of grid level 4 for Austria (7.64 €2015ct/kWh), which is a common grid level for industrial companies. For Germany, the price for an energy-intensive company is taken (6.26 €2015ct/kWh) as this will be the case if we assume that the operator only operates the AWE. The price with the taxes of the National Energy Commission not included in the competitive part is used for the calculations for Spain (8.30 €2015ct/kWh).
The electrolysis plant is assumed to run for 20 years. Therefore, the electricity price that is needed for the LCC must be projected for this time horizon as well. The following projections can be found in the study “Trends to 2050” (Capros et al., 2013). For the time from 2010 to 2030, the trend study proposes an average electricity price increase of 1.34%/year. The increase is mainly due to capital cost, and governmentally influenced cost components such as taxes on fuels, ETS payments, and RES supporting schemes.
For our calculation, we use our own figures of 2015 prices for Austria, Germany, and Spain, and the EU figures for price increase per year. Therefore, starting from different electricity prices in 2015 the Austrian, German, and Spanish AWE sites will come up with different electricity prices in 2035.
Financial and Tax Parameters
Financial and tax parameters are in principle country specific. However, in-depth country-specific tax considerations are beyond this paper. Therefore, for financial and tax considerations, we use cross-national parameters (Table 6). The chosen equity-to-debt-ratio 25:75 for Western European countries is consistent to literature (Kost et al., 2013; Ondraczek et al., 2015). This also holds for return on equity and interest rates on debt (Kost et al., 2013). Inflation rate is one of those macroeconomic parameters the hardest predictable over the long term, and macroeconomic projections for inflation rates usually are short-term focused. Methodologically, this poses a challenge for financial assessment of technologies with a lifetime of 20 years. Though in macroeconomic theory and in practical policy, a targeted inflation rate of approximately 2% is regarded acceptable for price stability for our purposes we consider a lower projection of 1%, which is at the bottom line of present projections (EC Directorate-General for Economic and Financial Affairs, 2016). In case inflation projections are regarded too low, it needs to be kept in mind that higher inflation rates should result in higher nominal return and interest expectations.
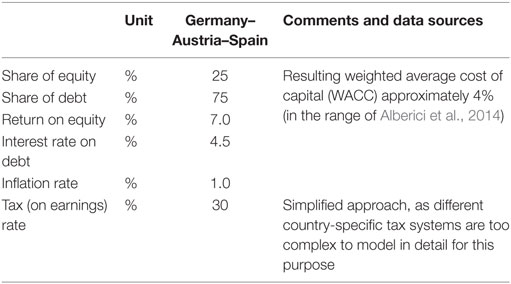
Table 6. Financial and tax on earnings parameters (cross-national).
Based on these parameters, WACCreal equals 4%, which is in good accord with considerations in literature on a wide range of energy technologies (Kost et al., 2013; Alberici et al., 2014) and also with IPCC lower range of 5% (Schlömer et al., 2014). Due to very different country-specific characteristics, IPCC additionally calculates an upper range of 10%. Ondraczek et al. (2015) use WACC parameters of 3.8–4.3% for Western European countries (Ireland, Switzerland, UK, and Netherlands).
Financial Analysis for 6 MW AWE Hydrogen Generation
Financial Metrics: CF, LCH, NPV, and VC
The results for CFs for an AWE site are depicted in Figure 5 (it has to be kept in mind that the CF covers expenses and no sales). Here, the results for the AWE site in Germany are shown. The CFs for the Austrian and Spanish sites are slightly different, but similar in its structure. The investment cost is accounted for by the source of its funding, which is why investment is represented by PCI cost (investment by equity) for initial investment, stack replacement and decommissioning, and corresponding loan payment cost and interest. The electricity expenses are main cost drivers, increasing over time according to increasing (real) electricity prices. Keeping in mind that hydrogen sales are not accounted for, and the NPV is calculated for the stream of expenses, the NPV is negative (app. −66 m€2015). For Austria and Spain, the corresponding (negative) NPVs are lower mainly due to higher electricity cost.
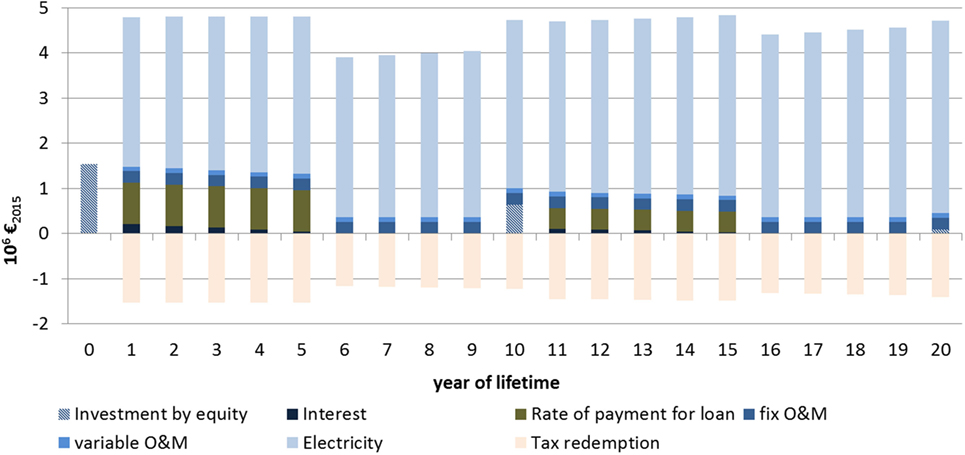
Figure 5. Current value cash flow (expenses): German alkaline water electrolysis site.
Tax deductibility of cost elements is also important, as can be seen by the negative CF elements. Negative CFs represent a form of return flows; here return flows in the form of avoided tax on earnings. Again keeping in mind that hydrogen sales are not accounted for, the NPV of the stream of expenses is negative (app. −50 m€2015). Tax deductibility of cost elements has significant influence as is shown by the higher NPV.
The structure of LCH is similar for the AWE sites (Figure 6). In all cases, the cost for the upstream product electricity is the main share of LCH. In absolute terms, the results for LCH of AWE hydrogen differ significantly. Keeping in mind impacts of tax redemptions, the German site performs best with LCH of 3.64 €2015/kg. LCHs for the Austrian and Spanish sites are approximately 15–18% higher, mainly due to higher electricity cost. In case of Spain, slightly lower investment cost do not compensate for higher electricity cost.
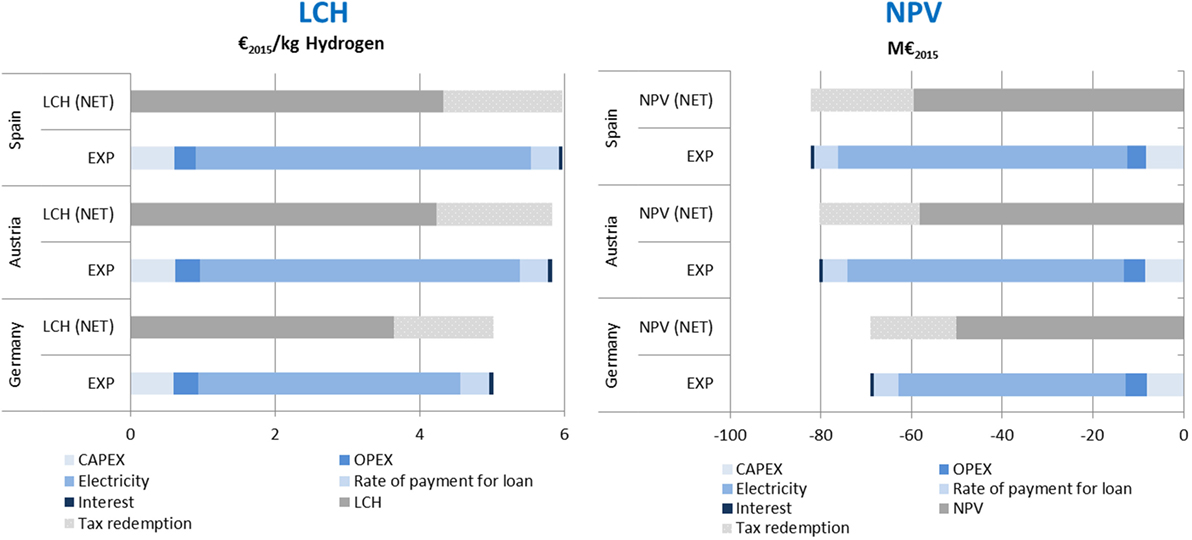
Figure 6. Levelized cost of hydrogen and net present value results.
As market prices for hydrogen are not the focal point, NPV, representing attractiveness, is negative in all three cases. In absolute terms, Germany performs an NPV of −50 m€2015. Again, the results for Austria and Spain are less attractive, falling below the German value by 15–19%. Here, the result is exclusively due to cost components, mainly for electricity, as according to the technical specifications all three sites produce equal amounts of hydrogen. For both metrics, LCH (NET) and NPV (NET), tax redemptions are significant, resulting to a decrease of LCH and NPV of approximately 38%.
In case of the VC, the relative advantage of the German site is between 21 and 27% compared to the Austrian and Spanish ones. In a competitive market for hydrogen, this clearly assigns advantages to the German site considering development of sales prices for hydrogen, as the VC describes the flexibility of the site in relation to market conditions and the minimum-level price to contribute to fixed-charge coverage. Again, the dominating factor is the difference in the price of electricity in the three countries.
The range of current hydrogen market prices for industrial use is 1.4–5 €2015/kg (Waidhas, 2015) (Figure 7). In case of the upper price range, for the German site there is a positive, though decreasing producer surplus over the AWE lifetime. In contrast, Austrian and Spanish sites start with a positive surplus but run into operating deficits after 15 and 12 years, respectively. With regard to the lower level hydrogen price for industrial use, neither site can prove competitiveness.
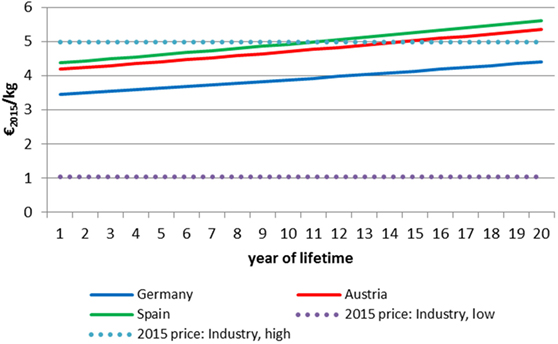
Figure 7. Variable cost and current hydrogen prices for industrial use.
Parameter Sensitivities: LCH and VC
The generation of hydrogen based on AWE technology is cost sensitive with respect to several parameters comprising components and input product’s cost, process parameters as well as financial and fiscal parameters. The chosen (cost) elasticity reflects the relative change of the dependent variable y (LCH and VC) induced by a relative change of a parameter value xi (Eq. 7). We demonstrate these sensitivities by calculating elasticities for the LCH (for Germany) and VC (for all sites). For LCH, Austria and Spain perform very similar.
where y: variable; xi: parameters of respective formula.
For LCH, we tested cost parameters (initial investment cost, stack cost, and electricity price), process-engineering parameters (plant lifetime and operational hours), and financial-fiscal parameters (interest on debt and tax rate on earnings) as significant parameters. Ranging from −0.6 to 0.8 the resulting elasticities are under proportional (Figure 8) (Under proportionality condition: 0 < |ε| < 1). Though significant on an absolute scale, LCH is not very sensitive to initial investment and stack replacement cost. This is also the case with respect to interest rates. Highest elasticities prevail for electricity price (0.6–0.8), plant lifetime (−0.69), and tax rate (−0.4). From a technology’s point of view, tax rates may be regarded as given and immutable. Negative elasticities for tax rates may be surprising on the first glance. However, with higher tax rate on earnings and induced higher avoided tax payments (on earnings), finally, LCH can drop. The electricity price may be partly negotiated, and plant lifetime prolongation may be influenced by technical and managerial efforts. LCH is not very sensitive toward the price of deionized water (Table 4). Though the price is comparatively relevant for overall non-electricity O&M cost, even a doubling does not considerably alter the LCH due to the low share of non-electricity O&M cost.
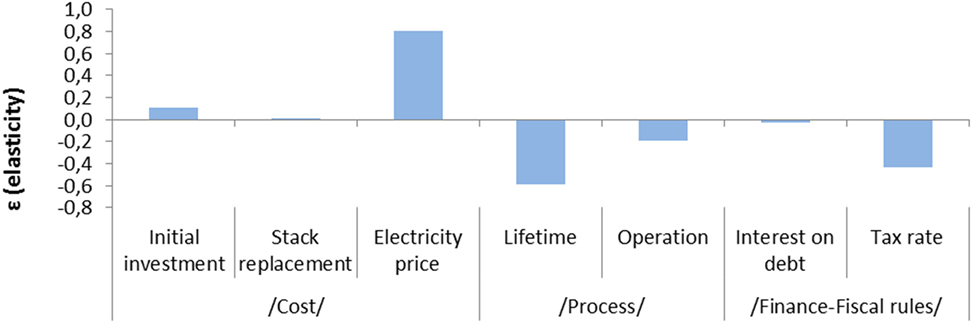
Figure 8. Levelized cost of hydrogen elasticities for alkaline water electrolysis site in Germany.
In case of VC, we tested the cost parameter electricity price (EC) according its dominating impact on VC. For all three sites, the resulting elasticities are increasing in time and nearly proportional (|ε| = 1) (Figure 9). They are increasing in time due to the increase of the relative weight of EC by increasing EC in real terms. The overwhelming relevance of electricity cost for market flexibility is evident.
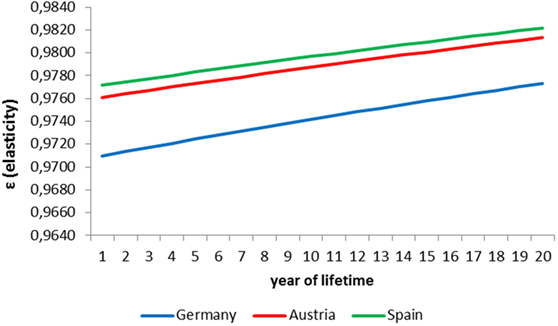
Figure 9. Variable cost elasticity for alkaline water electrolysis sites.
Discussion
The analysis identifies the German site performing best and the Austrian site second-best in all financial metrics assessing cost, attractiveness, and market flexibility (Figure 10). As the technical plant characteristics and financial and tax parameters are site-independent (except those for electricity, which are part of the electricity scenario calculations), the favorable performance of the German site rests upon cost characteristics comprising investment cost and O&M cost. For all metrics, the cost of electricity plays the major role, as is shown exemplarily for LCH. Although investment cost is slightly lower in Spain, the difference can not outweigh the higher electricity cost compared to Germany.
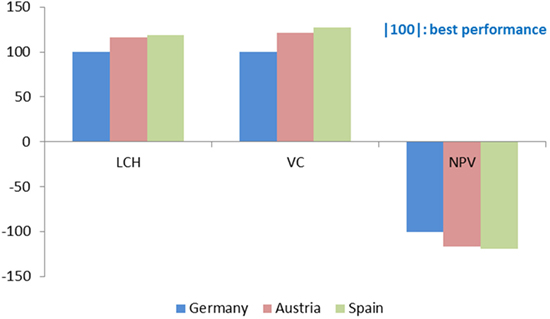
Figure 10. Metrics overview.
As shown, identifying a future electricity price is subject to a range of assumptions. The generation mix itself is affected by political influence. Besides the projection of generation mixes and the development of cost of the market driven components, it is the political influence on cost components such as grid transport, taxes, and contributions to finance renewable energy sources, which hardly makes it possible to improve electricity price forecasts. If, contrary to the assumptions here, electricity prices are going to adjust over the lifetime of the AWE site, the relative advantage of the German site may disappear.
This could clearly be the case, if in the course of the transformation of the German energy system governance is possibly revised. Currently, the benefits for energy-intensive industries comprise on the one hand the opportunity to purchase electricity on the spot market at low prices. On the other hand, the Renewable Energy Act (EEG) Special Equalization Scheme provides specific cost reductions for energy-intensive industries such as exemptions from renewable energies contribution. For both aspects, the current beneficial frame is a consequence of the governance of the German electricity market (Fischer et al., 2016).
However, development of the demand side of the hydrogen market is also relevant for future prospects. Besides future industrial uses of hydrogen, further uses for stationary and residential applications (fuel cell heating devices), mobility (fuel cell electric vehicles), and for hydrogen as energy storage (power-to-X) may increase (Linssen and Hake, 2016). Although there are technical options to use hydrogen, the development of demand for hydrogen depends to a high degree on strategies for transforming energy systems.
Summary
Aiming to contribute to economic assessment of improved AWE technology, this paper presents an economic assessment of advanced AWE technology comprising cost estimations and a financial analysis. The financial analysis not only focuses on specific cost such as LCH but also on further financial metrics quantifying attractiveness and supply/market flexibility of the technology. Therefore, besides LCH, NPV and VC are taken for assessment. The AWE technology taken in this study is a 6 MW plant scaled up from a 3.5 MW state-of-the-art pressurized electrolysis, achieving higher hydrogen output with the same number of cells with equal diameters. For comparison, three different sites in Germany, Austria, and Spain are specified. Technology and plant characteristics and upstream demand for electricity and other products (deionized water, KOH solution, and process steam) are in accordance with an EU study on advanced AWE technology. For cost characteristics, site-specific aspects for investment and operation are taken into account. This holds for investment and operational cost (O&M), labor cost, and in particular for electricity cost. The latter shows considerable differences for the three sites, mainly due to national regulation for electricity generation and the transformation toward sustainable electricity systems with high penetration of renewable and carbon-free energy sources. Therefore, electricity cost projection over the lifetime of the AWE plant is based on a European energy scenario approach, specifying characteristic framework data for the three sites.
The German AWE site turns out to perform best in all three financial metrics (LCH, NPV, and VC). Though there are slight differences in investment and O&M projections for the three sites, the major cost impact is due to the electricity cost. Although investment cost is slightly and labor cost is significantly lower in Spain, the difference can not outweigh the higher electricity cost compared to Germany. Given the assumption that the electrolysis operators are customers directly and actively participating in power markets, and based on the regulatory framework in the three countries, in this special case electricity cost in Germany is lowest. However, as electricity cost is profoundly influenced by political decisions as well as the implementation of economic instruments for transforming electricity systems toward sustainability, it is hardly possible to further improve electricity price forecasts.
Further analysis may focus on the significance to differentiate private and public economics of hydrogen technology. On the one hand, the focus is, e.g., on unpriced pollution externalities. Keeping in mind the basis of the present analysis, an expansion toward full LCA-based inventory of relevant inputs and outputs including, e.g., emissions is obvious. On the other hand, private and public perspectives on discounting are also different. It may be the more different the more environmental externalities such as extraction of non-renewable natural resources, carbon dioxide emissions (particularly of the electricity supply), and further ones such as ozone depletion and acidification are in the spotlight. The question is whether site performances from a life-cycle perspective might change due to inclusion of public perspectives.
Author Contributions
WK developed the idea of the paper and is responsible for the financial metrics calculation and for the main parts of interpretation. TK developed the scenario idea for electricity supply. JCK contributed technical and cost data for the AWE sites.
Conflict of Interest Statement
The authors declare that the research was conducted in the absence of any commercial or financial relationships that could be construed as a potential conflict of interest.
Funding
The work is part of the Helmholtz Programme Technology, Innovation, Society.
References
Alberici, S., et al. (2014). Subsidies and Cost of EU Energy. Brussels: Ecofys. Available at: https://ec.europa.eu/energy/sites/ener/files/documents/ECOFYS%202014%20Subsidies%20and%20costs%20of%20EU%20energy_11_Nov.pdf
Allen Consulting Group. (2007). Review of the Weighted Average Cost of Capital for the Purposes of Determining the Maximum Reserve Capacity Price. Melbourne, Australia: The Allen Consulting Group. Available at: www.allenconsult.com.au
BDEW. (2015). Industriestrompreise Ausnahmeregelungen bei Energiepreisbestandteilen (Aktualisierte Fassung) [Industrial Electricity Prices Exemptions from Energy Price Components]. Berlin: BDEW Bundesverband der Energie- und Wasserwirtschaft e.V.
Bertuccioli, L., Chan, A., Hart, D., Lehner, F., Madden, B., and Standen, E. (2014). Development of Water Electrolysis in the European Union. Element Energy. Cambridge, UK; Lausanne, CH: E4tech Sarl.
Bhandari, R., Trudewind, C. A., and Zapp, P. (2014). Life cycle assessment of hydrogen production via electrolysis – a review. J. Cleaner Prod. 85, 151–163. doi: 10.1016/j.jclepro.2013.07.048
Bockris, J. M. (2002). The origin of ideas on a hydrogen economy and its solution to the decay of the environment. Int. J. Hydrogen Energy 27, 731–740. doi:10.1016/S0360-3199(01)00154-9
Borenstein, S. (2000). Understanding competitive pricing and market power in wholesale electricity markets. Electr. J. 13, 49–57. doi:10.1016/S1040-6190(00)00124-X
Burgess, J. (2011). New Power Cost Comparisons. Levelised Cost of Electricity for a Range of New Power Generation Technologies. Available at: www.atse.org.au
Burwen, J. (2015). The Impact of Three Tax-Reform Proposals on the Financial Performance of Energy Plants. Available at: http://americanenergyinnovation.org/wp-content/uploads/2015/09/BPC_Energy-AEIC-The-Impact-of-Three-Tax-Reform-Proposals-September-2015.pdf
Capros, P., et al. (2013). EU Energy, Transport and GHG Emissions. Trends to 2050. Luxembourg. Available at: http://ec.europa.eu/transport/media/publications/doc/trends-to-2050-update-2013.pdf
Chandrasekar, B., and Kandpal, T. C. (2005). Effect of financial and fiscal incentives on the effective capital cost of solar energy technologies to the user. Sol. Energy 78, 147–156. doi:10.1016/j.solener.2004.05.003
Cucchiella, F., D’Adamo, I., and Gastaldi, M. (2015). Financial analysis for investment and policy decisions in the renewable energy sector. Clean Technol. Environ. Policy 17, 887–904. doi:10.1007/s10098-014-0839-z
Darling, S. B., You, F., Veselka, T., and Velosa, A. (2011). Assumptions and the levelized cost of energy for photovoltaics. Energy Environ. Sci. 4, 3133–3139. doi:10.1039/c0ee00698j
EC Directorate-General for Economic and Financial Affairs. (2016). European Economic Forecast, Winter 2016. Brussels. Available at: http://ec.europa.eu/economy_finance/publications/eeip/pdf/ip020_en.pdf
E-Control. (2015). Auswertung der Industriepreiserhebung Strom Juli 2015 [Evaluation of Industrial Electricity Price Investigation]. Wien: E-Control. Available at: https://www.e-control.at/marktteilnehmer/strom/strommarkt/preise/industriepreise
Eerev, S. Y., and Patel, M. K. (2012). Standardized cost estimation for new technologies (SCENT) – methodology and tool. J. Bus.s Chem. 9, 31–48.
Eurostat. (2015a). Electricity Prices – Price Systems 2014. Unit E-5: Energy, Brussels: European Commission.
Eurostat. (2015b). Preise Elektrizität für Industrieabnehmer, ab 2007 – halbjährige Daten [Electricity Prices for Industrial Customers, 2007 – Half-Year Data]. Brussels: EUROSTAT.
Fischer, W., Hake, J.-F., Kuckshinrichs, W., Schröder, T., and Venghaus, S. (2016). German energy policy and the way to sustainability: five controversial issues in the debate on the “Energiewende”. Energy 115, 1580–1591. doi:10.1016/j.energy.2016.05.069
Harvego, E., O’Brien, J. E., and Mckellar, M. G. (2012). System Evaluations and Life-Cycle Cost Analyses for High-Temperature Electrolysis Hydrogen Production Facilities. Idaho Falls, USA. Available at: https://inldigitallibrary.inl.gov/sti/5436986.pdf
Hermann, H., Emele, L., and Loreck, C. (2014). Prüfung der klimapolitischen Konsistenz und der Kosten von Methanisierungsstrategien [Assessment of Climate-Political Consistency and Cost of Strategies for Methanization]. Berlin. Available at: http://www.oeko.de/oekodoc/2005/2014-021-de.pdf
Koj, J. C., Schreiber, A., Zapp, P., and Marcuello, P. (2015). Life cycle assessment of improved high pressure alkaline electrolysis. Energy Procedia 75, 2871–2877. doi:10.1016/j.egypro.2015.07.576
Kost, C., Mayer, J. N., Thomsen, J., Hartmann, N., Senkpiel, C., Phillips, S., et al. (2013). Stromgestehungskosten Erneuerbare Energien [Levelized Cost of Electricity for Renewable Energies]. Freiburg. Available at: https://www.ise.fraunhofer.de/de/veroeffentlichungen/veroeffentlichungen-pdf-dateien/studien-und-konzeptpapiere/studie-stromgestehungskosten-erneuerbare-energien.pdf
Kreuter, W., and Hofmann, H. (1998). Electrolysis: the important energy transformer in a world of sustainable energy. Int. J. Hydrogen Energy 23, 661–666. doi:10.1016/S0360-3199(97)00109-2
Lee, D.-H. (2016). Cost-benefit analysis, LCOE and evaluation of financial feasibility of full commercialisation of biohydrogen. Int. J. Hydrogen Energy 41, 4347–4357. doi:10.1016/j.ijhydene.2015.09.071
Linssen, J., and Hake, J.-F. (2016). “Hydrogen research, development, demonstration, and market deployment activities,” in Hydrogen Science and Engineering, eds D. Stolten and B. Emonts (Weinheim, Germany: Wiley-VCH), 59–83.
McDowall, W., and Eames, M. (2006). Forecasts, scenarios, visions, backcasts and roadmaps to the hydrogen economy: a review of the hydrogen futures literature. Energy Policy 34, 1236–1250. doi:10.1016/j.enpol.2005.12.006
Noack, C., et al. (2015). Studie über die Planung einer Demonstrationsanlage zur Wasserstoff-Kraftstoffgewinnung durch Elektrolyse mit Zwischenspeicherung in Salzkavernen unter Druck [Study on Planning a Demonstration Plant for Hydrogen-Fuel Generation by Electrolysis and Intermediate Storage in Salt Cavernes Under Pressure]. Stuttgart. Available at: http://elib.dlr.de/94979/
Ondraczek, J., Komendantova, N., and Patt, A. (2015). WACC the dog: the effect of financing costs on the levelized cost of solar PV power. Renew. Energy 75, 888–898. doi:10.1016/j.renene.2014.10.053
Pellinger, C., and Schmid, T. (2016). Verbundforschungsvorhaben Merit Order der Energiespeicherung im Jahr 2030. Teil 2: Technoökonomische Analyse funktionaler Energiespeicher [Research Project on Merit Order of Energy Storage in the Year 2030. Part 2: Techno-Economic Analysis of Functional Energy Storage]. Munich: FFE. Available at: https://www.ffe.de/publikationen/pressemeldungen/615-abschlussberichtmeritorderenergiespeicherung
Peter, F., Krampe, L., and Ziegenhagen, I. (2013). Entwicklung von Stromproduktionskosten [Development of Electricity Generation Cost]. www.prognos.com
Schlömer, S., et al. (eds) (2014). “Annex III: technology-specific cost and performance parameters,” in Climate Change 2014: Mitigation of Climate Change. Contribution of Working Group III to the Fifth Assessment Report of the Intergovernmental Panel on Climate Change, eds O. Edenhofer, et al. (Cambridge, UK; New York, USA: Cambridge University Press). Available at: https://www.ipcc.ch/pdf/assessment-report/ar5/wg3/ipcc_wg3_ar5_annex-iii.pdf
Shaner, M. R., Atwater, H. A., Lewis, N. S., and Mcfarland, E. W. (2016). A comparative technoeconomic analysis of renewable hydrogen production using solar energy. Energy Environ. Sci. 9, 2354–2371. doi:10.1030/c5ee02573g
Simshauser, P. (2014). The cost of capital for power generation in atypical capital market conditions. Econ. Anal. Policy 44, 184–201. doi:10.1016/j.eap.2014.05.002
Sousa de Oliveira, W., and Fernandes, A. J. (2012). Economic feasibility analysis of a wind farm in Caldas da Rainha, Portugal. Int. J. Energy Environ. 3, 333–346.
Sousa de Oliveira, W., Fernandes, A. J., and Gouveia, J. J. B. (2011). Economic metrics for wind energy projects. Int. J. Energy Environ. 2, 1013–1038.
Statistisches Bundesamt. (2015). EU-Vergleich der Arbeitskosten 2014: Deutschland auf Rang acht [European Union Comparison of Labour Cost 2014: Germany Position Eight]. Wiesbaden: Statistisches Bundesamt. Available at: https://www.destatis.de/DE/PresseService/Presse/Pressemitteilungen/2015/05/PD15_160_624.html
Stubelj, I., Dolenc, P., and Jerman, M. (2014). Estimating WACC for regulated industries on developing financial markets and in times of market uncertainty. Manag. Glob. Transit. 12, 55–77.
Taylor, M., Daniel, K., Illas, A., and So, E. (2015). Renewable Power Generation Costs in 2014. Available at: www.irena.org/publications
Thakre, R. (2014). Sensitivity analysis and feasibility analysis of renewable energy project. Int. J. Eng. Innov. Technol. 4, 230–234.
Ursua, A., Gandia, L. M., and Sanchis, P. (2012). Hydrogen production from water electrolysis: current status and future trends. Proc. IEEE 100, 410–426. doi:10.1109/JPROC.2011.2156750
Waidhas, M. (2015). Power to Gas – An Economic Approach? Erlangen, Germany: Siemens. Available at: http://www.fze.uni-saarland.de/AKE_Archiv/DPG2015-AKE_Berlin/Vortraege/DPG2015_AKE9.1_Waidhas_P2G-Economics.pdf
Keywords: alkaline water electrolysis, levelized cost of hydrogen, net present value, variable cost, weighted average cost of capital
Citation: Kuckshinrichs W, Ketelaer T and Koj JC (2017) Economic Analysis of Improved Alkaline Water Electrolysis. Front. Energy Res. 5:1. doi: 10.3389/fenrg.2017.00001
Received: 25 July 2016; Accepted: 25 January 2017;
Published: 20 February 2017
Edited by:
Michel Feidt, University of Lorraine, FranceReviewed by:
Rui Filipe Martins, Centre de Recherche Public Henri Tudor, LuxembourgStoian Petrescu, University Politehnica Bucharest, Romania
Copyright: © 2017 Kuckshinrichs, Ketelaer and Koj. This is an open-access article distributed under the terms of the Creative Commons Attribution License (CC BY). The use, distribution or reproduction in other forums is permitted, provided the original author(s) or licensor are credited and that the original publication in this journal is cited, in accordance with accepted academic practice. No use, distribution or reproduction is permitted which does not comply with these terms.
*Correspondence: Wilhelm Kuckshinrichs, dy5rdWNrc2hpbnJpY2hzQGZ6LWp1ZWxpY2guZGU=