 Christof Holliger
 Hélène Fruteau de Laclos2
 Gabrielle Hack
- 1Laboratory for Environmental Biotechnology, School for Architecture, Civil and Environmental Engineering, Ecole Polytechnique Fédérale de Lausanne, Lausanne, Switzerland
- 2Methaconsult, Préverenges, Switzerland
Biomethane potential (BMP) tests are used to determine the amount of methane that can be produced from organic materials in order to design different components of full-scale anaerobic digestion (AD) plants such as size of the digesters and units exploiting the produced biogas. However, little is known on how well BMPs compare with biogas production from the same organic materials in full-scale installations. In this study, two AD plants were chosen to carry out such comparisons, a dry AD plant treating green waste from urban areas and food waste from restaurants and supermarkets, and a liquid AD plant treating waste sludge from wastewater treatment and seven additional organic wastes. The BMPs of multiple samples of the individual organic materials collected during a period of 7–9 months were determined. Separate tests of mixtures of organic materials confirmed that the BMP of the mixtures can be calculated by adding the BMPs of the individual materials. The weekly methane production during the investigated periods was calculated from the full-scale installation data on the feeding of the digesters and the BMPs of each substrate fed into the digesters and compared with the weekly methane production measured on-site. The latter was calculated from the most accurately measured entity, either the electricity or the volume of purified biomethane injected into the grid. The weekly methane production rates calculated from BMPs and the one measured on-site were very similar and followed the same pattern. Some exceptions could be explained by, e.g., an overload of the full-scale installation. The measured weekly methane production accounted for 94.0 ± 6.8 and 89.3 ± 5.7% of the calculated weekly methane production for the wet and dry AD plant, respectively. For 26 out of 29 weeks, the calculated weekly methane production overestimated the measured one in the case of the wet AD plant and for 37 out of 39 weeks for the dry AD plant. Based on these results, it is proposed using an extrapolation coefficient of 0.8 to 0.9 to estimate the methane production of full-scale AD plants from BMPs of the substrates to be digested and their specific organic loads.
Introduction
Biogas from biomass is one of the possibilities of renewable energy production to reduce greenhouse gas emissions. In Switzerland, 0.29% of the total national energy consumption in the year 2014 was covered by biogas, and biogas corresponded to about 8% of the total renewable energy production excluding hydropower. In wastewater treatment plants (WWTPs), biogas production has been implemented since decades but rather for waste sludge stabilization by anaerobic digestion (AD) than for energy production. A recent review shows that in the United States of America, little biogas is utilized for on-site process heat and power production and most of it is flared (Shen et al., 2015). The situation is different in Europe (Bodík et al., 2011; Bachmann, 2015). An example is the WWTP of Bern that was part of the study presented here and produces more than twice as much energy in the form of biomethane than energy consumed from the grid (https://www.arabern.ch/). Such high biogas productions at a WWTP can only be achieved by co-digestion, i.e., the AD of waste sludge together with other substrates with higher organic loads (Shen et al., 2015). Co-digestion has become a hot topic in AD research which is witnessed by the dramatic increase in the number of publications on this subject and reviews summarizing the results of this tremendous amount of work (Mata-Alvarez et al., 2011, 2014). Co-digestion has not only the advantage to increase the overall biogas production of an AD plant but it also allows to use substrates that are difficult to digest as single substrate due to imbalanced nutrient contents, too rapid digestibility leading to acidification, and presence of inhibitory compounds. Although synergistic effects can occur in specific cases, co-digestion most often follows the additivity principle, meaning that as much methane is produced as the sum of the methane production with the individual substrates (Astals et al., 2014; Ebner et al., 2016). However, co-digestion can improve the process kinetics that allows building AD plants with smaller digesters or using oversized digesters with non-used capacity more efficiently (Astals et al., 2014).
In order to have an estimate of the amount of methane that can be produced with a specific substrate, one can apply the so-called biomethane potential (BMP) test (Angelidaki et al., 2009). This test is carried out at laboratory scale and is based on batch assays where an aliquot of substrate is digested by an appropriate inoculum (Raposo et al., 2012). The BMP is expressed as the volume of dry methane gas under standard conditions (273.15 K and 101.33 kPa) per mass of volatile solids (VS) of substrate added, with the unit NLCH4 kgVS−1. An international interlaboratory test has shown that BMP tests are not yet standardized enough to obtain consistent results for one and the same substrate (Raposo et al., 2011). A recently published guideline, which was the follow-up of an international workshop held in June 2015 in Leysin, Switzerland, will hopefully help to obtain more robust and consistent results in the future (Holliger et al., 2016).
Techno-economic assessments of AD plants depend on many different parameters with the methane production from the organic materials to be digested as one of the most important ones (Zamalloa et al., 2011; Dave et al., 2013). The amount of methane produced has also a significant influence on the design of the downstream processing of the produced biogas. It influences for example the choice of cogenerators to produce electricity and heat, the number, and capacity. But also gas storage and gas purification systems will be calculated and designed according to the amount of methane produced. In principle, industry uses three ways to estimate methane production of full-scale installations. They either take the methane production published for similar plants in the case of AD plants that treat a single substrate and for which it can be expected that its composition is almost the same. Good examples are plants digesting maize silage. For co-digestion plants, either pilot studies on laboratory scale with continuous or semicontinuous systems are carried out, an option that is rarely applied due to high costs, or the BMPs of the substrates are taken and the methane production calculated from there. For the latter, the BMPs are either determined by specialized laboratories on samples of the substrates to be digested or they are taken from literature data for similar substrates. The methane production of the full-scale installation is then calculated by multiplying the BMPs with the organic loads of the specific substrates. Furthermore, an extrapolation coefficient of 0.8–1.0 is often taken into account without knowing whether the applied coefficient is justified or perhaps too high or too low. The coefficient is applied in order to take in account the differences between a batch and a continuous process as well as scaling effects.
There are, however, very few studies that investigated the scaling effect of methane production on specific substrates. BMPs are normally determined at laboratory scale in batch reactors, whereas full-scale installations are operated continuously or semicontinuously. In addition, solid substrates are often homogenized for laboratory BMP tests but in full-scale digestion particle size can reach up to centimeters. A comparison of methane production from bench- and sub pilot-scale anaerobic digesters showed that BMPs of feedstock co-digestion mixtures accurately estimated the range of methane produced from three 100-L plug-flow reactors (Sell et al., 2011). Methane production in a 300-L semicontinuous reactor was approximately 75–80% of the one determined in 6-L fed-batch reactors (Ruffino et al., 2015). Comparison of laboratory scale BMP results with full-scale biogas production has not yet been reported.
The goal of the present study was therefore to compare the methane production calculated from BMPs of individual substrates with the methane produced at the full-scale installation carrying out co-digestion. Special care was taken to collect representative samples of the substrates that are co-digested at the two studied full-scale installations. In addition, the full-scale installation methane production was determined by using the most reliable parameter measured at full-scale, either the electricity or the purified gas injected into the corresponding grid. This also allowed to propose an extrapolation coefficient that should be used when calculating the full-scale plant methane production from BMPs.
Materials and Methods
Full-Scale AD Plants
Two full-scale AD plants were chosen for the comparison of the methane production calculated from BMPs of the substrates co-digested at the plant and the methane production measured at the AD plant, one with a dry and the other with a liquid AD process.
The dry AD plant belongs to the SATOM group, Monthey, Switzerland, is located at Villeneuve, Switzerland, and is based on the Kompogas process (Axpo Kompogas AG, Baden, Switzerland). It is treating green waste collected from households and food waste from restaurants and supermarkets. These two wastes are processed separately before digestion. The green waste is chopped to pieces with a maximal dimension of 10 cm. The food waste is diluted, crushed, separated from plastic packaging materials, and stored in a tank. The AD is occurring in the horizontal plug-flow reactor, at a high solid contents of 25–35%, under thermophilic conditions (approximately 55°C), and the average retention time of the material fed is normally at least 15 days. The biogas is used for co-generation of electricity and heat.
The liquid AD plant is part of the WWTP of the city of Bern (arabern, Herrenschwanden, Switzerland). It is treating waste sludge from primary clarification and biofilter backwashing, as well as seven additional organic wastes from different origins to increase biogas production. The additional substrates were food waste, coffee-processing wastewater, whey, oil–fat remover sludge, industry food waste, slaughterhouse waste fat, and industrial alcohol. Food wastes are conditioned at an off-site installation and pretreated to remove remaining undesired materials. The cosubstrates are stored in several different reservoirs, one of which is kept at 50°C to ensure good fluidity of fat-containing wastes. The AD is occurring under mesophilic conditions (approximately 35°C) and the average retention time in the two-stage process is 18–20 days. The produced biogas is purified and injected in the natural gas grid.
Inoculum and Substrates
The inoculum was collected at a WWTP (ERM, Morges, Switzerland) that treats its waste sludge by AD under mesophilic conditions (approximately 35°C). Waste sludge from primary and secondary clarification is the only substrate of this full-scale installation; hence no co-digestion is carried out. The inoculum was taken from the first completely mixed stage of the AD process a few days before starting BMP tests. It had a total solids (TS) content of 38.9 ± 2.6 g L−1 and VS content of 22.5 ± 1.2 g L−1 (n = 26), and produced on average 1,612 ± 180 NmLCH4 L−1 inoculum during the different BMP tests that had a duration of 23–49 days. The inoculum was stored on average for 2–3 days at room temperature in a completely filled and closed plastic container in the period from sampling to setting in the BMP tests during which TS, VS, and eventually other parameters (pH, NH4, and VFA concentration) were determined.
As already mentioned before, only two kinds of substrates are digested at the dry AD plant in Villeneuve. The green waste was very heterogeneous and therefore a specific sampling procedure was applied. Each month of sampling (December 2013, March, April, May, June, and July 2014), samples were collected on the full-scale plant during four 4 days (Monday through Thursday). Each week day, a sample of approximately 1 kg was collected from the conveyor belt transporting the chopped green waste, and this was repeated eight times during the day with an interval of about 1 h. From the 8 kg green waste collected during 1 day, approximately 1 kg was grinded to 10 mm large particles with a cutting mill SM 200 (Rentsch GmbH, Haan, Germany) and stored in a freezer at −20°C until use for BMP tests and other analysis. Similar to green waste sampling, 1 L of the diluted food waste was also taken once an hour and all eight samples were mixed. From these 8 L of food waste, 1 L was stored in the freezer until use. This resulted in 4 green waste and 4 food waste samples for each month, and 24 in total for each substrate.
At the WWTP of Bern, the waste sludge was co-digested with seven additional substrates. Since the substrates were delivered irregularly, sampling was carried out by the staff of the WWTP and samples were stored in a freezer at −20°C. Frozen samples were transported to the laboratory on a regular basis and further stored frozen until use in BMP tests and analysis. The numbers of samples analyzed per substrate are indicated in the Results section.
Microcrystalline cellulose purchased from Sigma-Aldrich was used as positive control in all BMP tests. It had a TS–VS content of 95.1%.
BMP Tests, Data Analysis and Presentation, and Chemical Analytical Methods
The BMP tests were carried out using the AMPTS II system from Bioprocess Control (Lund, Sweden) with some modifications of the standard procedure proposed by the supplier. Prior to setting in the BMP tests, the TS and VS of the inoculum and the substrates were determined according to standard methods procedures (APHA 1998). On an irregular basis, pH, ammonium, and volatile fatty acid concentrations of the inoculum were determined, and depending on the substrate, also for the latter. Ammonium concentrations were measured using the Merck Ammonium Spectroquant® test kit 114739 (range 10–2.000 mgNH4-N L−1), whereas volatile fatty acids were determined by HPLC as previously described (Gonzalez-Gil and Holliger, 2011).
The 500-mL bottles were filled with either 450 g inoculum for the blanks or 450 g inoculum plus substrate for the other test bottles. The inoculum-substrate ratio (ISR) based on VS was in general 4, only for green waste an ISR of 1 was applied due to the low BMP of this substrate. The headspace was flushed with a mixture of N2 and CO2 (60%/40%; v/v) and the bottles closed with the specific stoppers of the AMPTS II system with the mixing device included. Test bottles were incubated at 37 ± 1°C with intermittent mixing (1 min every 15 min at 80% of maximal speed). The automatic removal of gas overestimation was inactivated since the flushing gas was not N2 only but a mixture of N2 and CO2. The blanks were carried out in duplicate, the substrates were assayed in triplicate, and for the positive control only one assay per BMP test was done. The BMP of the cellulose was 383 ± 18 NmLCH4 gVS−1 added for the 23 single-bottle BMPs determined, and all 23 measured BMPs for cellulose were within the range of 85–100% of the theoretical BMP allowing validation of the BMP test results (Holliger et al., 2016). The tests were terminated when the daily methane production was <1% of the total accumulated volume of methane produced.
The volume of accumulated methane of the blanks and substrates that are already normalized for dry gas under standard conditions (273.15 K and 101.33 kPa) by the AMPTS II are used to calculate the BMPs of the substrate. The average of the two blanks is subtracted from the methane gas volume determined for the three substrate batches to remove background methane production due to the inoculum. The remaining methane gas volume was divided by the mass of substrate VS added per batch. The average of the triplicates represents the BMP of the substrate which is expressed as NmLCH4 gVS−1. In order to take the variability of the replicates into account, the BMP of the substrate was calculated as follows:
Calculation of Methane Production by Full-Scale AD Plants from BMPs
The weekly methane production was calculated by multiplying the mass of individual substrate fed into the full-scale digesters on a weekly basis with the properties of the different substrates determined in the laboratory. The obtained methane production of the substrates were added up supposing additivity without synergistic or inhibitory effects. The methane production was calculated as follows:
where Q is the mass of substrate fed into the digesters per week [tons], TS is the total solids content of the substrate [%], VS is the volatile solids content of the substrate [%], and BMP is the biomethane potential of the substrate [Nm3CH4 tVS−1]. The data on the mass of substrates fed per week were provided by the operators of the two full-scale AD plants.
Calculation of Methane Production Measured by Full-Scale AD Plants
The methane production over the sampling period of approximately 6 months was calculated on a weekly basis. Although the biogas production is measured online at the full-scale plants and the methane content either online or manually, it was not used directly for the calculation of the methane production due to the imprecisions of full-scale plant’s instruments. The measured methane production was compared with the measured energy equivalents fed into the grids, either as electricity or natural gas for the study periods since these are measured very accurately by the companies running the grid systems. The energy equivalents injected into the grid were transformed into methane produced by applying a yield of 40% for the co-generation unit and 99% for the gas purification system, yields that are guaranteed by the suppliers of electricity and biomethane producing equipment and confirmed by the operators of the plants. To this volume of methane calculated from the grid operator data, the volume of methane flared, which was low but not negligible, was added. The latter was calculated by multiplying the hours of functioning during the 6 months with the nominal flow rate of the flare. Finally, the two volumes of methane, one measured with on-site instruments and one calculated from energy selling and flaring, were compared and resulted in a correction coefficient which was then applied to the measured daily methane production. Methane production and substrate quantities fed into the digesters were considered on a weekly basis. As the two AD plants are fed continuously and are operated under stable conditions (as far as it is possible on full-scale plants), it was assumed that a weekly period allows to get average representative data.
Results and Discussion
Additivity of Methane Production during Co-Digestion
The approach that was chosen to compare laboratory and full-scale methane production was to study two AD plants carrying out co-digestion and their different substrates. Since the additivity of methane production from two or more substrates is subject of controversy in the field of AD research (Astals et al., 2014; Ebner et al., 2016), and since BMP tests are based on additivity of methane production of the inoculum and the substrate, BMP tests with different mixtures of substrates from the two AD plants were carried out. Table 1 shows that the 10 co-digestion experiments resulted in a very similar methane production compared with the one calculated from BMPs of individual substrates. A Student’s t-test confirmed that the results have no statistically significant differences. Based on these results, only the BMPs of individual substrates were determined and used in this study.
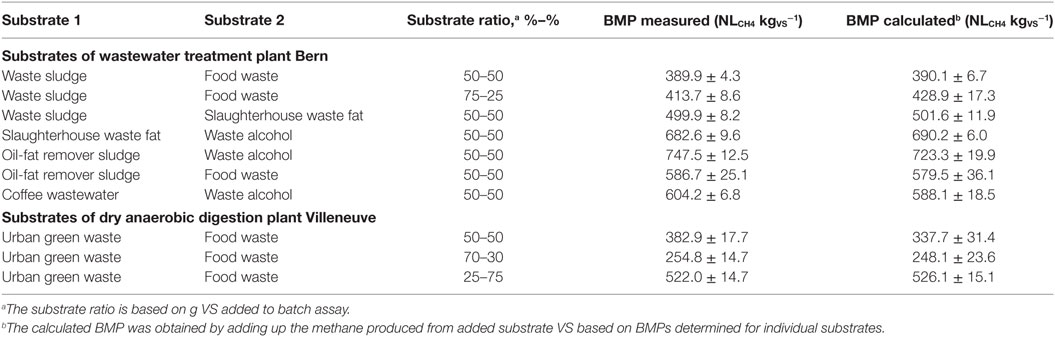
Table 1. Measured and calculated biomethane potentials (BMPs) of two-substrate mixtures.
Comparison of Measured and Calculated Methane Production of the Liquid AD Plant
The waste sludge of the WWTP Bern showed a very stable composition, which is reflected in its TS and VS content and the BMP (Table 2). Waste sludge was in terms of VS fed to the digester the most important substrate with on average 63.8 ± 2.6% of the total VS fed per week. The BMP of 407 ± 22 NLCH4 kgVS−1 determined for the waste sludge was similar to the BMP reported in another study (Zhu et al., 2011) and about one-third higher than the BMPs reported elsewhere (Davidsson et al., 2008; Luostarinen et al., 2009).
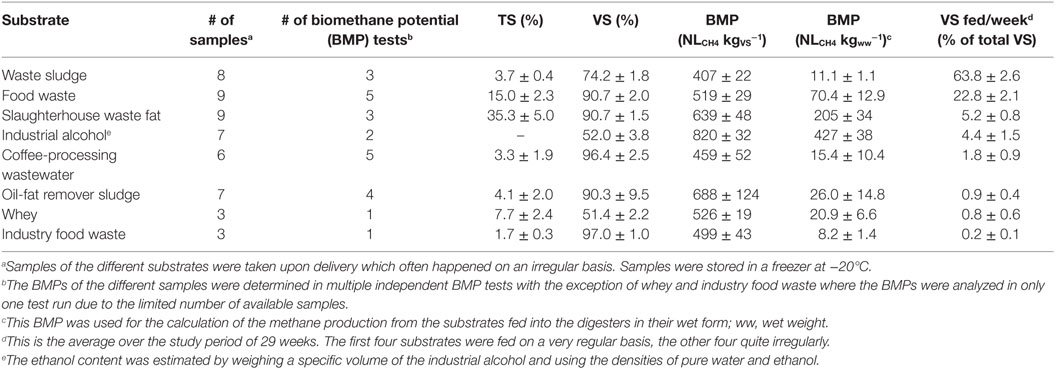
Table 2. Characteristics of substrates that were co-digested at the wastewater treatment plant Bern.
Food waste, slaughterhouse waste fat, and industrial alcohol were the most regularly fed cosubstrates at the WWTP Bern and accounted for 22.8 ± 2.1, 5.2 ± 0.8, and 4.4 ± 1.5% of the total VS fed per week, respectively (Table 2). The composition of these cosubstrates was similar to waste sludge also quite stable. The BMPs of food waste were in the order of magnitude of other studies (Davidsson et al., 2007; Zhang et al., 2007; Browne and Murphy, 2013), whereas the BMP of slaughterhouse waste fat was rather low for a substrate that should be dominated by lipids (Davidsson et al., 2008; Zhu et al., 2011). The industrial alcohol BMP was very close to the theoretical value for ethanol which is 832 NLCH4 kgVS−1.
The other four cosubstrates were fed in smaller quantities and had, for some of them, a quite varying composition reflected by their TS content but also their BMP as it was the case for oil-fat remover sludge (Table 2). The BMP of oil-fat remover sludge was lower compared with other studies reporting BMPs for grease trap waste that were between 850 and 1,000 NLCH4 gVS−1 (Davidsson et al., 2008; Zhu et al., 2011), whereas the BMP of whey was higher (Ergüder et al., 2001).
The total mass of substrate fed to the full-scale digesters of the WWTP was on average 5,253 ± 279 t per week during the study period of 29 weeks. This resulted in a residence time of 18–20 days, which is rather short for AD at a WWTP. The cosubstrates accounted for 11.6 ± 1.7% of the total mass fed per week. The total mass of VS fed per week was 200.3 ± 10.8 t and the cosubstrates accounted for 36.3 ± 2.2% of the VS fed. The methane production calculated from the mass fed per week and the BMPs of the individual substrates are depicted in Figure 1A. The methane production varied between 82,067 and 104,576 m3 per week and was on average 92,860 m3 per week. In total, 2,750,886 m3 of methane were produced during the study period of 29 weeks. The cosubstrates accounted for 44% of the methane produced and on average 463.5 ± 5.3 NLCH4 kgVS−1 was produced.
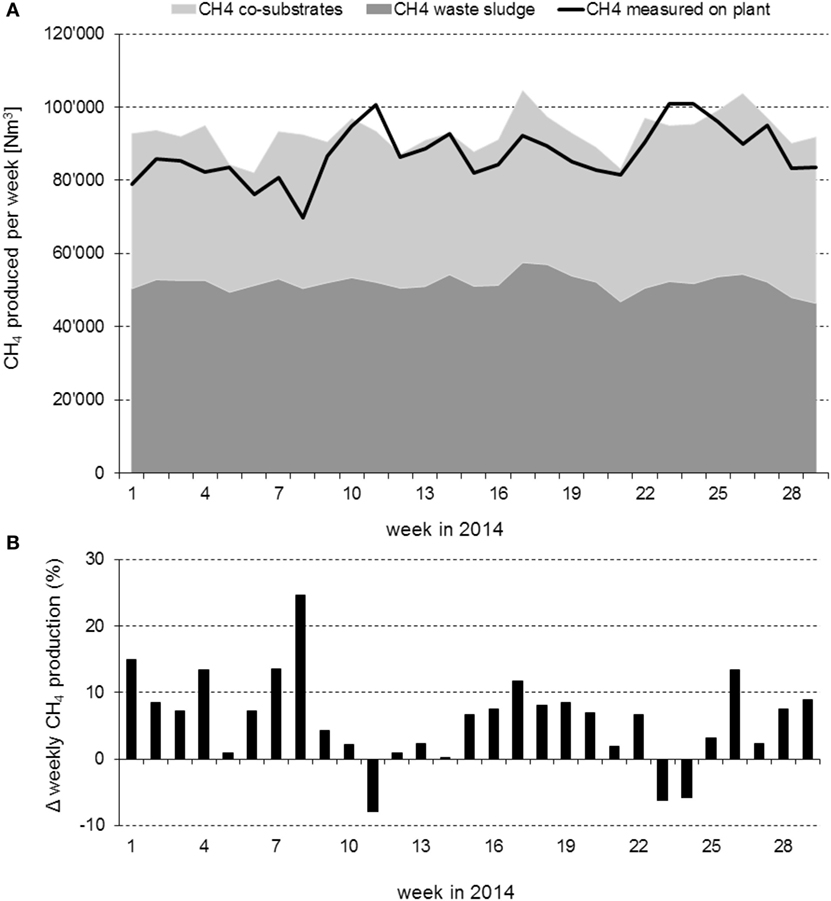
Figure 1. Weekly methane production at the wet anaerobic digestion plant over a period of 29 weeks. (A) Weekly methane production calculated from biomethane potentials of substrates and weekly organic loads (light and dark gray surfaces) and measured at the plant (black line). (B) Relative difference between measured and calculated methane production.
As described above, the methane production of the WWTP digesters was calculated from the on-site measured volume of biogas produced, the biomethane that was injected into the grid, and the flared surplus biogas. The flare was used on 38 days and in total 2.3% of the methane produced was flared. The measured methane production ranged from 69,721 to 100,930 m3 per week (Figure 1A) and was on average 87,247 m3 per week. The total methane production during 29 weeks was 2,569,907 m3 and on average 435.7 ± 31.9 NLCH4 kgVS−1 was produced.
All these numbers indicated that the methane production calculated from BMPs of individual substrates slightly overestimated the methane production produced in the full-scale installation. The latter accounted for 93.1% of the calculated methane production when taking the total production during 29 weeks into account. Figure 1B shows that for 26 out of 29 weeks the calculated methane production overestimated the measured one that accounted on average for 94.0 ± 6.8% of the calculated methane production.
Comparison of Measured and Calculated Methane Production of the Dry AD Plant
Green waste was the major substrate of the dry AD plant. The TS content of the waste collected from December to July decreased, indicating that the green waste was more humid in spring and summer (Table 3). VS content was rather stable during the period of study. The different seasonal composition is in agreement with another study that investigated composting of bio-waste collected during spring, summer, autumn, and winter (Hanc et al., 2016). The difference in green waste composition results apparently also in an organic fraction better amenable to anaerobic degradation since the BMP steadily increased and was more than double for waste of June and July compared with winter waste (Table 3).
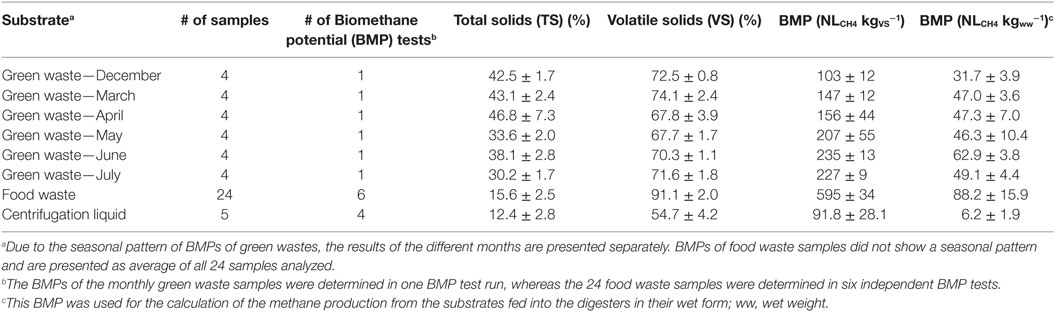
Table 3. Characteristics of substrates that were co-digested at the dry anaerobic digestion plant Villeneuve.
The food waste came from restaurants and supermarkets. It was first processed to remove non-biodegradable materials (mainly plastics), which implied a dilution with rather undefined volumes of water resulting in a varying TS content from one sample to another. For further calculations, it was decided to consider the average TS. The food waste had a high VS content and the BMP was on average about three times higher than the BMP of green waste (Table 3). Green waste and food waste accounted for 76.3 ± 5.7 and 23.7 ± 5.7% of the VS fed per week, respectively.
The total mass of substrate fed to the full-scale digesters of dry AD plant was 4810 t VS during the study period of 39 weeks. However, in contrast to the liquid AD plant, the organic load per week varied considerably due to seasonal production of green waste. It increased from 66.5 t VS per week during the first 12 weeks to 110.7 t during the last 12 weeks for green waste. The food waste accounted for 22.3% of the total mass fed and showed no seasonal pattern. The mass of VS originating from centrifugation liquid varied considerably and ranged from 0.3 to 10.7% of VS fed per week with an average 4.2 ± 2.8%. The methane production calculated from the mass fed per week and the BMPs of the individual substrates are depicted in Figure 2A. The methane production varied between 21,572 and 43,975 m3 per week and was on average 24,846 m3 per week for the months December to February, 34,447 m3 per week for the months March to May, and 37,371 m3 per week for the months June to August. In total, 1,234,193 m3 of methane were produced during the study period of 39 weeks. The food waste accounted for 50% of the methane produced and on average 259.7 ± 22.3 NLCH4 kgVS−1 was produced on the mixture of the two main substrates.
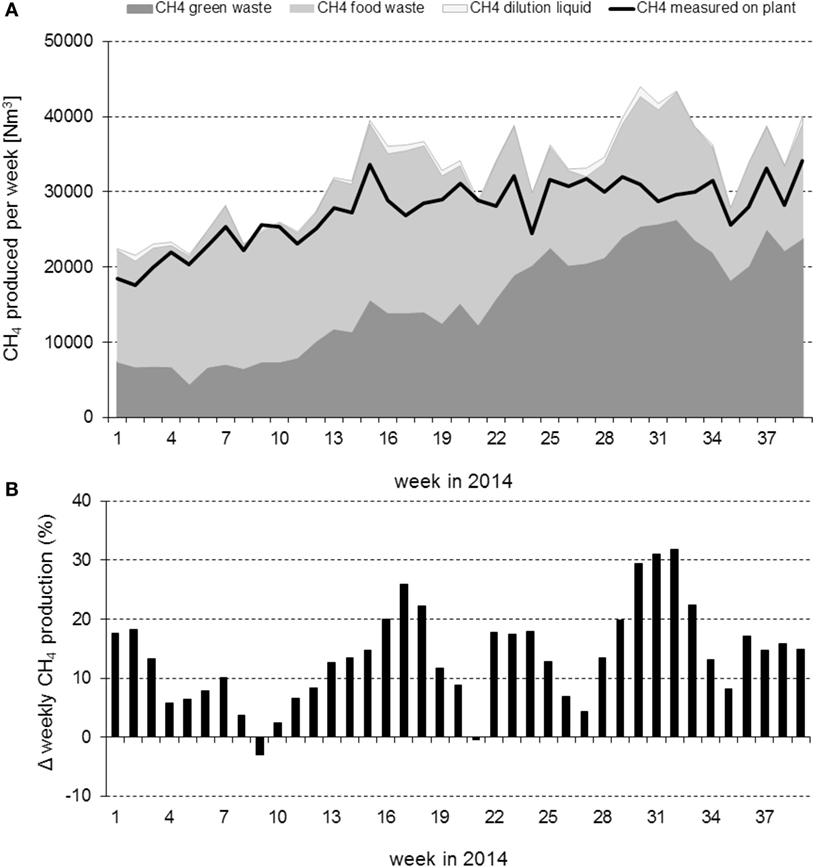
Figure 2. Weekly methane production at the dry anaerobic digestion plant over a period of 39 weeks. (A) Weekly methane production calculated from biomethane potentials of substrates and weekly organic loads (light and dark gray surfaces) and measured at the plant (black line). (B) Relative difference between measured and calculated methane production.
For the dry AD plant, the methane production was calculated from the electricity that was injected into the grid and the flared surplus gas. The flare was used very regularly and in total, 16.8% of the methane produced was flared. The measured methane production ranged from 18,509 to 34,126 m3 per week (Figure 2A) and was on average 22,756 m3 per week for the months December to February, 29,321 m3 per week for the months March to May, and 30,273 m3 per week for the months June to August. The total methane production during 39 weeks was 1,070,549 m3 and on average 224.2 ± 24.5 NLCH4 kgVS−1 was produced.
As it was the case for the data of the liquid AD plant, all these numbers indicated that the methane production calculated from BMPs of individual substrates overestimated the methane produced in the full-scale dry AD installation. The latter accounted for 86.7% of the calculated methane production when taking the total production during 39 weeks into account. Figure 2B shows that for 37 out of 39 weeks the calculated methane production overestimated the measured methane production that accounted on average for 86.3 ± 8.1% of the calculated one. However, the organic loads applied during weeks 16–18 and 29–33 indicated an overload of the digesters which resulted in an incomplete degradation of the substrates fed. Therefore, the overestimation of the potential methane production based on BMPs was even higher during these periods and biased by this incomplete degradation due to the overload of the system. If the data of these periods were not taken into account, the measured methane production accounted for 89.3 ± 5.7% of the calculated one. For the weeks with overload, the measured methane production only accounted for 74.6 ± 4.9% of the calculated one.
Scale Effect of AD of Substrates Used in Co-Digestion
Several studies addressed the question of scale effects of AD by comparing batch experiments at about the 1-L scale with pilot-scale reactors operated in semi- and continuous mode. When examining the relationship between results obtained with BMP tests and sub pilot-scale reactors (100-L), it was concluded that BMPs of feedstock co-digestion mixtures could quite accurately estimate the range of methane produced by three 100-L plug-flow reactors (Sell et al., 2011). In this study, the BMP of the substrate mixture varied significantly and the BMPs were used to define the maximum and minimum BMP-predicted, daily methane production which have been approximately 80 and 40 LCH4 day−1. The daily methane production of the three 100-L plug-flow reactors remained within these limits. This means, however, that the daily methane production could not be predicted more accurately than within a range of a factor of 2. Other studies obtained similar results as the present study. Comparing BMPs of different types of tannery waste (fleshings, skin trimmings, and wastewater sludge) with methane production of reactors operated semicontinuously showed that the latter produced 79–93% of the methane calculated from the BMPs of the individual substrates (Zupančič and Jemec, 2010). Mixing solid and liquid food waste resulted in methane yields obtained in semicontinuously operated reactors that were between 60 and 80% of the yields obtained with batch tests (Zhang et al., 2013). Methane yields obtained with a 300-L pilot-scale reactor was approximately 80% of that obtained from the smaller scale test (Ruffino et al., 2015). Small differences between BMPs and methane yields obtained with a 1700-L fermenter were observed for wastes from macroalgae processed for biofuel, pharmaceutical, or food industries (Barbot et al., 2015). Overall these different studies indicate that batch tests provide a good estimate of the methane yield that can be obtained at larger scale, however, in general with a slight overestimation.
The present study compared BMPs determined at laboratory scale in 500-mL batch reactors with methane production obtained in full-scale installations. For both installations with wet or dry AD, the weekly methane production was in general overestimated by about 10%. For the wet AD installation, the overestimation was on average 6.0 ± 6.8%, for the dry AD process it was 10.6 ± 5.8% when excluding periods with organic overload. Hence, this is in line with the results of the studies comparing BMPs with methane yields of pilot-scale reactors.
The slightly higher overestimation for the dry AD process is probably due to its quite different conditions compared to the batch tests. The full-scale digester is a plug-flow type reactor operated with a TS content of around 25% and a substrate particle size of several centimeters. The batch tests are carried out with approximately 5% TS in a completely mixed vessel with substrate particle sizes below 10 mm.
Conclusion
This study showed that the methane production calculated from BMPs of the digested substrates and their specific organic loads compared well with the methane production measured on site, however with a clear tendency of overestimation of the latter. For the two AD plants, the measured weekly methane production was significantly lower than the calculated methane production for 26 out of 29 and 37 out of 39 weeks, respectively, and it accounted for 94.0 ± 6.8 and 89.3 ± 5.7% of the calculated methane production. Based on these results, we concluded that BMPs can be used to estimate with confidence the methane production for the design and operation of full-scale installations if the substrates are well characterized and do not lack any nutrients, and if the operating parameters are adapted to the substrates and the AD process. However, an extrapolation coefficient of at least 0.8–0.9 should be applied to avoid overestimating the methane production and the corresponding techno-economic potential of the planned AD plant.
Author Contributions
CH conceived and designed the study, supervised the experimental work, and wrote the manuscript, GH carried out the experimental work, HFL conceived and designed the study, calculated the methane production of the plants, and revised the manuscript.
Conflict of Interest Statement
The authors declare that the research was conducted in the absence of any commercial or financial relationships that could be construed as a potential conflict of interest.
Acknowledgments
This research was financed by the Swiss Federal Office for Energy through the project no. 154365/103311. The authors are grateful to the operators Andreas Schiller (AraBern) and Julien Dovat (SATOM Villeneuve) of the two full-scale AD plants for the pleasant collaboration, the help with sampling, and providing the data of biogas and methane/energy production at full scale.
References
Angelidaki, I., Alves, M., Bolzonella, D., Borzacconi, L., Campos, J. L., Guwy, A. J., et al. (2009). Defining the biomethane potential (BMP) of solid organic wastes and energy crops: a proposed protocol for batch assays. Water Sci. Technol. 59, 927–934. doi: 10.2166/wst.2009.040
Astals, S., Batstone, D. J., Mata-Alvarez, J., and Jensen, P. D. (2014). Identification of synergistic impacts during anaerobic co-digestion of organic wastes. Bioresour. Technol. 169, 421–427. doi:10.1016/j.biortech.2014.07.024
Bachmann, N., Jansen, J., Bochmann, G., and Montpart, N. (2015). “Sustainable biogas production in municipal wastewater treatment plants,” ed. D. Baxter, IEA Bioenergy.
Barbot, Y. N., Thomsen, C., Thomsen, L., and Benz, R. (2015). Anaerobic digestion of laminaria japonica waste from industrial production residues in laboratory- and pilot-scale. Mar. Drugs 13, 5947–5975. doi:10.3390/md13095947
Bodík, I., Sedláček, S., Kubaská, M., and Hutňan, M. (2011). Biogas production in municipal wastewater treatment plants – current status in EU with a focus on the Slovak Republic. Chem. Bioch. Eng. Q. 25, 335–340.
Browne, J. D., and Murphy, J. D. (2013). Assessment of the resource associated with biomethane from food waste. Appl. Energy 104, 170–177. doi:10.1016/j.apenergy.2012.11.017
Dave, A., Huang, Y., Rezvani, S., Mcilveen-Wright, D., Novaes, M., and Hewitt, N. (2013). Techno-economic assessment of biofuel development by anaerobic digestion of European marine cold-water seaweeds. Bioresour. Technol. 135, 120–127. doi:10.1016/j.biortech.2013.01.005
Davidsson, Å, Gruvberger, C., Christensen, T. H., Hansen, T. L., and Jansen, J. L. C. (2007). Methane yield in source-sorted organic fraction of municipal solid waste. Waste Manag. 27, 406–414. doi:10.1016/j.wasman.2006.02.013
Davidsson, Å, Lövstedt, C., La Cour Jansen, J., Gruvberger, C., and Aspegren, H. (2008). Co-digestion of grease trap sludge and sewage sludge. Waste Manag. 28, 986–992. doi:10.1016/j.wasman.2007.03.024
Ebner, J. H., Labatut, R. A., Lodge, J. S., Williamson, A. A., and Trabold, T. A. (2016). Anaerobic co-digestion of commercial food waste and dairy manure: characterizing biochemical parameters and synergistic effects. Waste Manag. 52, 286–294. doi:10.1016/j.wasman.2016.03.046
Ergüder, T. H., Tezel, U., Güven, E., and Demirer, G. N. (2001). Anaerobic biotransformation and methane generation potential of cheese whey in batch and UASB reactors. Waste Manag. 21, 643–650. doi:10.1016/S0956-053X(00)00114-8
Gonzalez-Gil, G., and Holliger, C. (2011). Dynamics of microbial community structure of and enhanced biological phosphorus removal by aerobic granules cultivated on propionate or acetate. Appl. Environ. Microbiol. 77, 8041–8051. doi:10.1128/AEM.05738-11
Hanc, A., Ochecova, P., and Vasak, F. (2016). Changes of parameters during composting of bio-waste collected over four seasons. Environ. Technol. 1–14. doi:10.1080/09593330.2016.1246611
Holliger, C., Alves, M., Andrade, D., Angelidaki, I., Astals, S., Baier, U., et al. (2016). Towards a standardization of biomethane potential tests. Water Sci. Technol. 74, 2515–2522. doi:10.2166/wst.2016.336
Luostarinen, S., Luste, S., and Sillanpää, M. (2009). Increased biogas production at wastewater treatment plants through co-digestion of sewage sludge with grease trap sludge from a meat processing plant. Bioresour. Technol. 100, 79–85. doi:10.1016/j.biortech.2008.06.029
Mata-Alvarez, J., Dosta, J., Macé, S., and Astals, S. (2011). Codigestion of solid wastes: a review of its uses and perspectives including modeling. Crit. Rev. Biotechnol. 31, 99–111. doi:10.3109/07388551.2010.525496
Mata-Alvarez, J., Dosta, J., Romero-Güiza, M. S., Fonoll, X., Peces, M., and Astals, S. (2014). A critical review on anaerobic co-digestion achievements between 2010 and 2013. Renew. Sustain. Energ. Rev. 36, 412–427. doi:10.1016/j.rser.2014.04.039
Raposo, F., De La Rubia, M. A., Fernández-Cegrí, V., and Borja, R. (2012). Anaerobic digestion of solid organic substrates in batch mode: an overview relating to methane yields and experimental procedures. Renew. Sustain. Energ. Rev. 16, 861–877. doi:10.1016/j.rser.2011.09.008
Raposo, F., Fernández-Cegrí, V., De La Rubia, M. A., Borja, R., Béline, F., Cavinato, C., et al. (2011). Biochemical methane potential (BMP) of solid organic substrates: evaluation of anaerobic biodegradability using data from an international interlaboratory study. J. Chem. Technol. Biotechnol. 86, 1088–1098. doi:10.1002/jctb.2622
Ruffino, B., Fiore, S., Roati, C., Campo, G., Novarino, D., and Zanetti, M. (2015). Scale effect of anaerobic digestion tests in fed-batch and semi-continuous mode for the technical and economic feasibility of a full scale digester. Bioresour. Technol. 182, 302–313. doi:10.1016/j.biortech.2015.02.021
Sell, S. T., Burns, R. T., Moody, L. B., and Raman, D. R. (2011). Comparison of methane production from bench- and sub pilot-scale anaerobic digesters. Appl. Eng. Agric. 27, 821–825. doi:10.13031/2013.39570
Shen, Y., Linville, J. L., Urgun-Demirtas, M., Mintz, M. M., and Snyder, S. W. (2015). An overview of biogas production and utilization at full-scale wastewater treatment plants (WWTPs) in the United States: challenges and opportunities towards energy-neutral WWTPs. Renew. Sustain. Energ. Rev. 50, 346–362. doi:10.1016/j.rser.2015.04.129
Zamalloa, C., Vulsteke, E., Albrecht, J., and Verstraete, W. (2011). The techno-economic potential of renewable energy through the anaerobic digestion of microalgae. Bioresour. Technol. 102, 1149–1158. doi:10.1016/j.biortech.2010.09.017
Zhang, C., Su, H., and Tan, T. (2013). Batch and semi-continuous anaerobic digestion of food waste in a dual solid-liquid system. Bioresour. Technol. 145, 10–16. doi:10.1016/j.biortech.2013.03.030
Zhang, R., El-Mashad, H. M., Hartman, K., Wang, F., Liu, G., Choate, C., et al. (2007). Characterization of food waste as feedstock for anaerobic digestion. Bioresour. Technol. 98, 929–935. doi:10.1016/j.biortech.2006.02.039
Zhu, Z., Hsueh, M. K., and He, Q. (2011). Enhancing biomethanation of municipal waste sludge with grease trap waste as a co-substrate. Renew. Energy 36, 1802–1807. doi:10.1016/j.renene.2010.11.014
Keywords: anaerobic digestion, biogas, biomethane potential, full-scale installation, co-digestion
Citation: Holliger C, Fruteau de Laclos H and Hack G (2017) Methane Production of Full-Scale Anaerobic Digestion Plants Calculated from Substrate’s Biomethane Potentials Compares Well with the One Measured On-Site. Front. Energy Res. 5:12. doi: 10.3389/fenrg.2017.00012
Received: 28 February 2017; Accepted: 22 May 2017;
Published: 09 June 2017
Edited by:
Junye Wang, Athabasca University, CanadaReviewed by:
Ihsan Hamawand, University of Southern Queensland, AustraliaHairong Yuan, Beijing University of Chemical Technology, China
Copyright: © 2017 Holliger, Fruteau de Laclos and Hack. This is an open-access article distributed under the terms of the Creative Commons Attribution License (CC BY). The use, distribution or reproduction in other forums is permitted, provided the original author(s) or licensor are credited and that the original publication in this journal is cited, in accordance with accepted academic practice. No use, distribution or reproduction is permitted which does not comply with these terms.
*Correspondence: Christof Holliger, Y2hyaXN0b2YuaG9sbGlnZXJAZXBmbC5jaA==