 Ganeshprasad Pavaskar1*
 Krishnaprasath Ramakrishnasubramanian
 Parveen Kumar
- 1Center for Study of Science, Technology and Policy, Bangalore, India
- 2Department of Chemical Engineering, Indian Institute of Science, Bangalore, India
Supercapacitors deliver higher power than batteries and find applications in grid integration and electric vehicles. Recent work by Chmiola et al. (2006) has revealed unexpected increase in the capacitance of porous carbon electrodes using ionic liquids as electrolytes. The work has generated curiosity among both experimentalists and theoreticians. Here, we have performed molecular simulations using a recently developed technique (Punnathanam, 2014) for simulating supercapacitor system. In this technique, the two electrodes (containing electrolyte in slit pore) are simulated in two different boxes using the Gibbs ensemble methodology. This reduces the number of particles required and interfacial interactions, which helps in reducing computational load. The method simulates an electric double-layer capacitor (EDLC) with macroscopic electrodes with much smaller system sizes. In addition, the charges on individual electrode atoms are allowed to vary in response to movement of electrolyte ions (i.e., electrode is polarizable) while ensuring these atoms are at the same electric potential. We also present the application of our technique on EDLCs with the electrodes modeled as slit pores and as complex three-dimensional pore networks for different electrolyte geometries. The smallest pore geometry showed an increase in capacitance toward the potential of 0 charge. This is in agreement with the new understanding of the electrical double layer in regions of dense ionic packing, as noted by Kornyshev’s theoretical model (Kornyshev, 2007), which also showed a similar trend. This is not addressed by the classical Gouy–Chapman theory for the electric double layer. Furthermore, the electrode polarizability simulated in the model improved the accuracy of the calculated capacitance. However, its addition did not significantly alter the capacitance values in the voltage range considered.
Introduction
The renewable energy (RE) is gaining prominence over fossil fuels giving rise to the necessity of energy storage systems for RE integration. Electrochemical storage systems can be deployed at various scales unlike mechanical storage systems. They can be used in large grid-scale, small scale off-grid applications including electric vehicles and consumer electronics. The Li-ion battery provides the best electrochemical properties but is very expensive for large-scale deployment. Lead acid batteries, however, are cheaper but exhibit lower energy and power density (Parfomak, 2012). Supercapacitors are electrochemical storage systems that store energy in two ways, static double-layer capacitance and electrochemical pseudo-capacitance (Christen and Carlen, 2000). Supercapacitors are becoming more and more attractive because of their high-specific power, fast charge acceptance, and excellent cycle life (Smith et al., 2011). According to Maxwell industries, electromechanical pitch systems that contain supercapacitors provide significant advantages to wind turbine systems (Werkstetter, 2015). These advantages over conventional batteries are long life, predictable aging, wide operating temperature range, and being light weight. The main disadvantages associated with supercapacitors are low-specific energy, high self-discharge (which makes them unattractive for stand by storage purposes), and the cost. However, it is seen that supercapacitor prices have continued to decline more rapidly than batteries (Gogotsi, 2014).
In 2006, Chmiola et al. (2006) showed anomalous increase in capacitance at very small pore sizes (<1 nm). They concluded that traditional belief of continuous decrease in capacitance (Shi, 1996; Pandolfo and Hollenkamp, 2006) with pore size is not correct by showing that the capacitance increases with the decrease in pore size of subnanometer pores. Since then, many researchers have tried to explain this behavior. Later, Chimola et al. also showed that increase in the confinement of the ions leads to enhancement in the capacitance (Largeot et al., 2008). Inclusion of the effect of partial desolvation of ions in the current double-layer theory could lead to a better understanding of the behavior of ions in confined environments. Many researchers are trying to understand fundamental aspects of the electric double-layer capacitance and pseudo-capacitance for enhanced storage properties.
The classical double-layer theories have limitations in explaining the behavior at confined regions of double-layer supercapacitors. Continuum level theories for double-layer formation such as the Gouy–Chapman theory, Stern theory are limited to treatment of dilute or moderate concentrations of electrolytes (Kornyshev, 2007; Perkin et al., 2013). Deviation from these theories is observed for dense ionic systems such as ionic liquids (ILs) which are increasingly being used in supercapacitors. They can be used without a solvent, which results in high concentration of ions inside the porous electrodes. Capacitance for these systems has a maximum at 0 potential rather than a minimum which is predicted by Gouy–Chapman–Stern model for low dilute electrolytes.
The main challenge in modeling EDLCs is to simulate the electrode polarizability, which directly affects ionic organization at its interface with the electrolyte. It may also be required to further calculate electron transfer processes between the electrode and electrolyte (Petersen et al., 2012). Several methods have been trialed in the literature to model electrodes (Siepmann and Sprik, 1995; Straus et al., 1995; Calhoun and Voth, 1996; Crozier et al., 2000; Lanning and Madden, 2004; Fedorov and Kornyshev, 2008; Lamperski and Kłos, 2008; Wang et al., 2014). Initial attempts included assigning the individual electrode atoms with fixed partial charges, which summed up to equal to the total electrode charge (this was know as the constant charge approach) (Lanning and Madden, 2004). Siepmann and Sprik (1995) proposed a more realistic approach (using a metal electrode) by representing the atomic charges as diffuse Gaussian charges. During simulations, the charges were varied in response to electrolyte movement, by minimizing the total coulombic energy under the constraint of constant voltage. Other researchers have further applied the method to explore complicated electrode electrolyte interfaces (Reed et al., 2007; Willard et al., 2009; Merlet et al., 2012). For example, Merlet et al. (2012) were able to simulate a highly porous carbon electrode interfacing with IL electrolyte to explore the role of subnanometer pores on supercapacitance in the system. Although realistic, the method is computationally expensive due to additional computational cost due to energy minimization. Voth et al. (Petersen et al., 2012) have recently proposed an alternate method using method of images, which is computationally less expensive. In this work, we present a simpler method to simulate electrode polarization, which also does not involve energy minimization calculations. In this method, the electrode charges are varied randomly, and the new states are either accepted or rejected according to the Boltzmann criterion. Therefore, there is very little added computational cost.
Molecular simulation techniques (Kiyohara and Asaka, 2007a,b; Yang et al., 2009; Kiyohara et al., 2010; Perkin et al., 2013) and molecular dynamics studies (Merlet et al., 2012) successfully provide insights into development of capacitance at the nanoscale and the workings of an electrical double-layer capacitor. Most of the molecular simulations of EDLCs reported till date consider both the electrodes and the electrolyte region in a single simulation box. Those simulations simulate the electrode–electrolyte interface as well as electrolyte in the bulk. Hence, a larger simulation box is required, which increases the computational load. A simulation technique that focuses only on the electrolyte–electrode interface would be beneficial in speeding-up the simulation. Such an approach is shown by Kiyohara et al. (Kiyohara and Asaka, 2007a,b; Yang et al., 2009; Kiyohara et al., 2010), wherein EDLC was modeled as slit pores in constant voltage grand canonical ensemble, which does not require simulation of electrolyte bulk. Furthermore, Punnathanam (2014) showed that the two electrodes can be simulated in two different boxes using Monte Carlo technique in Gibbs ensemble. This method is computationally efficient as it does not require simulation of the bulk electrolyte, enabling quick equilibration at low system sizes. We therefore extend this technique (Punnathanam, 2014) of molecular simulation of supercapacitors by addition of a novel move of charge variation (CV) on electrode atoms.
Simulation Methodology
We have studied mechanism of EDLC using Monte Carlo simulations in Gibbs ensemble. The study consists of simulating the two electrodes in separate simulation boxes, with the positive electrode in box I and the negative electrode in box II (Figure 1). The Metropolis algorithm consisting of various Monte Carlo moves is derived from the methodology by Punnathanam (2014). The five moves used are translation, insertion of ion pairs, deletion of ion pairs, charge plus ion transfer, and electrode CV; all of them are explained further in this paper. Certain other moves such as simultaneous charge and ion transfer between the two electrodes/boxes are not possible as they violate charge-neutrality requirement in a box. The underlying reason for such a condition is that the two electrodes are essentially charge-neutral at large separations, as shown by Punnathanam (2014).
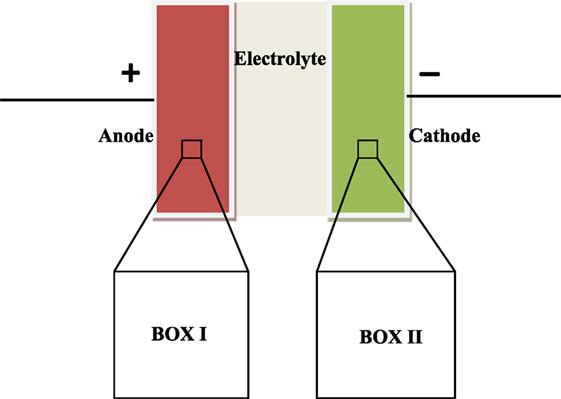
Figure 1. Schematic of two box EDLC model. A microscopic region of each electrode is simulated in separate simulation box. Periodic boundary conditions are applied in all the three directions to get macroscopic properties.
The partition function (Kiyohara and Asaka, 2007a,b; Limmer et al., 2013) for EDLC in the constant voltage grand canonical ensemble, Ξ, is given by the following equation:
where and are the number of anions and cations in box I, respectively. Similarly, and are in box II. The total number of anions or cations is denoted by N. Hence,
Each simulation box is electrically neutral, i.e.,
The Monte Carlo moves used in the simulations are explained below. Their acceptance criteria are derived by application of detailed balance. An electrode is chosen randomly for each step following Monte Carlo moves.
1. Translation move: in a translation move, an ion is displaced randomly (with random magnitude and direction). The acceptance criteria is given by the following equation:
2. Insertion move: in this move, an ion pair is inserted in the pores of an electrode. The acceptance criteria is given by the following equation:
where z = q2eβμ is the activity of an ion pair.
3. Deletion move: in this move, an ion pair is deleted from the pores of an electrode. The acceptance criteria is as follows:
4. Charge plus ion transfer: in this move, a randomly picked ion is transferred from one electrode to the other with simultaneous transfer of charge to maintain constant net charge in each box. Acceptance criteria for an anion transfer from box I to box II is given by following equation:
Acceptance criteria for cation transfer from box II to box I transfer can be obtained by modifying the above equation accordingly.
5. CV move: this move takes into account charge polarization on electrode atoms induced by electrolyte molecules. In such a move, two neighboring atoms are picked randomly. Random amount of charge is added in one atom and subtracted from the other, ensuring net change in total charge is 0. Since this change occurs within an electrode, no work is done against the voltage. The acceptance criteria is given by,
Model
Electrolyte Ions
Our model for electrolyte is representative of a pure IL phase consisting of charged hard spheres. We use restricted primitive model (RPM) to simulate these IL. Both the cations and anions are monovalent, with same diameter “d.” According to RPM, interaction between the ions uij is given by the following equation:
where Zi and Zj are the charges on ions i and j, respectively, and rij is the distance between ion i and j. The parameters used in the simulation are scaled by the following factors:
1. The length scale is the hard sphere diameter of the ions, d.
2. The volume scale is volume of unit cell, V = L3. L is length of unit cell.
3. The charge scale is electronic charge, e = 1.6 × 10⁻¹⁹ C.
4. The temperature scale is ε/kB.
5. The energy scale is ε = e2/(4πε0εr d).
6. The voltage scale is ε/e = e/(4πε0εr d).
7. The capacitance scale is e2/ε = (4πε0εr d).
The interactions between atoms, which are beyond cutoff distance, are calculated as long range interaction energy. The long-range interactions are calculated using Ewald summation in Fourier space. The variable ε0 is the permittivity of free space, and εr is the dielectric constant of the solvent. The value of the dielectric constant is not known accurately for modeling the ILs by the RPM model. The value εr = 2 reflects electronic polarizability of simple ions. For complex IL molecules, εr is >2 due to other non-electronic internal degrees of freedom (Shim and Kim, 2010).
Electrode Atoms
Electrodes are modeled as three-dimensional porous crystalline structures, which resemble a cubic wire mesh. Initial configuration consists only of electrode atoms, with equal charge on each atom. Positions of the atoms are fixed, but unlike previous work (Limmer et al., 2013), CV move tends to redistribute the charges during simulation. Periodic boundary conditions are imposed in all the three (X, Y, Z) directions. Three different electrode geometries are used to study the effect of pore widths on capacitance. The geometries (a) and (b) each has four electrode atoms per unit cell whereas geometry (c) has seven electrode atoms per unit cell. The diameter of each atom is “d,” and the unit cell length of geometries (a), (b), and (c) are 2d, 3d, and 3d, respectively. Geometries (a) and (c) are closely packed while (b) is loosely packed. These toy models depict a cubic wire mesh arrangement. Punnathanam (Punnathanam, 2014) also studied system size effects on charge densities per unit cell and concluded that the results converged within 27 unit cells per system. Hence, 27 unit cells per simulation box were chosen (i.e., 3 unit cells in each direction) for this study. Geometry (a) corresponds to a very confined space for ions (close to subnanometer pores), while geometries (b) and (c) correspond to bigger pore size (Figure 2).
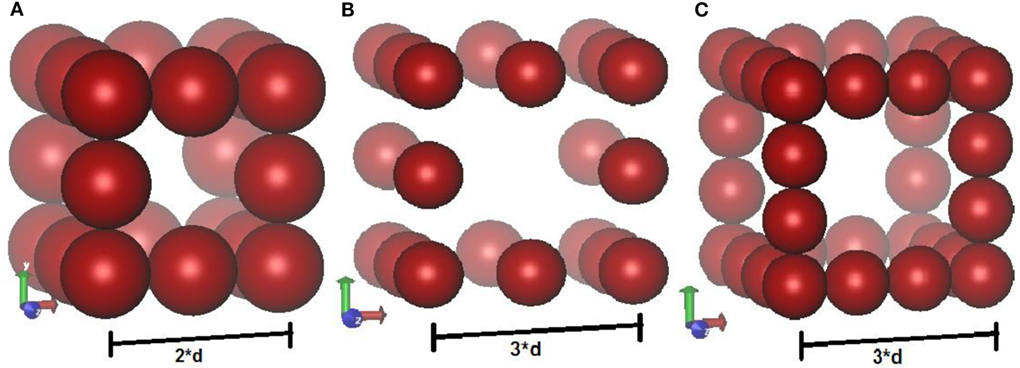
Figure 2. Schematic of three different structures of electrodes used in the simulations. Geometries (A,B) each has four atoms per unit cell. Geometry (B) is loosely packed whereas the other two structures are close packed. Geometry (C) has seven atoms per unit cell. Each structure is repeated in three dimensional to have 27 unit cells in each box.
Simulation Details
A simulation consists of 104 equilibrium and 105 production cycles, wherein each cycle consists of 100 or N (whichever is greater) MC moves. Where N is the total number of ions in a box at the start of every cycle. This means the minimum number of moves in a cycle is 100. As mentioned earlier, the starting configuration consists of only the electrode atoms. The electrolyte activity is chosen from preliminary simulations at conditions mentioned in Table 1. The corresponding packing fractions of the electrolyte ions under bulk conditions is obtained as η = (NA + NC) × d3/V.
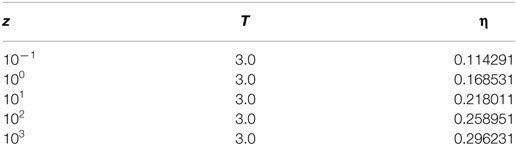
Table 1. Values of the activity, z, and temperature, T, used in the simulation along with the corresponding values of the packing fraction, η, are listed below.
The activity value of 103 led to a close match between our simulations and the experiments reported in Largeot et al. (2008). At room temperature, ILs usually have high viscosity and lower ionic conductivity (4–14 m S/cm2), which are unfavorable for EDLC performance. Hence, they need to be used at high temperature (400 K). The parameters used in the simulations are, electrolyte ion diameter; d = 0.7 nm, temperature, T = 400 K, εr = 2, and voltage in the range 0.1–1.75 V. Each simulation is run five times. The averages of these five independent simulations with errors bars (95% confidence interval) are reported in the results section.
Results and Discussions
We modeled the electrode polarizability with Monte Carlo simulations in Gibbs ensemble by implementing the CV move (Punnathanam, 2014) and studied its effect on the electric double layer. The system is simulated at temperature T* = 3.0 and activity Z = 10−3 for all the three electrode geometries. The results can be analyzed into three parts as, the effects of confinement/pore size, voltage, and CV moves on the overall capacitance (Figures 3–9).
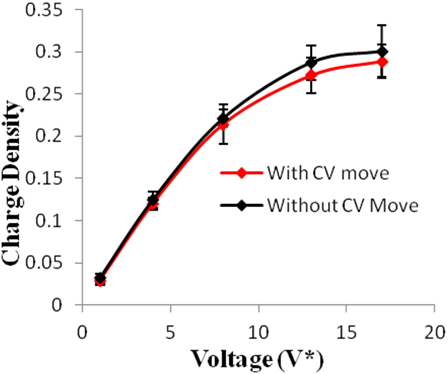
Figure 3. Charge density of electrodes versus applied voltage for geometry (a). The simulations were performed for z = 10−3, T* = 3.0. The red points represent the simulation results with charge variation (CV) move. The black points represent the simulation results without using CV move. Size of error bars reduces in simulations with CV moves.
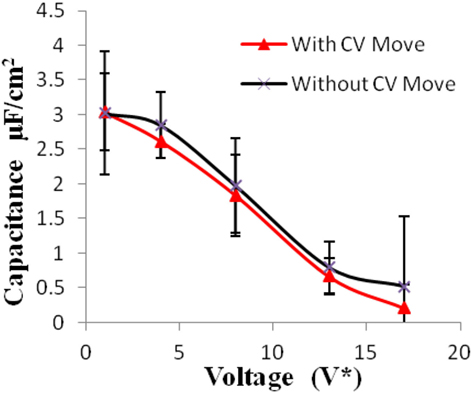
Figure 4. Specific capacitance of electrodes versus applied voltage for geometry (a). The simulations were performed for z = 10−3, T* = 3.0. The red points represent the simulation results with charge variation (CV) move. The black points represent the simulation results without using CV move. Size of error bars reduces in simulations with CV moves.
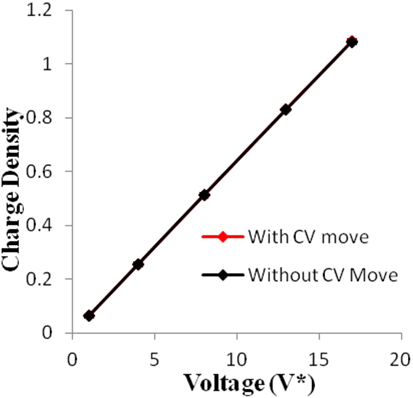
Figure 5. Charge density of electrodes versus applied voltage for geometry (b). The simulations were performed for z = 10−3, T* = 3.0. The red points represent the simulation results with charge variation (CV) move. The black points represent the simulation results without using CV move.
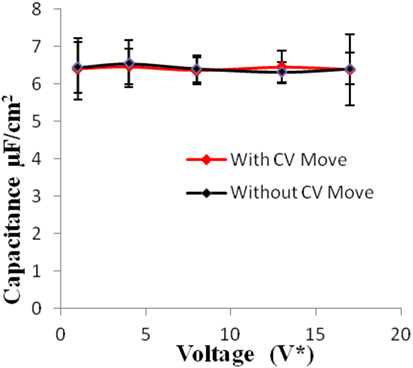
Figure 6. Specific capacitance of electrodes versus applied voltage for geometry (b). The simulations were performed for z = 10−3, T* = 3.0. The red points represent the simulation results with charge variation (CV) move. The black points represent the simulation results without using CV move.
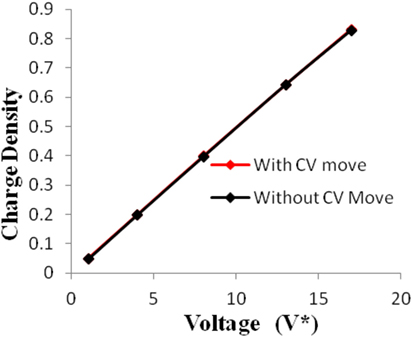
Figure 7. Charge density of electrodes versus applied voltage for geometry (c). The simulations were performed for z = 10−3, T* = 3.0. The red points represent the simulation results with charge variation (CV) move. The black points represent the simulation results without using CV move.
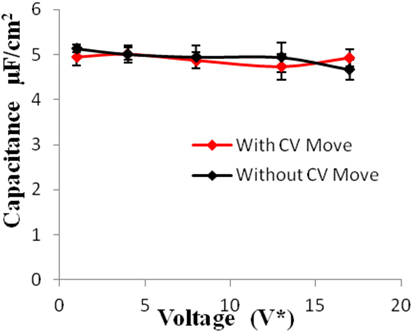
Figure 8. Specific capacitance of electrodes versus applied voltage for geometry (c). The simulations were performed for z = 10−3, T* = 3.0. The red points represent the simulation results with charge variation (CV) move. The black points represent the simulation results without using CV move. Size of error bars reduces in simulations with CV moves.
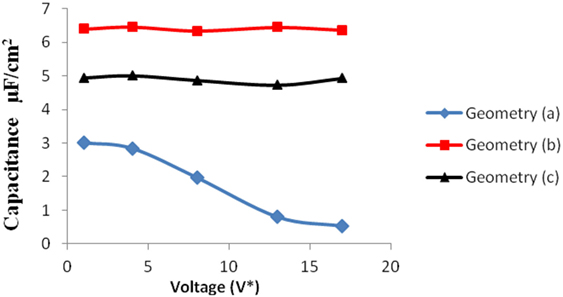
Figure 9. Comparison of specific capacitance versus voltage for all the three geometries. The blue, red, and black points represent the results for geometry (a), (b), and (c), respectively.
Geometry (a) is the most confined structure studied. Charge density is expressed as the ratio of reduced charge and the number of electrode atoms and directly affects the capacitance. Figure 3 shows that for this geometry the charge density increased non-linearly with voltage, unlike in other geometries (Figures 5 and 7), wherein the change was linear. The result highlights an important distinction in the light of new understanding of the behavior of highly confined ions in contact with an electrochemical interface. Kornyshev (2007) noted, using a lattice gas model, that, at high packing fraction, the ionic concentration looked more like Fermi distributions rather than Boltzmann distributions, due to the lattice saturation effects. Therefore, the conventional theories such as the Gouy–Chapman theory (Kornyshev, 2007; Perkin et al., 2013) are unable to correctly reproduce the trend at high packing fraction. Furthermore, the electric potential profile very close to electrode interface as predicted by Kornyshev’s model (Kornyshev, 2007), is less steeper than that given by the Gouy–Chapman theory. The analytical model (Kornyshev, 2007) predicted a maximum in capacitance (a bell-shaped curve) at the potential of 0 charge. Therefore, as seen in Figure 4, the model is able to qualitatively reproduce this trend at high ionic packing fraction. The behavior in Figures 3 and 4 is also indicative of the situations when volume effects become important (i.e., effect of confinement). At lower voltages, the ions can readily fill the pore volume, resulting in a higher differential capacitance. However, the differential capacitance decreases with increasing voltage for the geometry as the pore can no longer accommodate additional ions/charges. The packing fraction of ions increases with voltage, resulting in a higher charge density. It is seen that error in estimation of charge density and capacitance decreases with the addition of CV move.
We simulated the system at moderately high packing fraction. This resulted in relatively low acceptance of insertion/deletion moves. An increase in capacitance with electrode pore size (for pores >2 nm in diameter) is usually seen in the literature, due to higher adsorption in larger pores owing to their increased surface area. In our work, the geometries (b) and (c) exhibit this behavior. In these pores, the diffuse layer of the electrolyte ions adjacent to the electrode surface accounted for most of the potential drop. However, in subnanometer pores, in pores whose dimensions are closer to that of the ionic diameters, the ions distort their solvation shells while entering the pores. This effectively reduces the screening due to the solvation shell and increases the net interaction between electrolyte and the electrode, thereby leading to an increased capacitance (Figure 9).
Geometries (b) and (c) have higher pore width (and volume) than geometry (a). It can be seen from the Figures 5–8 that there is no significant effect on charge density and capacitance due to the introduction of the CV move for both these geometries. Hence, it can be concluded that the CV does not influence the capacitance for larger pores or maybe the effect is being nullified by other unknown factors. Further studies are required to estimate these factors.
Conclusion
Monte Carlo simulations of EDLC have been carried out in constant voltage Gibbs ensemble with simple RPM. Values of differential capacitance (with different pore widths) are obtained at different voltages. The decreasing trend of capacitance with increasing voltage in geometry (a) (Figure 4) is attributed to its highly confined nature. A similar trend was also shown by Kornyshev (Kondrat et al., 2011). Figure 4 is also consistent (qualitatively) with Kornyshev’s prediction of bell-shaped variation of capacitance around 0 voltage for ILs (Kornyshev, 2007). Also, the new CV move introduced in the simulation increased the accuracy of calculations. The CV move is simpler to implement and considerably less expensive compared to the iterative energy minimization techniques used in the literature (Siepmann and Sprik, 1995).
The larger pores; geometries (b) and (c) have more space to accommodate additional ions leading to higher capacitance. The electrode structures are basically toy models and hence contribute only qualitatively in the study. However, with the same simulation methodology, one can build more realistic electrode/electrolyte atomic models, by simply incorporating additional Monte Carlo moves for the molecular degrees of freedom. Therefore, the methodology is easily transferable to model complicated systems. Future studies involving such aspects would contribute toward better understanding and design of high performance materials for supercapacitors.
Author Contributions
GP, KR and VK have contributed equally to the analysis. PK has helped in drafting the article and critical revision of the work.
Conflict of Interest Statement
The authors declare that the research was conducted in the absence of any commercial or financial relationships that could be construed as a potential conflict of interest.
Acknowledgments
The authors acknowledge Dr. Mridula Bhardwaj (CSTEP, Bangalore, India) and Prof. Sudeep Punnathanam (IISc, Bangalore, India) for the exciting discussions on this subject, constant support, and encouragement. The financial support has been provided by the grants obtained under the IRPHA program of DST, GoI, and the US-India Partnership to Advance Clean Energy-Research (PACE-R) for the Solar Energy Research Institute for India and the United States (SERIIUS), funded jointly by the U.S. Department of Energy (Office of Science, Office of Basic Energy Sciences, and Energy Efficiency and Renewable Energy, Solar Energy Technology Program, under Subcontract DE-AC36-08GO28308 to the National Renewable Energy Laboratory, Golden, CO, USA) and the Government of India, through the Department of Science and Technology under Subcontract IUSSTF/JCERDCSERIIUS/2012 dated 22nd November 2012.
References
Calhoun, A., and Voth, G. A. (1996). Electron transfer across the electrode/electrolyte interface: influence of redox ion mobility and counterions. J. Phys. Chem. 100, 10746. doi: 10.1021/jp960603q
Chmiola, J., Yushin, G., Gogotsi, Y., Simon, P., and Taberna, L. (2006). Anomalous increase in carbon capacitance at pore sizes less than 1 nm. Science 313, 1760. doi:10.1126/science.1132195
Christen, T., and Carlen, M. W. (2000). Theory of Ragone plots. J. Power Sources 91, 210. doi:10.1016/S0378-7753(00)00474-2
Crozier, P. S., Rowley, R. L., and Henderson, D. (2000). Molecular dynamics calculations of the electrochemical properties of electrolyte systems between charged electrodes. J. Chem. Phys. 113, 9202. doi:10.1063/1.1320825
Fedorov, M. V., and Kornyshev, A. A. (2008). Ionic liquid near a charged wall: structure and capacitance of electrical double layer. J. Phys. Chem. B 112, 11868. doi:10.1021/jp803440q
Gogotsi, Y. (2014). Material science: energy storage wrapped up. Nature 509, 568. doi:10.1038/509568a
Kiyohara, K., and Asaka, K. (2007a). Monte Carlo simulations of electrolytes in the constant voltage ensemble. J. Chem. Phys. 126, 214704. doi:10.1063/1.2736371
Kiyohara, K., and Asaka, K. (2007b). Monte Carlo simulations of porous electrodes in the constant voltage ensemble. J. Phys. Chem. C 111, 15903. doi:10.1021/jp0736589
Kiyohara, K., Sugino, T., and Asaka, K. (2010). Electrolytes in porous electrodes: effects of pore size and the dielectric constant of the medium. J. Chem. Phys. 132, 144705. doi:10.1063/1.3376611
Kondrat, S., Georgi, N., Fedorov, M. V., and Kornyshev, A. (2011). A superionic state in nanoporous double-layer capacitors: insights from Monte Carlo simulations. Phys. Chem. Chem. Phys. 13, 11359. doi:10.1039/c1cp20798a
Kornyshev, A. A. (2007). Double-layer in ionic liquids: paradigm change? J. Phys. Chem. B 111, 5545. doi:10.1021/jp067857o
Lamperski, S., and Kłos, J. (2008). Grand canonical Monte Carlo investigations of electrical double layer in molten salts. J. Chem. Phys. 129, 164503. doi:10.1063/1.2933434
Lanning, J. O., and Madden, P. A. (2004). Screening at a charged surface by a molten salt. J. Phys. Chem. B 108, 11069. doi:10.1021/jp048102p
Largeot, C., Portet, C., Chmiola, J., Taberna, P.-L., Gogotsi, Y., and Simon, P. (2008). Relation between the ion size and pore size for an electric double-layer capacitor. J. Am. Chem. Soc. 130, 2730. doi:10.1021/ja7106178
Limmer, D. T., Merlet, C., Salanne, M., Chandler, D., Madden, P. A., van Roij, R., et al. (2013). Charge fluctuations in nanoscale capacitors. Phys. Rev. Lett. 111, 106102. doi:10.1103/PhysRevLett.111.106102
Merlet, C., Rotenberg, B., Madden, P. A., Taberna, P., Simon, P., Gogotsi, Y., et al. (2012). On the molecular origin of supercapacitance in nanaporous carbon electrodes. Nat. Mater. 11, 306.
Pandolfo, A. G., and Hollenkamp, A. F. (2006). Carbon properties and their role in supercapacitors. J. Power Sources 157, 11. doi:10.1016/j.jpowsour.2006.02.065
Parfomak, P. W. (2012). Energy Storage for Power Grids and Electric Transportation: A Technology Assessment. CRS Report R42455.
Perkin, S., Salanne, M., Madden, P., and Lynden-Bell, R. (2013). Is a Stern and diffuse layer model appropriate to ionic liquids at surfaces. Proc. Natl. Acad. Sci. U.S.A. 110, E4121. doi:10.1073/pnas.1314188110
Petersen, M. K., Kumar, R., White, H. S., and Voth, G. A. (2012). A computationally efficient treatment of polarizable electrochemical cells held at a constant potential. J. Phys. Chem. C 116, 4903. doi:10.1021/jp210252g
Punnathanam, S. N. (2014). A Gibbs-ensemble based technique for Monte Carlo simulation of electric double-layer capacitors (EDLC) at constant voltage. J. Chem. Phys. 140, 174110. doi:10.1063/1.4873707
Reed, S. K., Lanning, O. J., and Madden, P. A. (2007). Electrochemical interface between an ionic liquid and a model metallic electrode. J. Chem. Phys. 126, 84704. doi:10.1063/1.2464084
Shi, H. (1996). Activated carbons & double layer capacitance. Electrochim. Acta 41, 1633. doi:10.1016/0013-4686(95)00416-5
Shim, Y., and Kim, H. J. (2010). Nanoporous carbon supercapacitors in an ionic liquid: a computer simulation study. ACS Nano 4, 2345. doi:10.1021/nn901916m
Siepmann, J. I., and Sprik, M. (1995). Influence of surface topology and electrostatic potential on water/electrode systems. J. Chem. Phys. 102, 511. doi:10.1063/1.469429
Smith, P., Jiang, T., and Tran, T. (2011). High Energy Density Ultracapacitors, NAVSEA-Carderock Division Annual Merit Review. Washington, DC: DOE Vehicle Technologies Program.
Straus, J. B., Calhoun, A., and Voth, G. A. (1995). Calculation of solvent free energies for heterogeneous electron transfer at the water–metal interface: classical versus quantum behavior. J. Chem. Phys. 102, 529. doi:10.1063/1.469431
Wang, Z., Yang, Y., Olmsted, D. L., Asta, M., and Laird, B. B. (2014). Evaluation of the constant potential method in simulating electric double-layer capacitors. J. Chem. Phys. 141, 184102. doi:10.1063/1.4899176
Willard, A. P., Reed, S. K., Madden, P. A., and Chandler, D. (2009). Water at an electrochemical interface—a simulation study. Faraday Discuss. 141, 423. doi:10.1039/B805544K
Werkstetter, S. (2015). Ultracapacitor Usage in Wind Turbine Pitch Control Systems. White Paper. Maxwell Technologies.
Keywords: supercapacitors, electrodes, ionic liquids, capacitance, Monte Carlo simulations
Citation: Pavaskar G, Ramakrishnasubramanian K, Kandagal VS and Kumar P (2018) Modeling Electric Double-Layer Capacitors Using Charge Variation Methodology in Gibbs Ensemble. Front. Energy Res. 5:36. doi: 10.3389/fenrg.2017.00036
Received: 07 September 2017; Accepted: 15 December 2017;
Published: 24 January 2018
Edited by:
Yaser A. Abu-Lebdeh, National Research Council Canada (NRC-CNRC), CanadaReviewed by:
Ali Kachmar, Qatar Environment and Energy Research Institute, QatarYufeng Zhao, Yanshan University, China
Copyright: © 2018 Pavaskar, Ramakrishnasubramanian, Kandagal and Kumar. This is an open-access article distributed under the terms of the Creative Commons Attribution License (CC BY). The use, distribution or reproduction in other forums is permitted, provided the original author(s) or licensor are credited and that the original publication in this journal is cited, in accordance with accepted academic practice. No use, distribution or reproduction is permitted which does not comply with these terms.
*Correspondence: Ganeshprasad Pavaskar, Z2FuZXNocHJhc2FkQGNzdGVwLmlu