 Yaolin Lin
 Wei Yang
- 1School of Civil Engineering and Architecture, Wuhan University of Technology, Wuhan, China
- 2College of Engineering and Science, Victoria University, Melbourne, VIC, Australia
Building design following the energy efficiency standards may not achieve the optimal performance in terms of investment cost, energy consumption and thermal comfort. In this paper, an improved multi-objective genetic algorithm (NSGA-II) is combined with building simulation to assist building design optimization for five selected cities located in the hot summer and cold winter region in China. The trade-offs between the annual energy consumption (AEC) and initial construction cost, as well as between life cycle cost (LCC) and number of thermal discomfort hours, were explored. Sensitivity analysis of various design parameters on building energy consumption is performed. The optimizations predicted AEC reduction of 29.08% on average, as compared to a reference building designed following the standard, and 38.6% with 3.18% more cost on the initial investment. New values for a number of building design parameters are recommended for the revision of relevant building energy efficiency standard.
Introduction
The first oil crisis in the 1970s called for the attention of the nations around the world to reduce the energy consumption. Due to the high pressure on energy demand, the developed countries began to study the energy consumption structure. It was found that significant amount of energy was consumed by buildings, where great potential of energy savings was found. Therefore, those countries launched to develop building energy efficiency standards. In China, the legislative work on building energy efficiency standards was lacking behind. The first building energy efficiency standard was published in 1986 (JGJ, 1986). Table 1 lists the legislations and amendments for major building energy efficiency standards in China. The average time for amendments of the standards is found to be 10.4 years.
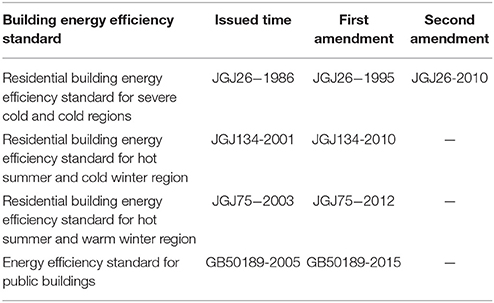
Table 1. Legislations and amendments for major building energy efficiency standards.
Since the issue of the first building energy efficiency standards, the actual energy savings achieved was limited. In 2013, the energy use intensity (EUI) for public buildings increases from 117 to 148 kWh/m2, as compared to the one in the year 2001 (BERC, 2015). It is partly due to the demand for higher thermal comfort level, and also un-optimized design following existing design standard. It means that there is a need for building design optimization to improve the indoor thermal comfort level while reducing the building energy consumption and take into the consideration in the revision of the standard.
Some researcher in China studied on how to reduce the building energy consumption through simulation that focused on one or two design parameters only (Yao et al., 2008; Zhang et al., 2011; Feng et al., 2014). Yao et al. (2008) used the building simulation software DeST to simulate the building energy performance under different shading coefficient. Zhang et al. (2011) studied the impact of building shape coefficient and window-to-wall ratio (WWR) on the energy consumption of public buildings. Feng et al. (2014) investigated the impact of building air-tightness on the residential building energy consumption under four different ventilation modes. However, building energy consumption is affected by a number of factors and studied on one or two design parameters may miss the interactive effect on others.
Great efforts have been spent on the optimization of building design to assist the designer considering the impact of multiple design parameters. Some researches focused on optimization of the energy consumption or thermal load only (Gong et al., 2012; Jin and Jeong, 2014). Jin and Jeong (2014) used genetic algorithm (GA) for free-form building shape optimization to minimize the external thermal load for 20 cities in 5 climate zones. Gong et al. (2012) integrated orthogonal method and listing method to optimize 7 passive design parameters for 25 cities in China to reduce the annual thermal load using a small residential house for case study.
Other researchers have considered energy consumption and thermal comfort (Wright et al., 2002; Gossard et al., 2013; Carlucci et al., 2015; Yu et al., 2015). Wright et al. (2002) applied multi-objective genetic algorithms (MOGA) approach to find the optimum pay-off characteristic between daily operating energy cost and thermal discomfort with emphasis on HVAC system design. Gossard et al. (2013) coupled artificial neural network with the non-dominated-and-crowding sorting genetic algorithm II (NSGA-II) to optimize the equivalent thermos physical properties of the external walls to reduce the annual energy consumption (AEC) and improve thermal comfort in summer. Yu et al. (2015) coupled back-propagation network with NSGA-II to improve thermal comfort and reduce energy consumption. Carlucci et al. (2015) applied NSGA-II to find the optimum K values of external walls, roof, floor, and windows as well as shading and window type to improve indoor thermal and visual comfort.
Cost is not considered in the above mentioned studies, however it is also a very important factor in addition to the energy consumption and it cannot be neglected in building practice or sustainable building design. Hamdy et al. (2011) proposed a modified MOGA method to minimize the investment cost and carbon dioxide equivalent (CO2-eq) emissions for a two-story residential building and its HVAC system, which predicted 26% in investment cost and 32% in CO2-eq emission as compared to the initial design. Ascione et al. (2015) coupled MATLAB with EnergyPlus to find the optimum building retrofit cost over the life cycle using MOGA approach to reduce energy demand and improve indoor thermal comfort, considering changes in the solar radiation absorption coefficient of the roof, insulation layer thickness of the roof and external wall, air temperature setpoint, window type, boiler type and chiller type. Znouda et al. (2007) combined GA with a simplified building thermal evaluation tool (CHEOPS) to investigate the impact of building shape, structures of roof and external walls, and shading device on building energy consumption and construction cost. It was found that a reduction of 18% on the construction cost will lead to 32% increase on building energy consumption in the Mediterranean area. Dubrow and Krarti (2010) combined GA with DOE-2 to optimize building shape and types of building envelopes to minimize the life cycle cost (LCC) and found that the LCC for rectangular and trapezoidal shape buildings have the best performance as compared to L shape, H shape, U shape, and T shape. Wang et al. (2006) applied MOGA to find the optimum trade-offs between LCC and life cycle environmental impact (LCEI), where building shape, wall type, roof type, and floor type, window type and WWR are considered. It was found that the rectangular shape performed better than the “L” shape in Montreal. Liu et al. (2015) applied a revised particle swarm optimization (PSO) algorithm to find the trade-offs between LCC and life cycle carbon emissions (LCCE) of building designs in Hong Kong, considering wall types, WWR, window types, building orientation and external sun-shade.
Although there have been a number of researches on the optimization of building energy efficiency design, little efforts have been made to compare the findings on the values of the design parameters from optimization with those recommended by the building design standards and provide suggestions for improvements/modification on the standards. Meanwhile, many of the researches have been focused on reducing energy consumption, thermal load or reducing energy consumption and improve thermal comfort, or finding the trade-offs between energy consumption and construction cost for retrofit, or LCC and life cycle CO2-eq emission. There are little researches found on optimizing the energy consumption and initial construction cost in China mainland and to explore the trade-offs between LCC and level of thermal discomfort. Moreover, it is important to find out the impact of each design parameters through sensitivity analysis from the outcomes of optimization to provide guidelines to the designer and help improve the building energy efficiency standards in China and find the answer to what the energy saving potential will be as compared to the current energy efficiency standards. Finally, there are very few open literatures to compare the optimum outcomes based on different optimization criterion, e.g., trade-offs between energy consumption and construction cost vs. trade-offs between lifecycle cost and indoor thermal discomfort.
This study aims to explore the cost-effective building energy efficiency design optimization with thermal comfort improvement for a residential building in the cold winter/hot summer region in China. It focuses on construction cost, building energy consumption, LCC and indoor thermal comfort. The research outcomes from this paper can provide insights for the researchers on cost-effective building energy efficiency design optimization problems with emphasis on improving the thermal comfort level in China. The trade-offs between the annual building energy consumption and initial construction cost, as well as between LCC and thermal discomfort will be investigated. Sensitivity analysis and comparison on the results from the two different optimization approaches will be presented and analyzed. New values for a number of building design parameters are recommended for the revision of relevant building energy efficiency standards based on the outcomes from the optimization.
The following section describes the utilization of the method and its evaluation for a residential house in five typical cities located in the hot summer/cold winter region in China.
Methodology
Optimization Framework
NSGA-II, which is a “fast and elitist multi-objective” method providing a good tradeoff between a well converged and a well distributed solution (Deb et al., 2002), is adopted in this research. This algorithm uses a specific population sorting based first on dominance, and then on a crowding distance computed for each individual. Due to this selection process, both convergence and spreading of the solution front can be ensured. It is recognized as one of the most efficient multi-objective evolution algorithms (MOEA) (Zitzler et al., 2000; Attia et al., 2013).
The GA needs to establish an appropriate initial population. Through selection, crossover, and mutation processes, new population are generated. Then the values of the objective functions are evaluated iteratively, until the optimal solutions are found.
Figure 1 presents the flow diagram for the building design optimization by coupling GA with building simulation software. The GA generates inputs to the building simulation software, while the later return simulation results on energy consumption, cost and return the values back to GA for optimization. Selection of the inputs are based on the findings from open literature (Wang et al., 2006; Dubrow and Krarti, 2010; Hamdy et al., 2011; Zhang et al., 2011; Gong et al., 2012; Jin and Jeong, 2014; Ascione et al., 2015; Liu et al., 2015; Yu et al., 2015). The design parameters selected in this paper are related to building orientation, WWR, window shading, heating temperature set point, cooling temperature set point, external wall structure (insulation), roof structure (insulation), and glazing type. The initial values for those parameters are selected based on the recommendation from the building energy efficiency design standard JGJ134-2010 (JGJ, 2010). The construction cost are taken from the cost booklets, e.g., HPCECMC (2013a,b) and embedded into the building simulation software. In this way the initial populations of the buildings are generated. The building energy consumption and associated construction cost are then estimated by the building simulation software, and the results will be passed to the GA program for analysis. This iteration process will continue until the optimal solutions are found. For the second step, the LCC and indoor thermal discomfort will be taken as the objective functions.
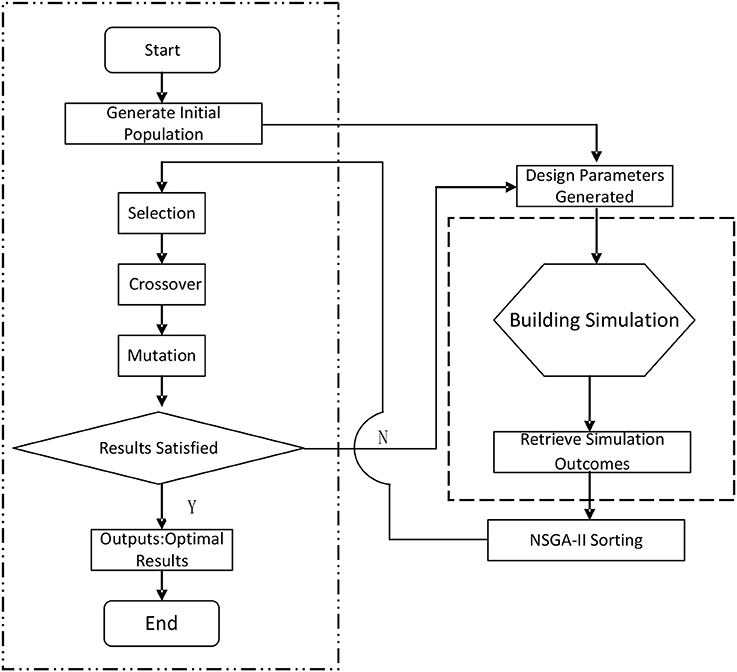
Figure 1. Building design optimization flow diagram.
Objective Functions
As mention above, this research aims at evaluating the energy saving potential under current energy efficiency standards for residential buildings. At the same time, the building construction cost needs to be affordable so it can be accepted in the practical world. The four objective functions considered in this research are building energy consumption, initial construction cost, LCC and indoor thermal comfort, where the former two forms the first group and the latter two forms the second group. The energy consumption is the outcomes of annual building energy consumption from the building simulation software. The initial construction cost includes the cost from building construction and HVAC system, however, the cost from land purchase, design, and business profits are not considered. The demolition cost could not be found from the cost booklets. However, by consulting the construction companies, and searching from the internet (Fang net, 2017; SHZH net, 2017), the cost of demolition is estimated to be 40 ¥/m2. The LCC can be calculated as follows:
The thermal comfort zone is based on the temperature and humidity ratio as recommended by GB/T 50785-2012 (GB, 2012). The predicted percentage of dissatisfied (PPD) and predicted mean vote (PMV) are used for evaluation. As shown in Figure 2, the comfort zone (PPD ≤ 10% and −0.5 ≤ PMV ≤ + 0.5, not considering air speed required to offset increased temperature) in winter is represented by the black quadrangle and in summer by the blue one. The thermal comfort indicator is represented by the number of hours outside the comfort zone.
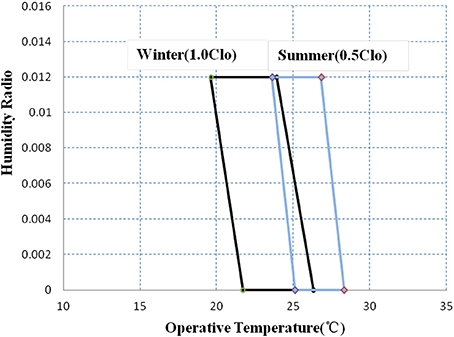
Figure 2. Indoor thermal comfort zone based on temperature and humidity ratio (GB 2012).
Settings for the Design Variables
Table 2 lists the ranges of the selected variables.
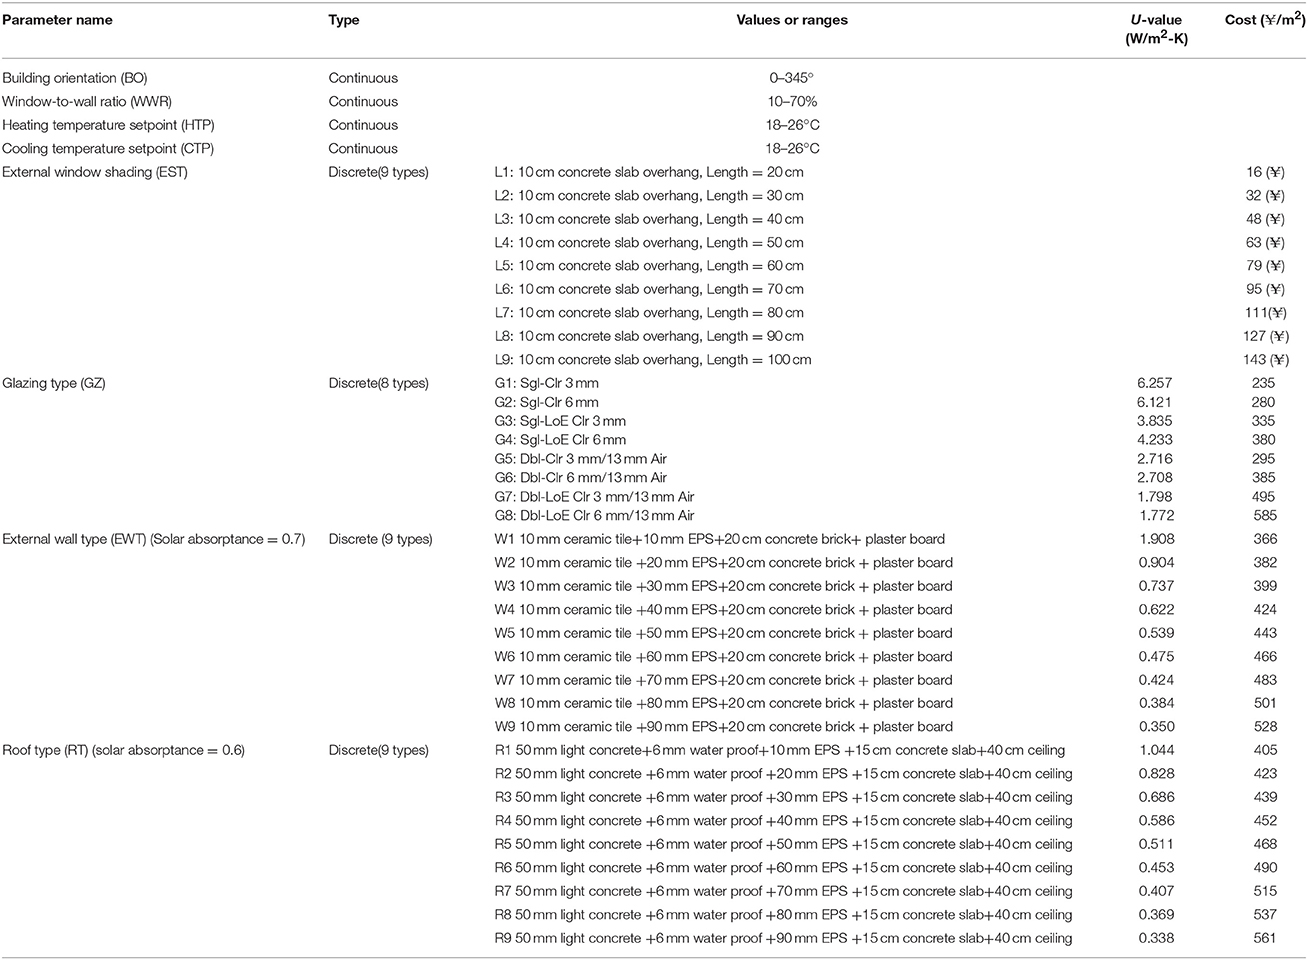
Table 2. Values and ranges of the selected parameters.
Reference Building
Climate Zone and City Selection
Table 3 lists the climate zones and associated design requirements in China.
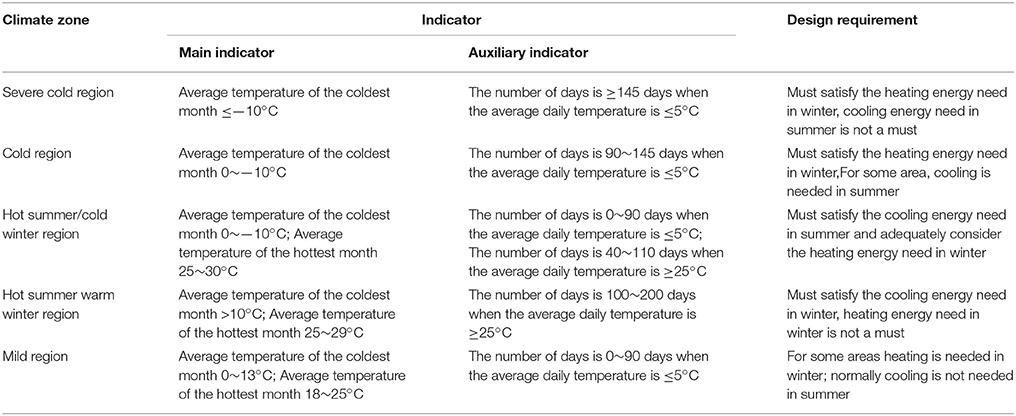
Table 3. Climate zones and design requirements (GB, 1993).
The hot summer/cold winter climate zone is located at the central south part of China with invigorate economic activities and dense population. The latitude is low and solar radiation intensity is very strong resulted in very hot summer. However, in winter it is the coldest region as compared to other places of the same latitude in the world. Spring season and autumn season are very short and not obvious. Therefore, both cooling and heating are needed in this region. Five typical cities that covered most area of this region are selected to find the optimal design parameters. Figure 3 presents the location of the selected cities. The climate data use the EPW weather files from the Energy plus website (Energy Plus, 2016) for whole year simulation. Table 4 lists the basic climatic information for those five cities.
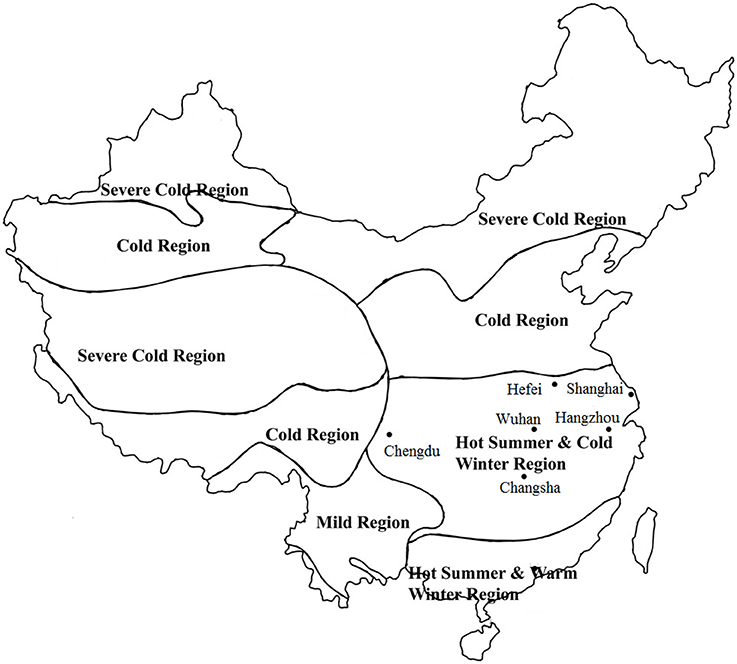
Figure 3. Location of the five selected cities in the hot summer/cold winter region in China.
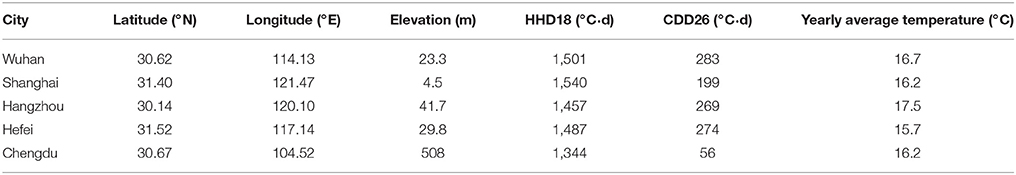
Table 4. Basic climatic information for the five selected cities.
Reference Building Model
There are two principles to select reference building: (1) The first principle is that the reference building should meet the building energy efficiency design standard, this is satisfied by selecting the values fall in the ranged as required by the building energy efficiency design standard JGJ134-2010 (JGJ, 2010); (2) The second principle is that the reference building should have good building energy performance and also meet the building style in the same climate zone. Therefore, the best building orientation recommended by the design standard JGJ134-2010 (JGJ, 2010) is adopted, and the building shape is a rectangle, as recommend by Dubrow and Krarti (2010) and Wang et al. (2006). In this research, a 10 m × 10 m single-story concrete frame residential building, with height of 4 m with ceiling (see Figure 4), is selected for case study. The number of occupants in this building is 5 including two elderly people, two working persons and one child. Building orientation is 15° west to south, as recommended by the design standard (JGJ, 2010) and typical building style in the same climate zone. A 1.0 m × 2.0 m door is open at the south wall. There are two 1.8 m × 2.1 m aluminum windows for each wall, making the WWR ~18.9%. The window type, external wall type, roof type and external shading are G5, W6, R6, and L5, as shown in Table 2, respectively. Each room is equipped with a split air-conditioning unit, and the indoor air temperature setpoint is 18°C (with setback temperature of 16°C) in winter and 26°C (with setback temperature of 28°C) in summer, as recommended by JGJ134-2010. The coefficient of performance (COP) for heating and cooling are 2.1 and 3.0, respectively. Table 5 presents the comparison between and thermal-physical properties of the reference building and the ranges of design values as recommended by the design standard (JGJ, 2010). It can be seen that all the thermal physical properties of the reference building falls within the recommended ranges from the design standard (JGJ, 2010). Design Builder (2015), validated building simulation software using simulation engine from Energy Plus, is selected to perform the building energy simulation and the outcomes on the building energy consumption, initial construction cost as well as the number of thermal discomfort hours are summarized in Table 6.
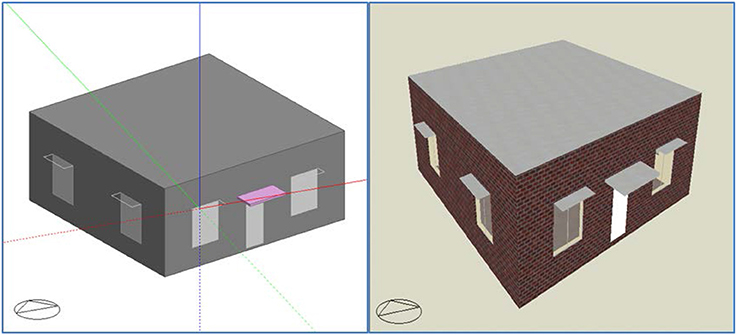
Figure 4. Reference building.
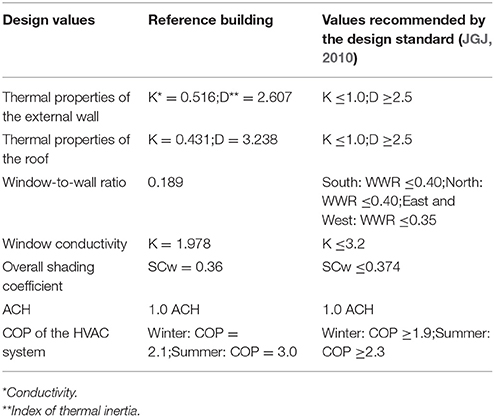
Table 5. Design values of the reference building and recommend value ranges from the design standard (JGJ, 2010).
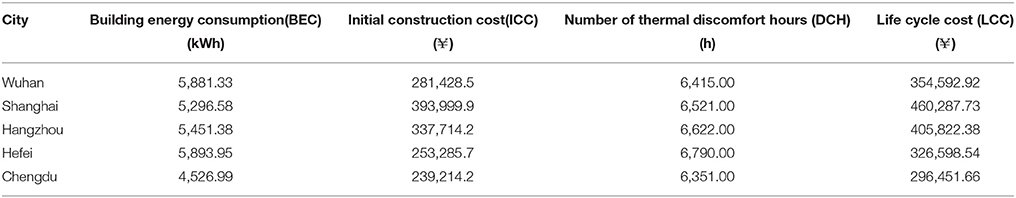
Table 6. Summary of the simulation outcome for the selected cities.
Case Studies
Building Design Optimization for Wuhan City
Analysis on the Optimization Process
The population size, crossover rate, mutation rate are the key parameters that affects the accuracy and computation time of GA. If the population size is too small, and the distribution of population is uneven, it is prone to lead to premature convergence. If the population size is too large, it will be time consuming. The crossover rate, mutation rate are manually set and have great impact on the global convergence. Alajmi and Wright (2014) investigated on how to select the most efficient GA sets for building optimization problem, and recommended high crossover rate of close to 1.0 and low mutation rate of close to 0. The population size is very sensitive to the computation performance and it is recommended to select smaller size of population if premature convergence can be avoided. Based on the results from Alajmi and Wright (2014) and Ascione et al. (2015) and through fine-tuning, on the population size, crossover rate and mutation rate are set to be 200, 0.95, and 0.02, respectively.
The first set of object functions are to find the trade-off between annual building energy consumption and initial construction cost for building design in the five selected cities. The program was running on a desktop with CPU of 3.2 GHZ and internal memory of 4 GB. Figures 5A–E presents the computational results for the 1st, 3rd, 5th, 7th, and 9th generation respectively.
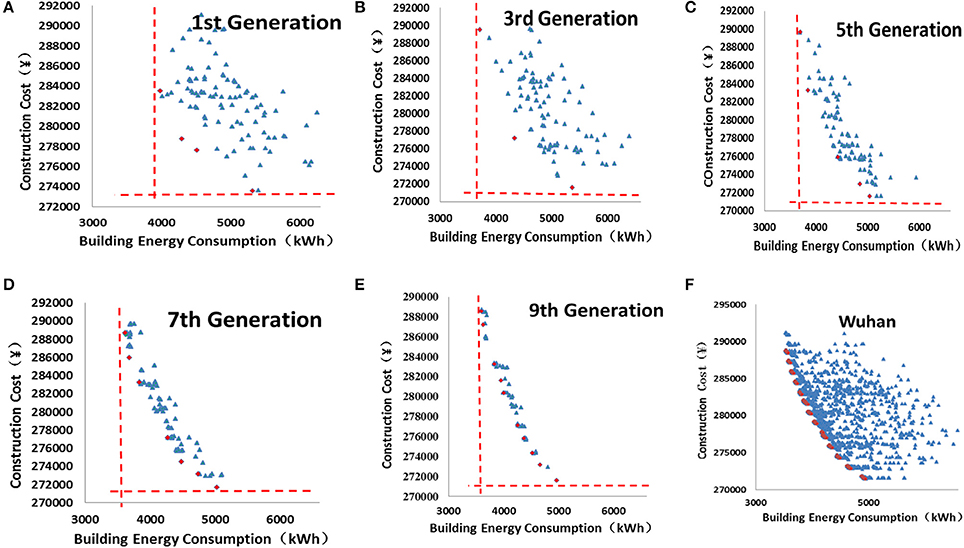
Figure 5. (A) The distribution of initial population. (B) The distribution of the 3rd population. (C) The distribution of the 5th population. (D) The distribution of the 7th population. (E) The distribution of the 9th population. (F) Pareto solutions and the individuals in the sample space.
It is found that during the 1st generation, there appeared six semi-optimal solutions. However they were sparsely distributed. The individuals distributed evenly in the sample space. The minimum annual building energy consumption was slightly higher than 8,000 kWh and the minimum initial construction cost was close to ¥273,000. After the 3rd generation, the minimum AEC was already lower than 8,000 kWh and minimum initial construction cost was below ¥272,000. However, after the 5th generation, the speeds on the convergence of the annual building energy consumption and construction cost have slowed down, and the sample of individuals gradually converged to the semi-optimal solutions.
From the 7th generation to the 9th generation, it is observed that there were little changes on the minimum annual building energy consumption and initial construction cost, which means that they have approached their limits. More semi-optimal solutions appeared and the individuals in the sample space moved close to the semi-optimal solutions.
The program ended at the 100th generation and the outputs on the AEC and initial construction cost of Pareto solutions and values of associated design variables were generated. Figure 5F presents the Pareto solution at the final generation with part of the individuals during the optimization process in the sample space to help understand the progress of convergence. A total of 244 Pareto solutions were generated meaning there were 244 optimal solutions for building design in Wuhan city with a wide range of trade-offs between building energy consumption and construction cost.
Analysis on the Pareto Solutions
Three indicators are developed to evaluate the performance for each design scheme, where Umax is the maximum energy saving rate, which represents the maximum energy saving potential; Smax is the maximum incremental cost, which represents the economic effect of the optimal design solution; is the average energy saving rate, which represents the average energy saving potential.
The three indicators can be obtained by the following equations:
Based on the calculation outcomes, the values for Umax, Smax, and are equal to 39.98, 2.63, and 29.22%, respectively, which means that through reasonable design, 2.63% in the construction cost can lead to reduction rate of 39.98% on the AEC. Meanwhile, there are 126 cases where the values for the incremental cost are negative, indicating optimal designs without increase in the construction cost. The average energy saving rate is 29.22% which is very promising.
Table 7 lists 30 sets of Pareto optimal solutions and associated values of the design parameters, which can be used at the design stage or for building retrofit purpose for existing buildings. However, once the building is constructed, the investment cost of retrofit to achieve building energy saving of 29.22% will be much higher than optimization at the design stage. This is the benefits of building design optimization.
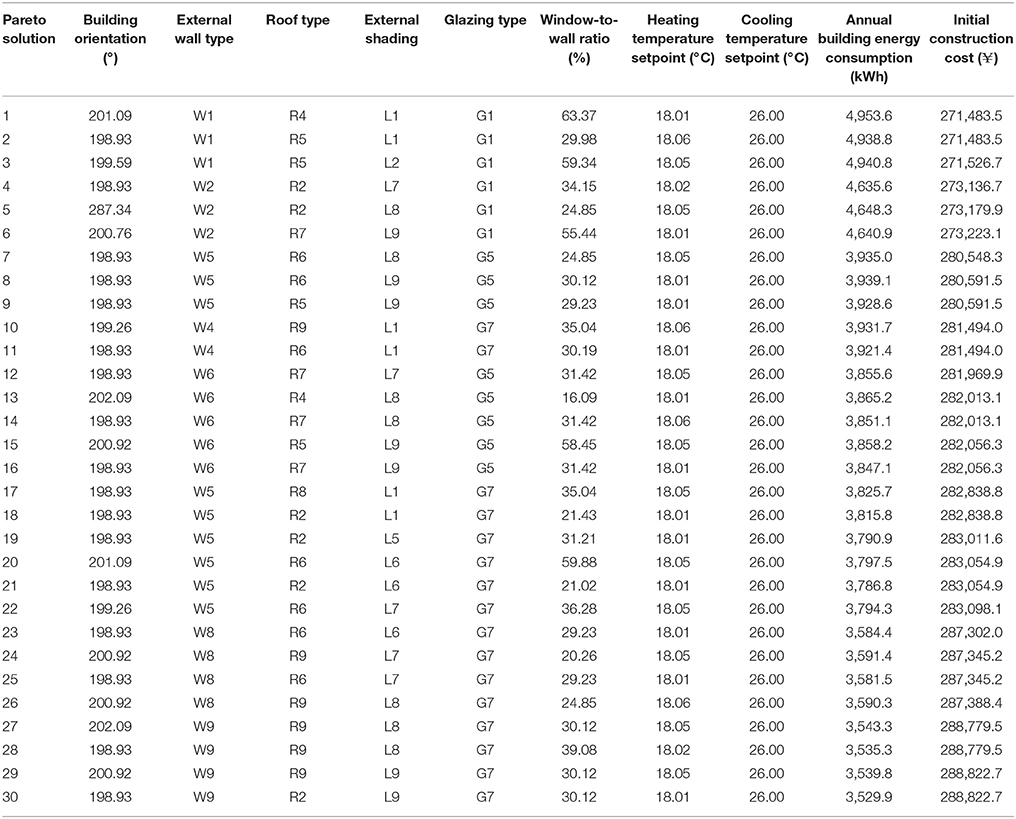
Table 7. 30 sets of Pareto solutions randomly selected for Wuhan considering the trade-offs between annual energy consumption and initial construction cost.
Building Design Optimization for Other Cities
Optimizations are performed for other four cities to test the feasibility of this approach. The information for the reference building, variable type, ranges of design variables and control parameters stay the same and only the local climate conditions are different for each city. The optimization processes are similar with the one in Wuhan, which are presented in Figures 6A–D. The optimal values for building orientation are 196.6~202.1°, and the optimal values for CTP and HTP converge to 26 and 18°C, respectively.
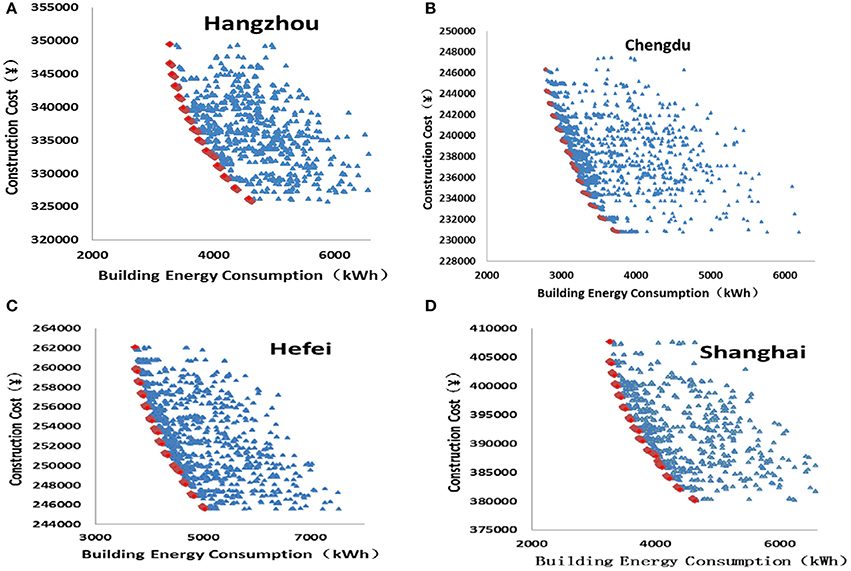
Figure 6. (A) Pareto solutions and the individuals in the sample space for Hangzhou. (B) Pareto solutions and the individuals in the sample space for Chengdu. (C) Pareto solutions and the individuals in the sample space for Hefei. (D) Pareto solutions and the individuals in the sample space for Shanghai.
Table 8 summaries the values of the three indicators of Umax, Emax, and for the five selected cities. It is found that the values all the three indicators are very stable for different cities. It is worth mentioning that in Chengdu, although it belongs to the hot summer and cold winter region, the weather is mild compared to the other four cities, and therefore the baseline energy consumption of which is much lower than the ones in the other cities. Yet the average energy saving potential in Chengdu still reaches 29.29% and the maximum incremental cost is 2.98%, which are quite close to the average values of 29.08 and 3.18% for all the five cities. It proves that the optimization approach is adapted to different cities and areas.
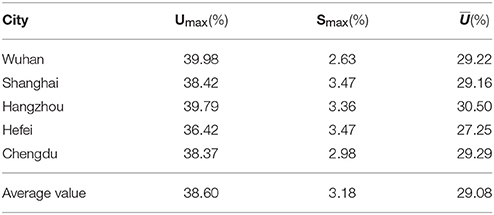
Table 8. Analysis on the optimal results for the five selected cities.
Sensitivity Analysis
Since the cost of walls, roofs, windows, and shadings are determined by information obtained from the Construction Engineering Cost Management Center, in this section, the sensitivity analysis is performed only to study the impact of each design parameter on the AEC. As it is an optimization approach, the analysis is based on comparison on the optimal solutions with variation on the value of one design parameter.
Figure 7 presents the sensitivity analysis of WWR on AEC. It is found that the AEC in Chengdu is most sensity to the WWR, followed by Shanghai, Hangzhou, Wuhan, and Hefei. With every 5% increase in the WWR, the average increases on the AEC for those five cities are 22.1, 16.8, 15.5, 10.8, and 10.6%, respectively. At the same time, it is observer that 45% is the turning point for WWR. Above this point, the rate of increase in AEC is higher than below this point. Therefore, 45% can be considered to be the high limit for WWR in this region, which is in consistent with the current building energy efficiency design standard. The impact of WWR on annual energy performance separated for heating and cooling season was also investigated. It has been found that there are multiple combinations of heating energy and cooling energy that lead to minimal energy consumption, and therefore the thermal behavior tendencies cannot be determined separately for heating and cooling during the whole year.
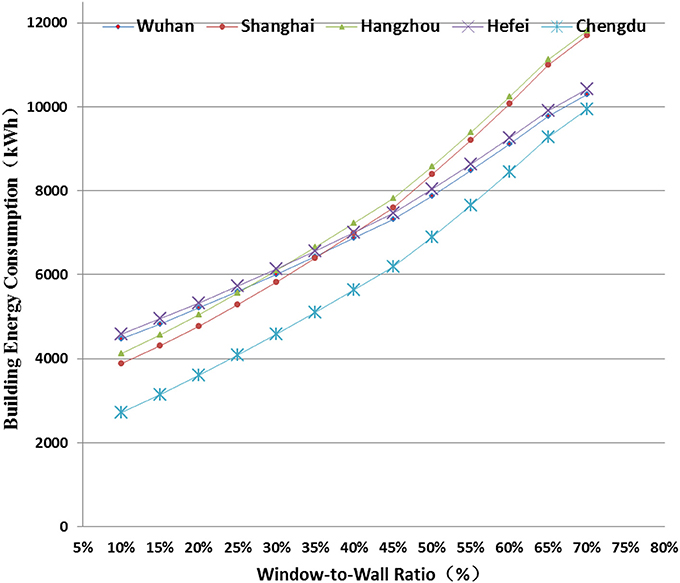
Figure 7. Sensitivity analysis of the window-to-wall ratio on the annual energy consumption.
Figures 8, 9 present the sensitivity analysis of the cooling temperature setpoint (CTP) and heating temperature setpoint (HTP) on the AEC, respectively. Again, the AEC in Chengdu is most sensitive to the CTP (with the lowest baseline), followed by Shanghai, Hangzhou, Hefei, and Wuhan. With every 0.5°C decrease in the CTP, the average increases on the AEC for those five cities are 19.2, 11.3, 9.33, 8.92, and 8.90%, respectively. The AEC in Chengdu is also most sensitive to the HTP (with the lowest baseline), followed by Shanghai, Heifei, Hangzhou, and Wuhan. With every 0.5°C increase in the HTP, the average increases on the AEC for those five cities are 22.3, 16.5, 13.9, 12.9, and 12.9%, respectively. There is a sharp increase when the HTP is between 21.5 and 22.0°C, this is probably due to simultaneously heating and cooling. The cooling and HTP have great impact on the indoor thermal comfort, which shall be discussed in section Comparison on the Optimization With Different Set of Objective Functions.
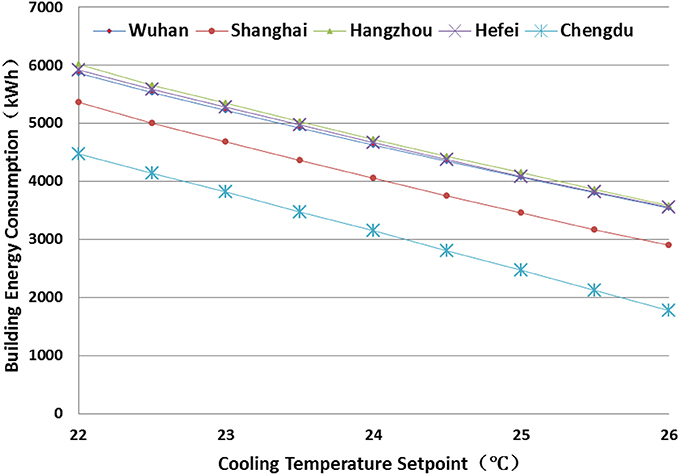
Figure 8. Sensitivity analysis of cooling temperature setpoint on annual energy consumption.
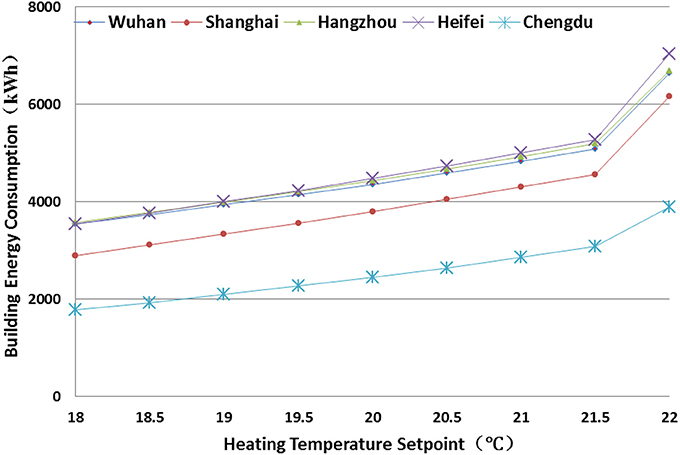
Figure 9. Sensitivity analysis of heating temperature setpoint on annual energy consumption.
Figure 10 presents the sensitivity analysis of the external shading on AEC. It was found that for all the five cities, the AEC is not sensitive to the external shading. For every 10 cm increase in the horizontal cantilever length, the resulted decrease in AEC is less than 1%. It does not mean that external shading is not important in building design, but rather the choice of external shading depends on building orientation, WWR and glazing type. For buildings with very low WWR, glazing type of G6, the impact of external shading can be neglected.
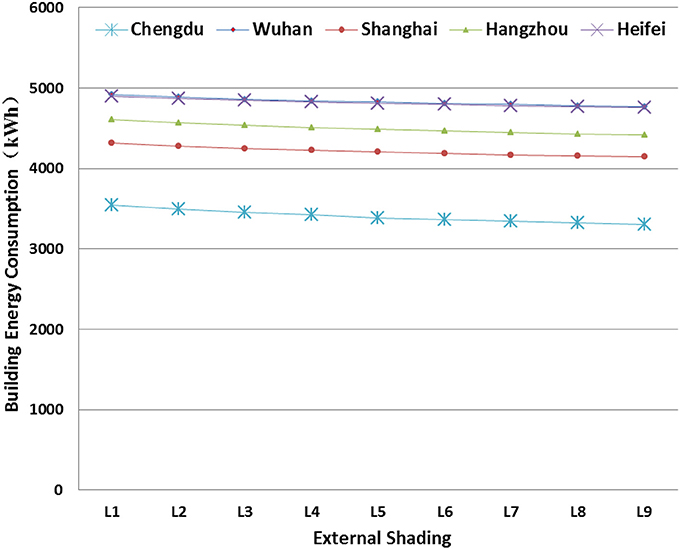
Figure 10. Sensitivity analysis of external window shading on annual energy consumption.
Figure 11 presents the sensitivity analysis of roof insulation on AEC. Similar impacts were found for all the five cities. As the thickness of insulation layer increases, the effect on energy saving gradually decreases. The average energy reduction for every 10 cm increase in the insulation layer before reaching 60 cm is 4.8%. After that, it is reduced to 1.7%. Therefore, it is not reasonable to increase the insulation thickness to maximum in term of energy and investment cost. For mid-rise and high-rise building, the area of the roof is small as compared to the total construction area, and therefore the energy saving potential will be limited.
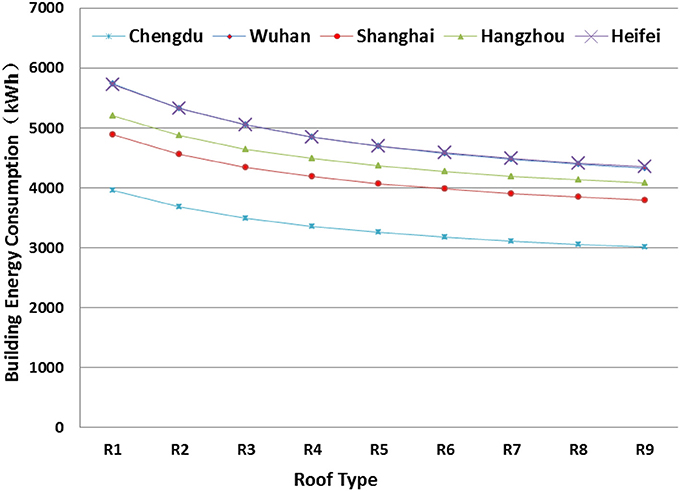
Figure 11. Sensitivity analysis of roof type on annual energy consumption.
Figure 12 presents the sensitivity analysis of wall insulation on AEC. Similar to the impacts of roof insulation, as the thickness of insulation layer increases, the effect of energy saving gradually decreases. The average energy reduction for every 10 cm increase in the insulation layer before reaching 60 cm is 6.4%. After that, it is reduced to 2.3%. Since the area of the walls is large as compared to the total construction area regardless of the building type, energy savings can be achieved by carefully selection of the wall insulation thickness.
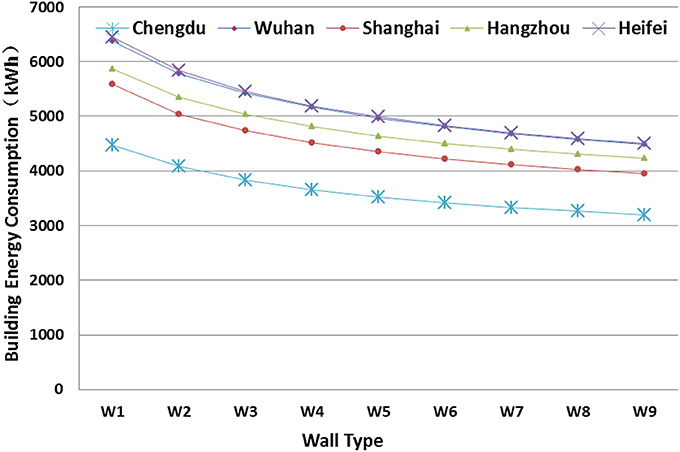
Figure 12. Sensitivity analysis of wall type on annual energy consumption.
Figure 13 presents the sensitivity analysis of glazing type on AEC. It was found that the energy savings through changing the thickness of glazing is very limited regardless of the glazing type. The energy saving potential for glazing with air gap performs better than single layer glazing, and Low-E glazing is better than normal clear glazing.
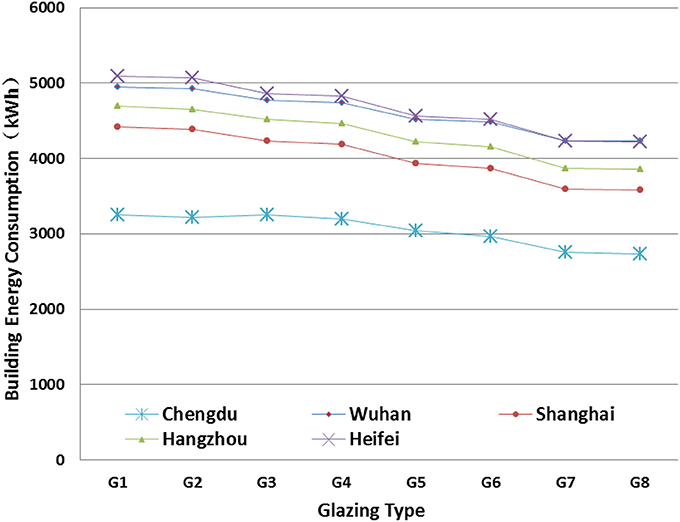
Figure 13. Sensitivity analysis of glazing type on annual energy consumption.
The AEC is not sensitive to the building orientation for all the five cities and it fluctuates and changes slightly in the whole value range of building orientation (Figure 14). The optimal values of the five cities are around 197 and 198°, or 17 and 18° east to south (180° means facing due south). The values are close to the recommended value of 15° east to south from building energy efficiency design standards for Shanghai and Hangzhou. However, it is different from the one recommended for Wuhan of 15° west to south.
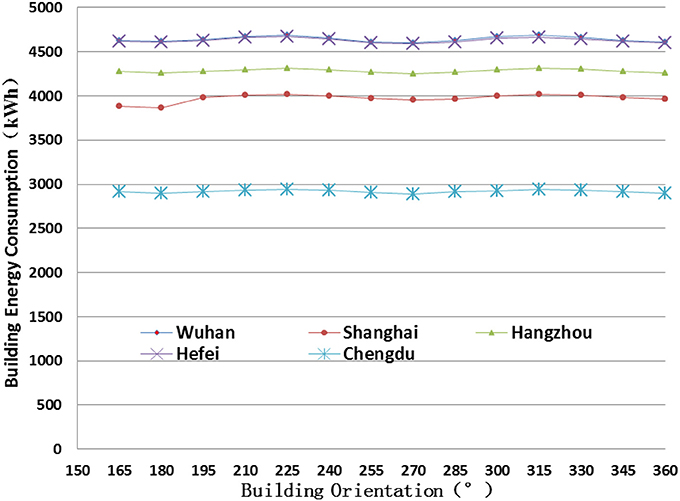
Figure 14. Sensitivity analysis of building orientation on annual energy consumption.
Comparison on the Optimization with Different Set of Objective Functions
Previous sections explore the trade-offs between the building energy consumption and initial construction cost, for all the cities, the HTP converged to 18°C and CTP converged to 26°C, resulted in large amount of reduction in building energy consumption, however, the level of indoor thermal comfort was scarified. If the thermal comfort is included in the objective function, what would be the impact on the choices of HTP and CTP? At the same time, as the LCC takes into account the building life span, initial construction cost as well as the annual building energy consumption and demolition cost, it is a better indicator to evaluate the sustainability of the building than the initial construction cost. Therefore, this section explores the optimal solution considering the trade-offs between LCC and number of indoor discomfort hours (IDH). The same reference building model, ranges of design variables and settings on the optimization process are used.
Optimal Results Based on New Objective Functions
Figures 15A–E presents the Pareto solutions for the trade-offs between LCC and IDH for the five selected cities. The results are similar for Wuhan, Shanghai, Hangzhou and Hefei, which are different from Chengdu due to its special weather condition. Each graphic can be divided into two parts by the broken line, denoting two different regions of convergence. The upper part of the graphic is the region of convergence due to cooling temperature control, and the bottom part is due to heating temperature control. For the cooling temperature control dominated region, the HTP is maintained at 18°C, and the CTP variates to improve the thermal comfort level. The cooling temperature dominated control strategy can help to reduce the number of discomfort hours to less than 4,000 h. For the case in Wuhan, it can be reduced to 3,745 h. To further reduce the number of thermal discomfort hours, heating temperature control is needed. For HTP control dominated region, the CTP is maintained at the optimal setpoint and the HTP variates to improve the indoor thermal comfort level. The final number of thermal discomfort hours is reduced to about 700 h, and theoretically it can be reduced to 0 h. However, due to the cost constrain on the LCC, it does not appear.
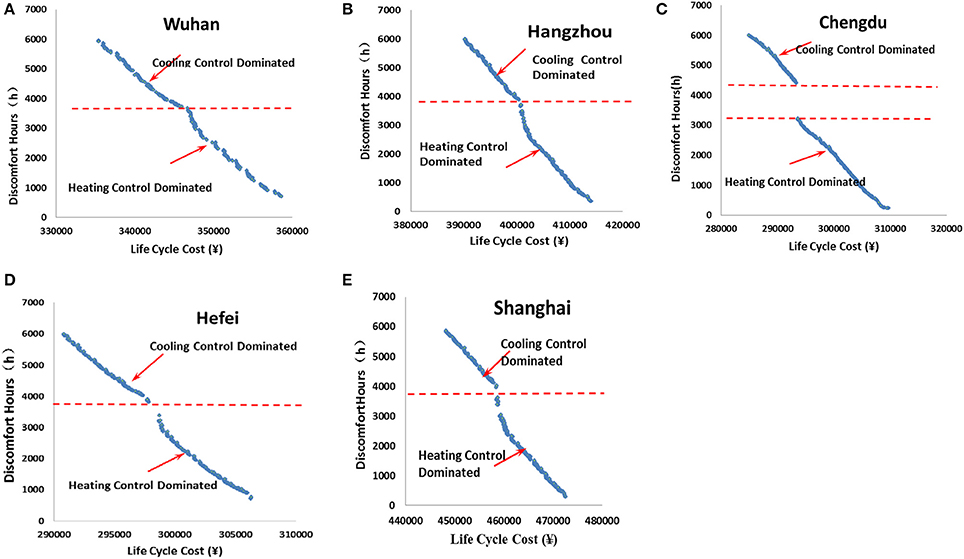
Figure 15. (A) Pareto solutions for Wuhan. (B) Pareto solutions for Hangzhou. (C) Pareto solutions for Chengdu. (D) Pareto solutions for Hefei. (E) Pareto solutions for Shanghai.
For the case in Chengdu, it was found that there is an empty space divided by two broken lines. Other processes are similar to the case in Wuhan. The CTP dominated control strategy can help to reduce the IDH to 4,410 h, and the HTP dominated help to reduce IDH from 3,211 h to about 200 h. There are about 1,200 h that requires no heating or cooling control, meaning about 50 days of transition seasons in Chengdu, which is much longer than in Wuhan.
Comparative Analysis of Optimal Solution Variables
Tables 9, 10 list the 20 sets of Pareto solutions each for Wuhan and Chengdu, respectively. It was found that there were almost no changes on the choices of building orientation, external wall type and glazing type. The building orientation for Wuhan, Chengdu and Shanghai is still around 15° east to south. However, for Hefei and Hangzhou the building orientation is around 75° west to south. The thickness of external wall insulation is 9 cm, and the glazing type is 3 mm double Low-E glazing with air gap (type G7). The CTP is around 22~26°C, and HTP is around 18~22°C. There is no obvious variation pattern for other design variables. Since the level of thermal comfort is very sensitive to the indoor air temperature, and when the room air temperature is maintained at 22°C, high level of thermal comfort can be achieved. If it is possible to provide district heating in this region, it is suggested to raise the HTP in winter to improve the level of thermal comfort.
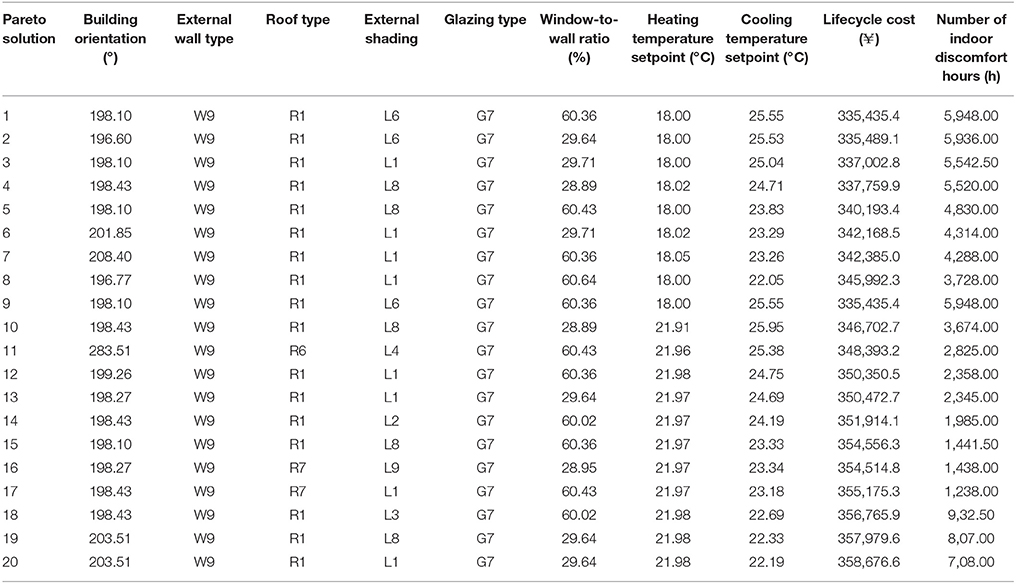
Table 9. 20 sets of Pareto solutions randomly selected for Wuhan considering the trade-offs between life cycle cost and number of indoor discomfort hours.
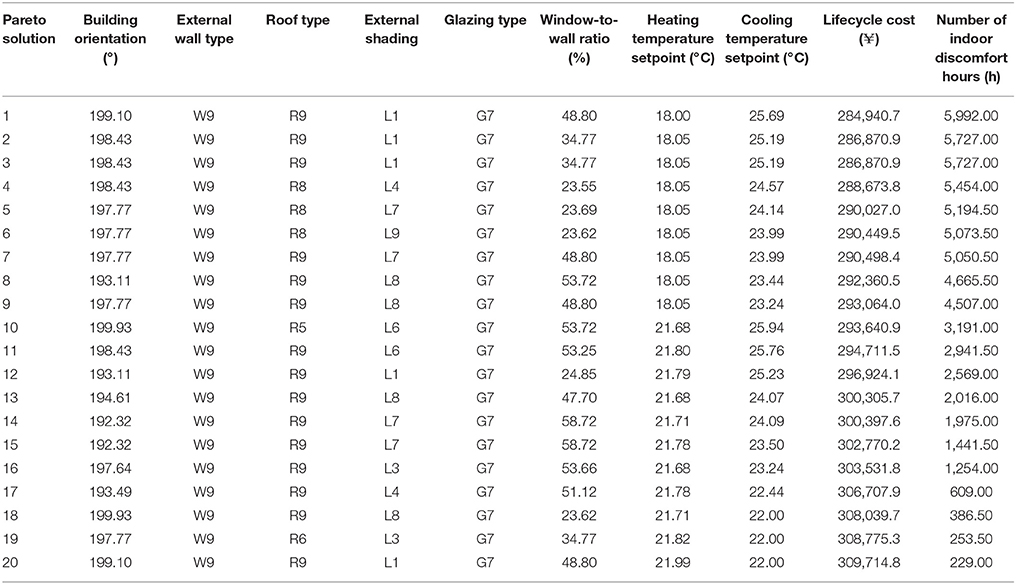
Table 10. 20 sets of Pareto solutions randomly selected for Chengdu considering the trade-offs between life cycle cost and number of indoor discomfort hours.
According to the sensitivity analysis in section Comparison on the Optimization With Different Set of Objective Functions, the building energy consumption is very sensitive to the indoor air temperature setpoint. When the air temperature is maintained at the comfort zone, the building energy consumption will be high. The optimal solutions try to overcome this by increasing the thickness of external wall insulation layer, selecting appropriate types of window glazing and WWRs.
Conclusions
In this paper, the trade-offs between AEC and initial construction cost, as well as the trade-offs between lifecycle cost and number of indoor thermal discomfort hours are investigated. The outcomes of the design parameters of the Pareto solutions are compared with the recommended values based on the building energy efficiency design standard in China to reveal the energy saving potential and provide the researchers with insights on cost-effective building energy efficient design optimization with thermal comfort improvement. The following conclusions can be made:
(1) Compared to the reference building designed followed current building energy efficiency design standard, the average energy saving potential is 29.8%, and it can be achieved at the design stage. With maximum increase in the initial construction cost of 3.18%, the saving potential can be as high as 38.6%.
(2) There are discrepancies between the recommended values from the energy efficiency design standard and the outcomes from the Pareto solutions, especially on the building orientation, which could be considered for modification of the design standards for different cities.
(3) The WWR, HTP, CTP, roof insulation and external wall insulation are the key parameters that affect the building energy consumption in the hot summer/cold winter region.
(4) When LCC and number of IDH are considered, the CTP is recommended to be between 22 and 26°C, instead of converging to 26°C. Similarly, the HTP is recommended to be between 18 and 22°C, instead of converging to 18°C. At the same time, the external wall type and window type are converged to W9 and G7, respectively.
(5) The proposed optimization approach can be employed at the building design phase as well as to evaluate the energy saving potential for existing building through retrofit.
There are certain limitations with this study. First, it mainly focuses on building envelop and the cooling and heating setpoint and therefore is not able to optimize the HVAC system. Secondly, the study is carried out in the hot summer/cold winter region in China, and therefore, the outcomes are effective only to similar weather conditions; Thirdly, the reference building is a single-story concrete frame residential building, which limit the application to low-rise non-commercial buildings; Fourthly, the study considered uniform WWR, which can vary in actual practice; Fifthly, the study considered only overhang shading, which can be enriched by incorporating other types of shading devices; Lastly, more building envelop design parameters, such as concrete thickness and air-tightness can be included for more in-depth investigation. Future work will integrate HVAC system with more building envelop parameters to explore the maximum building energy saving potential.
In general, the method employed in this study can be used for designing energy efficient building and improve indoor thermal comfort level with limited cost increment. The outcomes of this study can be used to revise relevant building energy efficiency standard after careful consideration on the limitations of the study.
Author Contributions
YL and WY contributed to the conception of the study, the development of the methodology. YL performed simulation and analyzed data. YL and WY wrote the manuscript. Both authors have read and approved the final manuscript.
Conflict of Interest Statement
The authors declare that the research was conducted in the absence of any commercial or financial relationships that could be construed as a potential conflict of interest.
Acknowledgments
This work was supported by the Natural Science Foundation of Hubei Province under grant [2017CFB602]; Wuhan Committee of Municipal and Rural Construction under grant [[2015] No.191] and Wuhan University of Technology under grants [40120171, 20410632, 20410646, and 35400206].
Abbreviations
AEC, annual energy consumption; COP, coefficient of performance; CTP, cooling temperature setpoint; EUI, energy use intensity; GA, genetic algorithm; HTP, heating temperature setpoint; ICC, initial construction cost; LCC, life cycle cost; LCCE, life cycle carbon emissions; LCEI, life cycle environmental impact; IDH, indoor discomfort hours; MOEA, multi-objective evolution algorithm; MOGA, multi-objective genetic algorithm; PMV, predicted mean vote; PPD, predicted percentage of dissatisfied; PSO, particle swarm optimization; WWR, window-to-wall ratio.
Nomenclature
CBEC = building energy cost, RMB (¥); Cmax = maximum construction cost among the optimal solutions, RMB (¥); Cop = present value of life cycle operating cost, RMB (¥); Cr = construction cost for the reference building, RMB (¥); Ei = annual energy consumption for the ith optimal solution, kWh; Emin = minimum annual energy consumption of among the optimal solutions, kWh; Er = annual energy consumption for the reference building, kWh; ICC = initial construction cost, RMB (¥); IDC = demolition cost, RMB (¥); i = average interest rate for the last 10 years in China, dimensionless; n = total building life span, taken as 30 years; P = present value coefficient of the uniform annual series, dimensionless; Smax = maximum incremental cost, dimensionless; Umax = maximum energy saving rate, dimensionless; = average energy saving rate, dimensionless.
References
Alajmi, A., and Wright, J. (2014). Selecting the most efficient genetic algorithm sets in solving unconstrained building optimization problem. Int. J. Sustain. Build Environ. 3, 18–26. doi: 10.1016/j.ijsbe.2014.07.003
Ascione, F., Bianco, N., Stasio, C. D., Mauro, G. M., and Vanoli, G. P. (2015). A new methodology for cost-optimal analysis by means of the multi-objective optimization of building energy performance. Energy Build. 88, 78–90. doi: 10.1016/j.enbuild.2014.11.058
Attia, S., Hamdy, M., O'Brien, W., and Carlucci, S. (2013). Assessing gaps and needs for integrating building performance optimization tools in net zero energy buildings design. Energy Build. 60, 110–24. doi: 10.1016/j.enbuild.2013.01.016
BERC (2015). “Building Energy Research Center of Tsinghua University,” in Annual Research Report, on China Building Energy Efficiency (Beijing), 4–5.
Carlucci, S., Cattarn, G., Causone, F., and Pagliano, L. (2015). Multi-objective optimization of a nearly zero-energy building based on thermal and visual discomfort minimization using a non-dominated sorting genetic algorithm. Energy Build. 104, 378–3940. doi: 10.1016/j.enbuild.2015.06.064
Deb, K., Pratap, A., Agarwal, S., and Meyarivan, T. (2002). A fast and elitist multi-objective genetic algorithm: NSGA-II. IEEE Trans. Evol. Comput. 6, 181–197. doi: 10.1109/4235.996017
Design Builder (2015). Available online at: http://www.designbuilder.co.uk/ (Accessed September 1, 2015).
Dubrow, D. T., and Krarti, M. (2010). Genetic-algorithm based approach to optimize building envelope design for residential buildings. Build. Environ. 45, 1574–1581. doi: 10.1016/j.buildenv.2010.01.005
Energy Plus (2016). Available online at: https://energyplus.net/ (Accessed January 10, 2016).
Fang net (2017). Available online at: http://home.fang.com/zhishi/17962165.htm. (Accessed April 6, 2017).
Feng, X. H., Yan, D., and Peng, C. (2014). Impact of air-tightness on the residential building energy consumption. Chin. J. HVAC 44, 5–13.
GB (1993). GB50176-93, Thermal Design Code for Civil Building. Beijing: China Architectural Engineering Industrial Publishing Press.
GB (2012). GB/T 50785-2012. Evaluation Standard for Indoor Thermal Environment in Civil Building. Beijing: China Architectural Engineering Industrial Publishing Press.
Gong, X., Akashi, Y., and Sumiyoshi, D. (2012). Optimization of passive design measures for residential buildings in different Chinese areas. Build. Environ. 58, 46–57. doi: 10.1016/j.buildenv.2012.06.014
Gossard, D., Lartigue, B., and Thellier, F. (2013). Multi-objective optimization of a building envelope for thermal performance using genetic algorithms and artificial neural network. Energy Build. 67, 253–260. doi: 10.1016/j.enbuild.2013.08.026
Hamdy, M., Hasan, A., and Siren, K. (2011). Applying a multi-objective optimization approach for design of low-emission cost-effective dwellings. Build. Environ. 46, 109–123. doi: 10.1016/j.buildenv.2010.07.006
HPCECMC (Hubei Provincial Construction Engineering Cost Management Center). (2013a). Hubei Province Housing Construction and Decoration Engineering Consumption Quota and Cost List (Construction and Roof). Wuhan: Changjiang Publishing Press.
HPCECMC (Hubei Provincial Construction Engineering Cost Management Center). (2013b). Hubei Province Housing Construction and Decoration Engineering Consumption Quota and Cost List (Decoration). Wuhan: Changjiang Publishing Press.
Jin, J. T., and Jeong, J. W. (2014). Optimization of a free-form building shape to minimize external thermal load using genetic algorithm. Energy Build. 58, 473–482. doi: 10.1016/j.enbuild.2014.09.080
JGJ (1986). JGJ26-1986. Building Energy Efficiency Design Standard for Severe Cold and Cold Regions. Beijing: China Architectural Engineering Industrial Publishing Press.
JGJ (2010). JGJ134-2010. Residential Building Energy Efficiency Design Standard for Hot Summer/Cold Winter Region. Beijing: China Architectural Engineering Industrial Publishing Press.
Liu, S., Meng, X., and Tam, C. (2015). Building information modeling based building design optimization for sustainability. Energy Build. 105, 139–153. doi: 10.1016/j.enbuild.2015.06.037
SHZH net (2017). Available online at: http://www.shzh.net/article/detail-149539 (Accessed April 6, 2017).
Wang, W., Rivard, H., and Zmeureanu, R. (2006). Floor shape optimization for green building design. Energy Build. 20, 363–378. doi: 10.1016/j.aei.2006.07.001
Wright, J. A., Loosemore, H. A., and Famani, R. (2002). Optimization of building thermal design and control by multi-criterion genetic algorithm. Energy Build. 34, 959–972. doi: 10.1016/S0378-7788(02)00071-3
Yao, J., Yan, C., Ye, J., and Zhou, Y. (2008). Impact of external window shading coefficient on the building energy consumption. Chin. J. Build. Energy Efficiency 36, 65–67. doi: 10.3969/j.issn.1673-7237.2008.02.020
Yu, W., Li, B., Jia, H., Zhang, M., and Wang, D. (2015). Application of multi-objective genetic algorithm to optimize energy efficiency and thermal comfort in building design. Energy Build. 88, 135–143. doi: 10.1016/j.enbuild.2014.11.063
Zhang, J., Li, Q., Fang, D., and Hao, M. (2011). Impact of window-to-wall ratio and shape coefficient on the building energy consumption for office building. Chin. J. Energy Efficiency 9, 47–49. doi: 10.3969/j.issn.1004-7948.2011.09.012
Zitzler, E., Deb, K., and Thieler, L. (2000). Comparison of multi-objective evolutionary algorithms: empirical results. IEEE Trans. Evol. Comput. 8, 173–195. doi: 10.1162/106365600568202
Keywords: building design optimization, energy efficiency design standard, life cycle cost, thermal comfort, multi-objective genetic algorithm
Citation: Lin Y and Yang W (2018) Application of Multi-Objective Genetic Algorithm Based Simulation for Cost-Effective Building Energy Efficiency Design and Thermal Comfort Improvement. Front. Energy Res. 6:25. doi: 10.3389/fenrg.2018.00025
Received: 10 November 2017; Accepted: 20 March 2018;
Published: 05 April 2018.
Edited by:
Hasim Altan, University of Sharjah, United Arab EmiratesReviewed by:
Alaa Abdul-Ameer, British University in Dubai, United Arab EmiratesJorge Facao, Laboratório Nacional de Energia e Geologia, Portugal
Copyright © 2018 Lin and Yang. This is an open-access article distributed under the terms of the Creative Commons Attribution License (CC BY). The use, distribution or reproduction in other forums is permitted, provided the original author(s) and the copyright owner are credited and that the original publication in this journal is cited, in accordance with accepted academic practice. No use, distribution or reproduction is permitted which does not comply with these terms.
*Correspondence: Yaolin Lin, eWFvbGlubGluQGdtYWlsLmNvbQ==