 Nai-Hsuan Yang1†
 Ru-Shi Liu
- 1Department of Chemistry, National Taiwan University, Taiwan
- 2National Synchrotron Radiation Research Center, Taiwan
- 3Department of Mechanical Engineering and Graduate Institute of Manufacturing Technology, Taiwan
Lithium-ion batteries are one of the main power sources for portable electronic devices and vehicles nowadays. However, the limitations of commercial cathode and anode materials cannot satisfy the increasing energy requirement of electronic devices. Therefore, investigating the chemistry and material changes during charge/discharge (lithiation/delithiation) is important to improve the properties of commercial LIBs. In-situ transmission X-ray microscopy has become one of the most important techniques for understanding the relationships between the electrode architecture and the cycling performance of electrode materials. In this mini review, we are focus on the theory of the synchrotron transmission X-ray microscopy and pick up one of the most important reports to discuss the electrode material investigation.
Introduction
With the growth in portable electronic device, the development of advanced lithium-ion batteries (LIBs) becomes important, especially in determining new electrode materials. The present technologies, such as X-ray diffraction (XRD), scanning electron microscope (SEM), transmission electron microscope (TEM), Fourier transform infrared spectroscopy (FTIR), nuclear magnetic resonance (NMR), X-ray photoelectron spectroscopy (XPS), atomic force microscope (AFM), and Raman spectra are used for the investigation of LIBs. However, they can only show the morphology, structure, or surface function groups before and after the charge/discharge cycle process. In-situ synchrotron full field transmission X-ray microscopy (TXM) with 30–50 nm spatial resolution is a significant technique that can reveal the ultrafine variation for Li ions in and out of the electrode materials during the charge/discharge cycle process and help us to understand the mechanism and explore the effective new electrode materials (Wang et al., 2014; Chen et al., 2016; Wolf et al., 2017; Xu et al., 2017). In addition, synchrotron radiation X-ray tomographic microscopy (SRXTM) with 1 μm spatial resolution (Ebner et al., 2013) is also an important instrument for in situ mesoscale visualization in LIBs.
Images of Lib Electrode Materials by Using In-situ Transmission X-ray Microscopy
Synchrotron TXM is an essential technique in the ion battery research. TXM provides 30–50 nm spatial resolution, 10 s temporal resolution and 20–50 μm probing depth by applying high flux synchrotron radiation X-ray with tunable energy range of 5–12 keV as the source. Furthermore, TXM requires no vacuumed experimental environment; hence, the use of aqueous samples is feasible. The energy-resolved TXM elemental mapping can be performed with the complement of the X-ray absorption near-edge structure (XANES). Taking all of these advantages, TXM is a distinct technique to reveal in situ the working LIBs, sodium-ion batteries (NIBs), and all similar investigations. TXM applies the physical characteristics of absorption and phase contrasts of various materials within the specimen and explores the interior morphology. The sequential alteration of materials inside the anode, cathode, and electrolyte of LIBs during the charge/discharge cycle processes, including size (expansion/contraction), geometry shape, crack, fracture, pulverization, porous rate, and lithium dendrite, can be analyzed by in-situ TXM observation.
The layout of TXM beamline at the synchrotron radiation facility is shown in Figure 1A. The synchrotron radiation X-ray source passes through a vertical collimating mirror to the parallel beam to optimize the energy resolution (ΔE/E) of the double crystal monochromator (DCM). The monochromatized beam is focused by a horizontal focusing mirror (HFM) and a vertical focusing mirror (VFM) as the secondary source for the capillary condenser of the TXM end-station. The sketch and photograph of the TXM instrument are presented in Figure 1B. X-ray at the HFM and VFM focus is refocused by the capillary condenser to the sample position. This beam transmits the sample and subsequently passes through a zone plate, which is located at the downstream of the sample, to magnify the diffraction beam and apply the spatial resolution of 30–50 nm. Specimen with insufficient absorption contrast is equipped with a phase ring in the back focal plane of the zone plate to enhance phase contrast. A charge-coupled device (CCD) is installed at the end of the end-station for image acquisition. Prior to CCD installation, a scintillator is used to translate X-ray to visible light. A serious two dimensional (2D) images from −90° to 90° (181 images) are reconstructed as a three dimensional (3D) tomography.
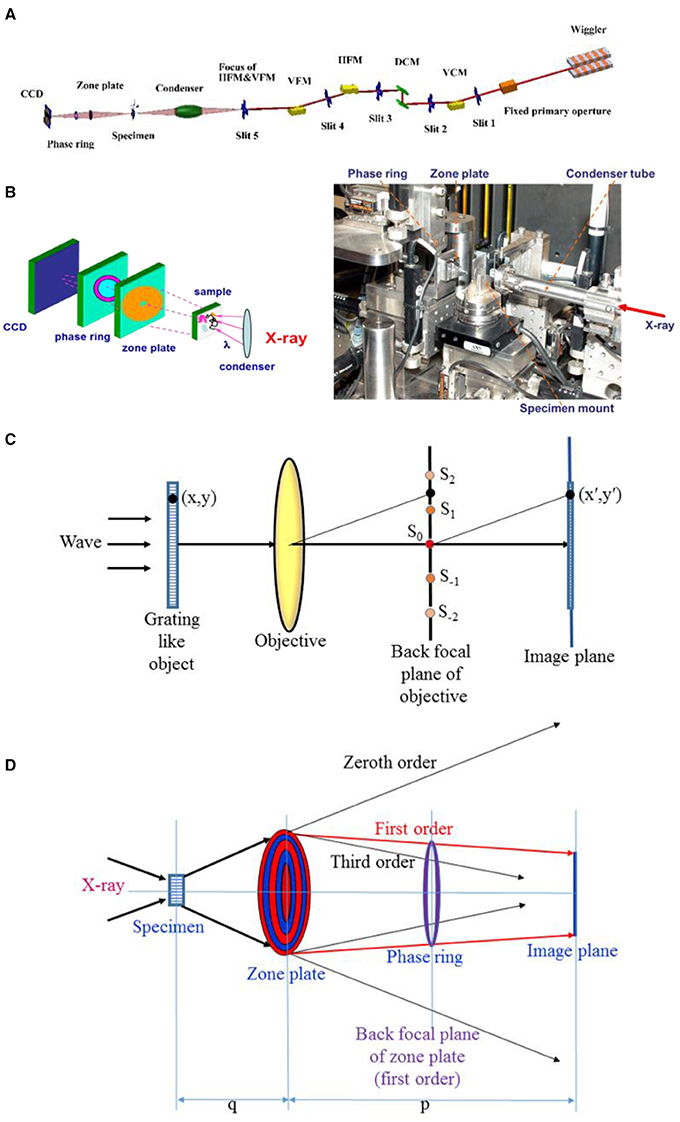
Figure 1. (A) Layout of synchrotron radiation transmission X-ray microscopy (TXM) beamline. (B) Sketch (left) and photograph (right) of the TXM instrument. (C) Sketch of Abbe theory for image formation in a microscope. (D) Sketch of the zone plate and phase ring in the TXM instrument. The zone plate consists of concentric circle zones with Au (or other metal) (red circles) and Si3N4 (blue circles) replacements. The phase ring material is gold.
The TXM applies the absorption and phase contrasts to reveal the internal morphology of the specimen (Schneider, 1998; Attwood, 1999; Born and Wolf, 1999; Mansuripur, 2002). The refraction index n of a material can be written as follows:
where δ and β are the real and image parts of the refraction index, respectively. The interaction in the X-ray electric field, which transmits a material with the thickness of z, can be illustrated as follows:
where E0 is the initial electric field of the X-ray, k is the wave number of the X-ray, k = 2π/λ, and λ is the wavelength of the X-ray. With the substitution of Equation (1) and k = 2π/ λ into Equation (2), E(z) can be expressed as follows:
The electric field intensity is described as follows:
where I0 is the initial intensity of the incident beam. Hence, the absorption contrast of various materials with different β values within the specimen can be expressed as follows:
With regard to the specimen with insufficient absorption contrast, the Zernike phase contrast method can be applied to enhance the phase contrast of materials within the specimen. First, Abbe's theory of image formation in a microscope is introduced, with consideration of object imaging, which is illuminated by a plane wave, as shown in Figure 1C (Born and Wolf, 1999). The plane wave is diffracted by the grating-like object and develops a Fraunhofer diffraction pattern of the object in the back focal plane of the objective. The maximum intensity of continuous orders of this pattern is indicated by the following: …, S−2, S−1, S0, S1, S2 … Each point on the focal plane can be treated as a center of a coherent secondary source. The waves that progress from these secondary sources interfere mutually and form an image of this object in the image plane. The Zernike phase contrast method locates a phase plate at the back focal plane of the objective. The zero-order phase of the diffraction pattern (S0) is retarded (+) or advanced (–) with respect to the other diffraction spectra (S1, S−1, S2, S−2…) by π/2. This method can transform the phase term of the image to intensity, which can be recognized by a detector. To explain the principle of phase contrast method, the system is simplified to consider the phase term only by treating a one-dimensional transparent phase grating. The transmission function of this phase grating is as follows:
where Φ(z) is a real periodic function. Compared with unity, if Φ is smaller, then F(z) can be expressed as follows:
When the S0 phase is retarded or advanced with one quarter of period , the according transmission function G(z) after calculation is as follows:
The positive and negative signs correspond to the phase of the 0th order, which is retarded and advanced, respectively. G(z) represents an assumed amplitude grating instead of a phase grating. The intensity in the image plane is as follows:
Moreover, the phase contrast for the transparent phase grating is expressed as follows:
This relationship explains that the phase variation induced by the object is transformed to intensity variation by using Zernike phase contrast method. The image intensity is proportional to the phase of the corresponding element of the object.
Figure 1D shows the arrangement of the zone plate and phase ring in the TXM system. A phase ring is placed at the back focal plane of the zone plate to advance the S0 phase of the specimen with . The thickness z of the phase ring can be estimated by considering the pure phase contrast image as z = . The Fresnel zone plate in the TXM system is the key component in providing spatial resolution. The zone plate structure, which consists of concentric circle zones with Au (or other metal) (red circles) and Si3N4 (blue circles) replacements, is shown in Figure 1D. X-ray passing through the zone plate will be focused, and it will induce diffraction phenomenon due to the optical path difference. The focal length of the zone plate is written as follows:
where r and drn are the radius and the outmost zone width of the zone plate, respectively, m is the diffraction order, and λ is the X-ray wavelength. For the synchrotron radiation TXM system, the monochromatized energy of the incident X-ray is selected by adopting the DCM in the beamline.
The spatial resolution (Δrm) of the zone plate corresponding to the Rayleigh resolution limit for a circular aperture is determined by the following equation:
where NA is the numerical aperture of the zone plate (NA = λ/(2drn)).
The theoretical diffraction efficiency of the zone plate can be calculated by using rigorous coupled-wave theory. Diffraction efficiency is related to the complex refractive index (n = 1–δ–iβ), thickness (aspect ratio) of the zone plate, wavelength, and X-ray incident divergence angle. Briefly, the result is proportional to 1/(πm)2. The practical measured value of the diffraction efficiency of the zone plate is commonly in the range of 10–30%. The zone width uniformity and zone plate thickness are crucial for diffraction efficiency, and they influence the signal-to-noise ratio of the image largely. When the numerical aperture of a zone plate is considerably small compared with the object distance q and image distance p, i.e., NA < < 1, the zone plate can be treated as a lens. The object and image distances can be estimated by using the following formula:
In addition, the magnification M of the zone plate is described as follows:
Synchrotron radiation TXM is a distinct technique to reveal the in-situ internal morphological structure variation of the LIB material during charging, discharging, and idle processes.
This work used the case on the xLi2MnO3(1-x)LiMO2 (Li1+xMO2, where M = Ni, Co, Mn) system to demonstrate the TXM 2D images in LIB investigations. The xLi2MnO3(1-x)LiMO2 compounds consisting of Li2MnO3 and LiMO2 is a promising cathode electrode with a high capacity of 250–300 mAh/g. Nonetheless, this material exhibits poor rate and cycling performance and a large hysteresis in the charge/discharge curves. To improve the capacity and cycling performance of electrode materials, the structural evolution of Li2MnO3·LiMO2 cathode electrode with a high charge capacity (302 mAh/g) is investigated for the first time by combining operando TXM and operando neutron powder diffraction (NPD), which allows the correlation of morphological detail and atomic-scale crystallography to reveal electrode function (Chen et al., 2016). The TXM images of a working Li2MnO3·LiMO2 cathode particle are shown in Figure 2-1. Figure 2-1a presents the voltage (V vs. Li+/Li) versus time curve during the first charge/discharge cycle, and the corresponding snapshots are shown in Figures 2-1b–g. The diameter of the approximately spherical Li2MnO3·LiMO2 particle at the OCV is 10.95 μm (Figure 2-1b). During charging to 4.5 V, cracks occur in Li2MnO3·LiMO2 particle (Figure 2-1c, red rectangular area), which further develop during charging to 4.7 V (Figures 2-1d,e). Upon discharge, the cracks fade (f), the particle almost heals, and the diameter is 10.78 μm at 2 V (Figures 2-1g). The variation of TXM images of Li2MnO3·LiMO2 particle in Figure 2-1 is shown in Figure 2-2. Figure 2-2a displays the difference between 4.5 V and OCV. The cracks in Li2MnO3·LiMO2 particle are shown in red circle, and the volume reduction is about 2%. Figure 2-2b illustrates the variation in 4.7 and 4.5 V. The cracks develop with a volume reduction of 3%. The particle cracks and volume are almost unchanged during 4.7–3.6 V (Figure 2-2c). Notably, with further discharge from 3.6 to 2 V, the particle cracks are healed, with a volume expansion of 3% (Figure 2-2d). The overall cracks developed during charging (variation from OPC to 4.7 V) and healed during discharging (difference between 2 V and OPC) are illustrated in Figures 2-2e,f, respectively.
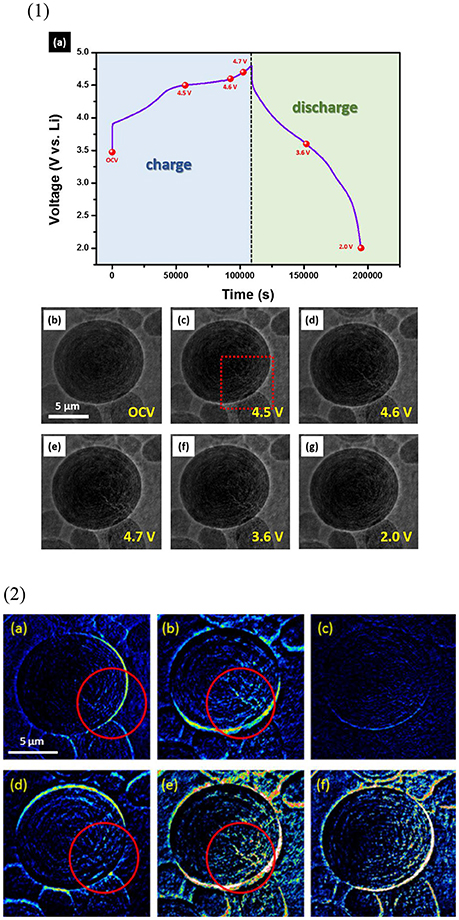
Figure 2. TXM images of a working Li2MnO3·LiMO2 cathode particle. (1) (a) Voltage (V vs. Li+/Li) vs. time curve during the first charge/discharge cycle. (b–g) are the corresponding snapshots of the marked numbers in (a). (2) Variation in TXM images in (1b–g). (2a–f) represent the differences between 4.5 V and open-circuit voltage (OCV), 4.7 and 4.5 V, 3.6 and 4.7 V, 2.0 and 3.6 V, 4.7 V and OCV, and 2.0 V and OCV, respectively. Reprinted permission from Chen et al. (2016). Copyright 2016 American Chemical Society.
Operando NPD is used to investigate the Li2MnO3·LiMO2 phase and structure alternation in a complete cell containing a Li4Ti5O12 (LTO) anode electrode during operation. Cracking in the Li2MnO3·LiMO2 electrode particle under in-situ TXM examination is induced by the solid-solution reaction of the LiMO2 during charging to 4.55 V. The cracks are enhanced upon further charging to 4.7 V with the concurrent two-phase reaction of the LiMO2 phase; this reaction is related to the largest lattice change in any phase and oxygen evolution from the Li2MnO3 phase. Crack healing is associated with the reverse solid-solution reaction of the LiMO2 phase during discharge. Significantly, the phase separation during two-phase reaction of LiMO2 phase hinders the complete healing of the electrode particle and results in pulverization over extended cycling. Consequently, the minimization of two-phase and oxygen evolution, which lead to phase separation, is a key strategy to improve the electrode capacity.
Summary and Future Perspectives
In this mini review, we introduced the principle of the full field transmission X-ray microscopy and demonstrate one of the most important works that used this technique on the field of Li ion battery research. The full field transmission X-ray microscopy is a distinct and powerful technique for understanding the morphology changes and determining the mechanism of Li-ion insertion/extraction with the electrode materials during operation. Direct observation images provide significant information regarding the manufacture of Li ion batteries.
Author Contributions
YFS and NHY wrote the manuscript. RSL conceived the idea and designed the writing content. All authors read and confirmed the paper before the submission.
Conflict of Interest Statement
The authors declare that the research was conducted in the absence of any commercial or financial relationships that could be construed as a potential conflict of interest.
Acknowledgments
This work was supported by the Ministry of Science and Technology of Taiwan with contract no. MOST 104-2113-M-002-012-MY3 and Economic Affair of Taiwan with contract no. 107-EC-17-A-22-0497.
References
Attwood, D. (1999). Soft X-ray and Extreme Ultraviolet Radiation. Cambridge: Cambridge University Press
Chen, C. J., Pang, W. K., Mori, T., Peterson, V. K., Sharma, N., Lee, P. H., et al. (2016). The origin of capacity fade in the Li2MnO3·LiMO2 (M = Li, Ni, Co, Mn) microsphere positive electrode: an operando neutron diffraction and transmission X-ray microscopy study. J. Am. Chem. Soc. 138, 8824–8833. doi: 10.1021/jacs.6b03932
Ebner, M., Marone, F., Stampanoni, M., and Wood, V. (2013). Visualization and quantification of electrochemical and mechanical degradation in Li ion batteries. Science 342, 716–720. doi: 10.1126/science.1241882
Mansuripur, M. (2002). Classical Optics and Its Applications. Cambridge: Cambridge University Press.
Schneider, G. (1998). Cryo x-ray microscopy with high spatial resolution in amplitude and phase contrast. Ultramicroscopy 75, 85–104. doi: 10.1016/S0304-3991(98)00054-0
Wang, J., Chen-Wiegart, Y. C., and Wang, J. (2014). In operando tracking phase transformation evolution of lithium iron phosphate with hard X-ray microscopy. Nat. Commun. 5:4570. doi: 10.1038/ncomms5570
Wolf, M., May, B. M., and Cabana, J. (2017). Visualization of electrochemical reactions in battery materials with X-ray microscopy and mapping. Chem. Mater. 29, 3347–3362. doi: 10.1021/acs.chemmater.6b05114
Keywords: battery, electrode, in-situ, in-operando, transmission X-ray microscopy
Citation: Yang NH, Song YF and Liu RS (2018) In-Situ Transmission X-Ray Microscopy Probed by Synchrotron Radiation for Li-Ion Batteries. Front. Energy Res. 6:56. doi: 10.3389/fenrg.2018.00056
Received: 27 February 2018; Accepted: 04 June 2018;
Published: 03 July 2018.
Edited by:
Verónica Palomares, University of the Basque Country (UPV/EHU), SpainReviewed by:
Manickam Minakshi, Murdoch University, AustraliaDaniel Hernández-Cruz, Autonomous University of Chiapas, Mexico
Copyright © 2018 Yang, Song and Liu. This is an open-access article distributed under the terms of the Creative Commons Attribution License (CC BY). The use, distribution or reproduction in other forums is permitted, provided the original author(s) and the copyright owner(s) are credited and that the original publication in this journal is cited, in accordance with accepted academic practice. No use, distribution or reproduction is permitted which does not comply with these terms.
*Correspondence: Yen-Fang Song, c29uZ0Buc3JyYy5vcmcudHc=
Ru-Shi Liu, cnNsaXVAbnR1LmVkdS50dw==
†These authors have contributed equally to this work.