 Eibar Flores
 Petr Novák
 Erik J. Berg
- 1Electrochemistry Laboratory, Energy and Environment Research Division, Paul Scherrer Institute, Villigen, Switzerland
- 2Department of Chemistry, Ångström Laboratory, Uppsala University, Uppsala, Sweden
In situ and operando Raman spectroscopy is proposed to provide unique means for deeper fundamental understanding and further development of layered transition metal LiMO2 (M = Ni, Co, Mn) oxides suitable for Li-ion battery applications. We compare several spectro-electrochemical cell designs and suggest key experimental parameters for obtaining optimum electrochemical performance and spectral quality. Studies of the most practically relevant LiMO2 compositions are exemplified with particular focus on two experimental approaches: (1) lateral and axial Raman mapping of the electrode's (near-) surface to monitor inhomogeneous electrode reactions and (2) time-dependent single-particle spectra during cycling to analyze the LixMO2 lattice dynamics as a function of lithium content. Raman Spectroscopy is claimed to provide a unique real-time probe of the M-O bonds, which are at the heart of the electrochemistry of LiMO2 oxides and govern their stability. We highlight the need for further fundamental understanding of the relationships between the spectroscopic response and oxide lattice structure with particular emphasis on the development of a theoretical framework linking the position and intensity of the Raman bands to the local LixMO2 lattice configuration. The use of complementary experimental techniques and model systems for validation also deserve further attention. Several novel LiMO2 compositions are currently being explored, especially containing dopings and coatings, and Raman spectroscopy could offer a highly dynamic and convenient tool to guide the formulation of high specific charge and long cycle life LiMO2 oxides for next-generation Li-ion battery cathodes.
Introduction
Lithium-ion batteries (LIBs) are the currently best performing electrochemical energy storage system on the market and are now helping to transform the transportation sector with hybrid and electric vehicles. Although the LIB performance is steadily improving, the demand for more energy (longer driving ranges), higher power output (stronger acceleration), improved dis-/charge efficiency, longer cycle lifetime, and higher safety continue to push the technology to its limits and sometimes beyond, as some accidents did show. It is therefore very important to fully understand the basics of LIBs (Berg et al., 2015; Nitta et al., 2015). Most research efforts today focus on the positive electrode (commonly referred to as cathode) due to its decisive role in delimiting the overall LIB performance (Tarascon, 2010). During operation, Li+ de-/intercalate from/into the cathode, which as a result may undergo several transformations in its atomic (lattice symmetries, internal coordinates, defects), electronic (band occupation, energy, overlap) and surface (reconstruction and reaction layers) configurations. The nature and extent of such transformations and particularly their reversibility define cathode performance and in extension its suitability for a given battery application.
The family of layered transition metal oxides LiMO2 (M = Ni, Co, Mn) with α-NaFeO2 structure are the most attractive positive electrodes for LIBs (Ellis et al., 2010). Their development was triggered after LiCoO2 was found to reversibly react with Li+ and successfully commercialized for portable electronics applications (Blomgren, 2017). Since then, several M substituted versions have been explored and higher capacity, higher operating voltage, longer lasting, and cheaper Li-ion cathodes have been achieved. Despite these continuous incremental increases in performance of LiMO2 based cathodes during the past decade, there is still plenty of room for improvements, but progress is slow due to the lack of fundamental understanding of the adverse side reactions of this class of active materials. Particularly the underlying mechanisms governing irreversible structural phase transformations (induced by mechanical stress and cracking, cation site mixing, lattice oxygen release, and electrolyte decomposition) require further characterization and analysis in order to devise new design principles and guide further scientific and engineering efforts (Vetter et al., 2005; Ellis et al., 2010; Hausbrand et al., 2015; Hou et al., 2016; Mai et al., 2017).
Conventional characterization techniques typically monitor long-range atomic ordering (neutron and x-ray diffraction), bulk electronic and coordination structures (x-ray absorption/emission/scattering and nuclear magnetic resonance), composition and morphology (electron microscopies and spectroscopies) of the oxides, (Grey and Dupré, 2004; McBreen, 2009; Huang and Ikuhara, 2012; Balagurov et al., 2014; Shao, 2014; Qian et al., 2015; Sharma et al., 2015) which all in turn are correlated to their electrochemical performance (as probed by galvanostatic dis-/charge cycling, transient pulse tests and impedance spectroscopy). For commercial-like cells these techniques are however mostly or solely applied ex situ, that is, the oxides are analyzed before and/or after electrochemical cycling because of their inherent experimental restrictions (such as sample preparation procedure, high vacuum or confined geometries). Although ex situ measurements provide a first approach and often guide more specialized experiments, there are serious limitations: (i) most dynamic information is lost due to thermodynamic relaxation of the oxides during preparation for analysis, (ii) the risk of contamination and surface modification during transfer/washing, (iii) the voltage (or state of lithiation) interval between measurements is limited to how precise can be controlled the cycling stopping conditions on different electrodes, and (iv) the use of a different electrode for each measurement requires a highly controlled electrode preparation and composition with reproducible electrochemical data to compare with.
Raman spectroscopy is a highly versatile technique widely used to characterize electrode materials (Baddour-Hadjean and Pereira-Ramos, 2009). Briefly, a monochromatic light source with frequency v0 is shined upon the sample and the scattered light is collected, filtered, and decomposed into a frequency Raman spectrum by a dispersive element (e.g., a grating). Scattered light with frequencies λi ± v0 slightly deviating λi from the frequency of the irradiating light source v0 arise after interaction with the sample. The shifted frequencies λi are characteristic of its atomic vibrational modes [for a comprehensive tutorial on Raman Spectroscopy, we refer e.g. to the book by Ferraro et al. (2003)]. Since v0 usually is a frequency within the visible range of the electromagnetic spectrum, Raman spectroscopy possesses inherent advantages for operando characterization of electrode materials, including: (i) the light probe is potentially non-destructive, (ii) single oxide secondary particles in the composite electrode can be studied by using a microscope with a (sub-) micrometer lateral resolution, (iii) common window materials transparent to visible light can be implemented in the electrochemical cell for operando measurement, (iv) the spectrum acquisition time scales (in the order of seconds) available in standard instrumentation enable sufficient time resolution, and (v) strong infrared absorbers such as electrolyte solvents display moderate Raman signals and thus enable discerning vibrations from inorganic oxide particles.
The number, frequencies and intensities of the modes (or bands) in the Raman spectrum reveal fundamental lattice and bonding properties of the sample down to several hundreds of nanometers from its surface. A detailed analysis of the Raman spectra can infer lattice symmetry, coordination geometry, oxidation state, the coexistence of several phases, the presence of defects, impurities, strains and other phenomena relevant for the characterization of electrode materials for LIBs, as summarized in the comprehensive review from Baddour-Hadjean et al. (Baddour-Hadjean and Pereira-Ramos, 2009). Further reviews emphasize the effects of electrode interactions with electrolyte (Aurbach et al., 2007), the historical development of in situ experimental setups (Stancovski and Badilescu, 2014), and highlight results obtained by in situ electrode mapping (Shao, 2014). Raman spectroscopy applied on other battery chemistries such as lithium-oxygen (Gittleson et al., 2015) and lithium-sulfur (Tan et al., 2017) face similar challenges as in LIBs, therefore, they are also instructive. However, most measurements are performed ex situ due to the limitations outlined above. In situ and operando Raman measurements are on the contrary desired because the Raman spectrum is sensitive to particle size (Wang et al., 2002) and preferential crystallite orientations (Tornheim et al., 2017), which can vary from sample to sample and render an ex situ comparison difficult or impossible. In addition, spectral features from different particles at a given state of charge are inherently disperse due to lateral (Lei et al., 2005) and axial (Gilbert et al., 2018) (de)lithiation inhomogeneities.
Herein we propose that in situ and operando Raman spectroscopy provides unique means for deeper fundamental understanding and further development of layered transition metal LiMO2 (M = Ni,Co,Mn) oxides suitable for Li-ion battery applications. In order for us to argue for the future prospects of the technique we report on the past progress in the field and compare with our recent findings along with our interpretations. We start by comparing several spectro-electrochemical cell designs and discuss measurement parameters we consider crucial for obtaining optimum electrochemical performance and spectral quality. In the second part, we illustrate how the currently available experimental setups already permit in situ and operando measurements on LiMO2 with high spectral and time resolutions. In particular, a comparison of our results on LiCoO2, LiNi0.8Co0.15Al0.05O2, and LiNi0.33Co0.33Mn0.33O2 to previous experimental data reveal that each oxide displays an intrinsic Raman response to (de)lithiation, which we rationalize based on cycling-dependent changes of oxygen local environment and electronic structure. We conclude our report by proposing means of how in situ/operando Raman spectroscopy can be further developed beyond state-of-art to provide novel insights into LiMO2 degradation processes, both on the electrode as well on the material level.
Experimental Considerations
The key challenge in the design of an in situ/operando cell for Raman spectroscopy is to incorporate an optically transparent window while keeping optimal electrochemical performance of the cell, a task full of compromises that have been historically approached with diverse cell designs (Stancovski and Badilescu, 2014). Examples of cell configurations are beaker (Figure 1A) (Inaba et al., 1995), Swagelok (Gross et al., 2013; Gross and Hess, 2014), pouch cell (Figure 1B) (Ghanty et al., 2015), coin-type (Singh et al., 2012; Huang et al., 2016), and custom-made cells (Novák et al., 2000) (Figure 1C). The beaker cell design can be easily assembled, customized and reused with different electrode chemistries; however both electrode geometry and excess electrolyte filling are very far from the specifications typically found for commercial LIB cells. The pouch-type design requires more effort in the assembly since most of the components are for single-time use and disposed after every measurement. Reproducing the exact electrode alignment and pressure may also prove difficult. Several coin-cell type designs employ reusable components and the electrode assembly is fitted within a cell frame machined to the exact dimensions of the electrodes, thus minimizing the risk of misalignment. Our work focused on the development of a custom-made coin-cell type configuration (Figure 1C) and we had identified many key parameters for achieving optimum performance:
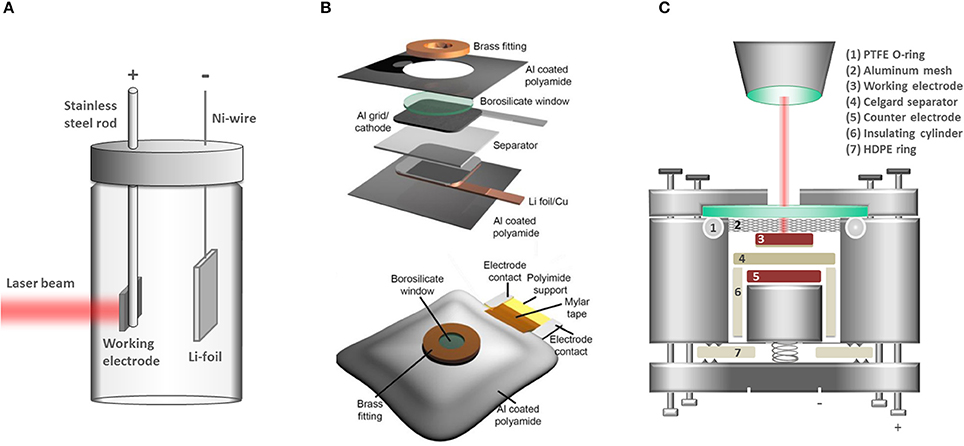
Figure 1. Typical cell designs for in situ/operando Raman spectroscopy. (A) Beaker (pyrex) cell design used e.g., by Inaba et al. (1995). (B) Pouch cell from Ghanty et al. [reprinted from reference (Ghanty et al., 2015) with permission of John Wiley and Sons]. (C) Custom-made coin-cell type design developed in our group.
Working Distance
The distance between the light source and the probed oxide sample should be minimized in order to maximize the solid angle of scattered light collection thereby improving the signal-to-noise ratio (Hendra, 2006). More importantly, minimizing the working distance also reduces the amount of electrolyte-filled space between the electrode and the optically transparent window, which reduces the strong Raman scattering from the electrolyte. To this point, the thickness of the optical window is already of importance and our choice fell on a thin microscope glass (thickness 100 μm).
Cell Sealing
Gas leaking into and electrolyte leaking from the cell result in poor electrochemical performance and higher risk of measuring artifacts associated with side reactions. Tight sealing is generally achieved by compression of rubber and/or plastic O-rings. Special care is however necessary to guarantee the chemical stability of the sealant in contact with the electrolyte. We have found both polytetrafluoroethylene (PTFE) and high density polyethylene (HDPE) O-rings to be chemically resistant toward typical Li-ion battery carbonate based electrolytes and effective in sealing the cell body toward leakage (cell part #6-7, Figure 1C).
Electrode Pressure
A strong mechanical compression of the electrode assembly is necessary to ensure the electrode integrity and reduce cell overpotentials (Poli et al., 2011). For instance, inappropriate electrical contact between the electrodes and their current collectors would lead to inhomogeneous electrode reactions and eventually misinterpretation of underlying cell (electro-)chemistry. A uniform and stable electrode compression is typically achieved by employing a spring and a hard window to resist fracture. In our studies the spring provides a pressure over the electrode stack of ca. 20 N/cm2 (Lanz et al., 2013).
Electrode Size
Although only a few micrometer electrode surface is necessary for conventional Raman Spectroscopy based microscopes, small electrodes are difficult to handle and increase the risk of electrode misalignment and edge effects during electrochemical cycling. In addition, small electrodes require low currents that may approach the sensitivity limits of typical galvanostats.
Electrolyte Choice
Organic carbonate based electrolytes with LiPF6 salt are almost exclusively used for commercial batteries. However, the LiPF6 salt is prone to form fluorescent species, which result in high baselines that mask the Raman signals (Kostecki and McLarnon, 2004; Jarry et al., 2015). Many Raman spectroscopy studies therefore rather employ LiClO4 salt for the electrolyte to reduce fluorescence masking and display comparable electrochemical performance in short term experiments (Xu et al., 2004).
Reactivity of Cell Components
All materials in contact with the electrodes and electrolyte (cell body, sealing parts, transparent window) should be chemically and electrochemically stable. For instance, polyetherketones (PEEK) belong to few plastics sufficiently stable in contact with metallic Li and thus often employed for operando cell designs. Construction materials including fluorine, especially Teflon, should preferably be avoided because of their reactivity with metallic Li.
Laser Excitation Wavelength
The laser excitation wavelength can influence the Raman band intensity since the radiated power by an oscillating dipole is inversely proportional to the fourth power of the laser wavelength (I ~ λ−4) (Keresztury, 2006), e.g., shifting from 514 nm to 633 nm excitation reduces the Raman scattering power by 43%. However, several layered materials are prone to electronic resonance (Ammundsen et al., 1999; Dokko et al., 2002; Julien, 2002; Gross and Hess, 2014), that is, the intensity of certain Raman bands is greatly enhanced if the excitation wavelength approaches or matches the energy of an electronic transition. The closer the laser photon energy is to the materials band-gap, the stronger the enhancement of the Raman cross-section (Clark and Dines, 1986). In this context, the resonance effect can be deliberately exploited for obtaining better signal to noise ratios. Figures 2A,B show an example from a study where a laser excitation of 633 nm (1.9 eV) was chosen to measure the Raman spectrum of HNiO2 since this wavelength has the closest energy to the materials band gap of 1.8 eV (as estimated by UV-Vis measurements) and consequently results in greatly enhanced Raman signals (Chen et al., 2016). In addition, an appropriate choice of excitation wavelength can minimize fluorescence effects. The degree of fluorescent emission depends on how close the laser wavelength is to the absorption maxima of the fluorescent species, which generally is found toward the blue side of the visible spectra (Kostecki and McLarnon, 2004; Jarry et al., 2015). In summary, the laser excitation wavelength is a compromise between a high Raman scattering power (I ~ λ−4, i.e., shorter wavelengths preferred) and the need for a low background signal (i.e., longer wavelengths preferred to reduce the fluorescence background) (Julien et al., 2006).
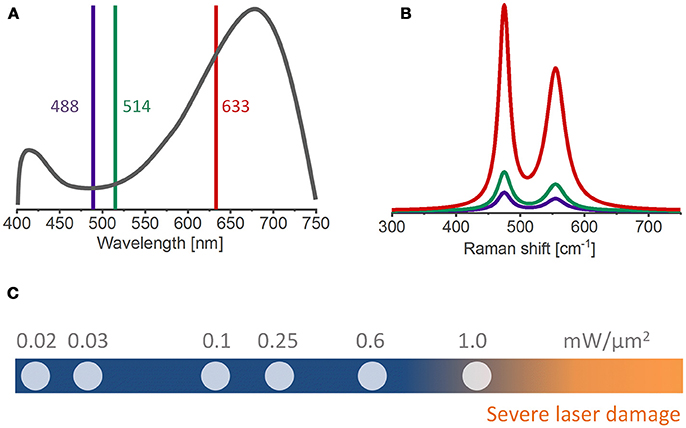
Figure 2. (A) UV-Vis and (B) Raman spectra of HNiO2 using different excitation wavelengths [adapted from reference (Chen et al., 2016)]. The 633 nm wavelength, closest to the absorption maxima of the material, yield enhanced Raman bands. (C) A range of laser specific powers commonly used in ex situ and in situ Raman measurements. The risk of laser-induced sample burning and/or structural changes increases for laser powers above 1 mW/μm2.
Laser Specific Power
The laser specific power should be sufficiently high to achieve reliable signal-to-noise ratios, but low enough to avoid laser-induced sample transformations. Most measurements reported herein couple the Raman spectrometer to an optical microscope in order to achieve sampling spot sizes down to 1 μm. Irradiating such small areas with high photon fluxes increases the risk of laser induced sample burning. Typical laser specific powers range from 0.01 to 1.0 mW/μm2 (Figure 2C). Ruther et al. shows that a lithium-rich oxide is susceptible to laser-induced phase transformations generally above 1.0 mW/μm2, but this limit can be lower for delithiated electrodes (Ruther et al., 2014) and even lower for in situ/operando conditions because of the presence of the organic electrolyte. An in situ stability test of the material at different laser powers for each type of experiment is recommended to avoid laser-induced sample transformations. Of course, electrolyte boiling with bubble formation must be avoided under any circumstances.
For the operando Raman spectroscopy measurements reported herein, the Raman spectra were acquired using a Labram HR800 Raman microscope (Horiba- Jobin Yvon) with a He–Ne excitation laser (632.8 nm). A grating was used as dispersion element with a groove density of 600 g/mm that attains a 2 cm−1 spectral resolution. The hole and slit of the confocal system were fixed at 1,000 μm and 100 μm, respectively. The laser was focused on the sample using a 50 × (numerical aperture 0.55) objective, which produced a laser spot of ca. 4 μm diameter. The nominal laser power was filtered down 2 mW or 0.2 mW to avoid sample overheating. Every spectrum recorded results from the average of at least 5 acquisitions of more than 100 s each, depending on the intrinsic Raman scattering power of the active material. Composite electrodes were conventionally prepared by mixing oxide powders [LiCoO2 (Alfa Aesar), LiNi0.8Co0.15Al0.05O2 (Toda), LiNi0.33Co0.33Mn0.33O2 (BASF)] with conductive carbon (Super C65, Imerys Graphite and Carbons) and PVdF binder (Solvay) in NMP, coating the formed slurry on top of Celgard 2400 separator (Celgard LLC) with a wet thickness of 100 μm, and letting it dry overnight at 80°C. The electrodes were punched (14 mm diameter), re-dried in dynamic vacuum (80°C for >12 h), and assembled in our custom-made Raman cell (Figure 1C), together with an electrolyte-wetted Celgard 2400 separator (16 mm diameter, Celgard LLC) and a lithium metal disk (0.2 mm thick, 12 mm diameter, Sigma-Aldrich). More details on electrode preparation are reported elsewhere (Streich et al., 2017) and the employed electrolyte is 1M LiClO4 in 1:1 (w/w) ethylene carbonate(EC)/dimethyl carbonate (DMC). All operando experiments were performed at 10 mA/g rate between 3.0 and 4.3 V vs. Li+/Li.
Progress of in situ/Operando Raman Spectroscopy on LiMO2 Oxides
Background
Figure 3 shows a schematic representation of the LiMO2 unit cell. Li, M (Ni, Co, Mn) and O atoms arrange into a rhombohedral layered structure with the space group and consist of octahedrally coordinated cations within an oxygen cubic close-packed network based on ABCABC stacking (O3 phase) forming alternating LiO6 and MO6 slabs. M occupies the 3b Wyckoff sites while Li+ resides at the 3a sites. In this context, the term stoichiometric refers to compounds with only one Li per formula unit, unlike the over-lithiated Li1+yM1−yO2 oxides, which are not considered here. A factor group analysis based on the lattice symmetry predicts two Raman active modes for each transition metal in the unit cell: the Eg mode (Figure 3, orange arrows) involving an opposite motion of oxygens along adjacent O-layers and the A1g mode where oxygens move symmetrically along the c-axis and is mostly stretching in character (Figure 3, purple arrows) (Julien, 2000). Stretching modes are typically stiffer than bending modes, so the higher wavenumber band is assigned to the A1g mode whereas the lower wavenumber band is assigned to the Eg mode.
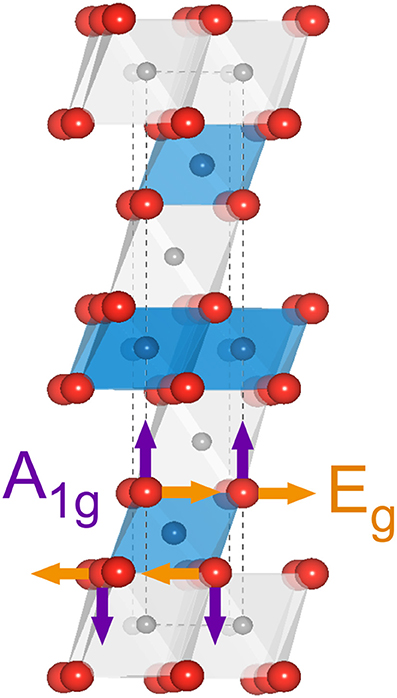
Figure 3. Schematic representation of the LiMO2 unit cell. The gray, blue and red spheres represent Li, M and O atoms, respectively. The atomic displacements from Eg and A1g vibrational modes are shown in orange and purple arrows, respectively.
Figure 4 shows the Raman spectrum we have recorded of LiCoO2 (top) and LiNiO2 (bottom) pristine powders, along with several substitutional variants. Raman spectrum assignments are as discussed above generally based on the number of observed bands, their positions in wavenumbers and relative intensities. Assignment of LiCoO2 spectrum is straightforward since it clearly displays only the two expected Eg and A1g Raman active modes (Inaba et al., 1997). However, the substitution of further transition metals (M = Mn, Ni, etc.) results in complex spectral envelopes displaying more bands than the expected A1g/Eg pair of modes, thus complicating interpretation. Several previous reports implicitly assume that a spectrum is uniquely determined only by the 1st coordination shell around M (i.e. individual MO6 octahedra), which renders the spectral envelope of mixed LiMO2 (M = Ni+Co+Mn) a simple combination of six bands: an Eg/A1g pair from NiO6, another from CoO6, and a third pair from MnO6, each at the same wavelength positions as expected for LiNiO2, LiCoO2 and α-LiMnO2, respectively. Such an approach presumes that each pair contributes to the total intensity according to the particular M proportion and the result would be equivalent to simply mixing LiNiO2, LiCoO2, and α-LiMnO2 powders (Zhang et al., 2010; Ben-Kamel et al., 2012; Ruther et al., 2014; Ghanty et al., 2015). In an apparent support of this idea, the presence of Mn in the LiMO2 lattice generally correlates to the existence of broad bands above 600 cm−1 (Figures 4B–D), which are absent in Mn-free oxides (Figures 4A,E,F) and grow in intensity together with the Mn proportion. The bands > 600 cm−1 can thus be tentatively assigned to A1g modes of MnO6 octahedra. However, increasing the Mn proportion also shifts those bands to higher wavenumbers (Figures 4B–D), suggesting a concomitant evolution of the Mn-O bonding strength. Our further analysis of Figure 4 provides no clear relations between the spectral envelopes and the composition of the oxides. For instance, a simple sum of contributions does not capture the influence of Co substitution in LiNiO2 (Figures 4E,F) since increasing Co proportion induces a general band broadening and a blue-shift of the A1g mode (Julien, 2000) instead of resulting on independent Co and Ni A1g bands, as expected given they are separated by 53 cm−1 in the pure compounds (Figures 4A–F). The previous example and several others (Koga et al., 2012; Ruther et al., 2014) illustrate the difficulty in assigning and interpreting the Raman spectra of LiMO2 since the band positions, widths and intensities rather reflect strongly coupled local environments resulting from complex interactions between homogeneously distributed transition metals in the 3b Wyckoff sites. Furthermore, we stress that even comparisons of spectra from oxides of similar composition, particularly when measured at different setups under different experimental conditions, are a challenge and requires very mindful analysis of several effects introducing spectral variations. For instance, the oxide crystal size (Gouadec and Colomban, 2007), orientation (Inaba et al., 1997; Tornheim et al., 2017), purity (Gouadec and Colomban, 2007) and even internal stresses (Wang et al., 2005) within the oxide can significantly modulate the spectra. Experimental conditions, such as temperature, incident light polarization and wavelength, as well as sample exposure times also necessarily have to be taken into consideration, which is immediately seen in the comparison of measurements from different literature sources below. In the following examples we mainly focus on how spectra of several LixMO2 oxides vary upon delithiation (x < 1) and how the change may be related to oxygen stacking order, lattice parameters, electronic band structure, bond characters and lengths.
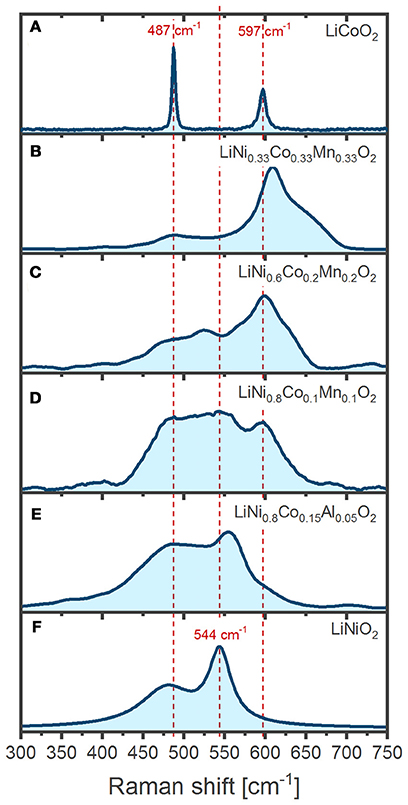
Figure 4. Comparison of the Raman spectra from various isostructural LiMO2: (A) LiCoO2 (LCO) (B) LiNi0.33Co0.33Mn0.33O2 (NCM111) (C) LiNi0.6Co0.2Mn0.2O2 (NCM622) (D) LiNi0.8Co0.1Mn0.1O2 (NCM811) (E) LiNi0.8Co0.15Al0.05O2 (NCA) (F) LiNiO2 (LNO).
LiCoO2 (LCO)
Practical electrochemical delithiation of LCO is limited to a x = 0.5–0.6 (cutoff potential ~ 4.2 V vs. Li+/Li, going up to ca. 4.3 V for more advanced industrial LCO cells). Above 4.2 V there is a risk of oxygen gliding (Lu et al., 2012) and oxidation (Ensling et al., 2014), which can quickly deteriorate the electrochemical performance unless the LCO is doped and surface coated. Pristine LiCoO2 powder displays two Raman bands as expected, which are sharp and intense (Figure 4A). The intensity of the band at 596 cm−1 has a strong dependence on the polarization of the incident radiation so it has been assigned to the A1g mode while the Eg mode is assigned to the band at 486 cm−1 (Inaba et al., 1997; Perkins et al., 1997; Liu et al., 2015a). Despite similar compositions, the spectra of LCO below illustrate that the experimentally measured position and relative intensity of the Eg and A1g bands differ between literature reports, which is as discussed above related to slightly differing experimental condition during oxide synthesis, electrode preparation, and measurement configuration.
The evolution of the Raman bands upon delithiation had been vaguely interpreted in the literature, but we believe they are dominated by the insulator-metal transition of LCO. Delithiation (1.0 > x > 0.95) leads to a diluted concentration of lithium vacancies VLi that bind to electron holes to form an impurity band in the electronic density of states (DOS), which renders the material an electric insulator (Marianetti et al., 2004). When the number of VLi increases on further delithiation (0.95 > x) this particular hole configuration is disrupted and a new phase grows with metallic-like conduction (Ménétrier et al., 1999). The region 0.95 > x > 0.75 is described as a two-phase transition between Li0.95CoO2 (Mott-insulator) and Li0.75CoO2 (metal). The latter phase is 3-orders of magnitude more conductive (Takahashi et al., 2007) than Li0.95CoO2, thus drastically shallowing the penetration depth of the laser due to the so-called skin effect. Consequently, both Raman bands of LCO weaken in intensity as the Li0.75CoO2 phase grows. Although many reports evidence a drastic vanishing of the bands within the 0.95 > x > 0.75 region (Itoh et al., 2000; Kuwata et al., 2012), several studies present spectra in which the band intensities survive past 0.75 > x and display weakened, broader and red shifted bands (Figure 5A, middle) (Heber et al., 2015; Otoyama et al., 2016a; Snyder et al., 2016; Park et al., 2017). Peak asymmetries (Figure 5A, top) possibly reveal the presence of the second phase Li0.75CoO2 with a larger c-lattice parameter (Inaba et al., 1997; Nishi et al., 2013). However, the origin of such disparate results between studies of LCO is unclear. Our operando measurements (Figure 5A, bottom) show that both Raman bands of LCO quickly fade as soon as delithiation starts with no remaining intensity once the lithium content drops below x = 0.92, thus indicating that the metallic phase appears from the very beginning of the delithiation process.
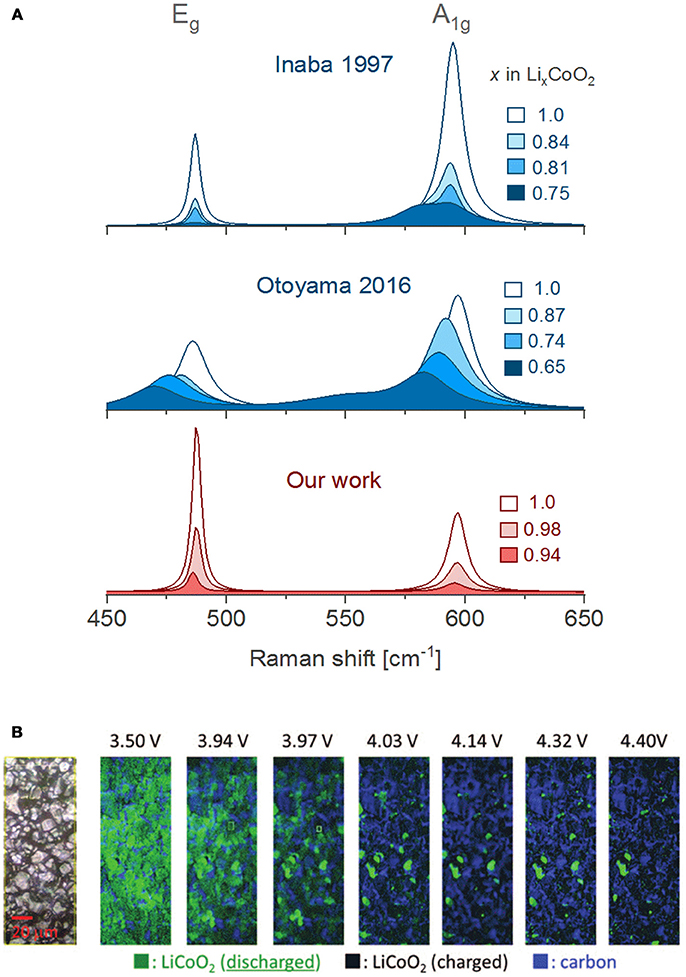
Figure 5. (A) Comparison of in situ/operando Raman spectra obtained by Inaba et al. using a PC based liquid electrolyte (Inaba et al., 1997), Otoyama et al. in an all-solid-state cell (Otoyama et al., 2016a) and our results using an EC/DMC based liquid electrolyte. (B) In situ Raman mapping of a composite LiCoO2 electrode during the first charge (reprinted from reference Nishi et al., 2013 with minor editions, with permission of the Electrochemical Society). All spectra were here adapted for clarity of comparison.
On relithiation the bands return to their initial positions (Kuwata et al., 2012), but with significantly weakened intensities [(Itoh et al., 1997, 2000) and our results] and sometimes overlap with new bands (Snyder et al., 2016). The lower intensities result from an incomplete relithiation and a persistence of the conducting Li0.75CoO2 phase. Long-term cycling has showed that the bands keep weakening and broadening when comparing spectra at the end of every lithiation (Snyder et al., 2016) until they entirely disappear > 300 cycles (Kuwata et al., 2012). The insulating phase Li0.95CO2 is no longer recovered due to Li-consuming electrolyte side reactions (Snyder et al., 2016) or Li+ trapped in cracked (isolated) particles (Kuwata et al., 2012). The insulator-metallic transition of LCO can be further exploited for real-time monitoring of inhomogeneous electrode reactions. In situ electrode mapping (Figure 5B) by contrasting lithiated and delithiated particles has demonstrated that delithiation is spatially inhomogeneous: after charge around 6% of the particles remain lithiated, and after discharge ca. 10% of the particles remain delithiated. These observations illustrate severe SOC inhomogeneity within the composite electrode (Nishi et al., 2013).
LiNiO2 (LNO)
LiNiO2 (LNO) offers a higher specific charge at lower cost compared to LCO, but the partial presence of divalent Ni in lithium sites complicates the synthesis of the stoichiometric material and several detrimental phase transformations driven by lithium vacancy ordering result in rapid capacity fade during cycling (Delmas et al., 1999; Kalyani and Kalaiselvi, 2005). The Raman spectrum of LNO is barely reported in the literature and only ex situ spectra of its powder form have been presented (Julien, 2000; Zhang et al., 2005). The two main bands expected for the space group are observed at 465 and 545 cm−1 and assigned to the Eg and A1g phonon modes, respectively, in analogy to the LCO spectrum (Julien, 2002).
The Raman spectrum of the LixNiO2 powder electrochemically delithiated to x = 0.8 has been reported to show broadened, weakened and red shifted bands compared to the pristine spectrum (Figure 6, top) proposedly resulting from either a reduction of the rhombohedral distortion and/or an increase in electronic conductivity as in the case of LCO. However, compared to LCO (Takahashi et al., 2007), the electronic conductivity of LNO barely changes upon delithiation (Molenda et al., 2002), and any influence thereof should be minor. Our ex situ experiments show that electrochemical delithiation of the powder (LiNiO2, Aldrich) to x = 0.4 (Figure 6, bottom) results in sharper and stronger bands (along with a new shoulder at 572 cm−1), which agrees with the observations for other Ni-rich LiMO2 discussed below. However, the spectra from Julien et al. and ours were recorded at differing SOC (x = 0.8 and 0.4, respectively) and one should again consider that the electrochemical response of LiNiO2 might vary largely given its sensitivity to the synthesis conditions and electrode preparation procedure (causing inhomogeneous electrode reactions). In addition, Julien et al. employed a 476 nm laser excitation instead of a 632 nm used in our work. The latter wavelength probes the material near resonance conditions, assuming that the absorption maxima for LiNiO2 is the same as reported for isostructural HNiO2 (Clark and Dines, 1986; Chen et al., 2016). We nevertheless stress that there is a lack of data and further in situ/operando Raman measurements are necessary to elucidate the inherent behavior of these Raman bands and relate them to the known crystallographic transformations occurring during cycling; such links would be highly valuable to understand the redox activity of other Ni-rich layered oxides such as NCA and NCM811 as well.
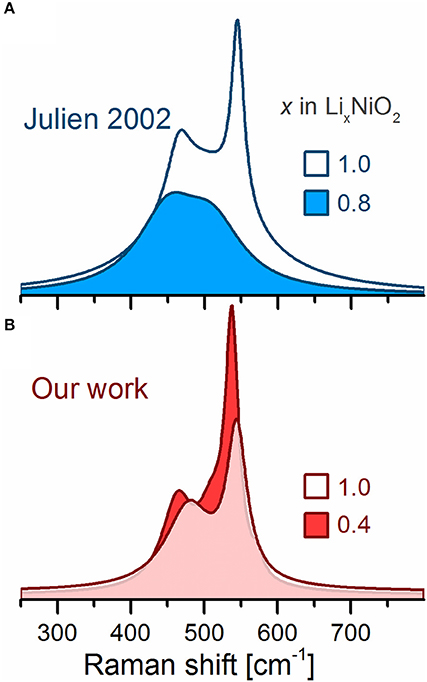
Figure 6. Ex situ Raman spectra of electrochemically delithiated LiNiO2. (A) Spectra adapted from Julien (2002). (B) Our results.
LiNi0.8Co0.15Al0.05O2 (NCA)
Co and Al substitution within LiNiO2 improves significantly the structural stability and electrochemical performance of the oxide (Delmas and Croguennec, 2002; Chen et al., 2004), The optimized composition LiNi0.8Co0.15Al0.05O2 has been successfully commercialized for use in electric vehicles (e.g., Tesla Model X) (Blomgren, 2017). Pristine NCA displays two main Raman active bands, which again are assigned to the Eg (485 cm−1) and the A1g (560 cm−1) modes (Figure 7A). Upon delithiation the bands intensify but at different rates. Although the origin of such behavior is unknown, the x-dependent Eg/A1g intensity (or area) ratios have been used for in situ mapping of the SOC of the individual NCA particles in the composite electrodes (Lei et al., 2005). Compositional maps reveal the occurrence of inhomogeneous electrode reactions analogous to the observations for LCO described above (Figure 5B). For instance, several NCA particles were evidenced to remain lithiated during cycling while others reach undesirably high levels of delithiation (Nanda et al., 2011). These inhomogeneities seem to originate from a retreat of the conductive carbon additive upon cycling, equally observed by composition maps of the carbon Raman active bands. Carbon retreat leads to electronic disconnection of the NCA active particles, which thus experience non-uniform delithiation rates and state of charge throughout the electrode (Kostecki and McLarnon, 2004; Kostecki et al., 2006; Kerlau et al., 2007).
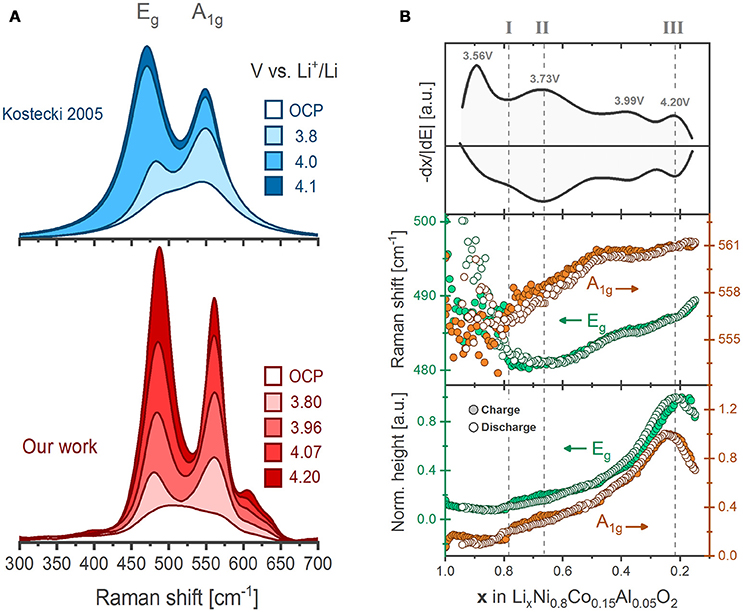
Figure 7. (A) Comparison of the in situ evolution of NCA Raman spectrum as recorded by Kostecki et al. (Lei et al., 2005) and here adapted along with our results (Flores et al., 2018). (B) Differential charge plot of NCA together with the fitted peak positions and heights of the Eg and A1g bands as a function of lithium content during the first galvanostatic cycle between 3.0 and 4.3 V vs. Li+/Li (~C/20 rate). Each data point result from the deconvolution of a single spectrum.
Recently, we recorded operando the spectral evolution of the Raman bands of NCA during three full dis-/charge cycles. In qualitative agreement with previous works, the bands display a general growth on delithiation (Figure 7A) (Lei et al., 2005). In addition, a set of new bands above 600 cm−1 are clearly resolved enabled by our improved signal-to-noise ratio. The spectral trends resemble those of LiNiO2 (Figure 6, bottom) suggesting they are inherent to Ni-rich oxides. All band positions, intensities and widths were retrieved by deconvoluting the spectral envelope into Lorentz-type peak profiles at a comparably high time resolution (above 200 spectra per cycle). The band positions and heights during the first cycle (Figure 7B) show remarkable reversibility on dis-/charge and clearly correlate to the redox activity of NCA. The highly detailed shifts in band positions are found uncorrelated to the evolution of crystallographic (average) parameters, thus challenging the believed straightforward relation between lattice parameters and wavenumber shifts. The lack of correlation also emphasizes the dependence of band positions on local lattice features that cannot be resolved by conventional diffraction techniques. The Raman peak trends may be divided into stages indicating three different SOC-dependent processes. Early at x ~ 0.8 (Stage I), a step increase in band intensities occur, which coincides with the commonly reported dissolution of the native –CO3 layer at the surface of NCA particles (observed ~ 3.78 V vs. Li+/Li). Later, at x ~ 0.67 (Stage II) the U-shaped trend of the Eg band positions reaches a minimum and the bands above 600 cm−1 appear and grow in intensity. DFT phonon calculations assign both phenomena to the formation of a local lithium vacancy ordering that coincides with the redox process at 3.73 V vs. Li+/Li for NCA. Approaching the end of charge, at x ~ 0.2 (Stage III), the band intensities of both bands reach their maxima, which coincides with oxygen gas release from NCA. The evidence suggest that the redox process above 4.20 V vs. Li+/Li originates from an O2− → O−/O oxidation involving electron depletion from M-O states and oxygen loss from the lattice. X-ray absorption spectroscopy further supports the hypothesis of bulk oxygen oxidation at high states of charge (Yoon et al., 2007; Kleiner et al., 2015). Our operando Raman spectroscopy measurements with high time resolution was demonstrated to provide further detailed insights into local structural evolution of NCA lattice upon electrochemical cycling (Flores et al., 2018).
LiNiaCobMn1-a-bO2 (NCMs)
Although NCA based electrodes provide outstanding specific charge, a performance fade commonly associated with Ni-migration from the transition metal layer into the Li sites and the safety concerns due to highly exothermic reactions with electrolyte at high SOC motivate the further development of the LiMO2 based oxides (Liu et al., 2015b). Partial substitution with Mn has been found to suppress Li/Ni exchange, improve cycling performance, and several Ni/Co/Mn based LiMO2 oxides, commonly denoted NCMs, have been explored (Noh et al., 2013).
LiNi0.33Co0.33Mn0.33O2 (NCM111)
The Raman spectrum of pristine NCM111 is an envelope of highly overlapping bands (Figure 4B). There are at least three distinguishable bands, at 400 cm−1, 485 cm−1 and 610 cm−1, but a deconvolution of the Eg/A1g pair of bands is not straightforward since the latter is partially overlapped by further bands above 620 cm−1. The presence of more bands than the Eg/A1g pair predicted for a lattice [as confirmed by x-ray diffraction (Lanz et al., 2014)] indicates the existence of distinct, lower local symmetries likely resulting from a complex (Ni/Co/Mn)-O bonding (Sun and Zhao, 2017). Ex situ measurements have nevertheless revealed sufficient spectral differences between NCM111 particles at different SOC to permit for the collection of compositional maps of the composite electrode during cycling. As for LCO and NCA, spatially inhomogeneous electrode reactions also arise in NCM111 based electrodes (Kerlau et al., 2007).
Our operando Raman spectra of NCM111 (Figure 8) start (OCP) and end (4.3 V vs. Li+/Li) with similar spectral envelopes as previously reported ex situ (Kerlau et al., 2007; Otoyama et al., 2016b). Unlike the case for NCA and LCO, the progressive evolution of the spectra upon de-/lithiation is hard to evaluate due to the difficulty of spectral deconvolution. The fitting solution space (goodness of fitting vs. fitting parameters) of the highly overlapping bands is likely to have multiple and virtually indistinguishable local minima, meaning that a unique solution to the fitting problem does not exist. In this sense, our attempts of fitting the bands of NCM111 result in arbitrary parameters likely not representative of the physical system. Meaningful information can however still be obtained by a visual description of the spectral envelopes without attempting deconvolution. Two cycling stages can be distinguished in Figure 8 according to the spectral profiles. In the initial stage (1.0 > x > 0.7) the spectra (in blue) experience a general weakening on delithiation, possibly related to a 6-fold increase in the electronic conductivity (Qiu et al., 2012) of NCM111 due to a band gap narrowing (Hwang et al., 2003). In the second stage (0.7 > x > 0.36) the envelopes clearly transforms as the band at 485 cm−1 sharpens and a new band at 555 cm−1 appears. The cycling-dependent evolution of the spectra is fully consistent with the in situ behavior reported by Lanz et al. (2014). There is no crystallographic evidence of structural transitions with the formation of new phases in the 1.0> x > 0.3 range (Kim and Chung, 2004; Yin et al., 2006). However, since the bands are similar to delithiated LNO (Figure 6) and NCA (Figure 7, left), they likely result from a NiIVO6 – rich environment. The two-staged evolution of the spectral envelope of NCM111 appears to correlate to a stepwise oxidation (1) Ni2+ → Ni3+ and (2) Ni3+ → Ni4+ expected within the 1.0 > x > 0.33 range (Hwang et al., 2003; Kim and Chung, 2004; Tsai et al., 2005), thus suggesting that Ni valence has a significant influence on the spectral profile of NCM111.
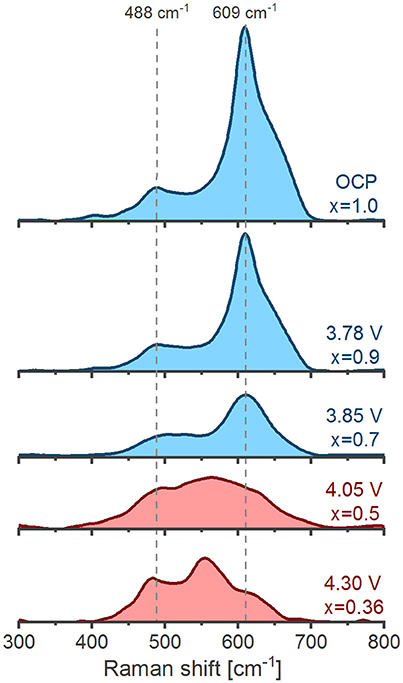
Figure 8. Operando Raman spectra of NCM111 during charge. The evolution of the spectral envelopes is classified into an initial general weakening stage (blue) and a later envelope transformation stage (red).
LiNi0.5Co0.2Mn0.3O2 (NCM523)
To the best of our knowledge neither in situ nor operando spectra of NCM523 has been reported in literature. Ex situ spectra of pristine NCM523 compare reasonably well to NCM111, as shown in reference (Ruther et al., 2014). Electrochemically delithiated NCM523 also displays a pair of bands (Nguyen et al., 2016), but at 500 and 617 cm−1, considerably blue-shifted from the pair observed in NCM111 (485 and 555 cm−1); the shifts might be a consequence of the different balance of Ni oxidation states in the two formulations (Dixit et al., 2017). Ex situ Raman spectroscopic electrode compositional mapping has shown that cracked particles (appearing after 30 cycles) feature broader and red-shifted Raman bands compared to undamaged particles, which was associated with a unit cell volume expansion preceding particle deterioration (Börner et al., 2016). The compositional maps of the electrode cross section clearly reveal the de-/lithiation inhomogeneity expected from electronic disconnections among the cracked NCM523 particles (Gilbert et al., 2018).
LiNi0.8Co0.1Mn0.1O2 (NCM811)
Ex situ Raman spectra (not shown) of pristine and electrochemically delithiated NCM811 composite electrodes are similar to NCA shown in Figure 7, which may be expected from their nearly identical composition. The initially broad envelope of two bands centered at 500 and 558 cm−1 grow, sharpen and red-shift on delithiation (Saavedra-Arias et al., 2009). Ghanty et al. identified several bands in their spectra for NCM811 and assigned an Eg/A1g pair for each transition metal. Their in situ measured spectral bands displayed a general intensity increase on delithiation up to 4.3 V vs. Li+/Li, involving as well non-monotonic band shifts and broadenings. The trends in fitted band parameters was rationalized in form of an evolution of the crystallographic lattice parameters, but due to the strong overlap of the fitted bands, further interpretations could not be made with sufficient certainty (Ghanty et al., 2015).
Concluding Remarks
In situ and operando Raman spectroscopic characterization of LiMO2 oxides for Li-ion battery cathodes has mainly been explored for two purposes: (1) Compositional (near-) surface mapping to monitor inhomogeneous electrode reactions and (2) understanding of LixMO2 lattice evolution during dis-/charge cycles. Raman spectro-electrochemical microscopy can provide micrometer-sized lateral resolution and thereby offers unique access to the de-/lithiation dynamics of individual oxide particles in the Li-ion composite cathodes. Operando mapping of reaction inhomogeneities could—despite the already numerous reports in the field (Kostecki and McLarnon, 2004; Lei et al., 2005; Kostecki et al., 2006; Kerlau et al., 2007; Nanda et al., 2011; Nishi et al., 2013)—be further developed to reveal the underlying causes of electric disconnection and cracking behavior of oxide particles in commercial-like electrodes under varying operating conditions (high current rates, elevated temperatures, etc.). The retrieved Raman spectra may furthermore not solely be employed to contrast individual particles, but in addition be analyzed to identify possible phase transformations and the course of the de-/lithiation processes within the single oxide particles and their aggregates. For that, however, further fundamental understanding of the Raman spectra of the LixMO2 oxide family is a prerequisite. Raman spectroscopy probes the local lattice structure and its physicochemical parameters, such as atomic composition/coordination, crystal symmetry, bond character, length and strength, all contributing to the recorded spectrum. In order to determine the influence of each parameter and their complex interactions, two major challenges have to be overcome, namely: the spectra have to be confidently fitted and interpreted.
The spectral features are however often highly overlapped envelopes that cannot be deconvoluted with unique fitting parameters, thus the behavior of the bands cannot be followed individually during cycling. In order to modulate and optimize the spectral acquisition process, we propose that excitation lasers of different (or tunable) wavelengths should be employed, e.g., to take advantage of effects such as electronic resonance to enhance/suppress individual band intensities.
However, even if a reasonable fitting of band position and intensity succeeds, both need to be interpreted:
Band position: Molecular mechanics tells us that the band position (in units of cm−1 or in vibration frequency) of a given vibrational mode is proportional to the restoring force of any stretching or bending M-O bond motion, or more specifically to the square root of the spring constant of the corresponding bond configuration (Hotokka, 2006). Therefore, band position gauges the propensity of the vibrating atoms (i.e., the oxygens in LiMO2) to remain in their equilibrium position. Both bond length and strength are here decisive and more refined models to justify their respective influence on the vibrational modes are desired.
Band intensity: Although the fading intensity of the Raman bands of LCO during charge can be confidently related to the skin effect, this case is more exception than rule. Particularly the Ni-rich LiMO2 oxides experience no (or a very minor) increase in electronic conductivity during delithiation, yet the bands grow in intensity significantly. Besides the often used skin effect hypothesis, we had identified several plausible phenomena explaining the band intensity changes: (i) Li+ de-/insertion affects the electron distribution around oxygen atoms, which effectively modulates the degree of polarizability of the associated M-O vibrations (Boulet-Roblin et al., 2016). (ii) LixMO2 redox tunes the electronic band gap closer to the laser excitation wavelength and enhances the Raman cross-section by electronic resonance (Clark and Dines, 1986). (iii) Lattice strain build-up due to expansion/contraction of the oxide during cycling can also enhance Raman band intensities (Wang et al., 2005). (iv) A reduction of the rhombohedral distortion of LiMO2 would degenerate the A1g and Eg modes into the inactive T2g mode of the Fm3m cubic lattice (Julien and Massot, 2002; Julien et al., 2006). (v) The transition between Jahn-Teller active and inactive transition metals results in varying degrees of MO6 distortions that can influence the Raman intensities due to change of site symmetry (Nakai et al., 1998; Balasubramanian et al., 2000).
Progress in the field will be slow (or completely arrest) unless more fundamental relationships between the LiMO2 structure and its Raman spectroscopic response are established. As an inspiring example, graphitic materials are nowadays routinely characterized with Raman spectroscopy because such relationships are well known (Tuinstra and Koenig, 1970; Ferrari, 2007; Pimenta et al., 2007; Sole et al., 2014). Achieving a similar level of understanding of LiMO2 will require multiple approaches, of which complementary techniques, model substrates and theoretical modeling deserve emphasis.
Several authors perform complementary structural characterization by x-ray diffraction (XRD) to describe the evolution of the Raman bands of LixMO2 and relate them to crystallographic lattice parameters (Julien, 2000; Ben-Kamel et al., 2012; Ghanty et al., 2015). Intuitively, since the energetics of the lattice influences both the long-range atomic order and the vibration modes, XRD and Raman spectra should hence be much related. Indeed, the Raman spectra of LiMO2 with different M substitution ratios and lithium contents show red/blue band shifts that generally correlate to the expansion/contraction of the lattice parameters (Julien et al., 1997; Julien, 2000, 2002). However, the techniques cannot always be paralleled because they probe fundamentally different ordering scales: XRD reflections indicate average interplanar spacings in a long-ranged atomic ordering while Raman bands originate from short-ranged local environments. The crystallographic lattice parameters and symmetry might remain invariant to the occurrence of highly local phenomena, such as non-cooperative Jahn Teller distortion (Rougier et al., 1995; Chen et al., 2011) and cation ordering (Reimers, 1992; Peres et al., 1999; Zeng et al., 2007), which are thermodynamically favored but invisible when solely investigating the long-range order (Dompablo et al., 2001; Zhecheva et al., 2002). Our recent study of NCA make particular emphasis on the lack of correlation between the lattice parameters and Raman band positions (Flores et al., 2018). Alternative techniques probing the local lattice structure, such as x-ray absorption and nuclear magnetic resonance spectroscopy, are therefore most suitable and further validation studies in the field are desired.
Model substrates could significantly facilitate characterization and band assignment. For instance, single crystals with sufficiently defect-free lattices generally yield sharp Raman bands distinguishable within otherwise broad and overlapping envelopes coming from multi-crystalline inhomogeneous environments. In addition, the dependence of the Raman bands on crystal size and orientation, temperature, light polarization and wavelength could be investigated and provide further insights into the symmetry of the modes and their interactions with electronic and magnetic properties of the oxides (Perkins et al., 1997; Liu et al., 2015a).
Although factor group analysis provides the expected number of Raman active vibrations and an approximate picture of the corresponding atomic displacements (Fateley et al., 1971), the prediction of band frequencies requires an explicit modeling of classical or quantum mechanical atomic interactions (i.e. bonding) (Hotokka, 2006; Matsuura and Yoshida, 2006). Electronic structure calculations are equally important to describe the band intensities, which depend on the effect that the atomic displacements have on the dielectric properties of the lattice (Keresztury, 2006; Maschio et al., 2013). Several modern ab initio software packages contain models to simulate the Raman spectrum of a wide range of materials, including the transition metal oxides. Despite the intensive research and modeling efforts dedicated to the LiMO2 oxides in recent years, few theoretical studies of the Raman spectroscopic response of this important class of oxides have been reported so far.
Looking ahead, surface enhanced Raman spectroscopy (SERS) receives increasing attention in the field of Li-ion batteries and could provide unique insights into the local LiMO2 structure, particularly at the interface to the electrolyte. Tornheim et al. demonstrated that the Raman intensity of NCM523 can be plasmon-enhanced by two orders of magnitude when the particles of active material are electroplated with sub-micron gold clusters (Tornheim et al., 2017); hence, the spectra recording times can be potentially reduced from fractions of hour to a few seconds. However, the highly reactive gold clusters are likely not stable in contact with the electrolyte at high anodic potentials. As a remedy, the plasmonic nanoparticles can be coated with a thin layer of an inert oxide in order to passivate the reactive surfaces (shell-isolated nanoparticle-enhanced Raman spectroscopy i.e. SHINERS) (Li et al., 2010). The approach had been used in situ to detect the formation of Li2O at the surface of the Li-rich NCM, but the bands were barely above the noise level and the signals from the oxide were not detected (Hy et al., 2014). In general SHINERS have been seldom used on electrode materials because (i) the electrode surface is rough, heterogeneous and difficult to coat uniformly, and (ii) the challenging synthesis required to produce highly controlled shell isolated nanoparticles able to yield reproducible results (Lin et al., 2009). However, the promise of second and sub-second resolved electrode reactions justify further development of operando SERS.
In situ and operando Raman Spectroscopy provides a unique direct probe of the M-O bonding, which is at the heart of the electrochemistry of LiMO2 oxides and govern their stability. Several novel LiMO2 compositions are currently being explored with a particular focus on dopings and coatings. We propose that a further development of Raman Spectroscopy could in this context offer a highly dynamic and convenient tool to guide the formulation of high specific charge and long cycle life LiMO2 oxides for next-generation Li-ion battery cathodes.
Author Contributions
All authors listed have made a substantial, direct and intellectual contribution to the work, and approved it for publication.
Conflict of Interest Statement
The authors declare that the research was conducted in the absence of any commercial or financial relationships that could be construed as a potential conflict of interest.
Acknowledgments
EF and EB acknowledges Swiss National Science Foundation (SNSF) under the Ambizione Energy funding scheme (Grant No. 160540).
References
Ammundsen, B., Burns, G. R., Islam, S., Kanoh, H., and Rozière, J. (1999). Lattice dynamics and vibrational spectra of lithium manganese oxides: a computer simulation and spectroscopic Study. J. Phys. Chem. B 103, 5175–5180. doi: 10.1021/jp984398l
Aurbach, D., Markovsky, B., Salitra, G., Markevich, E., Talyossef, Y., Koltypin, M., et al. (2007). Review on electrode–electrolyte solution interactions, related to cathode materials for Li-ion batteries. J. Power Sour. 165, 491–499. doi: 10.1016/j.jpowsour.2006.10.025
Baddour-Hadjean, R., and Pereira-Ramos, J.-P. (2009). Raman microspectrometry applied to the study of electrode materials for lithium batteries. Chem. Rev. 110, 1278–1319. doi: 10.1021/cr800344k
Balagurov, A. M., Bobrikov, I. A., Samoylova, N. Y., Drozhzhin, O. A., and Antipov, E. V. (2014). Neutron scattering for analysis of processes in lithium-ion batteries. Russ. Chem. Rev. 83, 1120–1134. doi: 10.1070/RCR4473
Balasubramanian, M., Sun, X., Yang, X. Q., and McBreen, J. (2000). In situ X-Ray absorption studies of a high-rate LiNi0.85Co0.15O2 cathode material. J. Electrochem. Soc. 147, 2903–2909. doi: 10.1149/1.1393624
Ben-Kamel, K., Amdouni, N., Mauger, A., and Julien, C. M. (2012). Study of the local structure of LiNi0.33+δMn0.33+δCo0.33–2δO2 (0.025 ≤ δ ≤ 0.075) oxides. J. Alloys Compd. 528, 91–98. doi: 10.1016/j.jallcom.2012.03.018
Berg, E. J., Villevieille, C., Streich, D., Trabesinger, S., and Novák, P. (2015). Rechargeable batteries: grasping for the limits of chemistry. J. Electrochem. Soc. 162, A2468–A2475. doi: 10.1149/2.0081514jes
Blomgren, G. E. (2017). The development and future of lithium ion batteries. J. Electrochem. Soc. 164, A5019–A5025. doi: 10.1149/2.0251701jes
Börner, M., Horsthemke, F., Kollmer, F., Haseloff, S., Friesen, A., Niehoff, P., et al. (2016). Degradation effects on the surface of commercial LiNi0.5Co0.2Mn0.3O2 electrodes. J. Power Sour. 335, 45–55. doi: 10.1016/j.jpowsour.2016.09.071
Boulet-Roblin, L., Villevieille, C., Borel, P., Tessier, C., Novák, P., and Ben Yahia, M. (2016). Versatile approach combining theoretical and experimental aspects of raman spectroscopy to investigate battery materials: the case of the LiNi 0.5 Mn 1.5 O 4 Spinel. J. Phys. Chem. C 120, 16377–16382. doi: 10.1021/acs.jpcc.6b04155
Chen, C. H., Liu, J., Stoll, M. E., Henriksen, G., Vissers, D. R., and Amine, K. (2004). Aluminum-doped lithium nickel cobalt oxide electrodes for high-power lithium-ion batteries. J. Power Sour. 128, 278–285. doi: 10.1016/j.jpowsour.2003.10.009
Chen, D., Xiong, X., Zhao, B., Mahmoud, M. A., El-Sayed, M. A., and Liu, M. (2016). Probing structural evolution and charge storage mechanism of NiO2Hx electrode materials using in operando resonance raman spectroscopy. Adv. Sci. 3:1500433. doi: 10.1002/advs.201500433
Chen, H., Freeman, C. L., and Harding, J. H. (2011). Charge disproportionation and jahn-teller distortion in LiNiO2 and NaNiO2: a density functional theory study. Phys. Rev. B 84, 1–7. doi: 10.1103/PhysRevB.84.085108
Clark, R. J. H., and Dines, T. J. (1986). Resonance Raman spectroscopy, and its application to inorganic chemistry. new analytical methods (27). Angew. Chemie Int. Edn. Engl. 25, 131–158. doi: 10.1002/anie.198601311
Delmas, C., and Croguennec, L. (2002). Layered Li(Ni, M)O2 systems as the cathode material in lithium-ion batteries. MRS Bull. 27, 608–612. doi: 10.1557/mrs2002.196
Delmas, C., Menetrier, M., Croguennec, L., Levasseur, S., Peres, J. P., Pouillerie, C., et al. (1999). Lithium batteries: a new tool in solid state chemistry. Int. J. Inorg. Mater. 1, 11–19. doi: 10.1016/S1463-0176(99)00003-4
Dixit, M., Markovsky, B., Schipper, F., Aurbach, D., and Major, D. T. (2017). Origin of structural degradation during cycling and low thermal stability of Ni-rich layered transition metal-based electrode materials. J. Phys. Chem. C 121, 22628–22636. doi: 10.1021/acs.jpcc.7b06122
Dokko, K., Mohamedi, M., Anzue, N., Itoh, T., and Uchida, I. (2002). In situ raman spectroscopic studies of LiNi x Mn 2 – x O 4 thin film cathode materials for lithium ion secondary batteries. J. Mater. Chem. 12, 3688–3693. doi: 10.1039/B206764A
Dompablo, M. E. A., Marianetti, C., Van Der, V. A., and Ceder, G. (2001). Jahn-Teller mediated ordering in layered Li x M O 2 compounds. Phys. Rev. B 63:144107. doi: 10.1103/PhysRevB.63.144107
Ellis, B. L., Lee, K. T., and Nazar, L. F. (2010). Positive electrode materials for Li-Ion and Li-batteries. Chem. Mater. 22, 691–714. doi: 10.1021/cm902696j
Ensling, D., Cherkashinin, G., Schmid, S., Bhuvaneswari, S., Thissen, A., and Jaegermann, W. (2014). Nonrigid band behavior of the electronic structure of LiCoO2thin film during electrochemical li deintercalation. Chem. Mater. 26, 3948–3956. doi: 10.1021/cm501480b
Fateley, W. G., McDevitt, N. T., and Bentley, F. F. (1971). Infrared and raman selection rules for lattice vibrations: the correlation method. Appl. Spectrosc. 25, 155–173. doi: 10.1366/000370271779948600
Ferrari, A. C. (2007). Raman spectroscopy of graphene and graphite: disorder, electron-phonon coupling, doping and nonadiabatic effects. Solid State Commun. 143, 47–57. doi: 10.1016/j.ssc.2007.03.052
Ferraro, J. R., Nakamoto, K., and Brown, C. W. (2003). Introductory Raman Spectroscopy, 2nd Edn. California, CA: Academic press.
Flores, E., Vonrüti, N., Novák, P., Aschauer, U., and Berg, E. J. (2018). Elucidation of LixNi0.8Co0.15Al0.05O2 redox chemistry by operando raman spectroscopy. Chem. Mater. 30, 4694–4703. doi: 10.1021/acs.chemmater.8b01384
Ghanty, C., Markovsky, B., Erickson, E. M., Talianker, M., Haik, O., Tal-Yossef, Y., et al. (2015). Li+ -Ion extraction/insertion of Ni-Rich Li1+x(NiyCozMnz)wO2 (0.005< x <0.03; y : z = 8:1, w ≈1) Electrodes: in situ, X. R. D., and Raman Spectroscopy Study. ChemElectroChem 2, 1479–1486. doi: 10.1002/celc.201500160
Gilbert, J. A., Maroni, V. A., Cui, Y., Gosztola, D. J., Miller, D. J., and Abraham, D. P. (2018). Composition and impedance heterogeneity in oxide electrode cross-sections detected by raman spectroscopy. Adv. Mater. Interfaces 5:1701447. doi: 10.1002/admi.201701447
Gittleson, F. S., Yao, K. P. C., Kwabi, D. G., Sayed, S. Y., Ryu, W. H., Shao-Horn, Y., et al. (2015). Raman spectroscopy in lithium-oxygen battery systems. ChemElectroChem 2, 1446–1457. doi: 10.1002/celc.201500218
Gouadec, G., and Colomban, P. (2007). Raman spectroscopy of nanomaterials: how spectra relate to disorder, particle size and mechanical properties. Prog. Cryst. Growth Charact. Mater. 53, 1–56. doi: 10.1016/j.pcrysgrow.2007.01.001
Grey, C. P., and Dupré, N. (2004). NMR studies of cathode materials for lithium-ion rechargeable batteries. Chem. Rev. 104, 4493–4512. doi: 10.1021/cr020734p
Gross, T., Giebeler, L., and Hess, C. (2013). Novel in situ cell for Raman diagnostics of lithium-ion batteries. Rev. Sci. Instrum. 84:073109. doi: 10.1063/1.4813263
Gross, T., and Hess, C. (2014). Raman diagnostics of LiCoO2 electrodes for lithium-ion batteries. J. Power Sour. 256, 220–225. doi: 10.1016/j.jpowsour.2014.01.084
Hausbrand, R., Cherkashinin, G., Ehrenberg, H., Gröting, M., Albe, K., Hess, C., et al. (2015). Fundamental degradation mechanisms of layered oxide Li-ion battery cathode materials: methodology, insights and novel approaches. Mater. Sci. Eng. B 192, 3–25. doi: 10.1016/j.mseb.2014.11.014
Heber, M., Schilling, C., Gross, T., and Hess, C. (2015). In situ Raman and UV-Vis spectroscopic analysis of lithium-ion batteries. Mater. Res. Soc. Symp. Proc. 1773, 33–40. doi: 10.1557/opl.2015.634
Hendra, P. J. (2006). “Sampling considerations for raman spectroscopy,” in Handbook of Vibrational Spectroscopy, ed J. M. Chalmers (Chichester: John Wiley and Sons, Ltd).
Hotokka, M. (2006). “Calculation of vibrational frequencies by molecular mechanics,” in Handbook of Vibrational Spectroscopy, ed J. M. Chalmers (Chichester: John Wiley and Sons, Ltd), 216–234.
Hou, P., Chu, G., Gao, J., Zhang, Y., and Zhang, L. (2016). Li-ion batteries: phase transition. Chinese Phys. B 25:016104. doi: 10.1088/1674-1056/25/1/016104
Huang, J.-X., Li, B., Liu, B., Liu, B.-J., Zhao, J.-B., and Ren, B. (2016). Structural evolution of NM (Ni and Mn) lithium-rich layered material revealed by in-situ electrochemical Raman spectroscopic study. J. Power Sources 310, 85–90. doi: 10.1016/j.jpowsour.2016.01.065
Huang, R., and Ikuhara, Y. (2012). STEM characterization for lithium-ion battery cathode materials. Curr. Opin. Solid State Mater. Sci. 16, 31–38. doi: 10.1016/j.cossms.2011.08.002
Hwang, B. J., Tsai, Y. W., Carlier, D., and Ceder, G. (2003). A combined computational/experimental study on LiNi1/3Co1/3Mn1/3O2. Chem. Mater. 15, 3676–3682. doi: 10.1021/cm030299v
Hy, S., Felix, F., Rick, J., Su, W.-N., and Hwang, B. J. (2014). Direct in situ observation of Li2O evolution on li-rich high-capacity cathode material, Li[NixLi(1−2x)/3Mn(2−x)/3]O2 (0 ≤ x ≤ 0.5). J. Am. Chem. Soc. 136, 999–1007. doi: 10.1021/ja410137s
Inaba, M., Iriyama, Y., Ogumi, Z., Todzuka, Y., and Tasaka, A. (1997). Raman study of layered rock-salt LiCoO2 and its electrochemical lithium deintercalation. J. Raman Spectrosc. 28, 613–617.
Inaba, M., Yoshida, H., Ogumi, Z., Abe, T., Mizutani, Y., and Asano, M. (1995). In situ Raman study on electrochemical li intercalation into graphite. J. Electrochem. Soc. 142, 20–26. doi: 10.1149/1.2043869
Itoh, T., Anzue, N., Mohamedi, M., Hisamitsu, Y., Umeda, M., and Uchida, I. (2000). Spectroelectrochemical studies on highly polarized LiCoO2 electrode in organic solutions. Electrochem. Commun. 2, 743–748. doi: 10.1016/S1388-2481(00)00112-0
Itoh, T., Sato, H., Nishina, T., Matue, T., and Uchida, I. (1997). In situ Raman spectroscopic study of LixCoO2 electrodes in propylene carbonate solvent systems. J. Power Sour. 68, 333–337. doi: 10.1016/S0378-7753(97)02539-1
Jarry, A., Gottis, S., Yu, Y. S., Roque-Rosell, J., Kim, C., Cabana, J., et al. (2015). The formation mechanism of fluorescent metal complexes at the LixNi0.5Mn1.5O4−δ/carbonate ester electrolyte interface. J. Am. Chem. Soc. 137, 3533–3539. doi: 10.1021/ja5116698
Julien, C. M. (2000). Local cationic environment in lithium nickel-cobalt oxides used as cathode materials for lithium batteries. Solid State Ionics 136–137, 887–896. doi: 10.1016/S0167-2738(00)00503-8
Julien, C. M. (2002). Raman scattering of LiNi1–yAlyO2. Solid State Ionics 148, 53–59. doi: 10.1016/S0167-2738(02)00117-0
Julien, C. M., and Massot, M. (2002). Spectroscopic studies of the local structure in positive electrodes for lithium batteries. Phys. Chem. Chem. Phys. 4, 4226–4235. doi: 10.1039/b203361e
Julien, C. M., Massot, M., Perez-Vicente, C., Haro-Poniatowski, E., Nazri, G. A., and Rougier, A. (1997). Vibrational spectroscopic studies of the local environment in 4-Volt cathode materials. MRS Proc. 496:415. doi: 10.1557/PROC-496-415
Julien, C. M., Massot, M., and Ramana, C. V. (2006). “Structure of electrode materials for Li-ion batteries : the Raman spectroscopy investigations,” in Portable and Emergency Energy Sources, eds Z. Stoynov and D. Vladikova (Sofia: Martin Drinov Academic Publishing House), 37–70.
Kalyani, P., and Kalaiselvi, N. (2005). Various aspects of LiNiO 2 chemistry: a review. Sci. Technol. Adv. Mater. 6, 689–703. doi: 10.1016/j.stam.2005.06.001
Keresztury, G. (2006). Raman spectroscopy : theory. Handb. Vib. Spectrosc. 1, 71–87. doi: 10.1002/0470027320.s0109
Kerlau, M., Marcinek, M., Srinivasan, V., and Kostecki, R. (2007). Reprint of “Studies of local degradation phenomena in composite cathodes for lithium-ion batteries.” Electrochim. Acta 53, 1386–1393.doi: 10.1016/j.electacta.2007.10.009
Kim, J. M., and Chung, H. T. (2004). The first cycle characteristics of Li[Ni1/3Co1/3Mn1/3]O2charged up to 4.7 V. Electrochim. Acta 49, 937–944. doi: 10.1016/j.electacta.2003.10.005
Kleiner, K., Melke, J., Merz, M., Jakes, P., Nagel, P., Schuppler, S., et al. (2015). Unraveling the degradation process of LiNi0.8Co0.15Al0.05O2 electrodes in commercial lithium ion batteries by electronic structure investigations. ACS Appl. Mater. Interfaces 7, 19589–19600. doi: 10.1021/acsami.5b03191
Koga, H., Croguennec, L., Mannessiez, P., Ménétrier, M., Weill, F., Bourgeois, L., et al. (2012). Li1.20Mn0.54Co0.13Ni0.13O2 with different particle sizes as attractive positive electrode materials for lithium-ion batteries: insights into their structure. J. Phys. Chem. C 116, 13497–13506. doi: 10.1021/jp301879x
Kostecki, R., Lei, J., McLarnon, F., Shim, J., and Striebel, K. (2006). Diagnostic evaluation of detrimental phenomena in high-power lithium-ion batteries. J. Electrochem. Soc. 153:A669. doi: 10.1149/1.2170551
Kostecki, R., and McLarnon, F. (2004). Local-probe studies of degradation of composite LiNi0.8Co0.15Al0.05O2 cathodes in high-power lithium-ion cells. Electrochem. Solid-State Lett. 7, A380–A383. doi: 10.1149/1.1793771
Kuwata, N., Ise, K., Matsuda, Y., Kawamura, J., Tsurui, T., and Kamishima, O. (2012). “Detection of degradation in 2 thin films by in situ micro raman microscopy,” in Solid State Ionics, eds B. V. R. Chowdari, J. Kawamura, J. Mizusaki, and K. Amezawa (Singapore), 138–143.
Lanz, P., Villevieille, C., and Novák, P. (2013). Electrochemical activation of Li2MnO3 at elevated temperature investigated by in situ Raman microscopy. Electrochim. Acta 109, 426–432. doi: 10.1016/j.electacta.2013.07.130
Lanz, P., Villevieille, C., and Novák, P. (2014). Ex situ and in situ Raman microscopic investigation of the differences between stoichiometric LixMO2 and high-energy xLi2MnO3·(1–x) LixMO2 (M = Ni, Co, Mn). Electrochim. Acta 130, 206–212. doi: 10.1016/j.electacta.2014.03.004
Lei, J., McLarnon, F., and Kostecki, R. (2005). In situ Raman microscopy of individual LiNi0.8Co0.15Al0.05O2 particles in a Li-Ion battery composite cathode. J. Phys. Chem. B 109, 952–957. doi: 10.1021/jp046027c
Li, J. F., Huang, Y. F., Ding, Y., Yang, Z. L., Li, S. B., Zhou, X. S., et al. (2010). Shell-isolated nanoparticle-enhanced Raman spectroscopy. Nature 464, 392–395. doi: 10.1038/nature08907
Lin, X. M., Cui, Y., Xu, Y. H., Ren, B., and Tian, Z. Q. (2009). Surface-enhanced raman spectroscopy: substrate-related issues. Anal. Bioanal. Chem. 394, 1729–1745. doi: 10.1007/s00216-009-2761-5
Liu, H. L., Ou-Yang, T. Y., Tsai, H. H., Lin, P. A., Jeng, H. T., Shu, G. J., et al. (2015a). Electronic structure and lattice dynamics of LixCoO2 single crystals. New J. Phys. 17:103004. doi: 10.1088/1367-2630/17/10/103004
Liu, W., Oh, P., Liu, X., Lee, M.-J., Cho, W., Chae, S., et al. (2015b). Nickel-rich layered lithium transition-metal oxide for high-energy lithium-ion batteries. Angew. Chemie Int. Ed. Engl. 54, 4440–4457. doi: 10.1002/anie.201409262
Lu, X., Sun, Y., Jian, Z., He, X., Gu, L., Hu, Y.-S., et al. (2012). New insight into the atomic structure of electrochemically delithiated O3-Li(1−x)CoO2 (0 ≤ x ≤ 0.5) nanoparticles. Nano Lett. 12, 6192–6197. doi: 10.1021/nl303036e
Mai, L., Yan, M., and Zhao, Y. (2017). Track batteries degrading in real time. Nature 546, 469–470. doi: 10.1038/546469a
Marianetti, C. A., Kotliar, G., and Ceder, G. (2004). A first-order Mott transition in LixCoO2. Nat. Mater. 3, 627–631. doi: 10.1038/nmat1178
Maschio, L., Kirtman, B., Rérat, M., Orlando, R., and Dovesi, R. (2013). Ab initio analytical Raman intensities for periodic systems through a coupled perturbed Hartree-Fock/Kohn-Sham method in an atomic orbital basis. II. Validation and comparison with experiments. J. Chem. Phys. 139:164101. doi: 10.1063/1.4824442
Matsuura, H., and Yoshida, H. (2006). “Calculation of vibrational frequencies by hartree-fock-based and density functional theory,” in Handbook of Vibrational Spectroscopy, ed J. M. Chalmers (Chichester: John Wiley and Sons, Ltd), 216–234.
McBreen, J. (2009). The application of synchrotron techniques to the study of lithium-ion batteries. J. Solid State Electrochem. 13, 1051–1061. doi: 10.1007/s10008-008-0685-1
Ménétrier, M., Saadoune, I., Levasseur, S., and Delmas, C. (1999). The insulator-metal transition upon lithium deintercalation from LiCoO2: electronic properties and 7Li NMR study. J. Mater. Chem. 9, 1135–1140. doi: 10.1039/a900016j
Molenda, J., Wilk, P., and Marzec, J. (2002). Structural, electrical and electrochemical properties of LiNiO2. Solid State Iconics 146, 73–79. doi: 10.1016/S0167-2738(01)00992-4
Nakai, I., Takahashi, K., Shiraishi, Y., Nakagome, T., and Nishikawa, F. (1998). Study of the jahn–teller distortion in LiNiO2, a cathode material in a rechargeable lithium battery, by in situ x-ray absorption fine structure analysis. J. Solid State Chem. 140, 145–148. doi: 10.1006/jssc.1998.7943
Nanda, J., Remillard, J., O'Neill, A., Bernardi, D., Ro, T., Nietering, K. E., et al. (2011). Local state-of-charge mapping of Lithium-ion battery electrodes. Adv. Funct. Mater. 21, 3282–3290.doi: 10.1002/adfm.201100157
Nguyen, D.-T., Kang, J., Nam, K.-M., Paik, Y., and Song, S.-W. (2016). Understanding interfacial chemistry and stability for performance improvement and fade of high-energy Li-ion battery of LiNi0.5Co0.2Mn0.3O2 //silicon-graphite. J. Power Sources 303, 150–158. doi: 10.1016/j.jpowsour.2015.10.089
Nishi, T., Nakai, H., and Kita, A. (2013). Visualization of the state-of-charge distribution in a LiCoO2 cathode by in situ raman imaging. J. Electrochem. Soc. 160, A1785–A1788. doi: 10.1149/2.061310jes
Nitta, N., Wu, F., Lee, J. T., and Yushin, G. (2015). Li-ion battery materials: present and future. Mater. Today 18, 252–264. doi: 10.1016/j.mattod.2014.10.040
Noh, H. J., Youn, S., Yoon, C. S., and Sun, Y. K. (2013). Comparison of the structural and electrochemical properties of layered Li[NixCoyMnz]O2 (x = 1/3, 0.5, 0.6, 0.7, 0.8 and 0.85) cathode material for lithium-ion batteries. J. Power Sources 233, 121–130. doi: 10.1016/j.jpowsour.2013.01.063
Novák, P., Panitz, J. C., Joho, F., Lanz, M., Imhof, R., and Coluccia, M. (2000). Advanced in situ methods for the characterization of practical electrodes in lithium-ion batteries. J. Power Sources 90, 52–58. doi: 10.1016/S0378-7753(00)00447-X
Otoyama, M., Ito, Y., Hayashi, A., and Tatsumisago, M. (2016a). Raman imaging for LiCoO2 composite positive electrodes in all-solid-state lithium batteries using Li2 S–P2 S5 solid electrolytes. J. Power Sources 302, 419–425. doi: 10.1016/j.jpowsour.2015.10.040
Otoyama, M., Ito, Y., Hayashi, A., and Tatsumisago, M. (2016b). Raman Spectroscopy for LiNi1/3Mn1/3Co1/3o2 composite positive electrodes in all-solid-state lithium batteries. Electrochemistry 84, 812–814. doi: 10.5796/electrochemistry.84.812
Park, Y., Kim, Y., Kim, S. M., Jin, S., Han, I. K., Lee, S. M., et al. (2017). Reaction at the electrolyte-electrode interface in a li-ion battery studied by in situ raman spectroscopy. Bull. Korean Chem. Soc. 38, 511–513. doi: 10.1002/bkcs.11117
Peres, J. P., Weill, F., and Delmas, C. (1999). Lithium/vacancy ordering in the monoclinic LixNiO2 (0. 50 ≤ x ≤ 0. 75) solid solution. Solid State Ionics 116, 19–27. doi: 10.1016/S0167-2738(98)00239-2
Perkins, J. D., Fu, M. L., Trickett, D. M., McGraw, J. M., Ciszek, T. F., Pariila, P. A., et al. (1997). Raman scattering in LiCoO2 single crystals and thin films. MRS Proc. 496:329. doi: 10.1557/PROC-496-329
Pimenta, M. A., Dresselhaus, G., Dresselhaus, M. S., Cançado, L. G., Jorio, A., and Saito, R. (2007). Studying disorder in graphite-based systems by Raman spectroscopy. Phys. Chem. Chem. Phys. 9, 1276–1291. doi: 10.1039/B613962K
Poli, F., Kshetrimayum, J. S., Monconduit, L., and Letellier, M. (2011). New cell design for in-situ NMR studies of lithium-ion batteries. Electrochem. Commun. 13, 1293–1295. doi: 10.1016/j.elecom.2011.07.019
Qian, D., Ma, C., More, K. L., Meng, Y. S., and Chi, M. (2015). Advanced analytical electron microscopy for lithium-ion batteries. NPG Asia Mater. 7:e193. doi: 10.1038/am.2015.50
Qiu, X.-Y., Zhuang, Q.-C., Zhang, Q.-Q., Cao, R., Qiang, Y.-H., Ying, P.-Z., et al. (2012). Investigation of layered LiNi1/3Co1/3Mn1/3O2 cathode of lithium ion battery by electrochemical impedance spectroscopy. J. Electroanal. Chem. 687, 35–44. doi: 10.1016/j.jelechem.2012.09.027
Reimers, J. N. (1992). Electrochemical and in situ X-ray diffraction studies of lithium intercalation in LixCoO2. J. Electrochem. Soc. 139, 2091–29097. doi: 10.1149/1.2221184
Rougier, A., Delmas, C., and Chadwick, A. V. (1995). Non-cooperative jahn-teller effect in LiNiO2: an EXAFS study. Solid State Commun. 94, 123–127. doi: 10.1016/0038-1098(95)00020-8
Ruther, R. E., Callender, A. F., Zhou, H., Martha, S. K., and Nanda, J. (2014). Raman microscopy of Lithium-manganese-rich transition metal oxide cathodes. J. Electrochem. Soc. 162, A98–A102. doi: 10.1149/2.0361501jes
Saavedra-Arias, J. J., Thomas, R., Karan, N. K., Ishikawa, Y., and Katiyar, R. S. (2009). First principles computations studies: structural and electrochemical behavior of layered cathode materials. ECS Trans. 16, 9–18. doi: 10.1149/1.3115303
Shao, M. (2014). In situ microscopic studies on the structural and chemical behaviors of lithium-ion battery materials. J. Power Sour. 270, 475–486. doi: 10.1016/j.jpowsour.2014.07.123
Sharma, N., Pang, W. K., Guo, Z., and Peterson, V. K. (2015). In situ powder diffraction studies of electrode materials in rechargeable batteries. ChemSusChem 8, 2826–2853. doi: 10.1002/cssc.201500152
Singh, G., West, W. C., Soler, J., and Katiyar, R. S. (2012). In situ Raman spectroscopy of layered solid solution Li2MnO3– LixMO2 (M = Ni, Mn, Co). J. Power Sour. 218, 34–38. doi: 10.1016/j.jpowsour.2012.06.083
Snyder, C., Apblett, C., Grillet, A., Beechem, T., and Duquette, D. (2016). Measuring Li+ inventory losses in LiCoO2 /graphite cells using raman microscopy. J. Electrochem. Soc. 163, A1036–A1041. doi: 10.1149/2.1111606jes
Sole, C., Drewett, N. E., and Hardwick, L. J. (2014). In situ Raman study of lithium-ion intercalation into microcrystalline graphite. Faraday Discuss. 172, 223–237. doi: 10.1039/C4FD00079J
Stancovski, V., and Badilescu, S. (2014). In situ Raman spectroscopic–electrochemical studies of lithium-ion battery materials: a historical overview. J. Appl. Electrochem. 44, 23–43. doi: 10.1007/s10800-013-0628-0
Streich, D., Erk, C., Guéguen, A., Mu, P., Chesneau, F., and Berg, E. J. (2017). Operando monitoring of early Ni-mediated surface reconstruction in layered lithiated Ni – Co – Mn oxides. J. Phys. Chem. C 121, 13481–13486. doi: 10.1021/acs.jpcc.7b02303
Sun, H., and Zhao, K. (2017). Electronic structure and comparative properties of LiNixMnyCozO2 cathode materials. J. Phys. Chem. C 121, 6002–6010. doi: 10.1021/acs.jpcc.7b00810
Takahashi, Y., Kijima, N., Tokiwa, K., Watanabe, T., and Akimoto, J. (2007). Single-crystal synthesis, structure refinement and electrical properties of Li0.5CoO2. J. Phys. 19:436202. doi: 10.1088/0953-8984/19/43/436202
Tan, J., Liu, D., Xu, X., and Mai, L. (2017). In situ/operando characterization techniques for rechargeable lithium-sulfur batteries: a review. Nanoscale 9, 19001–19016. doi: 10.1039/C7NR06819K
Tarascon, J.-M. (2010). Key challenges in future Li-battery research. Philos. Trans. A Math. Phys. Eng. Sci. 368, 3227–3241. doi: 10.1098/rsta.2010.0112
Tornheim, A., Maroni, V. A., He, M., Gosztola, D. J., and Zhang, Z. (2017). Enhanced raman scattering from ncm523 cathodes coated with electrochemically deposited gold. J. Electrochem. Soc. 164, A3000–A3005. doi: 10.1149/2.0461713jes
Tsai, Y. W., Hwang, B. J., Ceder, G., Sheu, H. S., Liu, D. G., and Lee, J. F. (2005). In-situ X-ray absorption spectroscopic study on variation of electronic transitions and local structure of LiNi1/3Co1/3Mn1/3O2 cathode material during electrochemical cycling. Chem. Mater. 17, 3191–3199. doi: 10.1021/cm048027v
Tuinstra, F., and Koenig, J. L. (1970). Raman spectrum of graphite. J. Chem. Phys. 53, 1126–1130. doi: 10.1063/1.1674108
Vetter, J., Novák, P., Wagner, M. R., Veit, C., Möller, K. C., Besenhard, J. O., et al. (2005). Ageing mechanisms in lithium-ion batteries. J. Power Sour. 147, 269–281. doi: 10.1016/j.jpowsour.2005.01.006
Wang, H., Mann, C. K., and Vickers, T. J. (2002). Effect of powder properties on the intensity of raman scattering by crystalline solids. Appl. Spectrosc. 56, 1538–1544. doi: 10.1366/000370202321115779
Wang, X., Loa, I., Kunc, K., Syassen, K., and Amboage, M. (2005). Effect of pressure on the structural properties and Raman modes of LiCoO2. Phys. Rev. B Condens. Matter. 72:224102. doi: 10.1103/PhysRevB.72.224102
Xu, K., About, M., and Article, T. (2004). Nonaqueous liquid electrolytes for lithium-based rechargeable batteries nonaqueous liquid electrolytes for lithium-based rechargeable batteries. Chem. Rev. 104, 4303–4418. doi: 10.1021/cr030203g
Yin, S.-C., Rho, Y.-H., Swainson, I., and Nazar, L. F. (2006). X-ray/neutron diffraction and electrochemical studies of lithium de/re-intercalation in Li1-xCo1/3Ni1/3Mn1/3O2 (x = 0 → 1). Chem. Mater. 18, 1901–1910. doi: 10.1021/cm0511769
Yoon, W. S., Chung, K. Y., McBreen, J., Fischer, D. A., and Yang, X. Q. (2007). Electronic structural changes of the electrochemically Li-ion deintercalated LiNi0.8Co0.15Al0.05O2 cathode material investigated by X-ray absorption spectroscopy. J. Power Sour. 174, 1015–1020. doi: 10.1016/j.jpowsour.2007.06.214
Zeng, D., Cabana, J., Bréger, J., Yoon, W. S., and Grey, C. P. (2007). Cation ordering in Li[NixMnxCo(1−2x)]O2 -layered cathode materials: a nuclear magnetic resonance (NMR), pair distribution function, X-ray absorption spectroscopy, and electrochemical study. Chem. Mater. 19, 6277–6289. doi: 10.1021/cm702241a
Zhang, L., Takada, K., Ohta, N., Fukuda, K., Osada, M., Wang, L., et al. (2005). Layered (1–x–y)LiNi1/2Mn1/2O2·xLi[Li1/3Mn2/3] O2·yLiCoO2 (0 ≤ x = y ≤ 0.3 and x+y = 0.5) cathode materials. J. Electrochem. Soc. 152, A171–A178. doi: 10.1149/1.1829416
Zhang, X., Mauger, A., Lu, Q., Groult, H., Perrigaud, L., Gendron, F., et al. (2010). Synthesis and characterization of LiNi1/3Mn1/3Co1/3O2 by wet-chemical method. Electrochim. Acta 55, 6440–6449. doi: 10.1016/j.electacta.2010.06.040
Keywords: Raman spectroscopy, operando, in situ, LiMO2, Li-ion batteries, cathodes
Citation: Flores E, Novák P and Berg EJ (2018) In situ and Operando Raman Spectroscopy of Layered Transition Metal Oxides for Li-ion Battery Cathodes. Front. Energy Res. 6:82. doi: 10.3389/fenrg.2018.00082
Received: 11 April 2018; Accepted: 27 July 2018;
Published: 20 August 2018.
Edited by:
Neeraj Sharma, University of New South Wales, AustraliaReviewed by:
Montserrat Galceran Mestres, CIC energigune, SpainLiqiang Mai, Wuhan University of Technology, China
Copyright © 2018 Flores, Novák and Berg. This is an open-access article distributed under the terms of the Creative Commons Attribution License (CC BY). The use, distribution or reproduction in other forums is permitted, provided the original author(s) and the copyright owner(s) are credited and that the original publication in this journal is cited, in accordance with accepted academic practice. No use, distribution or reproduction is permitted which does not comply with these terms.
*Correspondence: Erik J. Berg, ZXJpay5iZXJnQGtlbWkudXUuc2U=