 Domenico P. Coiro
 Giancarlo Troise2
- 1Department of Industrial Engineering, University of Naples, Naples, Italy
- 2SeaPower Scrl, Naples, Italy
In the last years, the interest for renewable energies has shown a continuously increasing trend, in search of a convenient and sustainable source alternative to carbon and fossil fuels, also due to government incentive systems, as can be seen for example in the objectives proposed by the EU 2020 target. In such context, marine energy sources are particularly attractive, both for the high conceptual available resource and for some specific technical characteristics, such as a more predictable behavior with respect to other sources like wind energy. The work here presented resumes the experience gained over more than 20 years of activities conducted at Department of Industrial Engineering of the University of Naples “Federico II,” in collaboration with research consortium Seapower scrl, in the field of ocean renewable energies. The work refers to several case reports related to different projects in which the research group has been involved. Two main energy sources have been investigated, namely tidal currents, and wave energy, through the development, among others, of two different projects reported in this paper:
• GEMSTAR: a submerged floating tidal current hydrokinetic turbine system (an evolution of GEM turbine)
• PIVOT: a wave energy converter (WEC) based on a pivoting buoy
GEMSTAR is a project which is at Technology Readiness Level (TRL) 7 being the first prototype tested in real field while PIVOT is at TRL 5 since the full-scale prototype has been tested only in controlled environment. In any case both projects are still in development, evolving to more mature technology levels. The article reports the two case studies related to the above-mentioned systems at the present development stage along with the resource assessment of both energy sources in Mediterranean area.
Tidal Current Energy Case Study: a Preliminary Assessment on Tidal Current Energy Resource in the Strait of Messina
In the last few decades, the technologies to exploit the kinetic energy flux in regions of extreme tidal current provided very interesting results. Several conversion systems have been designed and, in some cases, installed or are undergoing full scale testing in a pre-commercialization stage. The development of “green” offshore power plants is particularly challenging in countries facing oceans where the greatest wave and tidal energy potential is found, but it appears to be still relatively slow in semi-enclosed sea as the Mediterranean. In this context a detailed marine energy assessment becomes a priority, in order to maximize the potentiality of area still economically valuable, but where lower amounts of energy are available (Liberti et al., 2013).
This is especially true for countries like Italy having relatively long coastlines. Nonetheless, in literature, there are only some production estimates for the Strait of Messina, placed in the broader context of the estimation of marine energy resources in Europe.
The choice of the Strait of Messina is very attractive both for the prototypes deployment and for the establishment of production farms of medium and large scale, due to the average high currents and suitable meteorological and oceanographic conditions (see for example El-Geziry et al. (2013), which also indicates possible environmental impacts of marine energy systems). Other locations exhibit less attractive characteristics, such as the lagoon of Venice where lower values of maximum water currents and greater interference with the navigation reduce the cost effective project to develop tidal energy current farms. The channel of Bonifacio, between Sardinia and Corsica, also shows interesting energetic features, but it is less suitable as its severe meteoceanographic conditions and deep waters can cause installation and maintenance issues.
In 2013, a study, summarized in this paragraph, has been performed by Coiro et al. (2013), in cooperation with the Italian research institution ENEA, with the aim to assess an overall estimation of the possible energy potential available in the Strait of Messina. The main purpose of this work was to provide site-specific production estimates associated with the use of marine current energy, considering various possible devices and geometric, environmental, and navigation limits. In this study some simplifying assumptions are adopted. To have comparable estimates of the different tidal current devices, it is assumed that all the deployed units have the same maximum power equal to about 1 MW. Available current information is analyzed to define the average current energy potential and to address the problem of its exploitation. Geometry assumptions have also been conducted, considering that geometry is a strong limit to the tidal farm efficiency and extension. Anyway, such study neglects some specific siting issues (for example eventual presence of obstacles related to device mooring), giving only a general energy potential estimation.
Several tidal energy devices are considered, assuming some performance parameters.
For a device in an open water flow, as discussed later in this paper, the performance can be described with sufficient approximation by a cubic power curve:
where ρ . is the average density of the water, V is the current speed, S is a reference surface and CP. is the power coefficient, a measure of the efficiency of the current device (Stoddard and Eggleston, 1987).
In this paper, four different current turbines have been considered:
• MCT SeaGen (a);
• Kobold (b);
• GEM (c);
• Verdant Power (d).
For technical specifications of considered devices, refer to Turbine (2012), Coiro and Nicolosi (1998), Coiro et al. (2009), and Reinecke et al. (2011).
In order to have comparable estimates, it was assumed that all the individual units have the same maximum power of 1 MW. The dimensions of the structures were in a first approximation proportionally scaled to the diameter of the turbines. The actual dimensions could affect the density of installation (i.e., the maximum achievable number of turbines per km2) and therefore the overall production at a given site. The implementation details and the consequences on the feasibility of individual farms were considered negligible in this general production estimate.
In lack of detailed information for all the systems and in order to have uniform assumptions for all the considered devices, an assumption has been made on the electrical conversion efficiency. A total efficiency of the transmission line equal to 80% has been taken into account, as representative for the global electric conversion system (generator, conversion systems, and transmission of energy). Considering the power coefficient, CP., as representative of the conversion from current kinetic energy to mechanical available energy, the overall efficiencies reported in Tables 1, 2 have been considered.
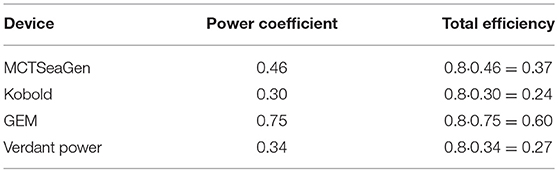
Table 1. Power coefficient and total efficiency assumed for the selected current turbines.
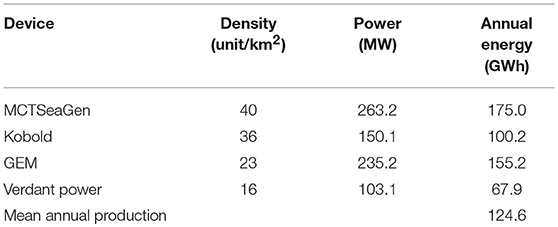
Table 2. Annual energy production assessment according to selected current turbines-Method of farms.
Moreover, some assumptions on space occupation have been made, details are provided in Coiro et al. (2013), and some specific possible installation areas (Figure 1A) have been considered, within the Strait zone, taking into account also limitations due to local naval traffic.
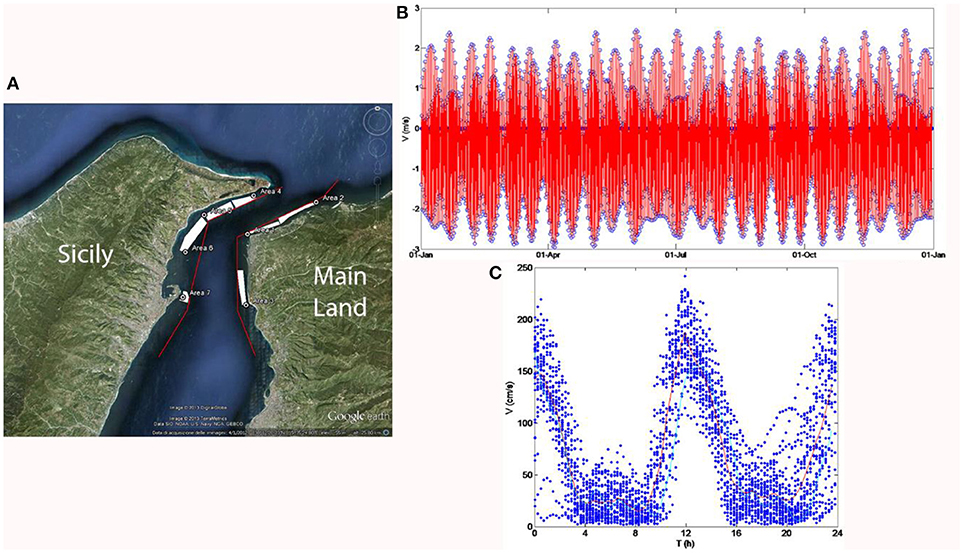
Figure 1. Strait of Messina installation areas (A). Typical yearly time history of current velocity (B) and superposition of several daily current speed profile highlighting a daily peak sequence pattern (C). Data are related to two different sites of the Strait: (B) reference site Punta Pezzo, (C) lower speed site Punta S. Raineri.
With all the above indicated assumptions, an estimation of the overall energy, potentially available for the different considered devices, has been obtained.
Tidal Current Estimation
Production assessment is generally based on site-specific current measurements. Design data for the present analysis were based on the tide tables of the Strait of Messina, for the year 2004 (Marina, 2003). In general tide tables are referred to a specific reference site where information is provided on slack water and maximum expected currents (both flood and ebb). In particular, the reference location for the Strait of Messina is Punta Pezzo (38°14′00″N; 15°38′ 00″E).
From the available data it was possible to reconstruct the time series of current magnitude at Punta Pezzo throughout the year, as shown in Figure 1B. For a more detailed current prediction and consequently power assessment, data related to the peaks and to the calm have been interpolated, adopting an hermitian cubic interpolation to preserve the shape. A typical pattern is evident in the area, formed by the succession of semi-diurnal cycles, with approximately monthly variation of the local peaks. In particular, four peaks happen per day with two direction inversions. The peak speeds vary throughout the year according to typical luni-solar tides but the current is always slightly higher in the descending direction (from Tyrrhenian Sea to Ionian Sea).
Assuming Punta Pezzo as the reference site, it is possible to determine tidal time (slack and maxima) and peak values in some secondary locations of interest. In particular, it is possible to assume a linear relationship as
where V′ is the velocity in the secondary location, Vc is the velocity at the reference site, r is an appropriate site-dependent scaling factor, V0′ is an empirical offset. Admiralty tide tables give the local peak current speed in some known secondary locations, assigning the related correction factors (Vercelli, 1925).
Furthermore, on-site current measurements may provide information at additional locations. In particular a SonTek Argonaut XR ADCP was installed at a water depth of about 20 m (Figure 1C), from the 17th of March to the 20th of April 2010, in proximity of Punta S. Raineri (Messina). These data have been assumed representative for Villa San Giovanni and S. Raineri site, where information was missing from Marina (2003). In general, two main daily peaks are present.
Using the reported data, it was possible to derive near surface peak velocity at secondary locations.
The Method of Farms
Among the possible approaches to available potential estimation, in this study the so called method of farms has been considered.
With the method of farm, the productive potential of a site occupied by several devices is assessed by the occupation density dependent on the overall dimensions of the system as assumed in the present work.
From a practical point of view, it is assumed that farms are installed in feasible areas of limited size not too far from the coast, to avoid interference with naval operations and in order to facilitate installation and maintenance operations. The bathymetric contour line of 50 m is taken as the minimum achievable water depth for the installations. This depth, in reality, is characteristic of each specific system and such value has to be considered as a first guess only. The maximum water depth at the site is also a limiting factor, related to the complexity of installation and operation. Increasing the depth of the site means increasing the installation and maintenance costs. In the present study we assumed an indicative maximum limit of 150 m water depth.
Table 2 shows the potential production rate, obtained by adding energy production for all the suggested areas of installation, under the above stated assumptions and with rated power rescaled to the value of 1 MW to obtain comparable results. The estimated results are only a fraction of the total theoretically energy available in the current, as a consequence of the restriction to plant space occupation imposed in order to comply with practical operational constraints.
All the considered devices show promising results, at least according to available data. However, the specific cost of the selected turbines should be carefully evaluated. The cost can be significantly different between one system and the other regardless of their production capacity. In particular, the cost of installation and maintenance must be taken into account as well as any possible impact on navigation and fishing. In other words, the final criteria to select a tidal turbine with respect to another, for the installation in a specific site, are driven by factors that can totally reverse the order of choice due to the mere criteria of the energy production assessment. Detailed knowledge of production units and their characteristics, as well as a preliminary current assessment in the specific installation site are necessary for final evaluation.
Tidal Energy Case Study: GEMSTAR, Submerged Floating Hydrokinetic Turbines
GEMSTAR System Configuration
GEMSTAR system is an evolution of GEM system but, in what follows, we will also refer to the original GEM system. It is composed by a tethered floating structure, supporting two hydrokinetic turbines, with the ability of self-alignment with current stream. It may be equipped with a self-towing winch, which is capable of setting the desired operating depth. Operating underwater, it has a limited impact on navigation. The system is moored at a single point on seabed, allowing the rotation of the floating structure in response to current direction change and may reduce maintenance cost and simplify deployment operations: by releasing the winch mooring cable, the system may be raised at surface for easier maintenance. A CAD drawing of the GEM configuration is shown in Figure 2.
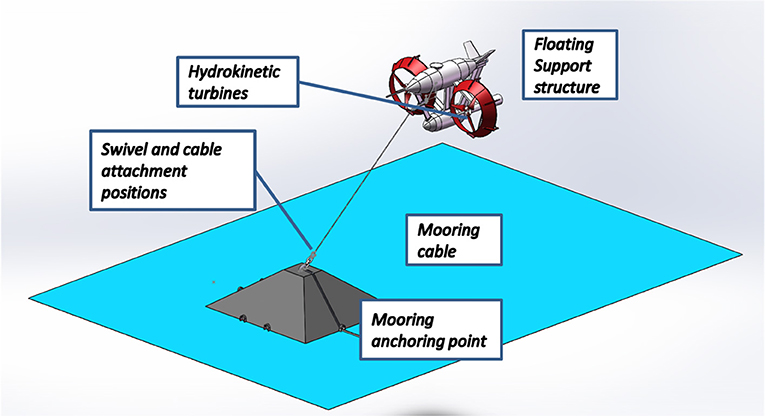
Figure 2. Schematic view of GEM configuration.
The system is sustained by the buoyancy provided by a streamlined axial-symmetric floating body, placed at the top of the structure. Stability and oscillation damping are improved by means of tail fins mounted on the floating body. Two generators are installed on board and mounted on the turbines shafts through a gearbox. Each generator is electrically controlled by an inverter, both for grid connection purposes and in order to attain optimal working conditions at different current speed. Suitable control logic is also needed to pursue optimal operating conditions. The power connection is provided by means of a power cable, passing along the mooring cable and extended up to an on-shore grid connection point.
The three bladed rotors have been developed at the University of Naples and designed to reach a high efficiency in a relatively wide operating conditions range, using a properly designed airfoil section shape to avoid cavitation. The turbines have been intensely tested both in wind tunnel and towing tank experimental campaigns. In a possible configuration a diffuser, also developed at the University of Naples, is placed around each turbine with the aim of enhancing the energy conversion process by increasing the mass flowing though the turbine swept area. After further investigations, a solution with bare turbines (without diffusers) will be considered in the next GEMSTAR device for a cost effective implementation of the system.
The development of the system started in 2005 and, after preliminary numerical analyses and design work, many experimental tests have been performed on different systems characterized by different scales. In 2005 tests were performed on the bare rotor turbine model with 1.2 m diameter. Coiro et al. (2006). Bare and shrouded turbine performances were compared after a series of tests performed in in the years from 2008 to 2010 (Coiro et al., 2009). The complete floating system was tested in two test campaigns on a 1:20 scaled model (2010) and on a 1:8 scaled model (2011) (Scherillo et al., 2011). A full-scale prototype with 3 m diameter rotor was manufactured, deployed and tested in 2012 (Coiro et al., 2012).
The main results of the experimental test campaigns, performed at different project stages, are reported in the following paragraphs.
Bare and Shrouded Turbine Experimental Tests
In order to characterize the behavior of the system in different operating conditions, experimental tests were performed in the towing tank on isolated turbine as well as on two different scaled model of the full GEM system. A first experimental campaign was carried out on a single isolated, reduced-scale hydro-turbine – which is the main component of the GEM system—with, and without a shroud. In fact there have been a large number of papers regarding shroud effect on bare turbine, see for example (Igra, 1981; Van Bussel, 2007; Polagye et al., 2011; Shives and Crawford, 2011) but a real and complete cost-effective analysis has probably never been performed.
After a first set of tests performed in air in the wind tunnel facility of the Department of Industrial Engineering of University of Naples, a second session of experimental tests has been completed in the towing/wave tank belonging to the same Department and the experimental results will be reported in the following paragraphs.
General Definitions
Prior to presenting tests data, some useful definitions of dimensionless quantities are recalled here. These coefficients are widely used further in this paper to discuss about the power generation system characteristics of the GEM.
In general, a turbine is a device that works at a given rotational speed Ω when immersed in a fluid stream of speed V. The desired effect is the establishment of a torque Q that keeps the blades in rotation and brings about the generation of a mechanical power
An important state variable of the turbine is the Tip Speed Ratio , i.e., the tip speed non-dimensionalized with respect to the current speed V, R being the turbine radius. The power coefficient (or turbine's efficiency) is defined as
where P is the power generated (measured or estimated), V is the asymptotic speed of the fluid stream (in this case, the steady-state traveling carriage speed), A is the area of a reference surface, and ρ is the water density. Similarly, the torque coefficient is defined as
where Q is the torque (measured or estimated), at the turbine hub. Finally, the thrust coefficient has the following expression:
where T is the turbine thrust, that is the axial force developed by the device immersed in the flow and functioning at a given TSR. The area A in the above definitions is always taken coincident with the bare rotor disk surface area, both for the bare turbine and for the diffuser-augmented one. This is important when comparing performance of different solutions in terms of efficiency.
Model Set-Up
Support structure and actuation system
An initial test campaign has been performed on a single isolated turbine to characterize the behavior of the power conversion system prior to the installation on the floating system. The turbine was mounted on a submersed pole connected to the towing tank carriage by means of a support structure capable of placing the turbine shaft at the desired depth. During tests the towing cart was operated at a constant speed simulating a given relative current, the turbine shaft was actuated by a controlled motor in order to achieve the desired rotational speed and operating conditions.
The assembly consists of a hollow tubular steel mast of length of 2.46 m whose circular section has an external diameter of 114 mm and inner diameter of 108 mm and it could rotate around its axis in order to test the device with a fixed yaw angle respect to the oncoming water current. A frame built by several welded tubular square sections fixes the tubular mast in a vertical position.
Measurements have been made using a torque-meter of 226 Nm (2,000 lbf-in) of full scale range, with an accuracy of ±0.1% FS. Also, a load cell with 5 kN FS was installed at the end of the transmission shaft to measure compressive or traction loads produced by the rotor. A ducted turbine configuration, i.e., with a diffuser (shroud) placed around the turbine, has been developed and tested in order to study the possible increase in conversion efficiency. Basically, the shroud is an annular diffuser with a streamlined cross section. A high lift airfoil has been used for the cross section shape of the shroud.
A controlled motor is set up to control the desired rotational speed, a torque-meter measures the turbine torque, and load cells measure separately the axial forces experienced by the turbine and by the diffuser immersed in the flow.
Figure 3A represents a picture of the test set-up installed in towing tank, with the support structure for the shrouded turbine able to rotate around its vertical axis to test the device in both axial and yawed flow conditions.
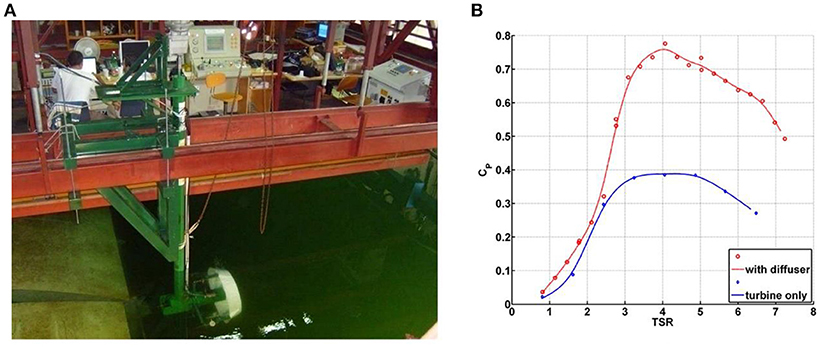
Figure 3. Single turbine test system mounted on towing tank carriage (A). Power coefficient for single isolated turbine. Comparison between bare and ducted turbine (ϕ = 26°). Relative speed 2.0 m/s (B).
Shroud and turbine geometry
The shroud is realized as an axially symmetric revolution body generated by an airfoil shape set to a proper inclination angle. A characteristic angle associated to the shroud geometry is the angle ϕ formed by the chord of the airfoil-shaped annular cross section of the shroud (taken with a radial plane) and the turbine axis. Two geometries of streamlined shrouds have been tested; these geometries had the same annular cross section, i.e., the same airfoil shape, but with different airfoil chord angles, ϕ = 23° and ϕ = 26°, respectively.
The tested turbine had a diameter of 0.6 m and a chord length of about 0.05 m at 75% radius span and was coupled in some tests with a shroud. In the case of the shroud with maximum inclination angle (26°), an exit diameter of 0.812 m was used. The diffuser throat section was slightly larger than the turbine disk (0.62 m diameter).
Tests on single turbine
Power coefficient. The main results of the tests on the turbine are reported in terms of non-dimensional coefficients. Preliminary numerical and experimental results show that, between the two considered shroud geometry the most effective in terms of power coefficient increase is represented by the configuration with higher section angle ϕ = 26°. Such shape has been considered for further analyses and tests. It is worth to specify that blade pitch angle has been kept always fixed without any attempt to optimize its value in order to increase the maximum efficiency, since the main goal of the tests was the investigation on diffuser installation effect on bare turbine performances. The Reynolds number, based on airfoil chord and on relative airfoil velocity, shows a significant variation across the operating test range, mainly due to the variation of rotational speed. For a flow velocity of 2.0 m/s, assuming a reference chord length equal to the blade chord at 75% radius span, the Reynolds number of the representative blade section spans the approximate interval between 1,20,000 and 7,30,000. The effect of the diffuser on turbine apparent efficiency over the whole range of TSR's is shown in Figure 3B. The maximum power coefficient reaches an almost double value with respect to the case of bare turbine. Figure 4A reports the effect of yaw misalignment on CP, clearly showing a reduction of conversion efficiency at increasing yaw angle.
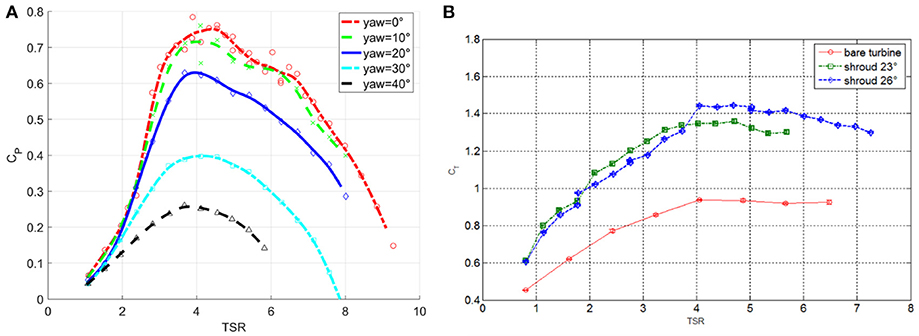
Figure 4. Effect of yaw misalignment on ducted turbine (ϕ = 26°) on measured power coefficient. Current speed 1.5 m/s (A). Comparison of measured rotor thrust coefficients for 3 different configurations (bare rotor, ducted rotor with φ = 23°, ducted rotor with φ = 26°). Current speed 2.0 m/s (B).
It may be noted that the apparent value of the CP exceeds the Betz limit, with the assumed value of the reference area (turbine disk area). If the exit area of the diffuser is used as reference for the definition of power coefficient, the maximum value is limited to a lower value.
Thrust coefficient. A comparison of thrust coefficient plots vs. TSR is reported in Figure 4B. They are relative to different turbine configurations (bare rotor, ducted rotor with ϕ = 23°, ducted rotor with ϕ = 26°). The values of CT are relative to the thrust acting on the rotor only. These data are consistently evaluated by taking the reference area A as the frontal area of the bare rotor disk. It is observed that in presence of the diffuser the rotor features a sensibly higher thrust coefficient with respect to the bare rotor case. This experimental result does not agree with the hypothesis made in some studies reported in literature (see for example Van Bussel, 2007), who claims that the thrust on the rotor remains the same even if it is ducted, but the observed power performance increment, on a ducted turbine, is essentially due to the extra mass flow through the rotor. However, further investigations and validations of numerical and experimental analyses may be useful on this topic.
For the design of GEM system, the estimation of thrust acting on the diffuser supports has also an important role. The diffuser only thrust coefficients (CTs), referred to the swept area of the rotor [CTs = Ts/(0.5 V2A)], have been measured and estimated as function of TSR for two shrouded turbines with different diffuser geometries (ϕ = 23°, ϕ = 26°). It is observed that the diffuser thrust coefficient reduces almost linearly with increasing TSR. For the 23° shroud, CTs varies across the explored TSR interval, ranging from a value of about CTs = 0.92 at TSR = 0.8, to a value of CTs = 0.66 at TSR = 5.7. Such behavior may be due to a flow reattachment on the diffuser inner side promoted by the turbine induced flow. A similar trend may be observed for the 26° shroud configuration, with higher CTs values, ranging approximately from CTs = 1.12 at TSR = 0.81 to CTs = 0.78 at TSR = 7.2.
An important observation, from the design point of view, is related to the significant increase in thrust on the turbine-diffuser assembly with respect to the turbine only configuration.
Tests on full model in small scale
GEM tethered model set-up. In this section the main results of towing-tank tests on a reduced-scale model of the entire GEM system are presented. These tests were mainly aimed at characterizing the steady-state conditions and the related power production performance, and to study the stability and the dynamic behavior of the whole scaled system in different possible operating conditions; for example, some off-design conditions were also examined, such as those caused in real situations by an abnormal shut-off of one turbine.
In the GEM system design two counter-rotating turbines are mounted at the sides of the main floating body. The model used in the tests is scaled by 8 times with respect to a possible real-scale installation of the GEM, and is shown in Figure 5A. It consists of a floating submerged system made up of two bodies: the upper body serves to produce the necessary buoyancy force, while the lower body accommodates instruments and auxiliary devices. The upper body is also equipped with two fins forming an angle of 45° with the longitudinal plane of symmetry. A “V tail” configuration has been used for the tailplanes with the aim to improve the necessary lateral stability of the system and to allow the regulation of the body's pitching trim at stabilized advancing speeds, while reducing the possible interference with turbine wake. Different tail configurations have also been tested throughout the campaign.
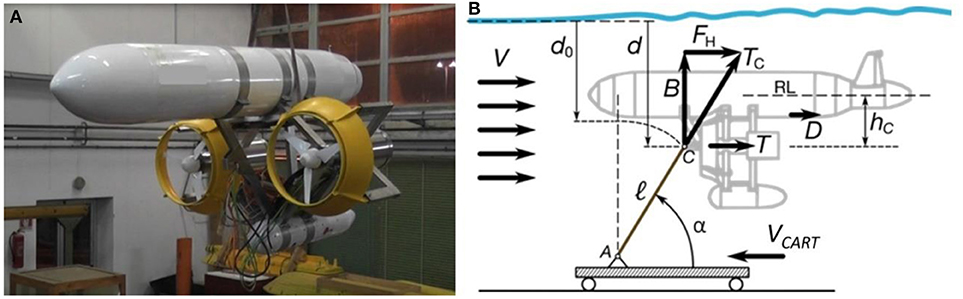
Figure 5. The GEM reduced-scale model tested in the towing-tank. Scale 1:8 (A). Schematic of the GEM system in a steady-state condition, immersed in a current V (due to the advancing carriage speed V); the equilibrium involves the cable tension force TC, the buoyancy B, and the total horizontal force FH (B).
The GEM scaled test model had an overall length of 3.55 m with a turbine axes distance of 1.13 m and an height of 1.84 m. At zero carriage speed the turbine axis was set at 1.65 m below water surface, while the final axis depth is dependent on carriage speed; a schematic of the forces acting on the system is illustrated in Figure 5B. The tethering cable arrangement in steady flow is an important aspect of the tested device. In the towing tests, an immersed steel frame structure fixed with the running carriage simulates the seabed single-point anchorage (represented by point A in Figure 5B). The model is connected via the cable to the running anchorage point. A winch located in point A allows to release or to tighten the cable and, consequently, to position the model at the desired depth in the tank.
Characterization of the submerged tethered system. During the tests, the following data are monitored and measured:
(i) Torque and angular velocity of the left-hand-side turbine, from which the total output power is estimated, assuming symmetrical operating conditions;
(ii) Mechanical tension on the tethering cable, measured by a dedicated load cell;
(iii) Trim of the GEM system with respect to a reference frame fixed to the tank floor, by means of an inertial platform.
As seen from the schematic shown in Figure 5B, in steady-state condition, the equilibrium is guaranteed by the cable tension force TC, the net buoyancy B (buoyancy force minus weight), and the total horizontal force FH.
Based on the cable tension load and on the knowledge of the buoyancy, the total horizontal drag developed by the whole system may be estimated, which in non-dimensional form is expressed by the total resistance coefficient:
where Sref is a properly chosen reference area. For this application the assumed reference area is Sref = 2 A, i.e., twice the turbine disk area. The cable traction TC balances the vector sum of total drag FH and the buoyancy B.
Experimental values of power and torque coefficients plotted vs. TSR are shown in Figures 6A,B, respectively. While the data in Figure 3B are relative to a single isolated turbine, the latter graphs are referred to the complete small-scale GEM model. In the same figures, fitting curves of CP and CQ are also reported. The scattered values of CP and CQ are extracted by averaging from the power and torque measured signals sampled at a frequency of 500 Hz, for different constant rotational speed of the turbine rotors and at a fixed towing carriage speed V = 1.5 m/s. The uncertainty levels indicated on these plots are taken as three times the standard deviation of the sampled values. The two plots reveal that the maximum non-dimensional torque, CQ, max = 0.22, occurs at a value of TSR = 3.15, which, as expected, is not the same TSR at which the maximum CP occurs.
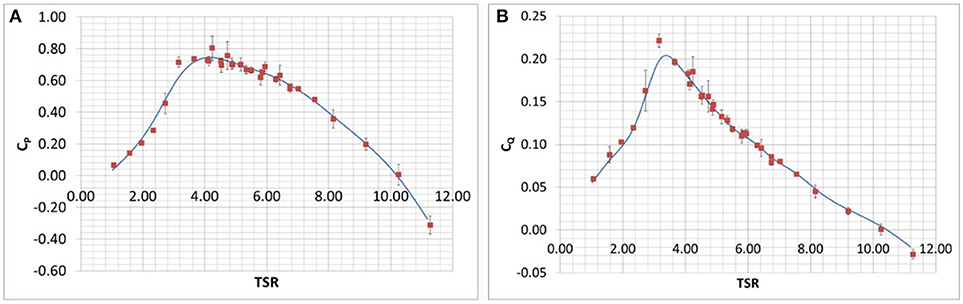
Figure 6. Measured power coefficient averaged values. Turbines with shrouds, V = 1.5 m/s (A). Measured torque coefficient averaged values. Turbines with shrouds, V = 1.5 m/s (B).
The maximum efficiencies of (reduced scale) GEM, measured in the two cases of shrouded and bare turbines, have been compared, considering the values of TSR at which the maxima occur as well. An approximate maximum CP value of about 0.4 has been observed for the bare turbine at TSR = 4.0, while the shrouded turbine showed a maximum CP of about 0.74 at TSR = 4.17.
Although a high scattering of test data may be observed, the data obtained from the GEM scaled model tests seem to confirm the results obtained for the isolated turbine, that is, the presence of diffusers nearly doubles the maximum efficiency. It has to be noted that, due to data scattering, some difficulties are encountered in the estimation of the optimal CP and TSR.
Full Scale Prototype Tests
Experimental tests were carried out on a full-scale GEM prototype, designed to produce 20 kW of power at a nominal current speed of 1.5 m/s. During the field tests, GEM off-design operating conditions have been measured as well. This prototype has been developed, built and installed in a test site in the Venice Lagoon, Italy. The test campaign was supported partially by a consortium of companies operating in the Italian Veneto Region and partially by the Veneto Regional Authority.
Test Plant Configuration
Prototype general data
The first prototype has been installed in the Venice lagoon, near Forte Sant'Andrea, with a seabed depth of about 25 m. The system operated at a depth of about 15 m. In Figure 7A a picture of the large-scale prototype is reported. Operational characteristics and other features of the system are summarized in Table 3.
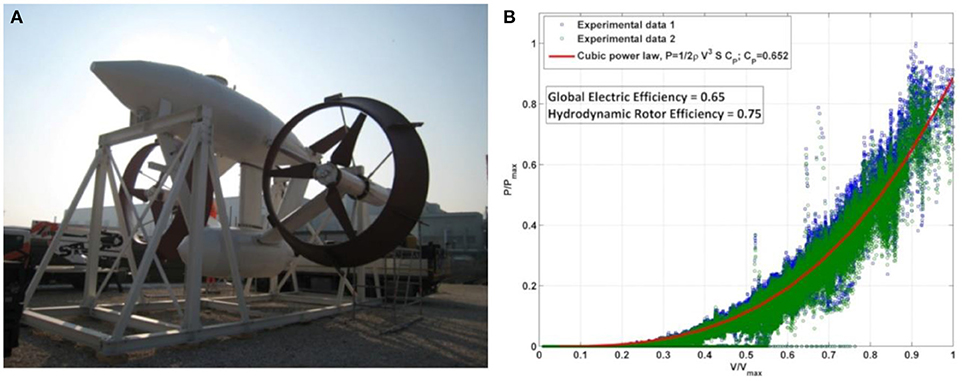
Figure 7. GEM large scale prototype (A) and measured total electrical output power (normalized with respect to maximum measured power) vs. normalized current speed (B).
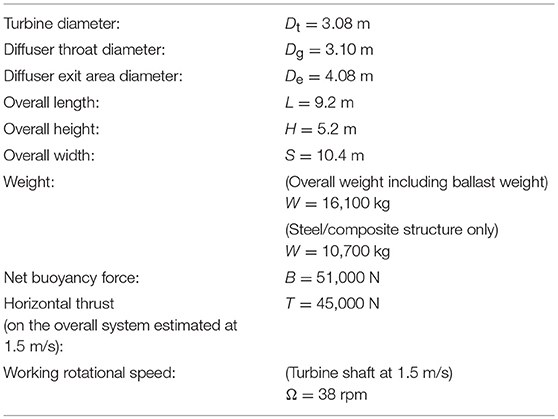
Table 3. GEM prototype geometrical data.
Starting from the information gathered in the preceding research steps, a prototype plant was designed and built-up with the objective to operate in a site with 1.5 m/s speed, generating a nominal total power of 20 kW, with a depth operating range between about 9.8 m (without current) and about 15 m. The turbine has a diameter of 3.08 m, with about 7.45 m2 swept area for each rotor. The adopted manufacturing solution uses carbon-fiber for the turbine blades and of glass-fiber for the diffuser and for the tail-planes, while steel structures are used for the floating body and the connection frame. Turbine blades and diffuser design are based on the results of previous aerodynamic research studies.
Measurement equipment and main observed data
The GEM system full-scale prototype has been equipped with a set of devices for measuring several operating parameters: mainly, system trim and generator power production data. The data have been recorded onboard and transmitted via radio to a remote server. An acoustic speed sensor (ADCP) was installed in proximity of the GEM mooring point in order to measure current speed (the mooring point is about 25 m below the free water surface and its horizontal distance from the GEM). This device allowed the reconstruction of the whole velocity profile of the current, from seabed to water surface.
During the tests, the GEM sideslip (or yaw) angle β, i.e., the rotation angle around the GEM vertical axis, the current direction δ with respect to the North, and the averaged actual current speed measured by ADCP were acquired.
Power production results
The power production has been measured for both installed turbines. In Figure 7B the total measured power is reported vs. the measured speed, in order to determine the device power curve. These data are relative to a single cycle of constant incoming flow direction, i.e., when the current flowing direction δ is almost constant. The data in Figure 7B are non-dimensionalized using the maximum value of velocity observed during a single cycle (Vmax is about 1.35 m/s, slightly lower than the device rated velocity of 1.5 m/s) and the maximum measured power for a single turbine. The test campaign presented many challenges and the data show a rather wide dispersion. Data dispersion is also partially due to a number of trials performed to set up and optimize the maximum power tracking control procedure.
A binning procedure has been used in order to better analyze the power performance: it consists in dividing velocity and power measurements into small intervals (bins), for each bin an average value of velocity and power can be extracted. Thus, power production data are grouped into velocity bins over which an arithmetic mean has been performed. This is the same procedure used for determining wind turbine power curve.
A rough estimation of global power coefficient may be obtained by comparison between cubic and binned curves: the maximum overall power coefficient CP max is within the range
also including mechanical and electrical efficiencies, i.e., efficiency from water current to electrical wire.
Consequently, supposing a generator efficiency of approximately 0.9 and a mechanical gearing efficiency of about 0.9, it can be claimed that, approximately, the shaft power coefficient is within the range 0.76 ÷ 0.8, which is in good agreement with previous model towing tank testing.
Tests have proven the suitability of the system to operate in nominal conditions and the capability to convert efficiently the energy of the flow in mechanical and electrical energy. In particular, the use of ducted diffusers with rotor shroud of optimized shapes has proven to augment power generation capability with respect to the simple bare turbine solution. Nonetheless increased structural complexity and higher thrust levels due to the installation of diffusers have to be accounted for, in the overall evaluation of the shrouded configuration. This has led to GEMSTAR, second generation of GEM, in which, among other evolution, the diffusers have been removed for a cost effective installation to reduce the Levelized Cost of Energy (LCOE).
The full scale tests on a GEM prototype seem to prove the feasibility, reliability, stability and efficiency of the system. Further research studies will aim to the development and validation of an accurate simulation model capable to design a GEM system for higher rated power. Three hundred kilowatt GEMSTAR prototype will be deployed in Messina Strait in 2020.
Wave Energy Case Study: PIVOT, Pivoting Buoy Wave Energy System
A second test case is considered in relation to possible marine energy exploitation in the Mediterranean area: a wave energy converter, named PIVOT, based on a pivoting buoy. In principle such kind of device may be adapted to the integration with different types of PTOs. In the actual development of the system it has been integrated with a linear PTO based on the recirculating ball-screw technology developed by Umbra Group s.p.a., a world leading producer of bearings, ball-screw systems and electromechanical actuators.
In the field of wave energy, a number of different solutions has been presented. The presented device may be classified as a wave actuated body oscillating under wave action around a fixed hinge. Several research activities have been presented in literature on similar topics. The subject of wave actuated bodies has been extensively studied in literature. Point absorbers in heave, for example, represent a common type of wave energy converter (WEC) and many analytical studies (see for example Falnes, 2002) as well as numerical and experimental researches have been reported (see for example Vantorre et al., 2004; Hager et al., 2012). The concept and modeling of hinged WECs has been explored for example in Marquis et al. (2010), Hansen and Kramer (2011), Hardisty (2012), and Ionescu and Ngwenya (2014).
A Preliminary Resource Assessment
Several analyses about wave energy resource on the Italian coastal areas may be found in literature. For example, Iuppa et al. (2015) reports a survey of some site along the Sicilian coast. Here, a brief survey of some results is reported in relation to a site investigated for the study of a possible installation of the system in an on-shore configuration.
The site location is close to Civitavecchia port on a breakwater structure. Available data for the assessment are obtained by a numerical model for wave climate estimation (Bargagli et al., 2011). Data were supplied by the Italian research institution ENEA.
Available data report, with a 3 h sampling interval, the time histories of the following wave climate characteristics, which represent the sea state conditions:
• Significant height, Hs (m)
• Peak Period, Tp (s)
• Mean Period, Tz (s)
Time histories data of the measured quantities are available over an observation period of 10 years (2001–2010).
An overall scatter matrix, which reports the occurrence frequency of a discretized set of sea states as a function of significant wave height and peak period, may be obtained by post-processing time histories data (Figure 8).
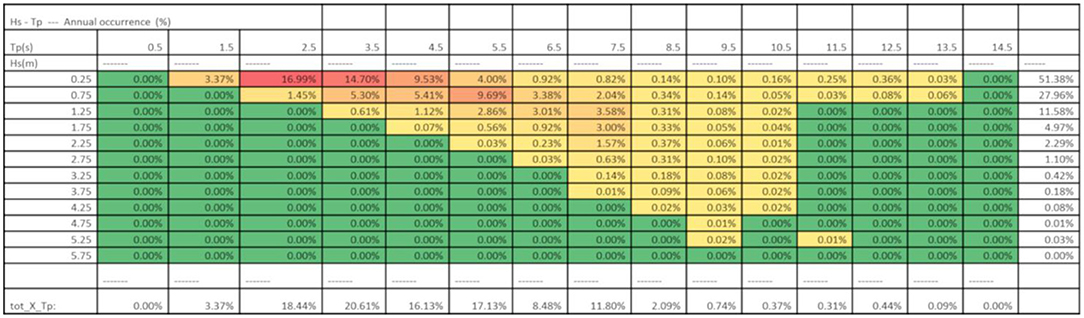
Figure 8. Wave scatter matrix for a Tyrrhenian sea site, near Civitavecchia, derived from sea state time histories (2001–2010, ENEA numerical model).
System Operating Principle
The system consists in a point-pivoted buoy that is put in oscillation by the incoming waves. The buoy is hinged through supporting arms to a fixed structure. Another hinge, placed on the oscillating arms, provides the connection with the ball screw based electro-mechanical generator, in such a way to allow generator rotation according with the buoy oscillation. The rotational motion of the pivoting buoy is transformed into the translational motion transferred to the PTO. The PTO, by means of a ball-screw mechanism, transforms the linear motion of the piston in the rotational motion acting on the generator. The ball-screw mechanism and the generator are integrated in a whole device.
A schematic representation of the operating principle of the system is reported in Figure 9A.
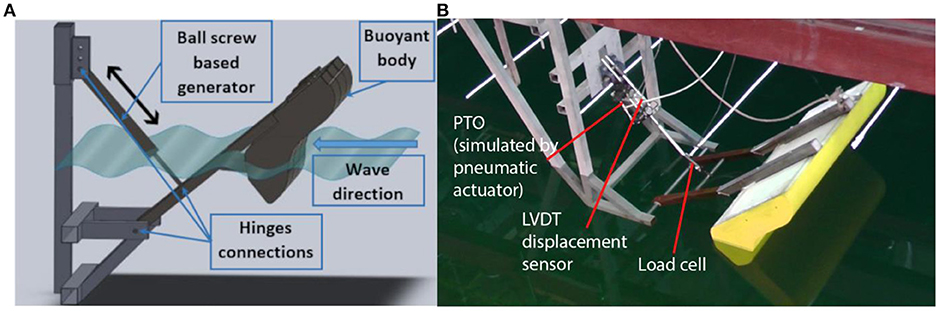
Figure 9. PIVOT WEC system operating principle (A). PIVOT WEC system small scale test model set-up (B).
Numerical Model
A numerical model based on potential flow theory has been developed, using existing computational codes, in order to analyzed the wave-body interaction in the examined cased.
The dynamic behavior of the system may be described to a first order of approximation by the use of a simple equivalent 1DOF equation that represents the equilibrium of moments around the hinge axis:
where:
• I is the rotational inertia around the hinge axis accounting for the hydrodynamic added mass also;
• Mext is the external moment due to waves excitation forces (diffractive and Froude-Krylov forces);
• Mrad is a term accounting for the radiation force, which should be corrected for viscous contribution;
• M0is a term related to hydrostatic stiffness;
• MPTO is the moment due to the point pivoted power take-off device (PTO);
• θ is the inclination angle of the support arm of the body.
The definition of the radiation and excitation terms are related to a classical approach to the wave-body interaction problem, based on potential flow theory. Using such diffused approach, the simulation of wave-body interaction is decomposed in the solution of different boundary value problems, assuming that a superposition principle may be applied. The potential solution is written as the sum of different terms: (a) the undisturbed wave field (related to Froude-Krylov forces), (b) the perturbation field due to the presence of the body (related to diffraction forces), (c) the radiation field due to the wave radiated by the body motion in a steady free surface (related to radiation forces expressed in terms of added mass and radiation damping). Each problem is solved separately with its own boundary condition. Some details may be found in Berteaux (1976) and Faltinsen (1990). The solution procedure is based on a boundary elements method, which allows obtaining the hydrodynamic coefficients to define each of the contribution to the wave-body interaction forces. A time domain solution is further performed to solve for the effective dynamic response of the system.
A suitable control system has to be implemented in the PTO device, in order to ensure that the force response of the device comply with a given control law. The selected PTO system was controlled so as to produce a force response proportional to velocity variations, according to the following relation:
where K is an adjustable gain, Fpist is the PTO force acting on the oscillating piston of the PTO, and Vpist is the elongation velocity of the piston. The gain coefficient K may influence the overall behavior of the system in response to wave action and may affect power conversion performances. Fpist defines the contribution of the PTO to the dynamic equilibrium of the system.
The model takes into account only the shaped buoy, neglecting the effect of the oscillating support arms.
Test on Reduced Scaled Model
In order to better understand the physical behavior of the system a set of tests have been performed on a scaled model of the system, in an approximately 1:5 scale ratio with respect to expected larger scale prototype. A picture of the model set-up is reported in Figure 9B. Detailed results of the tests have been reported in Coiro et al. (2015). An experimental test campaign was performed in the towing tank facility available at the Department of Industrial Engineering, of the University of Naples. This facility has a wave generator capable of producing waves with variable frequency and amplitude. A moving wall wave generator is placed at one end of the basin. The wave generator is able to reproduce different sea states, and its operating limits are reported below:
• Operating frequency interval: ~0.35–1.2 Hz
• Maximum wave height: ~0.6 m (also depending on frequency)
To characterize the power production performance of the system, the absorber is equipped with a potentiometer and it is linked to the buoyant body by means of a load cell: power is then indirectly measured as the product of force times velocity. Wave elevation is measured by means of ultrasonic probes and the movements of the buoyant body around its equilibrium position are primarily measured by the potentiometer mounted on the piston during wave testing (for some specific purposes, during the tests, other displacement measuring equipment have been used, such as a laser distance measuring system). Then, all these measurements are collected and compared with numerical results.
The PTO device has been simulated for the major part of the test campaign by means of a pneumatic actuator. The actuator is driven by an analog control system, which apply the chosen linear control law and allow the variation of the force-speed gain to modify system response. The control system takes as input the measurements of the load cell and of the potentiometer and implements a feedback control algorithm to ensure the appropriate instantaneous force response actuating the controlled valves of the pneumatic piston. At the same time the controller provides an output signal for the estimated piston speed.
Two testing configurations were developed and studied during the experimental analysis, with different position of the hinges relative to the water free surface. In both configurations, the simulated PTO device is almost perpendicular to the supporting arms, but in one configuration the support arms are horizontal, while in the other one the arms have an inclination angle. The inclined arms configuration has shown better results in the performed tests. Such behavior is probably related to the possibility to exploit both the vertical and horizontal wave force actions, while for the horizontal arms model only the vertical component is effective in practice.
Several different types of test have been performed, the main results are related to the estimation of system response and power output.
Numerical potential flow data compared to experimental tests have shown to be in relatively good agreement with respect to natural frequency and wave frequency for max power (mean and instantaneous), but the value of the power from simulations is almost double than experimental one. Part of this issue is probably related to an overestimation of the velocity, and thus of the force at the absorber, in the simulations, since no viscous effects were introduced. A much better agreement between numerical and experimental results may be observed for large scale prototype, as reported below indicating that the influence of viscous effect is much larger for reduced scale prototype than larger one.
Optimization Based on Potential Flow Simulation
A numerical optimization procedure has been implemented in order to search a suitable system configuration for a given sea condition. To perform the optimization, the commercial code ModeFrontier, by ESTECO SpA, has been used in cooperation with Umbra Cuscinetti SpA.
The assumed sea state is extremely simplified and is assumed to be representable by a monochromatic wave of given frequency and amplitude. This approach has been chosen for design purposes in order to reduce the amount of simulation time, during multiple simulation runs, and the complexity of an irregular sea state. It has to be noted, however, that this is a strong approximation and that the effect of irregular waves may have a significant impact on the final effective power output.
The optimization process has been applied to a system with the dimension of a possible real scale prototype, with a width fixed to 5 m, a length of about 3 m and a submerged volume of about 4 m3. The width of the buoy was fixed to account for possible limitation on the available installation site and/or on the number of installable systems.
In the search process, for every examined configuration, a shape is generated and an initial equilibrium condition is found. With respect to this equilibrium condition a linearized hydrodynamic analysis is performed. A surface mesh is generated for the geometry, which is split into two parts distinguishing between diffractive (underwater) and non-diffractive elements. The radiation and diffraction problems are solved to obtain the related hydrodynamic coefficients (added mass and radiation damping, for radiation problem, and diffractive forces coefficients) for just the frequency of interest. Assuming a regular monochromatic wave, in the analysis of the radiation forces the convolution method, more proper for irregular seas, has not been used and the radiation forces have been estimated using the response amplitude operators and the hydrodynamic coefficients related to the prescribed incoming wave frequency.
A time domain simulation is then performed using the linearized coefficients previously estimated for the frequency of the incoming wave, together with a non-linear estimation of the hydrostatic and Froude-Krylov forces, which are calculated at each integration time-step considering the actual wetted surface. During time simulation the mechanical non-linearity due to the effect of the hinge and of the pivoting generator piston are taken into account. Power output is estimated by post-processing time simulation results.
The following parameters have been accounted for in the optimization process:
• Body mass (related to submerged volume at initial equilibrium condition)
• PTO force-speed gain
• Body shape
The position of the center of gravity is assumed to be constant together with the assumed principal moment of inertia. Only the overall mass of the body is changed through the optimization process.
The geometry of the PTO connection, involving the length of the support arms and the position of the piston attachment points, is leaved unchanged. A linear PTO control law is chosen, defined by the value of the gain relating speed and generator required force.
With respect to the shape of the body, only the cross-section shape is varied, leaving unchanged the transversal length in order to fulfill possible size constraints (for example, due to the available site extension). A B-spline curve, defined by 15 coefficients, is used to parameterize the cross-section shape of the body. In order to reduce the number of optimization parameter, only 3 coefficients are varied, changing only the forward part of the body, which is supposed to be more influent in determining the interaction with the incoming wave. It has to be noted that some problems may arise using such approach and sometimes unfeasible configurations are generated. Reducing the number of parameters may have a positive effect on such issue.
RANS Simulations
Several Unsteady Reynolds Averaged Navier-Stokes (URANS) simulations were performed on the buoy configuration, using the commercial code StarCCM+, with similar assumptions as for the potential flow model. These simulations were made to try to take in account viscous effects due to buoy movements into water. Due to symmetrical properties of the problem, only one half of the real physical water tank was reproduced. In the simulated wave tank, the buoy can rotate around a hinge due to wave's actions. Different computational grids were tested and one was chosen which assure the better combination of accuracy and CPU time. In general, grids have a background and a superimposed grid (overset grid approach), which allows the buoy floating movements: the buoy is completely contained in the overset grid (Figure 10A). Each URANS simulation run for about 30 s of simulation time, requiring about 2 days on a 64 CPUs device. Different turbulence models were also tested and k- ω model was chosen. During simulations, data about hinge rotational angle and center of gravity (CG) position were recorded and used to evaluate mean and max available power. In the URANS simulations, effects of PTO device were also accounted for, in a way similar to that used in the potential flow simulations.
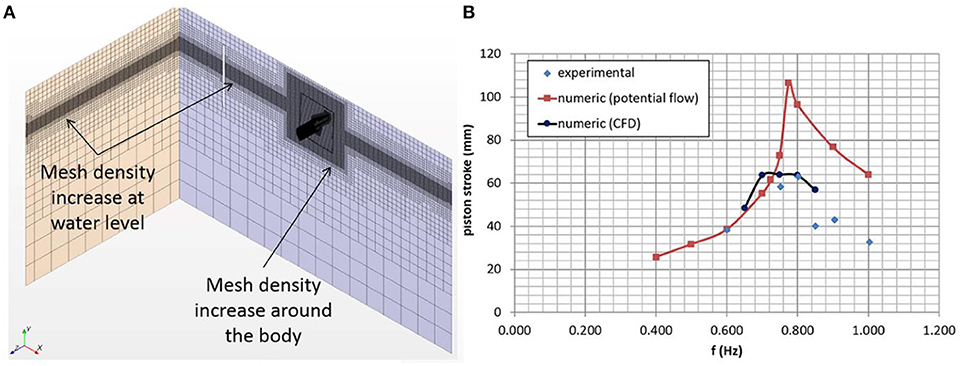
Figure 10. CFD model computational grid (A). Comparison of potential flow, CFD, and experimental results in terms of piston oscillation amplitude as a function of wave frequency with no PTO load (B).
Several analyses have been performed, both on the small scale and on the full-scale system model. A summary of some results is reported in Figure 10B in terms of oscillation amplitude as a function of incoming wave frequency with no PTO load. A large overestimation of predicted oscillations using potential flow theory may be seen in the case of the small-scale model, particularly around the peak frequency. On the contrary, very good accuracy can be seen regarding CFD numerical results. This situation is particularly true for small scale models while for larger model the differences between the two approaches tends to vanish, as shown later in the paper, indicating that viscous effects play a more important role for small-scale model test.
The larger computational costs of the CFD suggest its use for detailed analyses of specific cases of interest, while for optimization purposes the potential flow approach seems to be more indicated. Despite the lack of accuracy in predicting the exact value of system response, the potential flow model is able to capture the overall trend of system behavior and to compare alternative configurations, requiring smaller computational resources.
Large Scale Prototype
After the first small scale test campaign, aimed to focus the main issues and the overall system behavior and to simulation model set up, a larger model was developed, in cooperation with Umbra, within a research program supported by WES organization (Wave Energy Scotland).
Figure 11A shows the large scale model mounted on the dynamometric cart in the naval towing of the University of Naples.
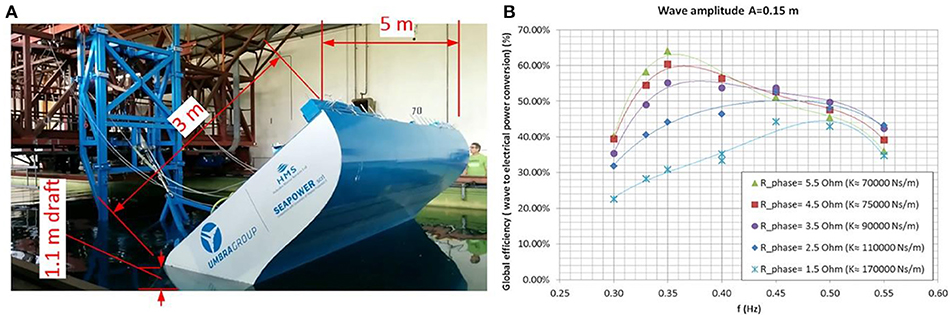
Figure 11. Wave tank experimental test on large scale model (A). Global conversion efficiency in regular wave tests, as a function of wave frequency for different electrical resistance load. Wave amplitude 0.15 m (B).
The model was optimized for a regular wave condition with 0.24 m wave amplitude and 0.35 Hz frequency. Some modifications to the direct results of the optimization have been implemented in the final design, to optimize integration with the PTO and for constructive reason, simplifying the shape in areas, like the rearward part of the body, with lower impact on hydrodynamic performances.
The developed numerical model was enhanced where needed also taking into account the information gathered in the first run of tests.
The prototype buoy shape and dimensions, given the operating conditions, were chosen comparing several solutions obtained using the developed shape optimization numerical procedure.
Final manufactured configuration was slightly changed for manufacturing reasons and for better coupling with ball-screwing based electrical generator.
The main results of the tests were the system power output and the conversion efficiency.
A resistor bench has been used to define a control law for the generator force response. Electrical load was changed by setting the bench electrical resistance value.
An approximate linear relation between force and velocity is established using an adjustable electrical load by means of a resistor bench (real relation shows also a variation with piston speed for a fixed electrical load).
The system was equipped with a load cell and a potentiometer (LVDT type) on the piston in order to measure force and displacement (and velocity by differentiation) to estimate mechanical input power. Moreover, 4 tri-axial load cells were used to estimate the forces exerted by the wave directly on the buoy in order to evaluate the efficiency of the buoy.
Wave characteristics were monitored by multiple capacitive wave gages system (8 in total) in a suitable array arrangement, to capture eventual directional patterns and to study wave reflections.
For the highest tested wave amplitude (0.24 m with 0.35 Hz frequency) a mechanical peak power of about 6.5 kW has been observed, with an average mechanical power of about 2.6 kW. Based on wave available power, a buoy mechanical conversion efficiency of about 74% may be estimated in this specific condition. In the same conditions the measured average electrical power output reached a value of about 2.0 kW, with a PTO efficiency of about 77% leading to an overall efficiency of 69%.
It has to be noted that a significant dependence on wave frequency has been observed, as expected for a resonating behavior. The power production rapidly decreases away from the power production peak frequency (about 0.35 Hz, but variable with the PTO damping). Figure 11B shows the global conversion efficiency (wave-to-wire), in percentage, as a function of wave frequency for different electrical resistance and for 0.15 m wave amplitude. The global conversion efficiency is defined as the ratio of the electrical power output to the average power transported by the wave, thus accounting for both the conversion efficiency of the buoy and the generator electrical efficiency.
Typical measured and computed time histories of piston oscillation velocity and output power are reported in Figures 12A,B, under a wave condition with 0.2 m wave amplitude and 0.35 Hz frequency. A good agreement may be observed at least for this specific case, although it has to be noted that some slightly larger differences appear for some conditions over the whole range tested.
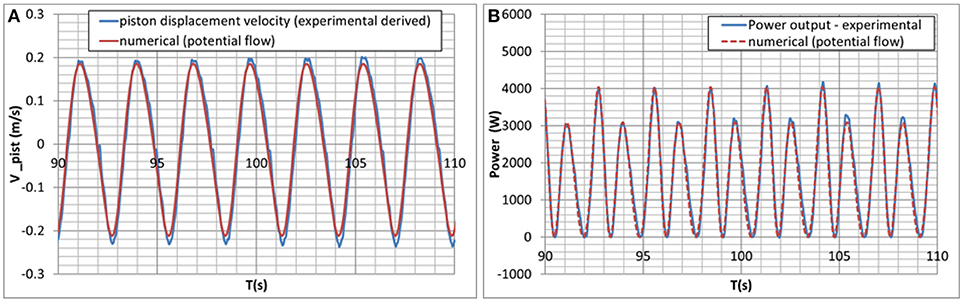
Figure 12. Numerical (potential theory)—experimental comparison. Piston velocity time histories (A), instantaneous power time histories (B). [A = 0.20 m, f = 0.35 Hz, K = 90,000 N/(m/s)].
Reported data are related to tests in regular waves. It has to be noted that, considering irregular sea states with possible large variation in instantaneous surface elevation, conversion efficiency and power output may be significantly reduced. One of the most relevant issues observed with the tested device is the possible very large difference between the average and peak power output and forces on the PTO. Such issue requires further studies in order to define and implement a proper control strategy to mitigate, if possible, the peak-to-average power ratio.
Tests in irregular wave conditions have also been performed. Figure 13A shows the large difference observed between maximum and average power for Pierson-Moskowitz spectrum sea states with 0.25 m significant height and different peak frequency. Finally, Figure 13B reports the global efficiency in the case of irregular sea states. Two spectrum models are considered, JONSWAP and Pierson-Moskowitz, both showing a slight reduction of performance with respect to the regular sea state case.
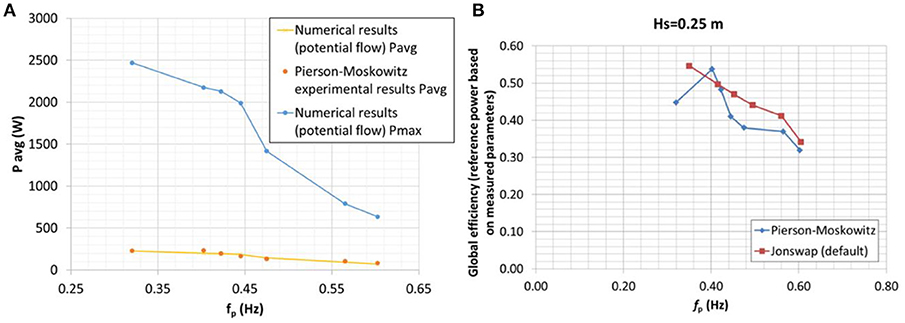
Figure 13. Comparison between measured average and max mechanical power for irregular sea states, for constant significant height (Hs = 0.25 m) and variable peak frequency (Pierson Moskowitz spectrum) (A). Global measured conversion efficiency, for irregular sea states (B).
A further development of the project is planned after laboratory tests. In particular, a prototype to be tested in marine environment is currently under construction for the deployment on a breakwater in Civitavecchia harbor. For a 5 m wide device, with the wave climate at Civitavecchia (see par. 3.1), the estimated annual energy production is equal to about 14,000 kWh/year. It has to be noted that the planned tests are aimed at the evaluation of the overall system behavior in real environment and only a limited set of operating conditions over a limited time extent will be considered for the initial test, thus potentially limiting the effective harvestable energy.
Conclusions
A brief review is presented of the experience gained over several years of applied research in the field of marine energy performed at Department of Industrial Engineering of University of Naples in cooperation with non-profit research consortium SEAPOWER scrl participated by the same University. Both tidal and wave energy have been considered and several Mediterranean installation sites have been explored. Promising results have been obtained, although some problems still need further investigations. Two case studies have been presented.
In the case GEMSTAR tidal device, a floating submerged turbine system at TRL 7, problems may arise in the design of the mooring system and structural optimization, as a consequence of the high loads due to turbine thrust and required buoyancy. Further undergoing studies are involving blade shape optimization also in connection with the generator control strategies aimed to reduce costs keeping blades pitch fixed to reduce global system capital cost and O&M.
The PIVOT WEC system at TRL 5, also shows promising possibilities for low energy sites typical of Mediterranean Sea, even if some issues are still under investigations. A problem for this type of device is related to the strong dependence of the response on the sea state frequency, which may require site specific optimization and may yield poorer energy production performances. Moreover, the problems arising from the large difference between average and peak response requires further undergoing studies, which will involve strategies aimed to upgrade the PTO to smooth out the large differences between maximum and average output power and also to optimize the control strategy. Issues with survivability in storm conditions need also further investigations.
Author Contributions
All authors listed have made a substantial, direct and intellectual contribution to the work, and approved it for publication.
Conflict of Interest Statement
The authors declare that the research was conducted in the absence of any commercial or financial relationships that could be construed as a potential conflict of interest.
References
Bargagli, A., Carillo, A., Ruggiero, A. V., Lanucara, P., and Sannino, G. (2011). Modello di Onde per L'area Mediterranea. Report RdS/2011/26, ENEA.
Coiro, D. P., De Marco, A., Scherillo, F., Maisto, U, Familio, F, and Troise, G. (2009). “Harnessing marine current energy with tethered submerged systems: experimental tests and numerical model analysis of an innovative concept,” in 2009 International Conference on Clean Electrical Power (Capri: IEEE).
Coiro, D. P., Maisto, U., Scherillo, F., Melone, S., and Grasso, F. (2006). “Horizontal axis tidal current turbine: numerical and experimental investigation,” Offshore Wind and Other Marine Renewable Energies in Mediterranean and European Seas (OWEMES) (Civitavecchia).
Coiro, D. P., and Nicolosi, F. (1998). “Numerical and experimental tests for the kobold turbine,” in SINERGY Symposium (Hangzhou).
Coiro, D. P., Troise, G., Calise, G., and Bizzarrini, N. (2015). Wave energy conversion through a point pivoted absorber: numerical and experimental tests on a scaled model. Renew. Energy 87, 317–325. doi: 10.1016/j.renene.2015.10.003
Coiro, D. P., Troise, G., Ciuffardi, C., and Sannino, G. M. (2013). “Tidal current energy resource assessment: the Strait of Messina test case,” in International Conference on Clean Electrical Power: Renewable Energy Resources Impact (Alghero: IEEE Transaction).
Coiro, D. P., Troise, G., and Scherillo, F. (2012). “Design, towing tank test and deployment of full scale GEM, a novel tethered system for harnessing tidal energy,” in Proceeding of Asian Wave and Tidal Energy Conference (AWTEC 2012) (Jeju).
El-Geziry, T. M., Bryden, I. G., and Couch, S (2013). Environmental impact assessment for tidal energy schemes: an exemplar case study of the Strait of Messina. J. Mar. Eng. Technol. 8, 39–48. doi: 10.1080/20464177.2009.11020217
Faltinsen, O. M. (1990). Sea Loads on ships and offshore structures. Cambridge, UK: Cambridge University Press.
Hager, R., Fernandez, N., and Teng, M. H. (2012). “Experimental study seeking optimal geometry of a heaving body for improved power absorption efficiency,” in ISOPE Conference Proceedings of the 22nd International Offshore and Polar Engineering Conference (ISOPE 2012) (Rhodes: International Society of Offshore and Polar Engineers).
Hansen, R. H., and Kramer, M. M. (2011). “Modelling and control of the Wavestar prototype,” in The 9th European Wave and Tidal Energy Conference (EWTEC 2011) (Southampton).
Hardisty, J. (2012). Experiments with point absorbers for wave energy conversion. J. Mar. Eng. Technol. 11, 51–62. doi: 10.1080/20464177.2012.11020261
Igra, O. (1981). Research and development for shrouded wind turbines. Energy Conv. Manag. 21, 13–48. doi: 10.1016/0196-8904(81)90005-4
Ionescu, D., and Ngwenya, B. S. (2014). “Innovative design of a sea Wave Energy Harnesser,” in International Conference on Renewable Energies and Power Quality (ICREPQ'14) (Córdoba).
Iuppa, C., Cavallaro, L., Vicinanza, D., and Foti, E. (2015). Investigation of suitable sites for wave energy converters. Ocean Sci. 11, 543–557. doi: 10.5194/os-11-543-2015
Liberti, L., Carillo, A, and Sannino, A. (2013). Wave energy resource assessment in the Mediterranean, the Italian perspective. Renew. Energy 50, 938–949. doi: 10.1016/j.renene.2012.08.023
Marquis, L., Kramer, M., and Frigaard, P. (2010). “First power production figures from the Wave star roshage wave energy converter,” in ICOE, 3rd International Conference on Ocean Energy (Bilbao).
Polagye, B., VanCleve, B., Copping, A., and Kindendall, K. (2011). Environmental Effects of Tidal Energy Development. U.S. Department of Commerce National Oceanic and Atmospheric Administration National Marine Fisheries Service NOAA Technical Memorandum NMFS F/SPO-116, 181.
Reinecke, J., Von Backstrom, T. W., Venter, G., and Van Niekerk, J. L. (2011). “Effect of a diffuser on the performance of an Ocean current turbine,” in 9th European Wave and Tidal Energy Conference (EWTEC), Conference Proceeding (Southampton, UK).
Scherillo, F., Maisto, U., Troise, G., Coiro, D. P, and Miranda, S. (2011). “Numerical and experimental analysis of a shrouded hydroturbine,” in Procedings of International Conference of Clean Electrical Power (ICCEP) (Ischia), 216–222.
Shives, M., and Crawford, C. (2011). Developing an empirical model for ducted tidal turbine performance using numerical simulation results. J. Power Energy 226, 112–115. doi: 10.1177/0957650911417958
Stoddard, F. S., and Eggleston, D. M. (1987). Wind Turbine Engineering Design. Dordrecht: Kluwer Academic Publishers.
Turbine (2012). MCT - Marine Current. Available onine at: http://www.marineturbines.com/Contact-Marine-Current-Turbines
Van Bussel, G. J. W. (2007). The science of making more torque from wind: Diffuser experiments and theory revisited. J. Phys. 75:012010. doi: 10.1088/1742-6596/75/1/012010
Vantorre, M., Banasiak, R., and Verhoeven, R. (2004). Modelling of hydraulic performance and wave energy extraction by a point absorber in heave. Appl. Ocean Res. 61–72. doi: 10.1016/j.apor.2004.08.002
Keywords: tidal current energy, hydrokinetic turbine, floating marine turbines, wave energy, pivoted buoy conversion system
Citation: Coiro DP, Troise G and Bizzarrini N (2018) Experiences in Developing Tidal Current and Wave Energy Devices for Mediterranean Sea. Front. Energy Res. 6:136. doi: 10.3389/fenrg.2018.00136
Received: 10 September 2018; Accepted: 28 November 2018;
Published: 12 December 2018.
Edited by:
Federico Maria Pulselli, Università degli Studi di Siena, ItalyReviewed by:
Arne Vogler, University of the Highlands and Islands, United KingdomVincenzo Nava, Tecnalia Research & Innovation Foundation, Spain
Copyright © 2018 Coiro, Troise and Bizzarrini. This is an open-access article distributed under the terms of the Creative Commons Attribution License (CC BY). The use, distribution or reproduction in other forums is permitted, provided the original author(s) and the copyright owner(s) are credited and that the original publication in this journal is cited, in accordance with accepted academic practice. No use, distribution or reproduction is permitted which does not comply with these terms.
*Correspondence: Domenico P. Coiro, Y29pcm9AdW5pbmEuaXQ=