 Yue Zhao
 Guo-Pu Qu
- School of Nuclear Science and Technology, University of South China, Hengyang, China
The N-13 coincidence method is an effective approach for monitoring the primary loop leakage in pressurized water reactors. The high coincidence efficiency and low background are crucial to achieving a lower limit of measurement for such a monitoring system. In this paper, we proposed four types of geometric designs of the sampling composing NaI(TI) detector. For varying container volumes (V), the detection efficiency (ε) of these containers was investigated through the Geant4 simulation and experimental measurement. The value of ε•V, which is a key combined parameter, was obtained accordingly. Finally, we obtained the optimal size of the suitable sampling and detection container for the coincidence method.
Introduction
During the operation of nuclear power plants, a series of uncertainties, such as the stress relaxation of material and weld joint pressure corrosion, can cause the leakage of the primary loop radioactive water (D'Auria et al., 2017). Such leakage may affect the safety of operation of the nuclear power station, and so it should be accurately monitored. Methods to detect the release of reactor coolant to the containment include the indication and/or monitoring of changes in (a) airborne particulate radioactivity, (b) airborne gaseous radioactivity, (c) containment atmosphere humidity, (d) containment atmosphere pressure and temperature, and (e) condensate flow rate from the air coolers (Dissing and Svansson, 1980; Aoki, 1991; Zheng et al., 2016). Among these methods, a reliable leakage monitor method is to measure the concentration of 13N in the containment vessel, e.g., by using the γ-ray energy spectrum method. The use of 13N as tracer isotopes for a reactor coolant pressure boundary leakage detection system has been experimentally demonstrated at the R2 research reactor at Studsvik, Sweden (Dissing and Svansson, 1980). Ling-Qiu et al. applied this method to study the leakage of 13N in the primary loop of nuclear power stations. The lower limit of detection was 11 L/h, which occurred at the pressure vessel for the 600-MW nuclear power plant in Qin Shan, China. The lower limit of detection of the 13N energy spectrum method is high, and the small-amount leakage of the first loop is difficult to find. For the energy spectrum method, the detector system requires good stability, and it is challenging to achieve long-term stability for such system. The coincidence method is a common method to measure the radionuclide activity of simultaneously emitting several rays, which can effectively reduce the background, improve the signal-to-noise ratio and reduce the stability requirements of the measurement system (Ember et al., 2004; Vidmar et al., 2007; Antovic and Svrkota, 2009; Volkovitsky and Naudus, 2009; Tillett et al., 2017; Zhang et al., 2018). However, the disadvantages are the low coincidence efficiency and long measurement time. Because 13N is a short-lived positron emitter, its positron annihilation can produce two gamma photons with equal energy of 0.511 MeV in opposite directions. Hence, we propose a method to measure the concentration of 13N in the containment using the coincidence method. In this paper, we focus on designing an appropriate sampling and detection container with a high coincidence efficiency. Geant4 simulation and experimental measurements were performed to optimize the detection efficiency of the container for several geometric schemes.
Methods
Theoretical Descriptions
The elastic collisions between a neutron from the nuclear fuel fission and a hydrogen nucleus in water produce recoil protons:
When the produced protons have energy higher than 5.5 MeV, they may interact with 16O and produce 13N via:
Here, 13N is a positron emitter, which has a half-life of 9.96 min. The emitted positrons lose their energy when they pass through matter, annihilate with abundant electrons surrounding them, and decay into two γ-ray protons with equal energies of 0.511 MeV.
The concentration of 13N (defined as N1) in primary loop water is proportional to reactor power P:
where K1 is the coefficient in the unit of L−1(MW)−1.
If the water in the primary loop leaks, it can be gasified due to its high temperature and pressure, and 13N exists in a gaseous form in the containment vessel. The gas in the vessel was pumped into a sampling container and measured with the coincidence system. The leakage rate VL is obtained from the net coincidence counting rates (n), transmission coefficient (K2), and reactor power (P) as follows:
Here, the units of the true coincidence rate and leakage rate are cph and L/h, respectively.
Transmission coefficient K2 is the true coincidence rate measured by the coincidence system when the leakage rate of the primary loop radioactive water is 1 L/h in the containment. K2 depends on many factors such as coincidence efficiency ε of the gamma ray with an energy of 0.511 MeV, gasification of water leaked from the primary loop, uniform mixing time t1, gas transmission time of gas in the sampling pipe (t2) and sampling container (t3) as follows:
where λ is the decay constant of 13N in units of h−1, Q is the sampling flux in units of L/h, and V1 is the volume of hood containment of the reactor driving mechanism ventilation in units of L. As a result, leakage rate VL can be expressed as:
When the reactor operates at full power, by substituting Equation (3) into Equation (6), the leakage rate becomes:
The lower limit is an important parameter for the detection instrument system. At 95% of confidence probability, if only statistical fluctuations are considered, lower limit of net count ND can be expressed as (Knoll, 2000):
Where Nb is background counts. To convert ND in counts to minimum detectable activity A, the additional factors of radiation yield per disintegration (f), measurement time of background tb and absolute detection efficiency (ε) must be taken into account (Knoll, 2000):
The activity of the gas in the sampling container (A1) is determined by concentration of 13N (N) in the gas and volume V of the sampling container. It takes a form:
Here K is a constant.
When A1 equal to A, the lower limit of leakage rate VLD can be expressed as:
During the measurement, Kfλ can be considered a constant. From Equation (8), we find the designing sampling and detection container, which can enhance the coincidence efficiency and ε•V, which is a key issue to reduce the lower limit of detection of the 13N leakage monitoring system.
Preliminary Design of the Sampling and Detection Container
The Marinelli beaker (MB) as a sampling container has been used for the 13N leakage monitoring system based on the γ-ray energy spectrum analysis (Dissing and Svansson, 1980; Erbeszkorn et al., 1996; Ahmed et al., 2009). The design parameters of the MB container enable one to detect gamma ray with energy of 0.511 MeV. We design the current sampling and detection container based on the MB container. Since the positron annihilation can produce two gamma photons in opposite directions, the sampling container is selected as a sealed stainless-steel (1Cr18Ni9Ti) cylindrical container. The stainless-steel container is 1 mm thick. The inner and total heights are 78 and 80 mm, respectively. Five Φ3” × 3”NaI(TI) detectors were used as coincidence detectors. Among them, one was installed at the center of the container, and the others were symmetrically distributed around the container. To obtain an optimal coincidence detection efficiency of the container, four types of geometric designs of the container were selected: four detectors were installed outside the container (NO.1), a quarter of the detector circumference was located in the container (NO.2), the center of the detector in the circumference of the container (NO.3) and all detectors in container (NO.4). A schematic of these sampling and detection container arrangements is shown in Figure 1.
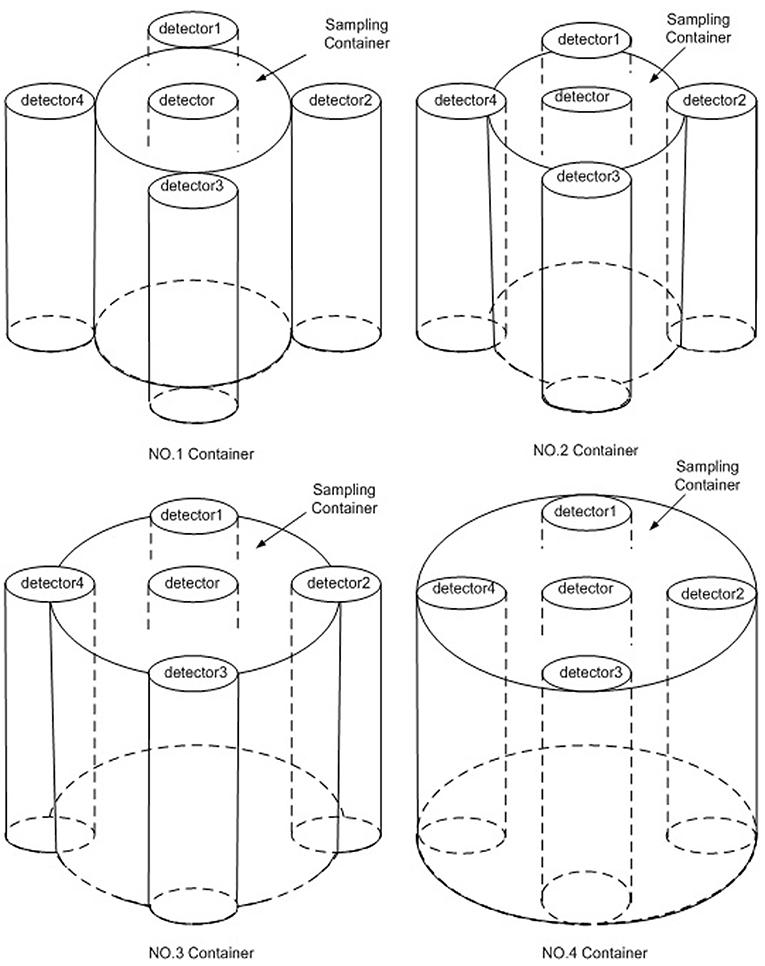
Figure 1. Diagram of the sampling container.
Detection Efficiency Simulation
The Geant4 toolkit (Agostinelli et al., 2003) presents an object-oriented programming that enables one to select among a wide range of physical processes or implement them according to experiment requirement. In this work, Geant4 was used to simulate the entire sodium iodide detector assembly, materials, and sampling containers with different volumes, as shown in Figure 2. The dimensions of the sodium iodide crystal, thickness of reflective-layer magnesium oxide, and thickness of cladding aluminum were provided by the manufacturer, as shown in Table 1; the thickness of the stainless steel was physically measured using a Vernier caliper. The physical processes activated in the detector model of this work are: Compton scattering, pair production, photoelectric effect for photons, ionization processes, multiple scattering and Bremsstrahlung for electrons, and ionization processes, multiple scattering and annihilation for positrons. The 13N nuclei were uniformly and randomly generated in the sampling container. To ensure that the simulation was most similar to the experimental measurement, a useful signal was taken when the energy deposition of gamma ray in the NaI(TI) crystal exceeded 150 keV, and the coincidence only formed only when any two detectors simultaneously generated useful signals. Sampling numbers of 105, 106, 107, and 108 were used to test and ensure statistical uncertainties.
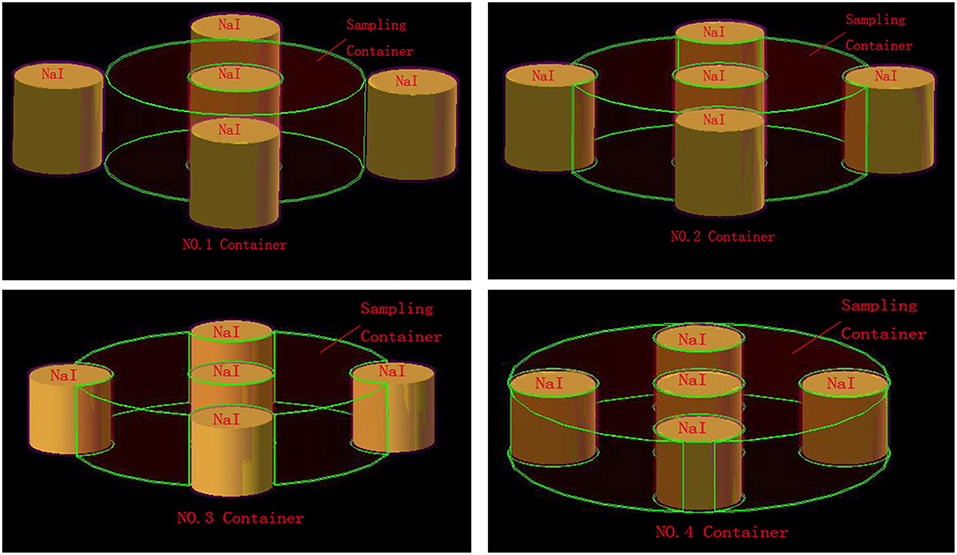
Figure 2. Simulated geometry with GEANT4.
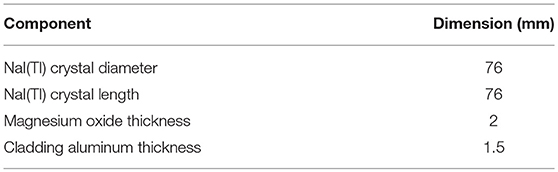
Table 1. Technical dimensions of detector provided by the manufacturer.
Experiment Measurement
Gaseous 13N Production
Gaseous 13N was produced with cyclotron protons (whose energy was 16.5 MeV) by bombarding deionized water in the target chamber. The bombardment lasted approximately 10 min. The produced 13N existed in the form of liquid 13N- and 13N-. After pressured by dense argon, they were delivered to a collection container with Devarda's alloy and NaOH. The collection container was also shielded by a lead chamber. After a few minutes, the produced 13N-NH3 in the collection container was transferred into a 5 ml vacuum bottle. The activity of 13N was measured using an activity meter CRC-25R produced by CAPINTEC.IN, and activity A0 was recorded. Furthermore, 13N-NH3 was pushed under the effect of CCl4 as a booster and sampling container for the following measurement of the coincidence efficiency, which will be later discussed. A detailed flow chart of the 13N production is shown in Figure 3.
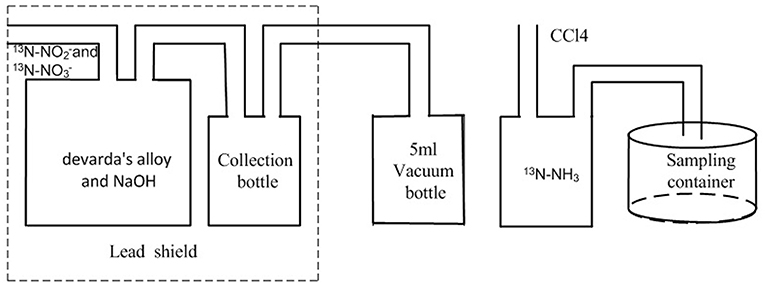
Figure 3. Flow chart of the 13N production.
Sampling Container and Measurement System
To verify the accuracy of the simulation detection efficiency, the detection efficiency of 13N was experimentally studied in the laboratory. Four arrangements of containers with the capacity of two liters were produced. All parameters are identical to those in the preliminary design, as discussed. The radii of four types of containers (NO.1–NO.4) were 100, 110, 120, and 130 ± 1.0 mm. The sampling containers and detector are shown in Figure 4. The measurement system consists of five Φ3” × 3”NaI(TI) detectors, which were purchased from Bei Jing ZhongGuang Detector CO.LTD CHINA, and a data acquisition system, which was purchased from Beijing Nuclear Instrument CO.LTD. The detector and sampling container are shown in Figure 4.
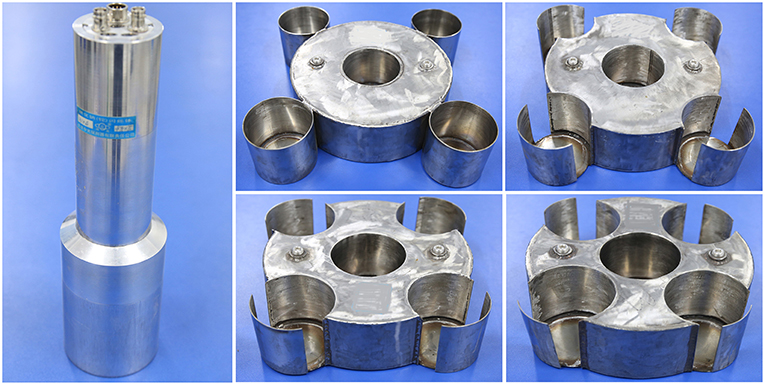
Figure 4. Detector and sampling container used in experiment.
Five Φ3” × 3”NaI(TI) detectors were installed into locations of the sampling container. The background of the coincidence detection system and coincidence efficiency were measured without the lead shield. In our experiments, the threshold of a single channel depends on the pulse amplitude of gamma rays of 0.511 MeV. The lower threshold of a single channel was set to 20% of the amplitude of the pulse, and the upper threshold was 120%. The input pulse width in the coincidence circuit was set to 0.5 μs, which satisfies the requirement of time resolution for the discussed coincidence measurement. According to the arrangement of five detectors and characteristic of the positron annihilations, we see that even if there is a radioactive source, it has very low probability to form true coincidence between detector 1 and detector 3 or between detector 2 and detector 4. To reduce the background of the coincidence system, these two types of coincidence events are considered negligible.
Results and Discussion
Data-Based Geant4 Simulation for the Efficiency
Due to the limitation of space in the containment, the sampling container volume of the primary loop leakage monitoring system is small, so the max radius of the container is only 16 cm in the simulation calculation. For different container radii, coincidence efficiency ε and ε•V are shown in Figures 5, 6. The coincidence efficiency decreases with the increase in container radius due to the decreased solid angle of the NaI(TI) detector. Unlike the coincidence efficiency, ε•V first increases and subsequently decreases with the container radius. Maximal coincidence efficiency and ε•V are obtained to be 11.55% and 0.103, respectively. According to the relationship between detection lower limit VLD and ε•V, we can find that when the fourth container radius is R = 130 mm, the detection limit is minimal in all simulated sampling containers, which is theoretically considered the optimal sampling container size.
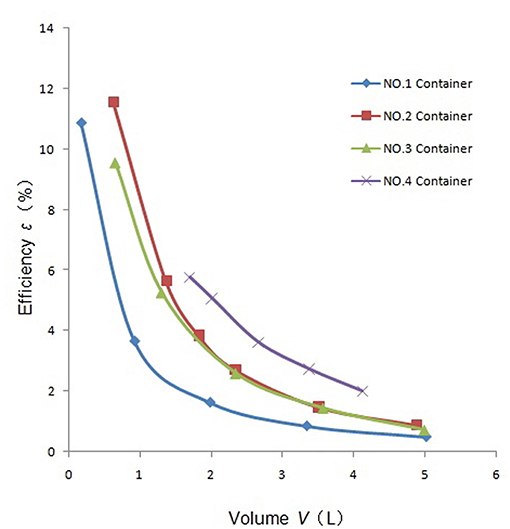
Figure 5. Coincidence efficiency vs. container volume (simulation results).
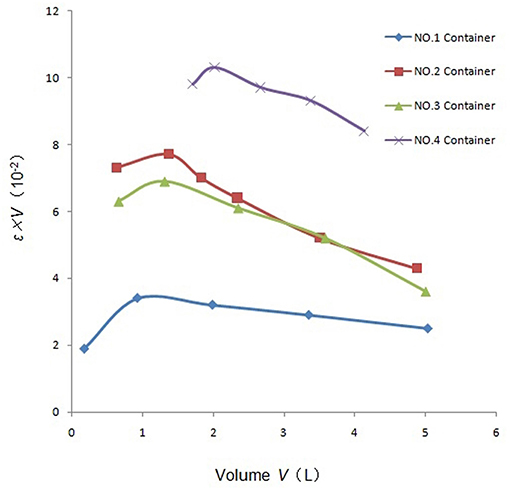
Figure 6. ε•V vs. container volume (simulation results).
Background of Single Detector and Coincidence System
The backgrounds of the single detector and coincidence detection system were measured without the lead shield within 10,000 s. The results for three repeated measurements and their average value are shown in Table 2. The coincidence measurement system rapidly suppresses the background count rate for a single detector to the order of 0.1 Hz, which is only 1/660 times of that from a single detector.
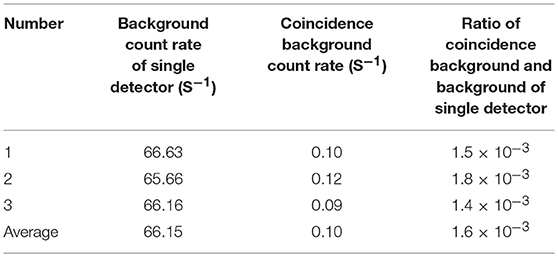
Table 2. Background results.
Coincidence Efficiency
Under the same condition of measuring the background coincidence, we performed the coincidence measurements. The measurement integral is selected as 300 s. For the short-lived 13N isotope, its activity visibly decreases during the measurements. Both numbers of decayed nuclei in the measurement period and true coincidence events should be considered to calculate the coincidence efficiency, which takes a form:
Here, n is the true coincidence events, λ is the decay constant, A0 is the activity of 13N at time t0, and t1 and t2 are the initial and end time of the coincidence measurement, respectively. The results for three repeated measurements, which correspond to three types of 13N activities are shown in Table 3. For different 13N activities, the coincidence efficiencies obtained with Equation (9) are consistent with one another within systematic and statistical uncertainties.
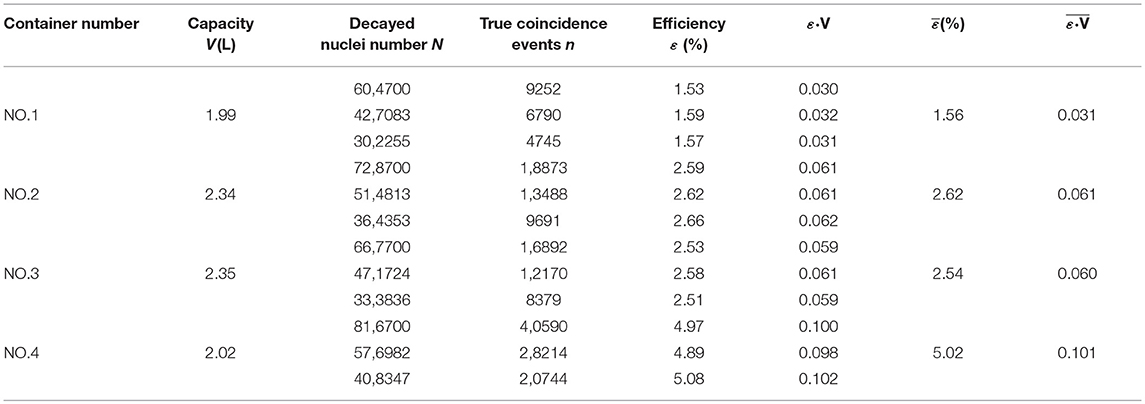
Table 3. Coincidence efficiency and ε•V for different arrangements of containers.
Coincidence efficiency ε and ε•V of the four containers are summarized in Table 4. The comparison between simulation and experimental results shows a slight discrepancy of ≤5%, which further validates the Geant4 predictions. This difference may be caused by the effect of 18F and 15O produced from the cyclotron accelerator, since these short-lived isotopes with tiny quantity are present in the liquid of 13N-and 13N- due to the lack of separation.
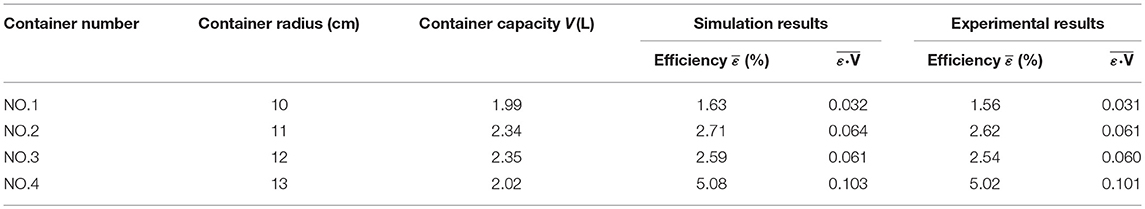
Table 4. Comparison of the simulated and measured results.
In our work, four arrangements of containers with the capacity of two liters were used in the experiment, and the results are in good agreement with simulation. However, due to the lack of experimental or theoretical verification, the results of other volumetric containers are uncertain. If the method was applied to engineering, further experiments are needed to verify the reliability of the results.
Conclusion
Based on the 13N decay characteristic, we proposed the gamma-gamma coincidence method to measure the concentration of 13N. This coincidence method can be applied to monitor the leakage of 13N from the primary loop of nuclear power plants. To improve the coincidence efficiency and ε•V value, four types of sampling and detection containers were designed. The coincidence efficiencies in four arrangements of sampling and detection containers were investigated through Geant4 simulations and experimental measurements. The results show that when the NO.4 sampling and detection container (five detectors in the container) has radius R = 130 mm, the coincidence detection system has a higher detection efficiency and maximum ε•V value for 13N. Thus, the NO.4 container of this size has optimal arrangement sampling and detection. This work was performed in the laboratory, and the effects of 18F and 15O produced by the accelerator were ignored in the experiment.
Author Contributions
YZ completed simulation, experiment research, and wrote the manuscript. G-PQ and J-LZ completed experiment research and revised the article.
Funding
This work was supported by the National Science Foundation of China under Grant No. 11175083.
Conflict of Interest Statement
The authors declare that the research was conducted in the absence of any commercial or financial relationships that could be construed as a potential conflict of interest.
References
Agostinelli, S., Allison, J., Amako, K., Apostolakis, J., Araujo, H., Arce, P., et al. (2003). Geant4-a simulation toolkit. Nucl. Inst. Methods Phys. Res. A 506, 250–303. doi: 10.1016/S0168-9002(03)01368-8
Ahmed, A. S., Capello, K., Chiang, A., Cardenas-Mendez, E., and Kramer, G. H. (2009). Optimization of geometric parameters for Marinelli beaker to maximize the detection efficiency of an HPGe detector. Nucl. Inst. Methods Phys. Res. A 610, 718–723. doi: 10.1016/j.nima.2009.09.020
Antovic, N., and Svrkota, N. (2009). Measuring the radium-226 activity using a multidetector γ-ray coincidence spectrometer. J. Environ. Radioact. 100, 823–830. doi: 10.1016/j.jenvrad.2009.06.003
Aoki, K. (1991).Reactor coolant pressure boundary leak detection systems in Japanese PWR plants. Nucl. Eng. Des. 128, 35–42. doi: 10.1016/0029-5493(91)90247-F
D'Auria, F., Debrecin, N., and Glaeser, H. (2017). Strengthening nuclear reactor safety and analysis. Nucl. Eng. Design 324, 209–219. doi: 10.1016/j.nucengdes.2017.09.008
Dissing, E., and Svansson, L. (1980). Reactor coolant pressure boundary leakage system. IEEE Trans. Nucl. Sci. 27, 769–775. doi: 10.1109/TNS.1980.4330925
Ember, P. P., Belgya, T., Weil, J. L., and Molnár, G. L. (2004). A practical test of a γ-γ coincidence measurement setup for PGAA. Nucl. Instr. Methods Phys. Res. Sect. B 213, 406–409. doi: 10.1016/S0168-583X(03)01663-X
Erbeszkorn, L., Szörényi, A., and Vágvölgyi, J. (1996). Certified reference gas of 85kr in a Marinelli beaker for calibrations of gamma-ray spectrometers. Nucl. Inst. Methods Phys. Res. A 369, 463–466. doi: 10.1016/S0168-9002(96)80031-3
Knoll, G. F. (2000). Radiation Detection and Measurement, 3rd Edn. New York, NY: John Wiley and Sons Inc., 94–96.
Tillett, A., Dermigny, J., Emamian, M., Tonin, Y., Bucay, I., and Smith, R. L. (2017). A low-background γγ-coincidence spectrometer for radioisotope studies. Nucl. Inst. Methods Phys. Res. A 871, 66–71. doi: 10.1016/j.nima.2017.07.057
Vidmar, T., Korun, M., and Vodenik, B. (2007). A method for calculation of true coincidence summing correction factors for extended sources. Appl. Radiat. Isolat. 65, 243–246. doi: 10.1016/j.apradiso.2006.07.012
Volkovitsky, P., and Naudus, P. (2009).Absolute 60 Co characterization based on gamma-gamma coincident detection by two NaI(Tl) detectors. Nucl. Instr. Methods Phys. Res. Sect. A 607, 568–572. doi: 10.1016/j.nima.2009.06.002
Zhang, W., Lam, K., and Ungar, K. (2018). The development of a digital gamma-gamma coincidence/anticoincidence spectrometer and its applications to monitor low-level atmospheric 22Na/7Be activity ratios in Resolute Bay, Canada. J. Environ. Radioactiv. 192, 434–439. doi: 10.1016/j.jenvrad.2018.07.022
Keywords: N-13, coincidence method, sampling container, coincidence efficiency, simulation, Geant4
Citation: Zhao Y, Qu G-P and Zhou J-L (2019) Design of the Container for the Sampling and Detection Monitoring System of N-13 in Pressurized Water Reactor Primary Loop Water Leakage Based on the Coincidence Method. Front. Energy Res. 7:67. doi: 10.3389/fenrg.2019.00067
Received: 28 December 2018; Accepted: 08 July 2019;
Published: 07 August 2019.
Edited by:
Muhammad Zubair, University of Sharjah, United Arab EmiratesReviewed by:
Ivo Kljenak, Jožef Stefan Institute (IJS), SloveniaMing Tang, Los Alamos National Laboratory (DOE), United States
Copyright © 2019 Zhao, Qu and Zhou. This is an open-access article distributed under the terms of the Creative Commons Attribution License (CC BY). The use, distribution or reproduction in other forums is permitted, provided the original author(s) and the copyright owner(s) are credited and that the original publication in this journal is cited, in accordance with accepted academic practice. No use, distribution or reproduction is permitted which does not comply with these terms.
*Correspondence: Yue Zhao, NDMwMDAwMDg5Mzc3QHVzYy5lZHUuY24=