 Zach McCaffrey1*
 Peter Thy2
 Michael Long3Melina Oliveira4Li Wang3Lennard Torres1Turkan Aktas5Bor-Sen Chiou1William Orts1Bryan M. Jenkins3
- 1US Department of Agriculture, Agricultural Research Service, Albany, CA, United States
- 2Department of Earth and Planetary Sciences, University of California, Davis, Davis, CA, United States
- 3Department of Biological and Agricultural Engineering, University of California, Davis, Davis, CA, United States
- 4Biocombustível e Ensaio de Máquina, Instituto de Bioenergia-IPBEN, Universidade Estadual Paulista-Unesp, Jaboticabal, Brazil
- 5Department of Biosystems Engineering, Namik Kemal University, Tekirdag, Turkey
Experiments were performed on a laboratory scale fluidized bed gasifier to characterize the gasification products of almond shell and hull removed in nut processing operations and to determine the effect of gasifying media on bed agglomeration. The higher heating value of syngas during air gasification of almond biomass ranged from 4 to 6 MJ m−3 while gas concentrations ranged from 14 to 18% H2, 3–4% CH4, 43–50% N2, 16–19% CO, and 16–17% CO2. For steam gasification, higher heating value was 10–12 MJ m−3 and gas concentrations were 35–40% H2, 5–7% CH4, 17–21% N2, 18–21% CO, and 16–18% CO2. The high level of potassium in the almond shells led to strong corrosion and bed agglomeration due to flue gas transport of potassium compounds. These resulting pervasive kalsilite reactions were significantly worse under air gasification than under steam gasification. As a result of prolonged duration and elevated temperature approaching 1,000°C, the corrosinal reaction changes to formation of an adhesive potassium distillate melt locally forming strong bonds. This latter is interpreted as a result of aerosol transported of melt particles.
Introduction
Almond processing residues constitute a significant resource for small to medium scale integrated power generation systems in California and elsewhere around the world. These systems can help meet process energy needs and reduce lifecycle carbon impacts of almond production. Gasification for combined heat and power generation is one approach for integrating clean power technologies into processing facilities.
The Central Valley of California is one of the most productive agricultural regions in the world with an almond production in 2018 of 5.6 billion dollars in value (Almond Board of California, 2018). With ~6,800 growers, California produces 80% of the world's almonds and effectively all the U.S. commercial supply (Almond Board of California, 2018). Also, almond growers handled over 8 billion pounds of almond fruit, resulting in 2.3 billion pounds of nuts, 4.5 billion pounds of hull, and 1.6 billion pounds of shell. In 2013, almond hull and hull and shell blends were sold for 311 million dollars, primarily as animal feed (Almond Hullers and Processors Association (AHPA), 2014). Other uses included livestock bedding material and fuel for boilers and power generation. Interest has increased in using almond by-products at higher efficiency or in more local cogeneration energy facilities (e.g., at huller and/or sheller facilities) to support state level renewable portfolio standards and to reduce greenhouse gas emissions from fossil fuel-based combustion1. The almond industry is also interested in new uses as prices for animal feeds have declined in recent years with reductions in the number of animals in the state due to changes in dairy product pricing and the availability of alternative feeds.
Previous research appears to be lacking in thermal conversion of mixed and individual types of almond residue generated by the processing facilities. According to Chen et al. (2010), most almond by-product research has focused on extraction and use of antioxidants and production of activated carbon, with only a small fraction of articles related to thermochemical conversion of almond residues. However, a recent life-cycle analysis of almond orchards shows that co-products used for power generation can reduce the net energy use of almonds by 17% and CO2-equivalent emissions by 43% (Kendall et al., 2015). The present research aims to investigate better utilization of almond residues for the purpose of energy production and increased sustainability.
Gasification is a thermochemical process in which solid biomass feedstock is converted to a combustible gas mixture that can either be used directly for heat and power applications or applied as a chemical feedstock (synthesis gas) for various fuel and chemical syntheses. Gas yield and quality are of primary concern in evaluating the value of the gasification of a feedstock. These may vary with type and moisture content of feedstock, type of gasifier, and gasification conditions. Gasification of almond residues has been the subject of a few research studies (Font et al., 1988, 1994; Caballero et al., 1996; Rapagnà and Latif, 1997; González et al., 2006; Tong et al., 2007; Timmer, 2008; Aktas et al., 2015). These studies had different feedstock types and characteristics, moisture contents, particle sizes, gasification method, gasification media, and gasification conditions, making comparisons between them complicated.
González et al. (2006) investigated the effects of air flow (50–400 cm3 min−1, equivalence ratio (ER) of 0.06–0.48), and reactor temperature (650–800°C) on syngas production from gasification of almond shells, hulls, and tree pruning for electricity generation using a bench-scale fixed-bed gasifier (10 g of feedstock per trial). Over the set of conditions tested, maximum heating value of the product gas was observed with air-flow rate of 200 cm3 min−1, ER = 0.24, and reactor temperature of 800°C. At these operating conditions, the average molar fractions of the fuel components were 2.9% O2, 52.2% N2, 13.3% H2, 14.3% CO, 11.3% CO2, 4.8% CH4, and 1.2% of C2H2, C2H4, and C2H6. The higher heating values (HHV) of the product gas at these conditions were 5.8, 6.5, and 6.4 MJ Nm−3 for almond hull, shell, and tree prunings, respectively. Typically, oxygen should not be present in the product gas from gasification and perhaps its presence indicates an issue with the process or the measurement.
Rapagnà and Latif (1997) performed steam gasification of ground almond shells using a bench-scale fluidized-bed reactor to evaluate the effects of particle size (287 μm−1.09 mm) and operating temperature (from 600 to 800°C) on the product gas yield and composition. The results showed that for smaller particle sizes, differences in product yield, and gas composition practically disappeared at the higher temperature trials. In comparison, for particles above 1 mm in diameter, the gas yield increased over the entire temperature range, without reaching that attained by the smaller particle systems. Maximum gas yield was 1.5 m3 kg−1 with composition of 49% H2, 27% CO, 18% CO2, and 7% CH4.
In fluidized bed gasification, conversion of feedstock is carried out in fluidized bed reactors typically with silicate sand as bed material and ash or char particles derived from the biomass feedstock. Inorganic alkali components from the ash, mainly potassium, can be problematic as they might form low temperature alkali compounds that may react with the bed material forming alkali silicates. Low temperature alkali reaction products can then coat the sand particles of the bed material and bond particles together. Formation of agglomerates widens particle size distribution of the bed material, which can result in segregation inside the bed, uneven temperature distribution, and eventually lead to partial or complete de-fluidization of the reactor bed (Visser et al., 2008; Montes et al., 2016).
Examples of agglomeration tendencies using dolomite, magnesite, and silica bed materials in a pressurized bubbling fluidized bed gasifier using pine pellets and birch chips as feedstock are reported in Zhou et al. (2016). At bed temperatures around 870°C, silica sand had the most severe agglomeration, magnesite exhibited high agglomeration, and dolomite exhibited no observable agglomeration. Magnesite bed particles were shown to be glued together by ash particles. For dolomite, the authors concluded that the decrease in agglomeration was not attributed to the formation of alkali-containing compounds, but to the reaction between dolomite and silica (Zhou et al., 2016).
The objective of this research was to investigate the potential effects of air and steam gasification on gas composition and fluidized bed agglomeration using a composite of almond shell and hull obtained from different locations in California (Aktas et al., 2015).
Materials and Methods
Gasification experiments were performed on the almond residue feedstock from Butte (S2), Stanislaus (S4), Fresno (S5), and Kern (S7) counties discussed by Aktas et al. (2015).
The results for proximate, ultimate, and calorimetric analyses of these feedstock and the results for ultimate analyses of the ash samples are shown in Table 1. Refer to Aktas et al. (2015) for a thorough discussion of the feedstock composition.
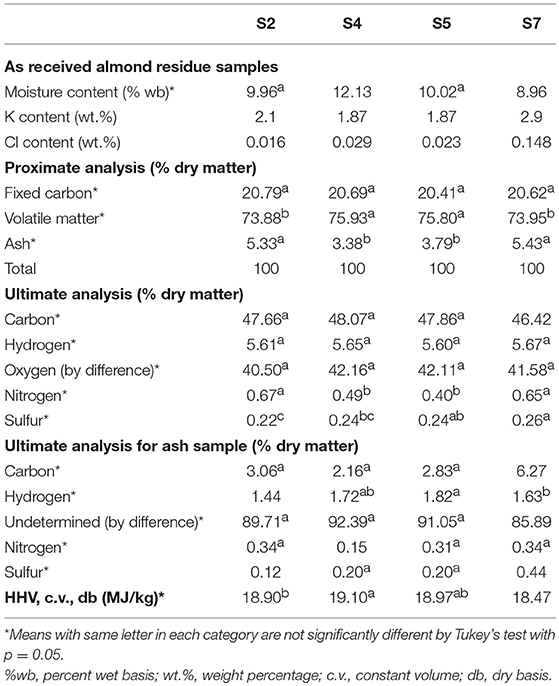
Table 1. Proximate, ultimate, and calorimetric analyses for almond residue samples (Aktas et al., 2015).
Experimental Setup
The main components of the UC Davis Biomass Laboratory gasifier reactor and purification system consist of an atmospheric fluidized bed gasifier, cyclone, ceramic filters, and packed-bed wet scrubber (Figure 1). The fluidized bed gasifier is a reactor that mixes solid bed material, biomass, and oxidizing agent at high temperature to produce gaseous products, condensables, ash, and char. The cyclone and filters were designed to remove solid particles from the product gas stream and the packed bed wet scrubber was used to reduce tar concentration in the product gas. After sampling, the product gas was discharged through a thermal oxidizer (not shown) where it was burned for safe atmospheric venting.
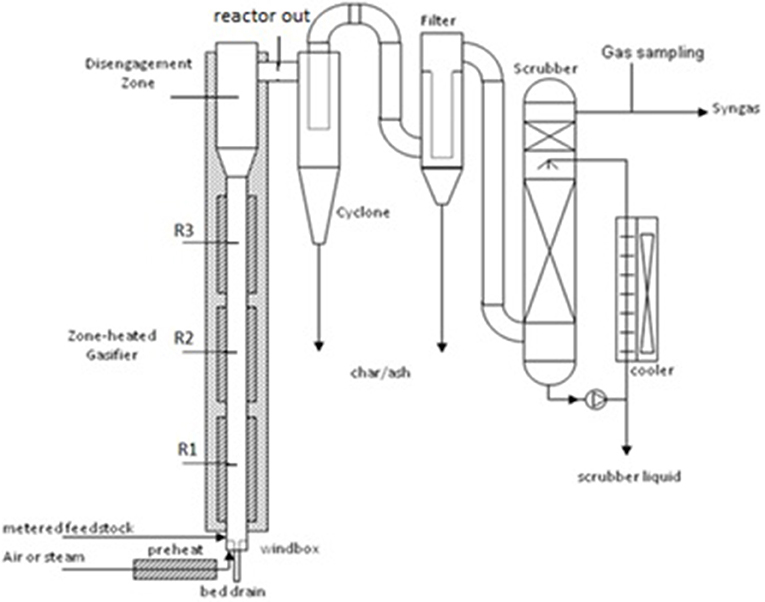
Figure 1. Schematic illustration of laboratory reactor with thermocouple locations for R1, R2, R3, disengagement zone, and reactor outlet.
The gasifier reactor was designed at UC Davis as a near atmospheric pressure, bubbling fluidized bed with external electric heaters for vertical zone-heating along the reactor length. During operation, hot air and/or steam was injected through the bubble-cap distributor system at the base of the reactor to fluidize the bed. Air was preheated to 350°C prior to injection into the windbox. The fluidized bed gasifier was preheated to 750°C for air trials and 950°C for steam trials. Cyclone and filter systems were preheated to 400°C. A granular, alumina-silicate ceramic (mullite) sand, was used as the bed material (Investocast 60, North American Refractories Company (NARCO), Pleasanton, California; product is no longer available).
The primary reactor diameter is 96 mm, expanding to 197 mm diameter in the disengagement zone. The overall height is 3 m. The reactor was heated using three 4.6 kW circumferential external electric heaters that are individually temperature controlled. Temperature and pressure access ports were spaced vertically along the gasifier with access ports at the top of the gasifier. This allowed thermocouples, pressure taps, gas sampling, and other sampling equipment to be inserted at any depth.
A cyclone was used as a pre-cleaner for removal of large particles. The cyclone had a cut diameter of about 20 μm under operating conditions. The cyclone has following dimensions: 2.5 inch inlet diameter, 2.0 inch outlet diameter, and total height of 20 inches. A filtering unit was used to separate fine particles from the gas stream and consisted of four filter elements (Glosfume Ltd., 5-micron porosity, 1,000 mm length) with a back-pulse system for dislodging filter cake. Temperature of the cyclone, filter housing, and connecting pipes were held at 400°C using external heat tape, proportional-integral-derivative (PID) controller, and insulation.
Startup procedure consisted of pre-heating the reactor and cyclone to set temperatures before starting the biomass feeder. Data were analyzed from 10 min after the biomass feeder was started to feeder shutoff.
Methodology
Input streams to the gasification system were: fluidization media (i.e., air or steam), almond feedstock, and nitrogen gas for the pneumatic feeder, cyclone back pulse, and scrubber purge. For air trials, biomass feed and air rates were set to an equivalence ratio of 4.0. ER is defined as the ratio of the actual fuel-to-air ratio to the stoichiometric fuel-to-air ratio. Steam flow rates for steam fluidization trials were set to 4.4 kg/h to maintain a similar superficial velocity compared to the air fluidization trials. Biomass feed rates for steam fluidization trials were set at a steam to biomass ratio of 1.0. Biomass feedstock was metered (2 mm particle size, 90 g min−1, equivalence ratio of 4.0) and injected using a nitrogen-blown pneumatic feeder just above the distributor plate.
Output streams from the gasifier were: fluidized bed solids, cyclone catch solids, filter catch solids, windbox condensate, scrubber liquid gain, and syngas. With each experiment, following cooldown of the gasification equipment, solid and liquid output streams were collected and weighed for analysis. Proximate analysis and calorimetry was performed on the solid products. Petrographic and compositional analyses were performed on unused and spent bed material, as well as agglomerated samples from the bed which were recovered from the bed by dropping the windbox and carefully removing the bed solids after the reactor cooled following each experiment.
Proximate Analysis
Proximate analyses of bed material, cyclone catch, and filter catch were performed following ASTM D1762-84. Ash was determined as the residue after heating to constant weight at 750°C. The collected particulate matter from the cyclone and the filter catch contains carbon and ash among other constituents. The carbon content was estimated as the non-ash fraction, although this is known to overestimate the concentration (Aktas et al., 2015). The total mass of carbon leaving the reactor was estimated as the sum of the mass of carbon in the form of coarse particulate matter captured in the cyclone catch, the carbon in the form of fine particulate matter caught by the filters, the carbon in product gas, and the carbon in tar. Carbon holdup in the bed was determined by draining the bed and ashing a subsample of the residual bed material. This information was used for evaluating the carbon balance.
Thermogravimetric Analysis
Thermogravimetric analysis of almond shell feedstock [sample S3 of Aktas et al. (2015)] was performed using a PerkinElmer Diamond TG/DTA Analyzer (PerkinElmer, Waltham, MA). Experiments were done in an open alumina container using a ramp rate of 10°C min−1 in argon carrier gas to 750°C after which the carrier gas was shifted to air to oxidize the residual sample.
Gas Analysis
Gas composition was analyzed using an online mass spectrometer (Ametek, Proline Process Mass Spectrometer, Newark, DE). Sample gases were first chilled to below 5°C and filtered using fiberglass wool and paper filters (Whatman, grade 1) to remove condensates, and then reheated back to 25°C prior to analysis. The gas analysis instrument was calibrated with following binary mixtures: CO-Ar, CH4-Ar, and CO2-Ar, and a pre-mixed bottled analytical grade calibration gas (H2, CO, CO2, N2, CH4). Oxygen was measured using a Panametrics (now GE, Boston, MA) XMO2 Thermo Paramagnetic Oxygen transmitter that was calibrated prior to each run and consistently measured zero O2 during all reported gasification trials.
Calorimetry
An oxygen bomb calorimeter (IKA C 5001) was used to measure the higher heating value at constant volume (HHV) of gasification output streams. For each trial, 1.0 g of sample was loaded into a crucible, cotton twist was secured between sample and ignition wire, and the sample apparatus was sealed within the bomb canister along with 1 mL of water to saturate the internal atmosphere. Tests were performed using isoperibolic mode at 25°C according to ASTM D5865-11. Bomb washings were titrated with Na2CO3 and methyl red indicator, and corrections applied. The instrument was calibrated with benzoic acid (26.454 ± 0.250 MJ/kg).
Scanning Electron Microscope
A CAMECA SX-100 electron microscope was used for detailed petrographic and compositional analyses. The experimental bed product was mounted in epoxy, sectioned, and surface polished to allow microscopic examination. Back-scattered electron images (BSE) were obtained using a voltage of 15 kV and a beam current of 10 nA.
Results and Discussion
Temperature Profiles
Collected temperature profiles were consistent between trials. Temperature profiles from one of the air gasification trials are typical of the air gasification runs (Figure 4). Gas temperatures in the lower and the middle zones of the reactor closely follow the heater set point temperatures. The upper main reactor shows a lag of 20–40°C below heater set points, which is indicative of the expanded bed height being below this level. Most runs required one or two back pulses on the filters to maintain pressure drop within the desired range and to avoid plugging the filters. All runs show some instability in the biomass inlet temperature over time. This is believed to be caused by reactor loading due to agglomeration and char holdup in the bed.
Figure 5 shows a sample temperature-time profile from the steam gasification runs. Due to the presence of steam, gas temperatures in the main reactor never reach the set point wall temperature of 950°C. This might be attributed to the endothermicity of the gasification conditions, particularly the water-gas shift reaction. In contrast to the air gasification runs, which had higher temperatures at the base of the reactor due to the level of oxidation occurring, the steam trials clearly show a lower gas temperature at the base of the reactor.
Feedstock
The very high K content in the feedstock suggests potential difficulties with gasification without feedstock pretreatment (e.g., leaching) due to fouling and corrosion of reactor and heat exchange surfaces as well as agglomeration of bed media in fluidized beds. A highly K-charged gas may result in corrosion of silicate bed sand, partial melting or reactions, and agglomeration in the fluidized bed. The relatively low Cl content (<0.05 wt.%) for S2, S4, and S5 might lead to aerosol reactions and the deposition of potassium hydroxide and carbonate on boiler walls and heat exchangers rather than the formation of a KCl salt.
A typical decomposition profile is shown in Figure 2 with the main decomposition at ~200–450°C and char content (or fixed carbon) at 20% and a final oxidized ash content of 4.4%. In general, higher concentration of fines in the composite samples will likely have a negative effect on the feedstock quality due to low organic and high soil contents. Higher ash content increases the potential for slagging and fouling. High chlorine and potassium contents are also indicators of potential slagging. The fusibility analysis shows that ash melting occurred at 900°C for all four sources and began at 800°C for S4 and S7 (Aktas et al., 2015). This suggests that careful control of reactor temperature is needed to control agglomeration and ash deposition.
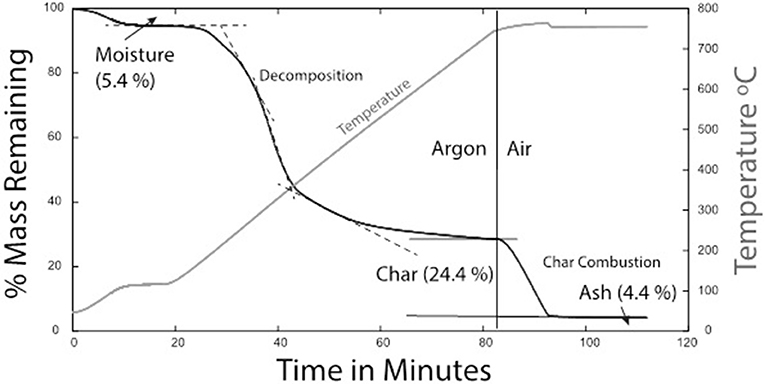
Figure 2. Thermogravimetric analysis of almond shell feedstock [sample S3 of Aktas et al. (2015)]. Experiment done in an open alumina container using a principal ramp rate of 10oC min−1 and argon carrier gas to 750oC followed by air.
Product Gas Composition
Table 2 shows the gas compositions of syngas during the air and steam gasification experiments. Small statistical differences between sample types S2, S4, S5, and S7 are likely due to small differences in operating conditions and feedstock compositions. Experimental data were submitted to analysis of variance for a significance level of 5% (P = 0.05) using Tukey's multiple comparisons test to estimate statistical differences. Means with the same letter among gas species are not significantly different. For S2, S4, S5, and S7 feedstock used during the gasification experiments, average hydrogen (H2) concentration ranged from 14.3 to 17.2% using air and 36.2 to 39.6% using steam, average methane (CH4) concentration ranged from 3.0 to 3.6% using air and 5.4 to 6.7% using steam, average nitrogen (N2) concentration ranged from 43.0 to 49.2% using air and 17.4 to 20.3% using steam, carbon monoxide (CO) ranged from 16.4 to 19.0% using air and 18.6 to 21.1% using steam, and carbon dioxide (CO2) ranged from 16.7 to 17.4% using air and 15.9 to 18.1% using steam.
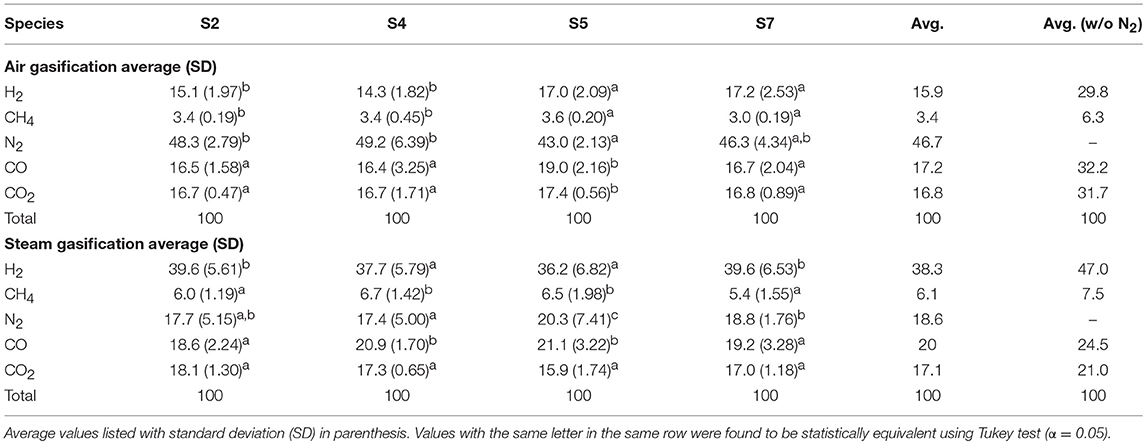
Table 2. Syngas composition analyzed by online mass spectrometry (OL-MS) for air and steam gasification experiments of the four almond feedstocks.
In comparison, the fluidization media had more significant effects on gas compositions than feedstock. For instance, comparing the nitrogen free averages across all feedstock, H2 increases from 29.8% for air gasification to 47.0% for steam, CH4 increases from 6.3% for air to 7.5% for steam, CO decreases from 32.2% for air to 24.5% for steam, and CO2 decreases from 31.7% air to 21.0% for steam gasification. Note the steam gasification experiments still have a significant nitrogen concentration mainly due to the nitrogen pneumatic feeder (0.02 m3/min) and small purge flows, however on a larger scale gasification system the purge gas would have a smaller effect.
In a study by Gil et al. (1999), air and steam gasification for pine wood feedstock was compared and resulted in similar gas composition to the present study: 8–10% H2, 2–6% CH4, 42–62% N2, 16–18% CO, and 9–19% CO2 for air gasification, 53–54% H2, 7–12% CH4, trace amounts of N2, 21–22% CO, and 13–17% CO2.
Proximate Analyses of Char and Ash
Table 3 summarizes proximate analysis results of materials from the bed, cyclone, and filter according to the fluidizing gas used (air or steam). For both air and steam gasification, the moisture contents of the cyclone and filter catches were ~3–4% and the contents for the bed material were 1–2%, likely gained during storage conditions as the cyclone and filter housing were maintained at 400°C during the experiments. Volatile matter of the cyclone catch, filter catch, and bed material for air gasification were slightly higher than those for steam gasification. Ash contents of the cyclone catch and filter catch have high variability as indicated by the standard deviations, which were likely due to samples containing varying proportions of dense, low-ash bed material. Bed material had the highest ash content of the three by-products in both steam and air gasification, at about 85%. Fixed carbon was calculated by difference. No significant differences were observed between the feedstock (S2, S4, S5, and S7).
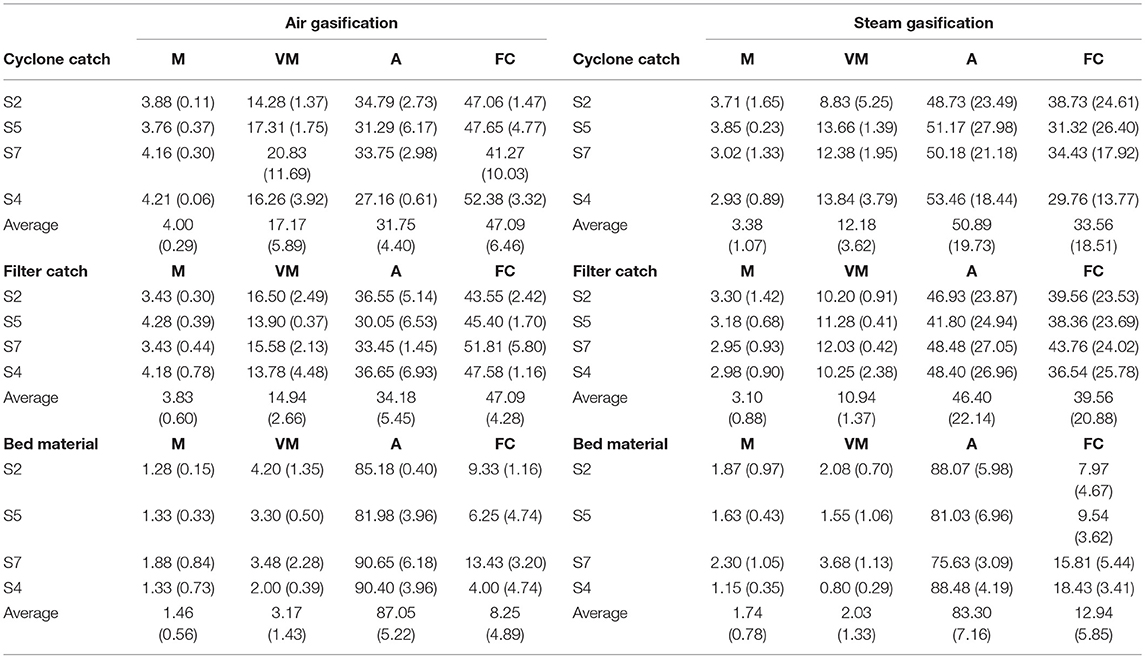
Table 3. Proximate analysis [moisture (M), volatile matter (VM), ash (A), and fixed carbon (FC)] of the cyclone catch, filter catch, and bed material for the air gasification (left) and steam gasification (right) experiments.
Calorimetry
Table 4 shows the higher heating value (HHV, MJ kg−1) of the filter and cyclone catch. The high ash content of the spent bed material precluded ignition within the calorimeter and values were not obtained for these samples. For air gasification, cyclone and filter samples had equal HHV. For steam gasification, the filter catch sample had higher heating values than cyclone catch, which was likely due to higher fine char loading in the filter and higher bed fines collected in the cyclone.
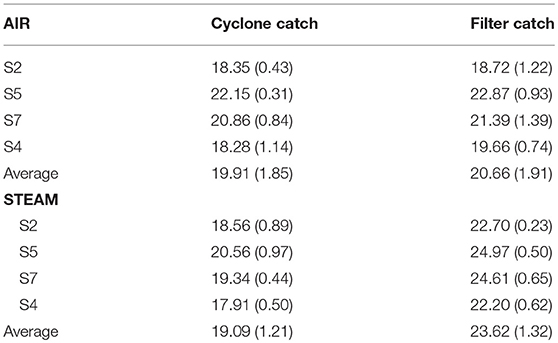
Table 4. Higher heating value at constant volume (HHV) of cyclone (ACC) and filter catch (AFC) materials in MJ kg−1 (standard deviations from duplicate runs in parentheses).
Mass Balance
All material entering or leaving the reactor system was measured to complete the mass balance. System inputs include: almond byproduct feedstock and feedstock moisture, fluidization agent, bed material, and nitrogen purge (N2 in). System outputs include unused feedstock, recovered bed, windbox condensate, cyclone catch, filter catch, dry gas meter condensate (DGM), scrubber gains, and gas output. Mass of gas output was estimated by nitrogen balance using measurements of nitrogen flows, air fluidization (for air gasification), and measurement of gas output composition. The following equation accounts for the major sources of mass into or out of the system:
Tables 5, 6 tabulate the results of each balance for all trials. The inputs with the largest mass are the feedstock and fluidization media (steam or air), and the output with largest mass is the syngas. The largest uncertainty is the calculation of syngas mass which is computed by nitrogen balance: sum of nitrogen flows for fluidization (for air gasification), pneumatic feeder, and purge flows as inputs to the system, and nitrogen composition of the syngas measured by mass spectrometry as the output of the system. With a few exceptions, the balances close within ~10%.
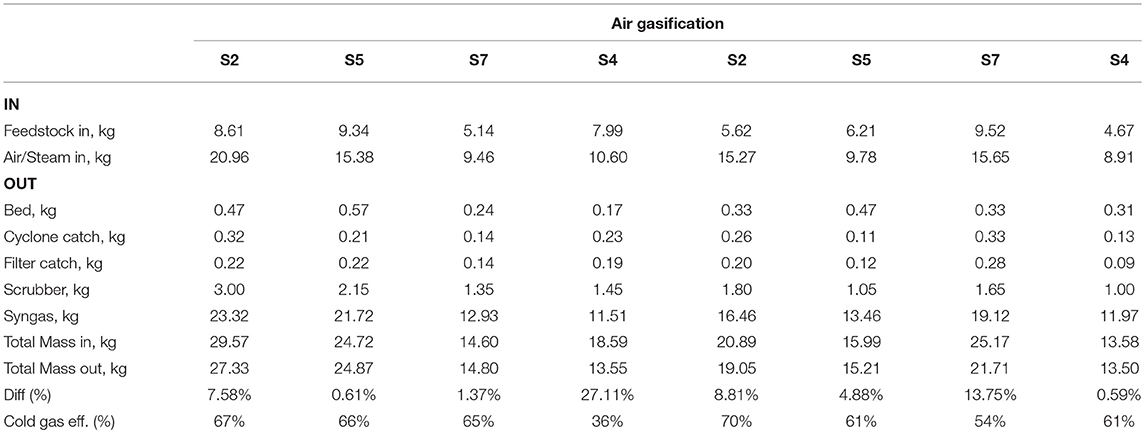
Table 5. Mass balances (kg) for air gasification.
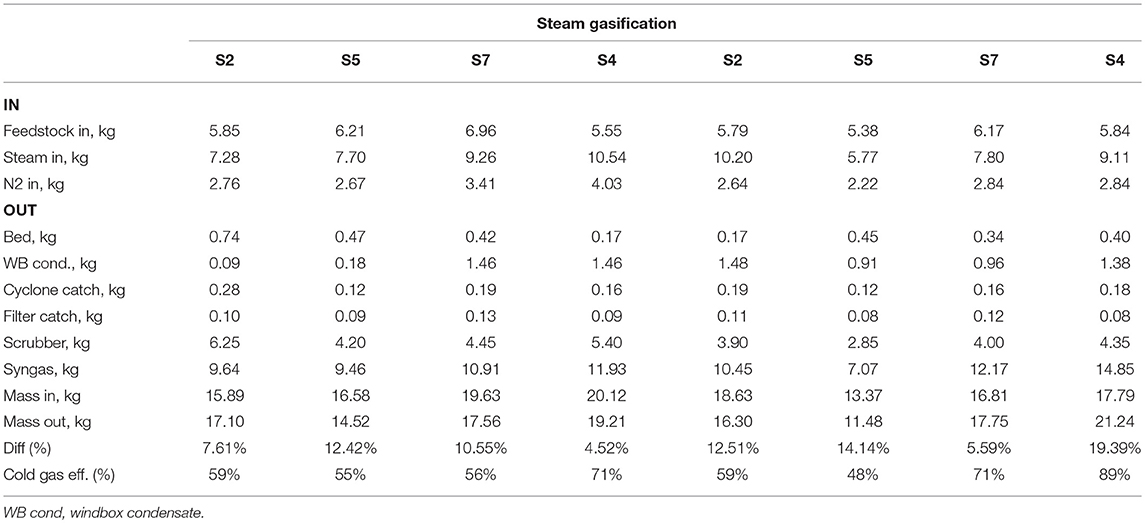
Table 6. Mass balances (kg) for steam gasification.
Cold gas efficiency was computed using following formula (Adnan et al., 2017):
where, ηCG is the cold gas efficiency (%), HHVsyngas is higher heating value of syngas (MJ kg−1, dry basis), ṁsyngas is mass flow of syngas (kg h−1), HHVfuels is higher heating value of biomass fuel (MJ kg−1, dry basis), ṁfuel is mass flow of fuel (kg h−1), Hsensible is energy to heat air or steam (MJ h−1), and ṁfluid is mass flow of air or steam (kg h−1). Tables 5, 6 show cold gas efficiency for air and steam gasification experiments. Cold gas efficiency ranged from 36 to 70%, and 48 to 89% for air and steam gasification experiments, respectively. These efficiencies are not entirely representative of what commercial scale equipment might achieve as they include external energy inputs that would largely be absent or otherwise internalized in commercial application. They also reflect uncertainties in the determinations principally of product gas flowrates that rely on elemental balances across the reactor and its downstream components. They are useful here, however, to reflect the intrinsic differences in the gas quality between the two fluidizing atmospheres.
Agglomeration
The bed material is composed of sand-sized (0.1–2 mm), irregular and angular shaped particles made up of mainly mullite with minor amounts of cristobalite (Investocast #60). Agglomeration was variably observed in the bed material and along the walls (see Figure 3). For the air gasification experiments, the temperature difference between the two sampling locations was small (~30°C), with the exit temperature lower than the entrance temperature (Figure 4). For the steam gasification runs, the temperature differences were significantly higher, amounting to ~100°C and with the temperature being higher at the exit than at the entrance in contrast to air gasification (Figure 5). Typically air gasification resulted in agglomeration in the bed material while steam gasification resulted deposition on the walls of the gasifier (Table 7).
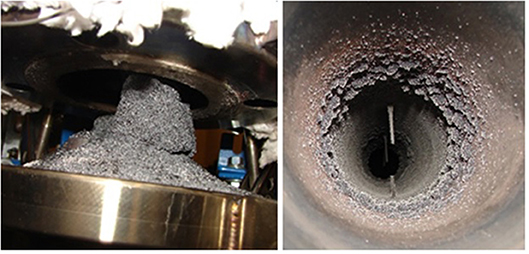
Figure 3. Almond biomass agglomerations. Air fluidization typically resulted in bed material agglomeration (Left), while steam fluidization typically resulted in wall deposition within the gasifier (Right).
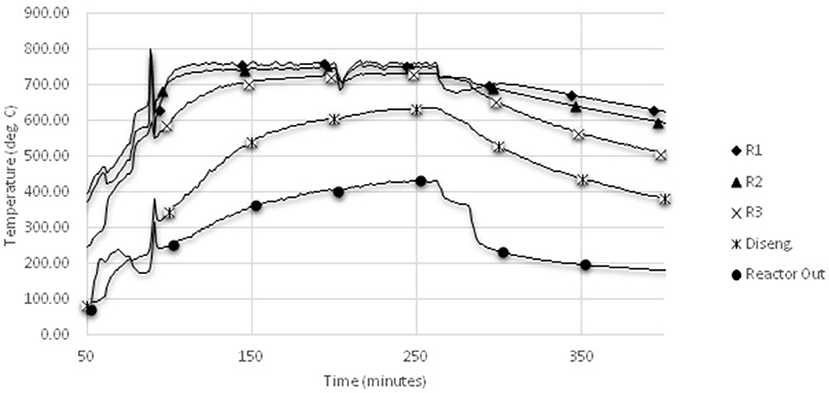
Figure 4. Sample temperature-time profile from air gasification. Locations of thermocouples R1, R2, R3, disengagement zone, and reactor out locations are shown in Figure 1.
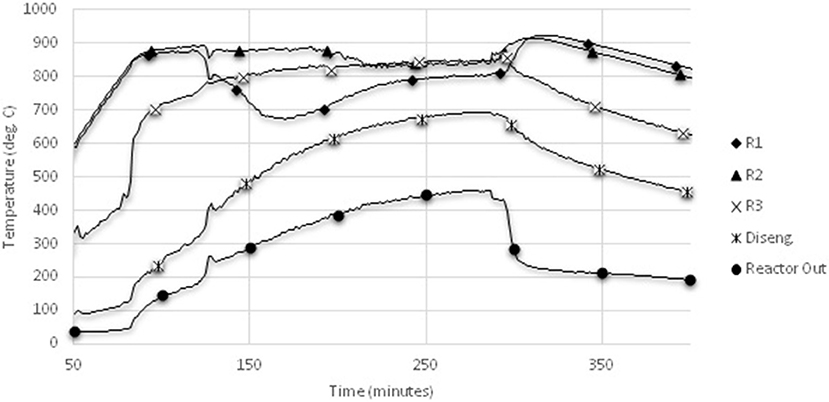
Figure 5. Sample temperature-time profile from steam gasification. Locations of thermocouples R1, R2, R3, disengagement zone, and reactor out locations are shown in Figure 1.
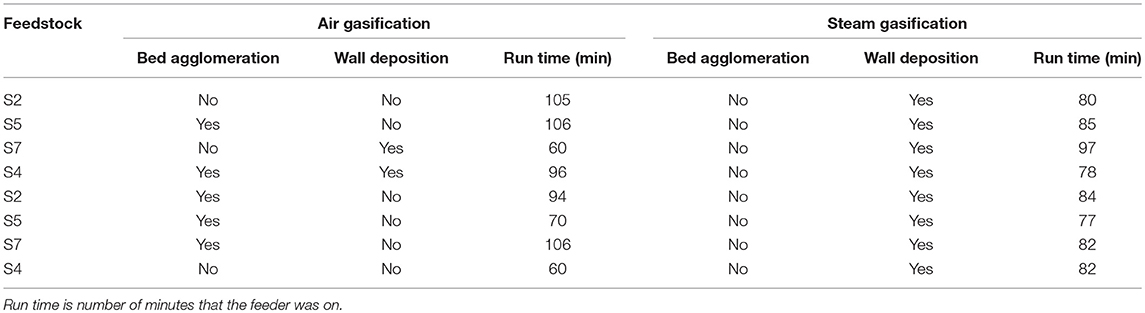
Table 7. Observation of bed agglomeration and wall deposition for air and steam experiments of the four almond feedstocks.
A typical example of an agglomerated cluster of mullite grains is shown in Figure 6 as a transmitted light microscope image and a similar cluster in Figure 7 as a back-scattered mean-atomic density map. The bed particles were pervasively altered along margins and fractures to a depth of about 50 microns for typical 60–100 min experiment. The alteration zone is composed of a mixture of mullite (3Al2O3.2SiO2) and what approximates kalsilite (K2O.Al2O3.2SiO2), where the latter is a reaction product between mullite and a K-rich flue gas, and the remaining mullite is unreacted. The dominating agglomeration concentrated at the base of the furnace is thus a result of kalsilite bonding that, although easily observed in the furnace, is very difficult to preserve in mounts and thus to analyze image with the SEM because of a highly friable bonding that easily disintegrates by handling and mounting.
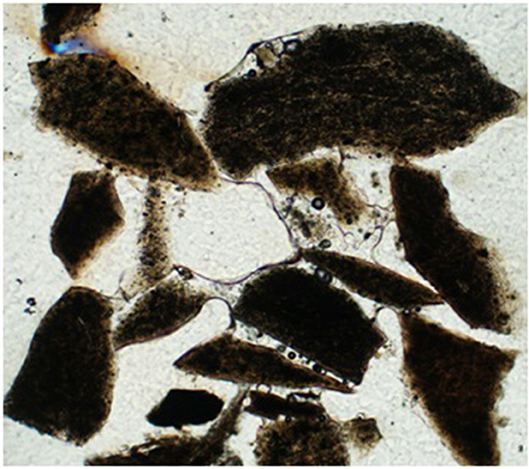
Figure 6. Transmitted light microscope image of a cluster of mullite grains bonded together by a transparent adhesive made up mostly of potassium and silica. Sample is from an air gasification experiment collected at the base of reactor after a run duration of 8 h. Length of image is 1,000 μm.
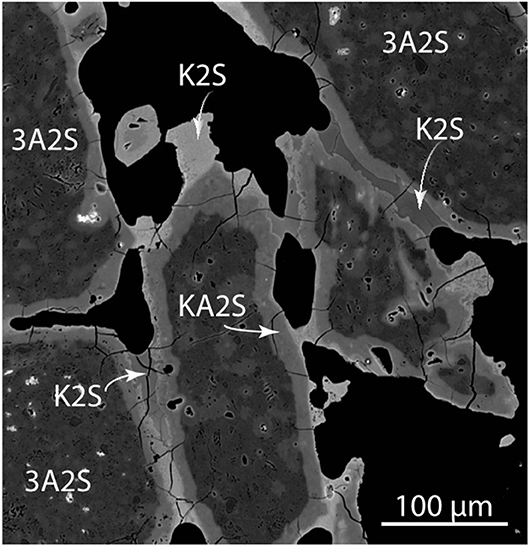
Figure 7. Back-scattered electron image (mean-atomic density map) of corroded and agglomerated mullite bed particles (air gasification at <750oC). Scale bar is 100 microns. Image intensity is principally controlled by the concentration of potassium and aluminum. 3A2S, mullite; KA2S, kalsilite; and K2S, potassium disilicate; where A, S, K stand for the respective oxides Al2O3, SiO2, K2O. Variable shade of K2S reflects variable minor Al and Ca contents.
Composite examples with an additional and later formed bonding of a potassium disilicate (K2O.2SiO2) occurs both in air and steam gasification experiments as a result of elevated temperature reaching 1,000°C and long duration. There are indications from the presence of vesicles and adhesive curvatures (Figure 6) suggesting surface tension control, and that the adhesive may have precipitated as a melt, although present during inspection as a glass. Figure 7 shows several bonding zones between mullite grains. The main elements present in the glue are K and Si, generally lacking Al that is abundant in the mullite and the alteration zones. The material that bonds the grains together is thus principally a K-silicate compound approximating potassium disilicate. This disilicate bonding is not easily broken and remains intact in epoxy mounts. Larger K-silicate grains, which typically do not participate in the agglomeration, occur as late forming components (Figure 7) containing some Al and minor amounts of Ca.
Particles of ash and char are present in the bed, but are not observed to interact with the bed particles and to participate in bonding and agglomeration.
Mullite and kalsilite are highly refractory phases that only melt at very high temperatures above ~1,700°C (Schairer and Bowen, 1955). The effect of increasing potash is ultimately dramatically to lower the melting point of the mixed components to a solidus of 923°C for coexisting kalsilite and potassium disilicate. This temperature is still well-above the measured maximum reactor temperatures for both the air and steam gasification experiments (<750°C) suggesting that flue gas and bed reactions occurred at subsolidus conditions without melting. This is in contrast to the observations that melting may have occurred during agglomeration involving K-disilicate adhesive suggesting local elevated temperatures reaching into the melting range.
Elemental mobility of potassium initially occurred at temperatures below 750°C carried with the flue gas and causing strong corrosion of the mullite grains. With locally rising temperatures into the range of 900–1,000°C, an additional mobility of silica, alumina, and calcium are observed resulting in the precipitation of mixed melts made-up of mainly potassium and silica with minor alumina and calcium. The elemental sources are attributed to both the almond fuel and the bed material, carried in the late stages mainly as aerosol melt particles.
Conclusions
Gasification experiments were conducted with four almond byproduct samples from four different geographic locations in California (S2, S4, S5, and S7) using two gasifying agents of air and steam. In steam gasification, gas temperatures in the main reactor never reached the set point wall temperature and were lower at the base of the reactor. In contrast, the air gasification runs had higher temperatures at the base of the reactor. Agglomeration of bed material occurred in the reactor during most of the air gasification runs, whereas agglomeration only occurred during two of the steam runs.
Proximate analysis showed that for both steam and air runs, the retained bed material had higher ash content and lower volatile matter and fixed carbon concentrations compared to the cyclone and filter catches. For the steam runs, the cyclone catch had higher ash concentration than the filter catch, with higher fixed carbon in the filter catch. The filtered solids likely contain a higher concentration of condensed organics (tars) on particles with higher volatile matter.
Calorimetric analysis of the catch materials illustrated that samples from the steam runs consistently possessed greater HHV than those from the air runs due to partial oxidation under air. Moreover, heating values of the filter catch were typically higher than those of the cyclone, again likely the result of a greater share of condensed organics.
For the air runs, change in feedstock type (S2, S4, S5, S7) resulted in slight differences between means for most of the gas species due to small differences in operating conditions and feedstock compositions. However, these differences between the means were not statistically significant. Typical gas concentrations produced during air gasification of almond biomass were 14.0–17.6% hydrogen, 3.0–3.6% methane, 42.7–50.2% nitrogen, 15.8–19.4% carbon monoxide, and 16.4–17.4% carbon dioxide.
For the steam runs, typical gas concentrations were 35.4–40.3% hydrogen, 5.3–6.9% methane, 16.8–21.1% nitrogen, 18.4–21.4% carbon monoxide, and 15.7–18.3% carbon dioxide. Steam gasification led to an almost two-fold increase in hydrogen concentration. The absence of nitrogen dilution during steam gasification also results in the obvious increase in heating value of the product gas.
The high level of potassium in the almond shells led to agglomeration of the bed material due to gas phase potassium reacting with the solid phase silica, especially at higher temperature. Possible solutions include mixing other low potassium feedstock to reduce potassium concentration in the flue gas, performing leaching pretreatment of almond shells to remove the potassium before the feedstock enters the reactor, or adopting alternative bed media that are less prone to alkali metal reactions. Further investigations will need to be conducted in this area for these feedstocks.
Data Availability
All datasets generated for this study are included in the manuscript and/or the supplementary files.
Author Contributions
ZM and BJ conceived of the presented idea. ZM, ML, MO, LW, and TA performed the laboratory experiments. PT performed the microscopy and analysis. LT, B-SC, and WO verified the analytical methods. BJ supervised the findings of this work. All authors discussed the results and contributed to the final manuscript.
Funding
This work was supported by the California Energy Commission [PIR-07-002 and PIR-11-008]. We also acknowledge the generous support of the Almond Board of California, the California Almond Hullers and Processors Association, and USDA-NIFA/UC Agricultural Experiment Station.
Conflict of Interest Statement
The authors declare that the research was conducted in the absence of any commercial or financial relationships that could be construed as a potential conflict of interest.
Acknowledgments
We wish to thank Rob Williams for his help and contribution in the Biomass Laboratory, UC Davis. We also wish to thank the Electron Microprobe Laboratory at the Department of Earth and Planetary Sciences at UC Davis for SEM/EMP results.
Footnotes
1. ^Dixon Ridge Farms, site visit 3/13/2015 and tour with Russ Lester.
References
Adnan, M. A., Susanto, H., Binous, H., Muraza, O., and Hossain, M. M. (2017). Feed compositions and gasification potential of several biomasses including a microalgae: a thermodynamic modeling approach. Int. J. Hydrog. Energy, 42, 17009–17019. doi: 10.1016/j.ijhydene.2017.05.187
Aktas, T., Thy, P., Williams, R. B., McCaffrey, Z., Khatami, R., and Jenkins, B. M. (2015). Characterization of almond processing residues from the Central Valley of California for thermal conversion. Fuel Process. Technol. 140, 132–147. doi: 10.1016/j.fuproc.2015.08.030
Almond Board of California (2018). Almond Almana. Modesto, CA. Available online at: http://www.almonds.com/sites/default/files/AlmondAlmanac2018Final_0.pdf. (accessed August 12, 2019).
Almond Hullers and Processors Association (AHPA) (2014). Open Letter to Calrecycle from President Covella.
Caballero, J. A., Font, R., and Marcilla, A. (1996). Comparative study of the pyrolysis of almond shells and their fractions, holocellulose and lignin. Product yields and kinetics. Thermochim. Acta 276, 57–77. doi: 10.1016/0040-6031(95)02794-7
Chen, P., Cheng, Y., Deng, S., Lin, X., Huang, G., and Ruan, R. (2010). Utilization of almond residues. Int. J. Agric. Biol. Eng. 3, 1–18. doi: 10.3965/j.issn.1934-6344.2010.04.001-018
Font, R., Marcilla, A., Devesa, J., and Verdu, E. (1988). Gaseous hydrocarbons from flash pyrolysis of almond shells. Ind. Eng. Chem. Res. 27, 1143–1149. doi: 10.1021/ie00079a009
Font, R., Marcilla, A., Devesa, J., and Verdú, E. (1994). Gas production by almond shell pyrolysis at high temperature. J. Anal. Appl. Pyrolysis 28, 13–27. doi: 10.1016/0165-2370(93)00760-K
Gil, J., Corella, J., Aznar, M. P., and Caballero, M. A. (1999). Biomass gasification in atmospheric and bubbling fluidized bed: Effect of the type of gasifying agent on the product distribution. Biomass Bioenergy 17, 389–403.
González, J. F., Gañán, J., Ramiro, A., González-García, C. M., Encinar, J. M., Sabio, E., et al. (2006). Almond residues gasification plant for generation of electric power. Preliminary study. Fuel Process. Technol. 87, 149–155. doi: 10.1016/j.fuproc.2005.08.010
Kendall, A.M., Elias, B., Sonja, Z., and Weiyuan (2015). Life Cycle–based Assessment of Energy Use and Greenhouse Gas Emissions in Almond Production, Part I: Analytical Framework and Baseline Results. J. Ind. Ecol. 19, 1008–1018. doi: 10.1111/jiec.12332
Montes, A., Ghiasi, E., Tran, H., and Xu, C. (2016). Study of bed materials agglomeration in a heated bubbling fluidized bed (BFB) using silica sand as the bed material and KOH to simulate molten ash. Powder Technol. 291, 178–185. doi: 10.1016/j.powtec.2015.12.030
Rapagnà, S., and Latif, A. (1997). Steam gasification of almond shells in a fluidised bed reactor: the influence of temperature and particle size on product yield and distribution. Biomass Bioenergy 12, 281–288. doi: 10.1016/S0961-9534(96)00079-7
Timmer, K. J. (2008). Carbon conversion during bubbling fluidized bed gasification of biomass (Dissertation, Doctor of Philosophy). Iowa State University, Ames, IA, United States. p. 140.
Tong, A. S. F., Lai, K. C. K., Ng, K. T. W., Tsang, D. C. W., Liu, T., Liu, J., et al. (2007). Renewable energy generation by full-scale biomass gasification system using agricultural and forestal residues. Pract. Period. Hazard. Toxic Radioact. Waste Manag. 11, 177–183. doi: 10.1061/(ASCE)1090-025X(2007)11:3(177)
Visser, H. J., van Lith, S. C., and Kiel, J. H. (2008). Biomass ash-bed material interactions leading to agglomeration in FBC. J. Energy Resour. Technol. 130:011801. doi: 10.1115/1.2824247
Keywords: almond biomass, air gasification, steam gasification, power generation, agglomeration
Citation: McCaffrey Z, Thy P, Long M, Oliveira M, Wang L, Torres L, Aktas T, Chiou B-S, Orts W and Jenkins BM (2019) Air and Steam Gasification of Almond Biomass. Front. Energy Res. 7:84. doi: 10.3389/fenrg.2019.00084
Received: 20 March 2019; Accepted: 07 August 2019;
Published: 21 August 2019.
Edited by:
Sachin Kumar, Sardar Swaran Singh National Institute of Renewable Energy, IndiaReviewed by:
Pratik N. Sheth, Birla Institute of Technology and Science, IndiaFehmi Akgun, TUBITAK Marmara Research Centre Energy Institute, Turkey
Copyright © 2019 McCaffrey, Thy, Long, Oliveira, Wang, Torres, Aktas, Chiou, Orts and Jenkins. This is an open-access article distributed under the terms of the Creative Commons Attribution License (CC BY). The use, distribution or reproduction in other forums is permitted, provided the original author(s) and the copyright owner(s) are credited and that the original publication in this journal is cited, in accordance with accepted academic practice. No use, distribution or reproduction is permitted which does not comply with these terms.
*Correspondence: Zach McCaffrey, emFjaC5tY2NhZmZyZXlAdXNkYS5nb3Y=