 Nicholas Apergis1
 James E. Payne
- 1Department of Economics and Finance, School of Business, Law and Social Sciences, University of Derby, Derby, United Kingdom
- 2College of Business Administration, The University of Texas at El Paso, El Paso, TX, United States
This paper extends the literature on the convergence of carbon dioxide emissions intensity and its determinants (energy intensity and the carbonization index) for six Central American countries over the period 1971 to 2014. Using the Phillips-Sul club convergence approach, the results indicate two distinct convergence clubs with respect to carbon dioxide emissions intensity and energy intensity. The carbonization index yields a single convergence club with Panama exhibiting non-convergent behavior. In light of the results, policies oriented toward the continued investment in renewable energy sources, clean energy technology, improved energy efficiency, restoration of forests, and movement toward carbon neutrality are desired goals to mitigate the environmental pressures associated with carbon dioxide emissions as a component of greenhouse gases.
Introduction
As the major contributor to greenhouse gases, carbon dioxide emissions has drawn a great deal of attention from both policymakers and researchers with respect to its adverse environmental impact. As the Kyoto Protocol initiated a number of policies targeted to reduce greenhouse gas emissions that include mitigation strategies in terms of the allocation of emission obligations across countries, a fundamental concern regarding the effectiveness of such mitigation strategies has been the degree to which emissions exhibit convergence behavior. In general, convergence occurs when countries with higher initial levels of emissions have a lower emission growth rate than countries with lower initial levels of emissions and over time reach a unique steady state or steady state(s) reflective of the countries' characteristics (Barro and Sala-i-Martin, 1992). The presence of convergence in emissions suggests that countries are more likely to endorse emission allocation strategies as the concern for relocation of emissions-intensive industries and resource transfer may be of less importance. On the other hand, the absence of convergence, or even divergence in emissions, suggests that the relocation of emissions-intensive industries or a substantial resource transfer through international trading of carbon allowances will circumvent such mitigation strategies1.
The research on carbon dioxide emissions convergence is quite extensive, as documented in surveys by Pettersson et al. (2014), Acar et al. (2018), and Payne (2019). Interestingly enough, the vast majority of the literature thus far has focused on large multi-country studies or studies of countries defined by institutional structure, primarily OECD or EU countries, with very few studies pertaining to specific geographical areas2. The intent of this paper is to contribute to the literature by examining the Central American region. The region is unique in bridging two continents incorporating 7% of the world's biodiversity (Economic Commission for Latin America the Caribbean, 2018). This feature of the region is important as greenhouse gas emissions and global climate change impacts the region's ecosystem and the socio-economic well-being of the population, of which nearly half live in poverty. Indeed, many of the countries in Central America rank among the top 10 of the global climate risk index set forth by German Watch (Harmeling and Eckstein, 2012).
Historically, the region has primarily depended on agricultural production, but has evolved over time toward more manufacturing and tourism (Apergis and Payne, 2009a,b, 2011, 2012, 2014). While hydropower is a prominent energy source in the region along with the emergence of other renewable energy resources, there is still dependency on imported fossil fuels. As a result of greenhouse gas emissions, climate change serves as a serious risk factor to the environmental sustainability of the region along with its corresponding impact on the agricultural and tourism sectors in many of the countries. Though the region recognizes the environmental repercussions associated with carbon dioxide emissions as evident by each country's ratification and acceptance of the Kyoto Protocol, the continued investment in clean energy technology, improved energy efficiency, restoration of forests, and movement toward carbon neutrality are desired goals to mitigate the environmental pressures of climate change. The challenge for policymakers in the mitigation of emissions is the variation in the level of economic development along with the mix and intensity of energy source usage across countries in the region. For example, the per capita real income levels in Costa Rica and Panama are more than three times greater than the rest of the countries in Central America. Likewise, Panama is quite distinct relative to the other Central American countries with on average 71% of total energy consumption emanating from fossil fuels compared to 45% in the other countries.
Unlike the majority of previous studies on emissions convergence that focus on per capita emissions, we take into account these considerations through the examination of the convergence of carbon dioxide emissions intensity and its determinants: energy intensity and the carbonization index for six of the seven Central American countries3. Carbon dioxide emissions intensity is defined as carbon dioxide emissions per GDP. Energy intensity, denoted as energy consumed per GDP, captures the technical efficiency associated with the utilization of energy and production processes. The carbonization index, measured as carbon dioxide emissions per energy consumed, reflects the mix of energy sources utilized in consumption and production activities (Apergis and Payne, in press). Thus, the examination of the convergence behavior of energy intensity and the carbonization index will provide some insights regarding the convergence of carbon dioxide emissions intensity. In this spirit our analysis parallels (Camarero et al., 2013; Apergis and Payne, in press) in using the club convergence approach of Phillips and Sul (2007, 2009). Moreover, this study addresses this void in the literature with respect to the convergence of carbon dioxide emissions intensity in the case of Central America while also exploring the similarities in the convergence behavior of the two main components of carbon dioxide emissions intensity: energy intensity and the carbonization index4.
Section Review of the Convergence Literature on Carbon Dioxide Emissions Intensity provides an overview of the literature pertaining to the convergence of carbon dioxide emissions intensity. Section Data, Methodology, and Results presents the data, methodology, and results while section Conclusion and Policy Implications discusses the policy implications of the findings and concluding remarks.
Review of the Convergence Literature on Carbon Dioxide Emissions Intensity
As previously noted, the literature surveys by Pettersson et al. (2014), Acar et al. (2018), and Payne (2019) reveal that the majority of the published studies have examined carbon dioxide emissions convergence based on per capita measures with relatively few studies related to carbon dioxide emissions intensity. As such, we focus our attention on studies specific to the convergence of carbon dioxide emissions intensity. There are several approaches to test for convergence which can be categorized using three fundamental concepts: beta (β), sigma (σ), and stochastic convergence, and further differentiated by absolute and conditional convergence (Pettersson et al., 2014). Essentially, tests of absolute β-convergence assume that all countries move to the same steady-state level of emissions whereas conditional β-convergence allows for different steady-states based on the similarities in country characteristics. However, the absolute and conditional β-convergence approaches do not adequately address the dynamics of the growth process and in a panel context the potential for dynamic panel data bias if there is insufficient time series data. Through the analysis of the distributional dynamics of emissions, σ-convergence examines the extent to which there is a decrease over time in the cross-sectional variation in emissions. Stochastic convergence examines whether relative emissions, defined by emissions for country i relative to another country (or the average of the sample of countries), is stationary using unit root/stationarity tests. If relative emissions are stationary, stochastic convergence is present with shocks to relative emissions transitory in nature. Finally, the club convergence approach captures the growth dynamics and allows for the possibility of multiple convergence clubs, irrespective of the stationarity of the variables in question.
Given the alternative approaches to the examination of convergence, the review of the literature on the convergence of carbon dioxide emissions intensity begins with studies related to institutional structure. Camarero et al. (2013) apply the Phillips and Sul (2007, 2009) club convergence approach to examine carbon dioxide emissions intensity along with its determinants, energy intensity and the carbonization index for 23 OECD countries. Their results identify four convergence clubs with four countries considered non-convergent (Italy, Spain, Luxembourg, and the U.S.) to conclude that differences in the convergence of carbon dioxide emissions intensity are largely driven by the differences in the carbonization index rather than energy intensity. Kounetas (2018) investigates the distributional dynamics of energy consumption and carbon dioxide emissions along with their corresponding intensities and the carbonization index for 23 EU countries. The results provide support for absolute β- and σ-convergence; however, the non-parametric approach of analyzing the distributional dynamics does not yield support for convergence.
In addition to these studies, several studies of OECD countries have investigated the convergence of carbon dioxide emissions intensity at the sub-national level. In the examination of industrial and energy sectors in Portugal (Moutinho et al., 2014), explore convergence with respect to carbon emissions intensity, carbon emissions by fossil fuel consumption, fossil fuel intensity, energy intensity, and economic structure. Their results indicate σ-convergence except for carbon emissions by fossil fuel consumption and fossil fuel intensity in the most polluting sectors. Further analysis using panel unit root tests of the relative ratio of carbon dioxide emissions intensity do not support convergence across sectors. Brannlund et al. (2015) examine the convergence of carbon dioxide emissions intensity across manufacturing sectors in Sweden using an environmental performance index. Within the framework of conditional β-convergence that includes fossil fuel prices, capital intensity, and the share of firms in each sector participating in the European Emission Trading Scheme (EU ETS), the results from a fixed effects panel model show manufacturing sectors converge to different steady-states.
Apergis et al. (2017) evaluate the convergence of carbon dioxide emissions intensity across the 50 U.S. states and the District of Colombia. Their findings based on cross-sectional tests of β- and σ-convergence support overall convergence in carbon dioxide emissions intensity. However, panel unit root tests with allowance for cross-sectional dependence and structural breaks do not yield support for stochastic convergence. Apergis and Payne (in press) investigate whether or not the introduction of NAFTA influenced the convergence behavior of carbon dioxide emissions intensity and its determinants (energy intensity and carbonization index) in the case of Canada, Mexico, and the U.S. Their results reveal that the convergence of carbon dioxide emissions intensity and its determinants observed pre-NAFTA continued in the post-NAFTA period.
Finally, there are a number of studies that pertain to carbon dioxide emissions intensity convergence in the case of China. Wang et al. (2014) utilizes the club convergence approach to test the convergence of carbon dioxide emissions intensity of 29 Chinese provinces to find three distinct convergence clubs, distributed geographically from west to east and from the inland to coastal areas. Hao et al. (2015) tests for absolute and conditional β-convergence along with stochastic convergence of carbon dioxide emissions intensity of 29 Chinese provinces to find support for convergence. Zhao et al. (2015) applies a spatial dynamic panel model to examine the convergence of carbon dioxide emission intensity of 30 Chinese provinces to show convergence in carbon dioxide emission intensity across provinces. Finally, Yu et al. (2018) evaluate the convergence of carbon dioxide emissions intensity of the industrial sectors in China using data envelopment analysis to construct an environmental performance index. Based on a dynamic panel model, their findings support conditional β-convergence in carbon dioxide emissions intensity across industrial sectors with the results from σ-convergence providing mixed results. Further analysis based on the club convergence approach indicates the emergence of two convergence clubs.
Data, Methodology, and Results
Data
Data was obtained from the World Bank Development Indicators from the period 1971 to 2014 for six Central American countries: Costa Rica, El Salvador, Guatemala, Honduras, Nicaragua, and Panama. Carbon dioxide emissions intensity is given as emissions in kg per GDP in 2010 U.S. dollars; energy intensity is defined as the ratio of per capita energy use to per capita GDP in 2010 U.S. dollars; and the carbonization index is measured as kg per kg of oil equivalent energy use5.
Table 1 displays the summary statistics associated with each measure. With respect to carbon dioxide emissions intensity in Panel A of Table 1, the average ranges from a low of 0.2177 in Costa Rica to a high of 0.4550 in Nicaragua with the variation (standard deviation) ranging from 0.0230 in Costs Rica to 0.1061 in Nicaragua. A similar pattern emerges with respect to energy intensity in Panel B of Table 1, as the average ranges from a low of 0.1142 in Costa Rica to a high of 0.3432 in Nicaragua with the variation (standard deviation) ranging from 0.0102 in Costa Rica to 0.0744 in Nicaragua. However, the carbonization index in Panel C of Table 1 reveals the average ranges from a low of 1.1875 in El Salvador to a high of 2.0988 in Panama with the variation (standard deviation) ranging from 0.2002 in Costa Rica to a high of 0.3473 in Honduras.
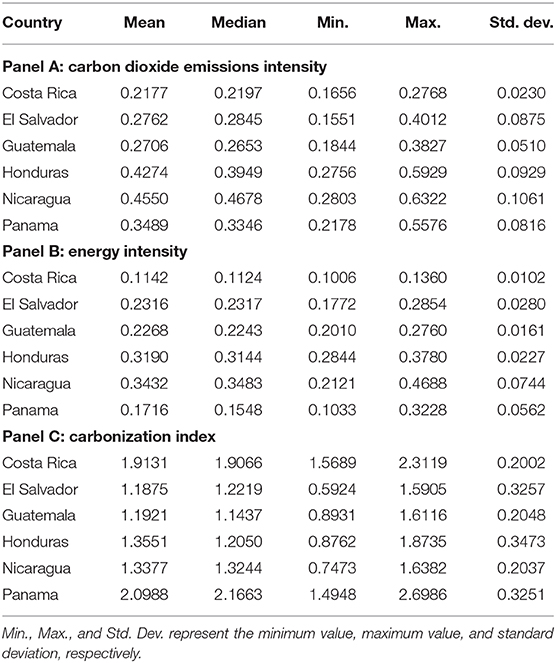
Table 1. Summary statistics.
To provide a visual context to the time series behavior of respective measures, we observe in Figure 1 that carbon dioxide emissions intensity has historically been higher in Honduras and Nicaragua with emissions intensity declining somewhat over time for Panama. A similar pattern emerges with respect to energy intensity in Figure 2, though the countries are not as closely clustered as in the case of carbon dioxide emissions intensity. Finally, the carbonization index shown in Figure 3 reveals that while the carbonization index is higher in both Costa Rica and Panama there has been a decline since the late 1990s in Costa Rica while the other four Central American countries (El Salvador, Guatemala, Honduras, and Nicaragua) have shown an increase since the early 1990s.
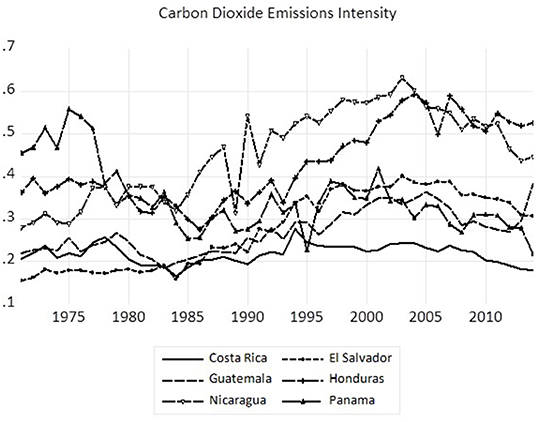
Figure 1. Carbon dioxide emissions intensity.
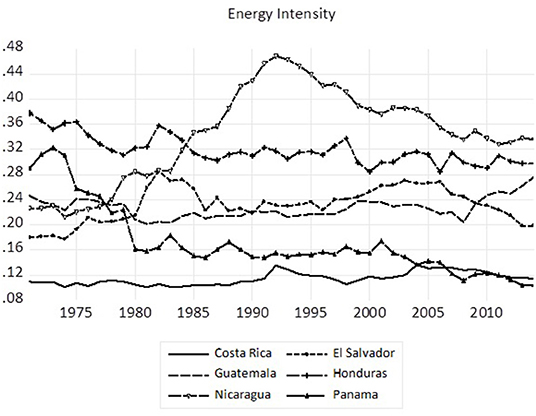
Figure 2. Energy intensity.
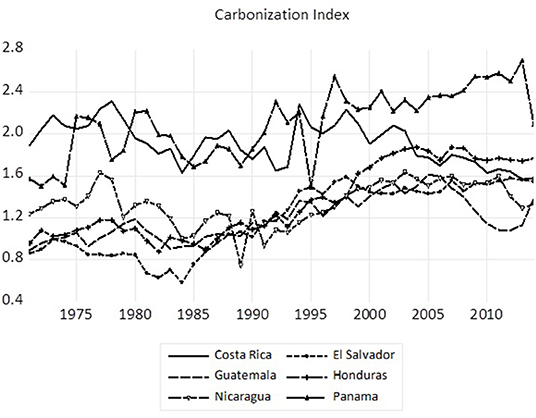
Figure 3. Carbonization index.
Methodology and Results
We follow Camarero et al. (2013) and Apergis and Payne (in press) in the use of the time-varying common factor model of Phillips and Sul (2007, 2009) to identify convergence toward a common trend among the six Central American countries with respect to carbon dioxide emissions intensity, energy intensity, and the carbonization index6. Specifically, the time-varying common factor is defined as:
where yit is CO2 emissions intensity (as well as energy intensity and the carbonization index) of country i at time t; μt is a common factor or trend component in the panel; and δit is a time-varying idiosyncratic component that captures both time and individual specific effects. In semi-parametric form, δit is given as follows:
where δi is fixed; ξit ~ iid(0, 1) is weakly dependent over time t varying across countries i = 1, 2, …, 6; σi is an idiosyncratic scale parameter; and L(t) is a slowly varying function of time where L(t) → ∞ and t → ∞7.
The null hypothesis of convergence is HO:δi = δ and αi ≥ 0 against the alternative hypothesis HA:{δi = δ for all i with αi < 0 } or {δi ≠ δ for some i with αi ≥ 0 or αi < 0}. Moreover, yit and μt do not require either variable to be stationary or non-stationary. Phillips and Sul (2007, 2009) employ the quadratic distance measure, Ht, as follows:
where hit represents the relative transition coefficient,
which captures the transition path relative to the panel average. When there is a common or limiting transition behavior across individual countries (hit = ht across i), convergence occurs when hit → 1 for all i as t → ∞, but when convergence is absent the distance remains positive as t → ∞.
We set L(t) = logt in the decay model (2) so the empirical log t regression can be used to test for convergence clubs as follows:
for t = rT, rT + 1, …, T where r > 0 set on the interval [0.2, 0.3]. For , the null hypothesis is based on a one-sided test of against 8.
The Phillips and Sul (2007, 2009) procedure uses a clustering algorithm to identify convergence clubs within the panel defined as follows:
(i) Order the N countries' measures based on the final values of their times series observations;
(ii) Starting from the highest-order country, add adjacent countries from the ordered list and estimate regression (5), followed by identifying a core group using the cut-off point criterion: subject to , for k = 2, 3, …, 6;
(iii) Add one country at a time from the remaining countries to the core group, and re-estimate (5) using the sign criterion () to determine whether a country joins the core group; and
(iv) For the case of the remaining countries, repeat the above steps iteratively until clubs can no longer be formed.
Based on this iterative procedure each club is associated with its own convergence path. If the countries that do not exhibit convergence, they form a non-converging club.
Table 2 reports the results from the Phillips and Sul (2007, 2009) club convergence approach for carbon dioxide emissions intensity, energy intensity, and the carbonization index9. In Panel A, the first row displays the results from testing full panel convergence (i.e., across all six countries) in the case of carbon dioxide emissions intensity. The coefficient estimate is with a t-statistic, , which is negative and statistically significant at the 1% level, thus rejecting the null hypothesis of full panel convergence. Based on this result, we proceed with the clustering algorithm to identify distinct convergence clubs. The first club (Club 1) consists of Costa Rica, El Salvador, Guatemala, and Honduras with and , which fails to reject the null hypothesis of convergence with the second club (Club 2) comprised of Nicaragua and Panama with and
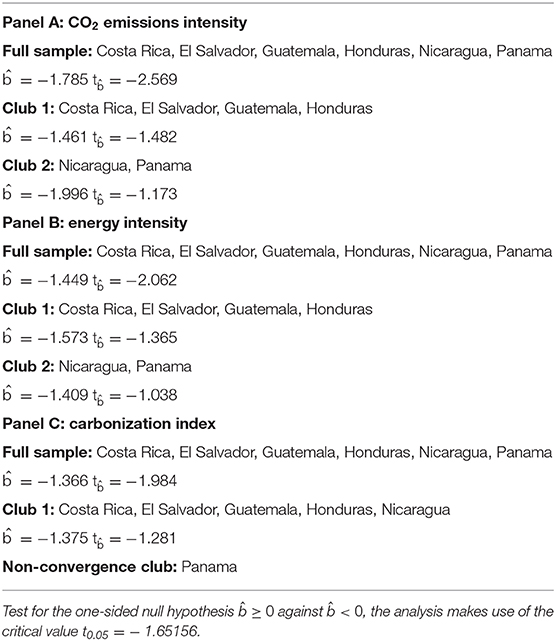
Table 2. Club convergence results.
The first row of Panel B reports the findings for full panel convergence in the case of energy intensity. The coefficient and indicates rejection of the null hypothesis of full panel convergence. In the second row of Panel B, the results regarding club convergence reveals the first club (Club 1) includes Costa Rica, El Salvador, Guatemala, and Honduras with and , which fails to reject the null hypothesis of convergence. The third row of Panel B identifies the second convergence club (Club 2) that includes Nicaragua and Panama with and . Finally, the null hypothesis of full panel convergence with respect to the carbonization index, shown in the first row of Panel C, is rejected with and . The results from the clustering algorithm identifies only one convergence club (Club 1) of Costa Rica, El Salvador, Guatemala, Honduras, and Nicaragua with the coefficient estimate of and while Panama is considered non-convergent. Based on the convergence results, both carbon dioxide emissions intensity and energy intensity each yield two convergence clubs consisting of the same groups of countries whereby each club converges to a different steady state. On the other hand, the carbonization index reveals the emergence of a single convergence club whereby the countries within the club converge to a unique steady state with the exception of Panama which exhibits non-convergent behavior.
Conclusion and Policy Implications
Given the growing concerns surrounding the environmental impacts of carbon dioxide emissions, policymakers and researchers are very much interested in developing mitigation strategies to lower the growth rate of carbon dioxide emissions. A key aspect to such efforts relates to the convergence properties of carbon dioxide emissions across countries. In this regard, an extensive literature has emerged on the convergence of per capita carbon dioxide emissions. Indeed, the acceptance of per capita emission allocation strategies depends on the convergence or divergence of per capita emissions across countries. Specifically, countries are less likely to have concerns related to the relocation of emissions-intensive industries or the resource transfer through international trading of emissions allowances if per capita emissions converge.
However, Aldy (2006) points out the political aspects of such emission allocation approaches. For instance, countries will lower per capita emissions (i.e., developing countries as in the case of Central America) expect countries with higher per capita emissions to bear a greater burden in terms of the mitigation efforts toward climate change, which in turn may affect multilateral climate change agreements. Alternatively, Rios and Gianmoena (2018) note that the Paris 2015 agreement proposes that contributions to the mitigation of carbon dioxide emissions be nationally determined based on country specific characteristics, which contrasts with the more egalitarian principle that each individual should have an equal right to pollute10.
As such, the literature has been focused on evaluating the convergence of per capita carbon dioxide emissions with studies primarily oriented toward large multi-country analysis or studies defined by institutional structure (for instance OECD or EU countries), rather than studies specific to a geographical area. Moreover, the focus of these studies on the convergence of per capita carbon dioxide emissions ignores to some degree the unique country specific characteristics pertaining to energy efficiency, energy mix, and overall economic structure. This study addresses these points in the analysis of the convergence of carbon dioxide emissions intensity and its determinants with respect to Central America.
Recognizing the importance of the different growth dynamics of each country and the possibility of different steady states among groups of countries within Central America, we employ the Phillips and Sul (2007, 2009) club convergence approach in our analysis. We find that the results from the club convergence approach rejects the null hypothesis of overall panel convergence for carbon dioxide emissions intensity, but identifies two convergence clubs with the first club comprised of Costa Rica, El Salvador, Guatemala, and Honduras and a second club of Nicaragua and Panama. In terms of energy intensity, we also reject the null hypothesis of overall panel convergence with the two distinct convergence clubs similar to those found in the case of carbon dioxide emissions intensity. Though we reject the null hypothesis of overall panel convergence with respect to the carbonization index, only one convergence club emerges that comprises Costa Rica, El Salvador, Guatemala, Honduras, and Nicaragua with Panama exhibiting non-convergent behavior.
In light of the convergence results, it appears that the differences in the convergence of carbon dioxide emissions intensity is driven more by the differences in the carbonization index, representing the energy mix rather than differences in energy intensity. Indeed, the non-convergent behavior observed in Panama with respect to the carbonization index is not surprising given that Panama's net energy imports as a percentage of total energy use and fossil fuel as a percent of total energy consumption usage far exceeds the other Central American countries. While the Central American region is blessed with hydroelectric resources, the continued move toward the expansion of other renewable energy sources as an alternative to the reliance on imported oil along with improvements in energy efficiency is certainly desirable in reducing carbon dioxide emissions. In response to the long-term risks associated with greenhouse gas emissions and climate change, a more comprehensive public policy approach is warranted. More specifically, the appropriate incentives to nurture structural changes in production processes and consumption behavior that reduce risks associated with climate change while promoting a transition to environmentally sustainable economies is certainly a desired outcome. The implementation of natural resource management and environmental protection policies that encourages a more diversified “green” production portfolio through the adoption of clean technologies that reduce the region's carbon footprint is needed. Furthermore, given the relatively high levels of poverty within Central America, government policies that address poverty and income inequality would lessen the environmental impact of climate change on the region's most vulnerable segment of the population (Economic Commission for Latin America the Caribbean, 2018).
Data Availability Statement
The datasets generated for this study are available on request to the corresponding author.
Author Contributions
JP contributed by writing the manuscript. NA contributed by undertaking the empirical estimation. MR-V contributed by collecting the data and background literature.
Conflict of Interest
The authors declare that the research was conducted in the absence of any commercial or financial relationships that could be construed as a potential conflict of interest.
Footnotes
1. ^Zhou and Wang (2016) provide a review of the various carbon dioxide emissions allocation mechanisms.
2. ^Solarin (2014) investigates convergence of per capita CO2 emissions for 39 African countries with mixed results. Robalino-Lopez et al. (2016) identify two convergence clubs with respect to per capita CO2 emissions for 10 South American countries within the context of Kaya decomposition. Tiwari and Mishra (2017) examines the level of CO2 emissions for 18 Asian countries finding support for convergence.
3. ^Belize is omitted from our analysis give the availability of data.
4. ^Carbon dioxide emissions intensity,, can be decomposed into energy intensity, , and the carbonization index, .
5. ^The time period is constrained to 1971 to 2014 due to the availability of data for the countries included in our analysis.
6. ^Note that prior to the implementation of the club convergence approach, the Hodrick and Prescott (1997) filter is applied to extract the trend component of the respective time series.
7. ^The parameter α is the rate at which the cross-section variation decays over time to zero.
8. ^The least squares estimates of b are based on heteroskedasticity and autocorrelation consistent standard errors to avoid estimates that may be weakly time-dependent. Also note that −2logL(t) serves as a penalty function with the omission of this term under the alternative hypothesis yielding an upward bias on the least squares estimate of b.
9. ^Phillips and Sul (2007) suggest that r = 0.3 is a satisfactory selection in terms of both size and power.
10. ^These points draw from the survey of the emissions convergence literature by Payne (2019).
References
Acar, S., Soderholm, P., and Brannlund, R. (2018). Convergence of per capita carbon dioxide emissions: implications and meta-analysis. Clim. Policy 18, 512–525. doi: 10.1080/14693062.2017.1314244
Aldy, J. E. (2006). Per capita carbon dioxide emissions: convergence or divergence? Environ. Resour. Econ. 33, 533–555. doi: 10.1007/s10640-005-6160-x
Apergis, N., and Payne, J. E. (2009a). Energy consumption and economic growth in Central America: evidence from a panel cointegration and error correction model. Energy Econ. 31, 211–216. doi: 10.1016/j.eneco.2008.09.002
Apergis, N., and Payne, J. E. (2009b). CO2 emissions, energy usage, and output in Central America. Energy Policy 37, 3282–3286. doi: 10.1016/j.enpol.2009.03.048
Apergis, N., and Payne, J. E. (2011). The renewable energy consumption-growth nexus in Central America. Appl. Energy 88, 343–347. doi: 10.1016/j.apenergy.2010.07.013
Apergis, N., and Payne, J. E. (2012). The electricity consumption-growth nexus: renewable versus non-renewable electricity in Central America. Energy Sources B 7, 423–431. doi: 10.1080/15567249.2011.639336
Apergis, N., and Payne, J. E. (2014). Renewable energy, output, CO2 emissions, and fossil fuel prices in Central America: evidence from a nonlinear panel smooth transition vector error correction model. Energy Econ. 42, 226–232. doi: 10.1016/j.eneco.2014.01.003
Apergis, N., and Payne, J. E. (in press). NAFTA the convergence of CO2 emissions intensity its determinants. Int. Econ. doi: 10.1016/j.inteco.2019.10.002
Apergis, N., Payne, J. E., and Topcu, M. (2017). Some empirics on the convergence of carbon dioxide emissions intensity across U.S. States. Energy Sources B 12, 831–837. doi: 10.1080/15567249.2017.1310956
Barro, R., and Sala-i-Martin, X. (1992). Convergence. J. Polit. Econ. 100, 223–251. doi: 10.1086/261816
Brannlund, R., Lundgren, T., and Soderholm, P. (2015). Convergence of carbon dioxide performance across Swedish industrial sectors: an environmental index approach. Energy Econ. 51, 227–235. doi: 10.1016/j.eneco.2015.07.004
Camarero, M., Picazo-Tadeo, A. J., and Tamarit, C. (2013). Are the determinants of CO2 emissions converging among OECD countries? Econ. Lett. 118, 159–162. doi: 10.1016/j.econlet.2012.10.009
Economic Commission for Latin America and the Caribbean (2018). Climate Change in Central America: Potential Impacts and Public Policy Options. Santiago: ECLAC.
Hao, Y., Liao, H., and Wei, Y.-M. (2015). Is China's carbon reduction target allocation reasonable? an analysis based on carbon intensity convergence? Appl. Energy 142, 229–239. doi: 10.1016/j.apenergy.2014.12.056
Harmeling, S., and Eckstein, D. (2012). Global Climate Risk Index 2013. Who Suffers Most from Extreme Weather Events? Weather Related Loss Events in 2011 and 1992 to 2011, Germanwatch Information Report. Bonn: Germanwatch.
Hodrick, R. J., and Prescott, E. C. (1997). Postwar U.S. business cycles: an empirical investigation. J. Money Credit Banking 29, 1–16. doi: 10.4324/9780203070710.pt8
Kounetas, K. E. (2018). Energy consumption and CO2 emissions convergence in European union member countries, a Tonneau des Danaides? Energy Econ. 69, 111–127. doi: 10.1016/j.eneco.2017.11.015
Moutinho, V., Robaina-Alves, M., and Mota, J. (2014). Carbon dioxide emissions intensity of portuguese industry and energy sectors: a convergence analysis and econometric approach. Renew. Sustain. Energy Rev. 40, 438–449. doi: 10.1016/j.rser.2014.07.169
Payne, J. E. (2019). The Convergence of Carbon Dioxide Emissions: A Survey of the Empirical Literature, Working Paper. El Paso: The University of Texas.
Pettersson, F., Maddison, D., Acar, S., and Soderholm, P. (2014). Convergence of carbon dioxide emissions: a review of the literature. Int. Rev. Environ. Resour. Econ. 7, 141–178. doi: 10.1561/101.00000059
Phillips, P. C. B., and Sul, D. (2007). Transition modeling and econometric convergence tests. Econometrica 75, 1771–1855. doi: 10.1111/j.1468-0262.2007.00811.x
Phillips, P. C. B., and Sul, D. (2009). Economic transition and growth. J. Appl. Econom. 24, 1153–1185. doi: 10.1002/jae.1080
Rios, V., and Gianmoena, L. (2018). Convergence in CO2 emissions: a spatial economic analysis with cross-country interactions. Energy Econ. 75, 222–238. doi: 10.1016/j.eneco.2018.08.009
Robalino-Lopez, A., Garcia-Ramos, J. E., Golpe, A. A., and Mena-Nieto, A. (2016). CO2 emissions convergence among 10 south American countries: a study of Kaya components (1980–2010). Carbon Manage. 7, 1–12. doi: 10.1080/17583004.2016.1151502
Solarin, S. A. (2014). Convergence of CO2 emission levels: evidence from African countries. J. Econ. Res. 19, 65–92. doi: 10.17256/jer.2014.19.1.004
Tiwari, C., and Mishra, M. (2017). Testing the CO2 emissions convergence: evidence from Asian countries. IIM Kazhikode Soc. Manage. Rev. 6, 67–72. doi: 10.1177/2277975216674073
Wang, Y., Zhang, P., Huang, D., and Cai, C. (2014). Convergence behavior of carbon dioxide emissions in China. Econ. Model. 43, 75–80. doi: 10.1016/j.econmod.2014.07.040
Yu, S., Hu, X., Fan, J., and Cheng, J. (2018). Convergence of carbon emissions intensity across Chinese industrial sectors. J. Cleaner Prod. 194, 179–192. doi: 10.1016/j.jclepro.2018.05.121
Zhao, X., Burnett, J. W., and Lacombe, D. J. (2015). Province-level convergence of China's carbon dioxide emissions. Appl. Energy 150, 286–295. doi: 10.1016/j.apenergy.2015.04.015
Keywords: carbon dioxide emissions intensity, energy intensity, carbonization index, club convergence, Central America
Citation: Apergis N, Payne JE and Rayos-Velazquez M (2020) Carbon Dioxide Emissions Intensity Convergence: Evidence From Central American Countries. Front. Energy Res. 7:158. doi: 10.3389/fenrg.2019.00158
Received: 05 November 2019; Accepted: 09 December 2019;
Published: 08 January 2020.
Edited by:
Chien-Chiang Lee, Nanchang University, ChinaCopyright © 2020 Apergis, Payne and Rayos-Velazquez. This is an open-access article distributed under the terms of the Creative Commons Attribution License (CC BY). The use, distribution or reproduction in other forums is permitted, provided the original author(s) and the copyright owner(s) are credited and that the original publication in this journal is cited, in accordance with accepted academic practice. No use, distribution or reproduction is permitted which does not comply with these terms.
*Correspondence: James E. Payne, anBheW5lMkB1dGVwLmVkdQ==