 Teresa Wich
 Wiebke Lueke1
- 1Thyssenkrupp AG, Essen, Germany
- 2Ruhr-Universität Bochum, Bochum, Germany
- 3Fraunhofer UMSICHT, Oberhausen, Germany
With respect to the climate goals of the Paris agreement, different carbon dioxide (CO2) reduction strategies are discussed for industrial processes. For a comparison of these strategies—carbon direct avoidance (CDA), carbon capture and storage (CCS), and carbon, capture, and utilization (CCU)—a holistic view is mandatory. In this article, recent literature is at first analyzed for stringent methodology, transparency and applied assessment criteria. Secondly, a new set of assessment criteria is presented: Beside the carbon reduction potential, the energy demand and costs, additional criteria for the mid-term impact of a CO2 reduction strategy like the reuse potential or social acceptance are analyzed. In a third step, publicized data is converted into consistent system boundaries. Deriving from the life cycle assessment (LCA) the method “system expansion” is selected. The impact of the system expansion approach is demonstrated by calculation of the CO2 and the energy balances of the CCU approach within different system boundaries. The system expansion is visualized systematically under the consideration of the different processes. The Carbon2Chem® project is described as one example for the CCU approach of the steel and chemical production, which offers a CO2 reduction of about 50%. Additionally the CO2 reduction potential is expandable proportional with increasing utilization of top gases. A consistent level of the energy demand for the CCU approach is shown compared to the conventional production processes of steel and chemicals.
Introduction
With the Paris Agreement, the international community is pursuing an ambitious goal: the reduction of greenhouse gas emissions and the associated reduction in global warming to <2°C (United Nations, 2015a). The natural carbon cycle including carbon dioxide (CO2) is balanced between sources such as living organisms and sinks such as plants or the ocean. Increasing anthropological CO2 emissions have created an extreme imbalance on the sources' side leading to a higher atmospheric CO2 concentration and therewith increased global warming (IPCC, 2014).
Among CO2 reduction measures like the reinforcement of the natural sinks by afforestation and stop of deforestation several technological strategies are already existing. For individual sectors, however, there are different approaches possible. The most obvious for example is the approach to avoid the usage of carbon directly (CDA). This can be achieved for example by increased energy efficiency or substitution of conventional fossil resources by renewable alternatives (Bazzanella and Ausfelder, 2009). On condition that the standards of living in industrialized countries are maintained, the avoidance of carbon is insufficient to reach the climate goals. The substitution of carbon in certain industrial processes is limited, especially if it is required as a reacting agent. In the steel sector for example the application of coal as a reducing agent can only be avoided by changing the whole process on a natural gas or hydrogen basis. This steel specific CDA technology is called direct reduction and in pilot stage of development.
The second opportunity to reduce CO2 emissions in case of carbon being part of the process, is the long-term storage of CO2 in the ground. This end-of-pipe solution in specific sectors is called carbon capture and storage (CCS). Politically and legally, however, this technology is not sustainable and not permitted in some countries. Thus, it represents only a conditional solution.
The third strategy for CO2 reduction in industrial processes is to capture and utilize the CO2 (CCU) by converting it into products e.g., for the chemical industry. Renewable energy as well as educts and products are connecting different industrial sectors to a cross-industrial network. Thereby fossil fuels in one industry are replaced by the carbon rich process gases of another sector as a carbon source. Depending on the technology, renewable energy is necessary for the utilization of the process gases. Thus, an optimum on system level and the reduction of overall emissions are aspired (Oles et al., 2018). The multiple use of carbon is an approach toward closing the anthropogenic carbon cycle again. By recapturing the carbon either already as a C1 building block or ultimately in the oxidized form of CO2 the carbon is supplied to a circular value chain. The additional benefit of CCU is next to the carbon reduction the assurance of sustainable resources. CCU herewith has the potential to support the circular economy.
With the Carbon2Chem® project, thyssenkrupp together with 16 partners has initiated a first step in the large-scale utilization of CO2 emissions from top gases of the steel production. The implementation of a cross-industrial network between the steel, the chemical and the energy sector enables one part of the circular economy with carbon monoxide and dioxide as the feedstock. The goal is to find a feasible system optimum regarding CO2 reduction.
In this work the impact of CO2 reduction strategies CDA, CCS, and CCU on an integrated system is investigated under the thesis that social, economic and environmental considerations are mandatory to achieve sustainability. To enable a fair comparison, one technology for each of the strategies is examined in detail. The exemplification ensures the transparency which is an essential base for an assessment. The focus is on the recycling of carbon in process gases toward a circular economy.
Methodology
Meta Analysis of Technology Assessments for CO2 Reduction
For the state of the art on CO2 reduction strategies, a meta-analysis of current publications has been done. In 14 recent publications dealing with climate mitigation pathways in Germany and Europe, the strategies of carbon avoidance, carbon storage and carbon utilization have been investigated. The selected studies (Table 1) base on the topic CO2 reduction strategies and were under discussion in 2018. The selection is a subjective extract without any claim to completeness. The methodologies on cost calculation, energy demand, and CO2 reduction potential have been analyzed qualitatively. In particular, the applied system boundaries of the methodologies have been considered. Additionally the publications have been quantitatively and qualitatively investigated with a focus on the keywords circular economy, sector coupling, substitution of fossil fuels, social impact. Common criteria of technology assessments in public reports are analyzed and unconventional criteria are evaluated by its impacts.
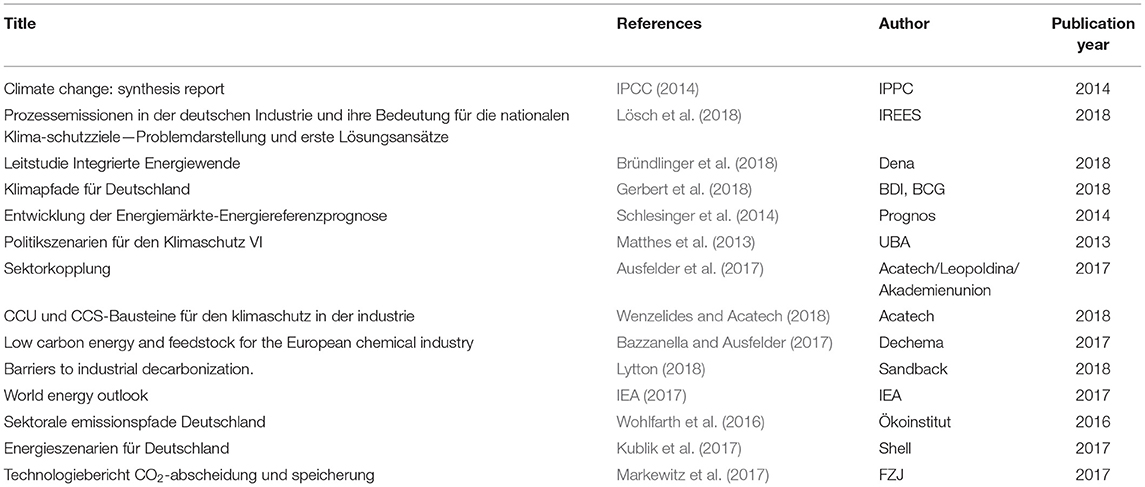
Table 1. List of studied publications.
A first multi criteria collection has been developed to enable a fair comparison of CO2 reduction strategies under ecologic, economic, technological, and social aspects. Furthermore, multiple use of carbon instead of only linear pathways is considered.
System Expansion
Exemplary for the CO2 reduction strategies in the sectors steel, energy, and chemistry, the problem of narrow system boundaries with singular consideration of sectors and solutions is shown in Figure 1.
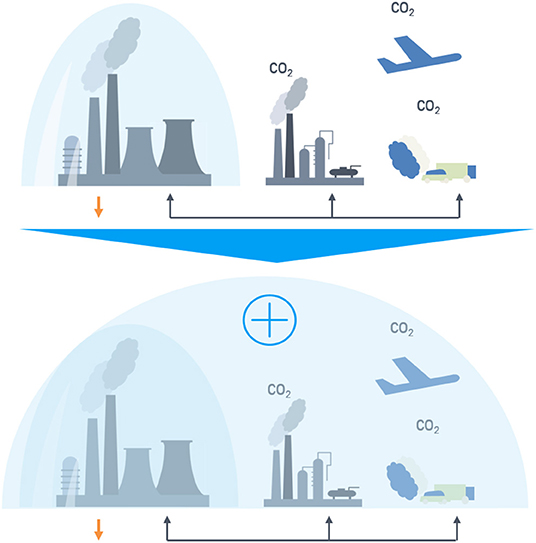
Figure 1. Comparison of system boundaries in singular (Top) and circular (Bottom) system approaches.
On the top of Figure 1 a classical system boundary approach is shown. Each sector (steel production, chemical industry, transport, etc.) is balanced individually independent from the carbon and/or fossil fuel source. However, on the bottom a new system approach with expanded system boundaries in a cross-industrial is shown, where the top gases of one industry serve as carbon source for the other sector. In such a cross-industrial network to the allocation of the emissions to the steel sector is insufficient, because the emissions of the up- and downstream supply chain are affected. The chemical and end user industry have to be added into the system boundaries. This approach called system expansion (European Commission Joint Research Centre, 2010) is explained in the “Techno-Economic Assessment & Life-Cycle Assessment Guidelines for CO2 Utilization” (p. 120) for application on CCU and is one methodology regarding multi-functionality. System expansion “shall be applied (…) if subdivision is not possible” (Zimmerman et al., 2018). The approach of subdivision shown in the example of Figure 1 (top) is not applicable here, because the carbon source has an effect on the whole system. Additionally, for a conclusive comparison it is mandatory to represent the conventional system with the same system boundaries.
Varying system boundaries as well as low levels of transparency are complicating a robust comparison of published data so far (see Results and Discussion: Meta-Analysis of Technology Assessments for CO2 Reduction). For that reason, publicized data have been converted into consistent system boundaries during this work. The system expansion approach according to Figure 1 is applied on the steel and the chemical sector. The application on further sectors e.g., cement or lime sector instead of steel is possible as well. The difference of the CCU approach for cement or lime processes is the gas composition: due to hydrogen and carbon monoxide the steel gases are beneficial.
In a first step the selected conventional processes are presented in block flow charts (see Figure 2). Furthermore, the approaches CCU, CCS and CDA are introduced in block flow charts to increase transparency and visualize the options of process modifications.
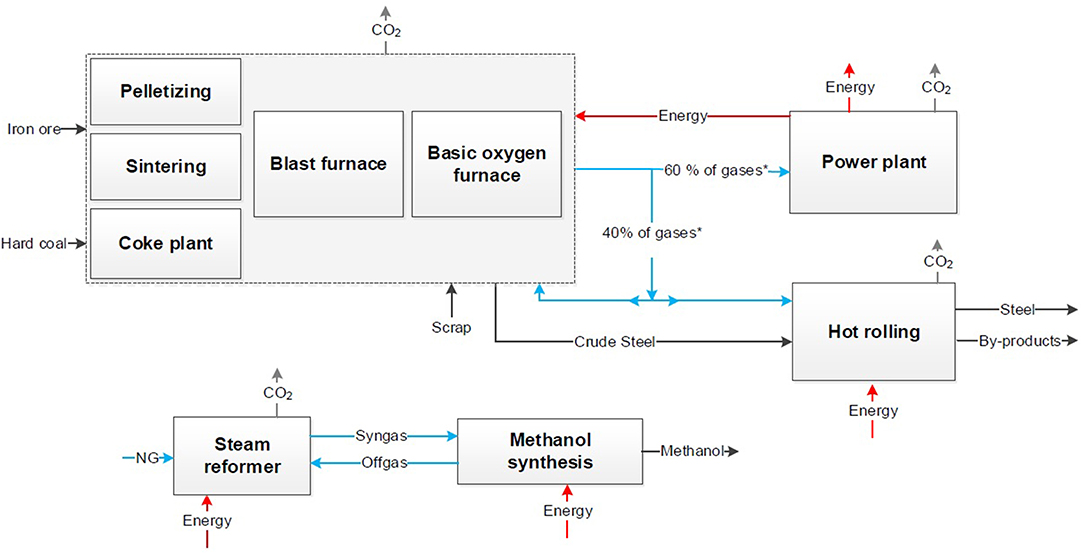
Figure 2. Block flow chart for the conventional processes of steel production (Top) and chemical synthesis (Bottom) derived from dechema (Bazzanella and Ausfelder, 2017).
Conventional Processes
The conventional process of steel production via the blast furnace route is shown at the top in Figure 2. In a coking plant the coal is processed to coke for the blast furnace. In the sinter plant and the pelletizing the iron ore is processed into sinter or pellets. Afterwards the crude steel is produced in the blast furnace, where iron ore is reduced by coke to iron. The liquid crude steel is processed with oxygen in the converter to steel. The following secondary metallurgy result in steel strips, bars or wires. For the comparison hot rolled steel is appropriate to be considered as the final product. About 60 Vol.% of the top gases are combusted in a power plant. Blast furnace gas (BFG) and coke oven gas (COG) are utilized to produce electricity and steam. The rest of the top gases is used internally e.g., for the hot rolling mill or in the blast furnace for preheating.
On the bottom of Figure 2 the conventional processes of methanol production via synthesis gas and urea production via Haber-Bosch process are presented exemplarily for a chemical product out of syngas (Bazzanella and Ausfelder, 2017). In both processes the syngas is produced via steam reforming of natural gas.
Generally, the CO2 emissions can be subdivided in direct and indirect emissions. During the steel production, direct CO2 is emitted after combustion e.g., in the gas power plant or torches. Indirect CO2 is caused by natural gas and coal usage. In the chemical production similarly natural gas causes indirect CO2 burdens as well as direct emissions through reforming of methane. Additional, electrical energy, fuels and steam are necessary for the chemical synthesis and affect both the CO2 and energy balance. Today both the energy and the CO2 balance are based on the single processes and result in a CO2 footprint for steel and a CO2 footprint for the chemical product.
CCU-Approach
To connect the chemical and the steel sector the idea of Carbon2Chem® is to use the top gases as an essential link. Thus, in a second step the CCU approach in a cross industrial network, which is visualized in a block flow chart, is presented in Figure 3.
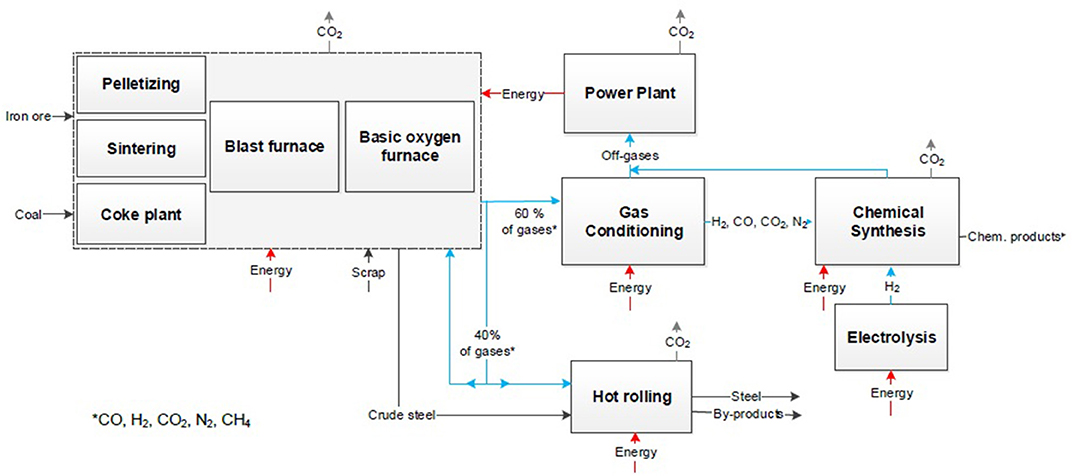
Figure 3. Block flow chart for a CCU process.
The flow chart in Figure 3 shows a complex system of a CCU process. The metallurgical gases like BFG and COG are purified and conditioned in a gas conditioning plant for the following chemical synthesis. Additional hydrogen has to be added depending on the chemical products. The steel is produced via the conventional blast furnace route. Due to the multiple products of the system, a product market basket has to be defined. Subsequent for every product the conventional process (see Figure 2) serves as a comparison.
For the calculation of the CO2 reduction enabled by the CCU process, assumptions and conditions have to be chosen. At first the amount and the composition of used process gases have to be fixed. This represents the maximum reduction potential. Capturing and utilization of 100% of the process gases affects the whole process of steel production due to internal demand. For internal steel processes top gases are used for heating and electricity production. These amounts would have to be substituted by additional electricity from renewables or natural gas.
The composition of gases has an impact on both the energy and the CO2 balance. Due to the ratio of nitrogen (N2), hydrogen (H2), carbon monoxide (CO), and CO2 the attainable amount of the product and the demand of external hydrogen are determined. The ideal reduction potential of the CCU process is reduced by losses in the gas purification and conditioning and by partial conversion during the chemical synthesis due to thermodynamic equilibrium. Additional indirect CO2 emissions occur due to burdens of electrical energy, natural gas or heating. Compared to the conventional process, the emissions of the gas power plant are abolished. In case of burning gases released from chemical synthesis like purge gas in the power plant, the resulting CO2 emissions have to be considered as well.
For the calculation of the energy demand an energy balance of all subunits of the system in Figure 3 is necessary. The integrated steel mill has an energy demand of coal, vapor, natural gas, and electric energy for the coking plant, sintering and pelletizing plant, blast furnace, steel converter, and the secondary metallurgy. The primary energy input is optimized through the integration of COG, BFG, and basic oxygen furnace gas (BOFG) as well as water and heat integration. Further electrical energy is used for the gas conditioning and chemical synthesis through heating and compression as well as for the hydrogen production.
In a third step, the system expansion approach is applied equally to Figure 3 on the CCS and CDA concepts. The same system boundaries of the CCU process are transferred to CCS and CDA processes (see Figures 4, 5) although these are generally regarded for the steel sector only. Here, the conventional chemical synthesis has to be added according to Figure 2 for the comparison resulting in an identical product market basket.
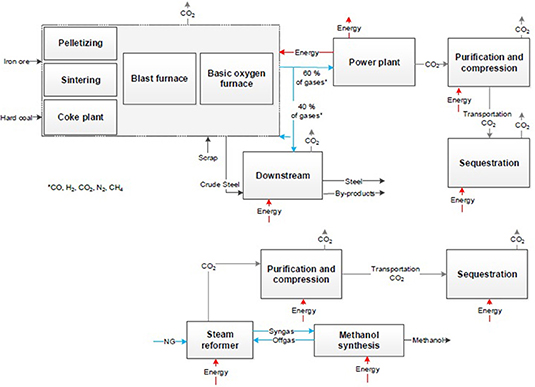
Figure 4. Block flow chart for CCS processes after the steel and the chemical production.
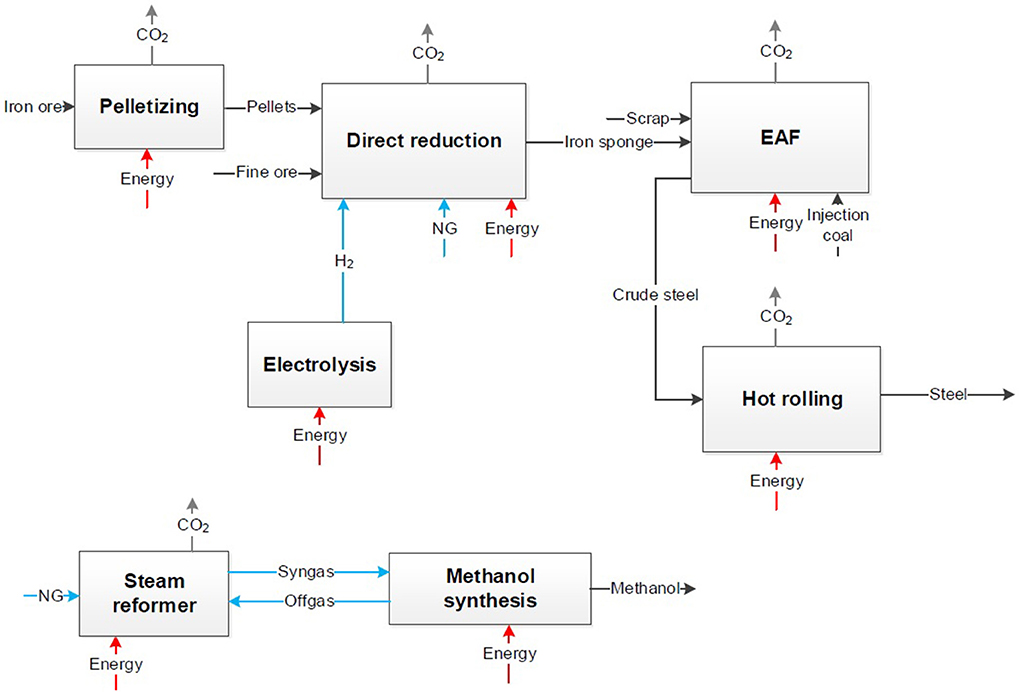
Figure 5. Block flow chart for a CDA process (Top) and the conventional chemical production (Bottom).
CCS-Approach
Figure 4 visualizes the process steps of the CCS approach in the steel industry and the additional conventional chemical process. The conventional steel process of an integrated steel mill is not affected because CCS is best applicable as a post-combustion process after the power plant, because of the highest CO2 concentration and less impurities due to the burning process. All top gases used in the internal processes are not captured in this case similar to the CCU process. These internal used gases are potentially usable for CCS and CCU with a higher effort. The purest CO2 stream is formed during the combustion within the power plant and yields in a concentration of up to 35% (von der Assen et al., 2016). The real CO2 reduction potential is reduced by losses e.g., by purification, transport emissions, and burdens of energy through compression and injection into the ground. To consider the same system boundaries as for the CCU approach the emissions and the energy demand of the conventional chemical production have to be considered according to the amounts of the chemical product synthesized in the CCU process.
CDA-Approach
The same step of applying the system expansion to the CDA approach on the steel and the chemical sector is presented in Figure 5.
Figure 5 presents the steel production via direct reduction of iron ore and a following electric arc furnace (EAF). The primary metallurgy is completely different to the conventional steel process. The iron sponge is produced via direct reduction of iron ore pellets with hydrogen. Pellets or fine ore are inserted with reducing agents to the shaft furnace. For the maximal reduction of CO2 hydrogen as reducing agent with a low CO2 footprint is reasonable and only a minimal use of additional natural gas. It has to be considered that the technology readiness level (TRL) for the use of hydrogen (H2-DRI) as reducing agent is lower compared to the same process based on natural gas (NG-DRI). The use of natural gas in the H2-DRI process is still necessary because of temperature requirements and for a minimum C-content in steel of 1.5% for metallurgical properties (Ravenscroft, 2017). In the EAF the iron sponge is manufactured to crude steel by use of electric energy and under injection of coal for slag foaming. The share of steel scrap in the EAF has to be similar to the share in the oxygen converter to ensure same basic conditions to the BF-route. The secondary metallurgy from crude steel to steel coils or slabs is in both cases comparable. But due to the absence of usable metallurgical gases, the primary energy demand rises. In all process steps electric energy or heating are required and cause in indirect CO2 emissions. Direct CO2 emissions occur in pelletizing, in the shaft furnace for direct reduction due to oxidation of natural gas and in the EAF due to injection coal. To consider the same system boundaries as in the CCU approach the CO2 emissions and the energy demand of the conventional chemical production have to be considered.
Based on the block flow charts (Figures 3–5) of the different CO2 reduction or avoidance strategies, the emissions, the reduction potential, and the energy demand are calculated for the single process steps. Subsequent, schematic bar charts are developed to represent the CO2 reduction and the energy demand of the CCU process. Both the CO2 reduction and the energy demand are presented subdivided in all subunits that have an influence on the CO2 or energy balance. The focus of this article is the systematic structure of the qualitative comparison of the CO2 reduction as well as the energy demand of CO2 reduction strategies. In this way the basis for transparent and comparable technology assessments is created.
Results and Discussion
Meta-Analysis of Technology Assessments for CO2 Reduction
The impact of a CO2 reduction strategy depends on several criteria. The results of the meta-analysis of publications about CO2 reduction strategies like CCU show different methodologies and assessment tools. Both the methodologies and the criteria will be explained more in detail below.
The most common methodology is the definition of transformation pathways. Taking for granted to stay below 2 degree global warming by CO2 reduction, different pathways can be defined to implement the transformation. The definition of these pathways is made via scenario analysis, simulations, energy models, expert discussions or stakeholder workshops, sensitivity analyses or literature researches. A few studies name specific technologies like CCS or CCU which are necessary to implement one pathway. The following points are the key findings concerning the methodology:
• Results of life-cycle-assessments are quoted in one study (Wenzelides and Acatech, 2018).
• Consideration of functional units are used in one study (Bazzanella and Ausfelder, 2017).
Beside these two studies system boundaries are not transparent and therefore difficult to understand:
• Underlying assumptions and boundary conditions are missing
• Focus on single sectors instead of the whole system (Five studies mention “sectorcoupling” (IPCC, 2014; Ausfelder et al., 2017; Bründlinger et al., 2018; Gerbert et al., 2018; Lösch et al., 2018), but three of them only in the context of electricity and heat)
• Missing consideration of upstream chains (Gerbert et al., 2018)
• Possible risks and chances of technologies are only described qualitatively
• No uniform assessment criteria for CO2 reduction approaches. Subsequent the most common criteria of the studies are explored in more detail.
Following the common assessment criteria (i) CO2 reduction potential, (ii) energy demand, and (iii) economic viability are described. The uniform use of the three criteria in the investigated studies is put in question and examples are given. Furthermore, the more uncommon criteria (iv) TRL level, (v) substitution of fossil fuels, (vi) reuse potential, and (vii) social acceptance together with respective consideration in the investigated studies are described.
CO2 reduction (i) is the goal of most of the studies. Still, there is no consistent key performance indicator used in the analyzed studies. In six of the studies the CO2 reduction potential is given in tons per year. Besides that only qualitative statements are made like “low” or “high.” In one study the CO2 demand is calculated as well. In six of the analyzed studies no assertion of CO2 reduction of a special technology is made. Due to the high differences in the methods and assumptions the stated numbers for the CO2 reduction vary, as shown in Table 2.
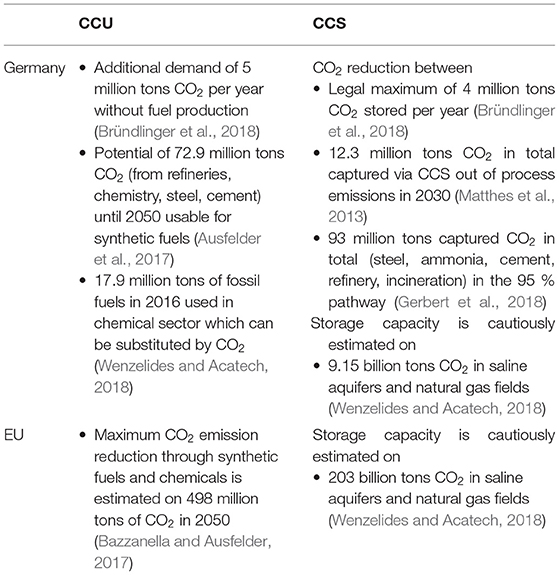
Table 2. CO2 reduction potential of the CCU, CCS, and CDA approach in investigated studies.
The energy demand (ii) is another common criteria to assess and compare technologies. Especially because of the mandatory use of renewable energy, the availability is limited. The calculation in the analyzed studies are highly diverse. In six studies a quantitative statement in relation to energy is made. These figures vary between specific energy demand in MWh per ton of reduced CO2, MWh per ton of product, MWh per ton of steel or hydrogen and finally efficiency losses of power plants and the energy demand for the whole chemical energy in TWh per year. Concerning the production of chemicals or steel there are rare data on the energy demand per ton of product, which are shown in Table 3. The energy demand and the CO2 reduction are of major interest for the stakeholders. Due to different definitions, assumptions and system boundaries the system expansion approach is applied on both these criteria in the last section of the results.
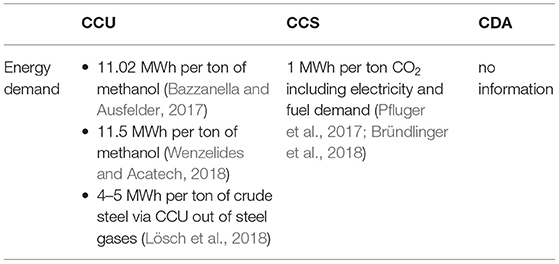
Table 3. Specification of energy demand of the CCU, CCS, and CDA approach in investigated studies.
Beside the energy demand and the CO2 reduction, the economic viability (iii) is often mentioned for a comparison of CCU, CCS, and CDA and highly important for companies and funders. The market potential and costs are therefor used commonly in specific technology assessments (Otto, 2015; Pérez-Fortes and Tzimas, 2016; Kennedy et al., 2017; Hank et al., 2018; Szima and Cormos, 2018). A definition of costs is not applied uniformly in different studies. A widely shared opinion is that the costs for electricity have been found the most relevant cost drivers (Szima and Cormos, 2018). Revenues generated by co-products in case of CCU are often out of the scopes (Lösch et al., 2018) and thereby distort the cost benefit analysis. Costs for infrastructure, like pipelines or availability of renewable electricity through electricity grids are neglected in the considerations. Furthermore, the market potential for CCU, which is connected to the total CO2 reduction potential in many publications is based on the current demand of the products instead of future assumptions. For example in the fuel market the demand of today and of 2030 might differ appreciably because of changes toward climate friendly transport policies. Under these different assumptions and system boundaries the values for costs are incomparable, which is shown by major discrepancies. The range of costs is presented in Table 4.
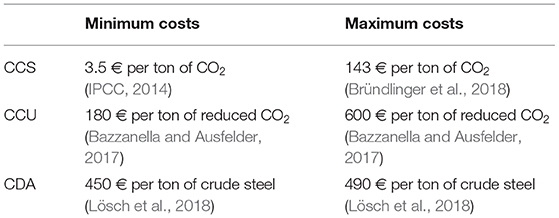
Table 4. Cost ranges for CO2 reduction in the investigated studies.
The criteria costs (iii) and CO2 reduction potential (i) are basis of most of the assessments. To assess the impact of a technology and the success of implementation more in detail; additional criteria have to be found. Therefor a first collection of criteria has been done (see Figure 6).
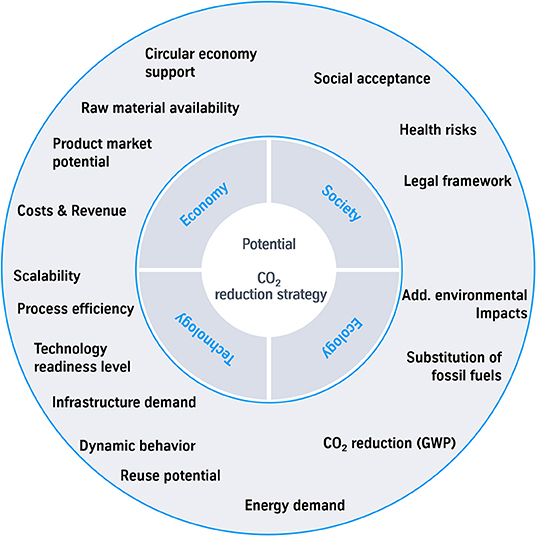
Figure 6. Selection of criteria as an approach for a holistic assessment of the potential of a CO2 reduction strategy.
Some of the less common criteria are described more in detail and the number of mentions in the investigated studies is observed to show the consideration so far.
Technology Readiness Level (TRL)
The TRL (iv) is mentioned in a few assessments (Pérez-Fortes and Tzimas, 2016; Ausfelder et al., 2017; Bazzanella and Ausfelder, 2017; Markewitz et al., 2017; Gerbert et al., 2018). Especially in terms of funding programs a specific TRL is often a prerequisite. The TRL indicates the time required to implement a technology commercially. To stop the climate change, urgent action is necessary. This shows the warning of the global risk report 2018 that puts climate change as the highest risk factor (World Economic Forum, 2018). To estimate the time to a commercial implementation with a significant impact of CO2 reduction different factors have to be considered. These include the TRL, the availability of resources such as energy, as well as legal permits and mandatory infrastructure. The infrastructure demand is for example related to access of green energy, pipelines for transportation of products and raw material like the concentrated and purified CO2 gas streams. Additionally the amount of invest costs and the occurrence of current assets affects the time to commercialization. For example in the steel industry the lifetime of a blast furnace lasts 15–20 years. Thus, the implementation of a new technology with new construction of plants is most promising when a lifetime of a plant is coming to an end.
Substitution of Fossil Fuels
The substitution of fossil fuels (v) in conventional processes by CO2 based carbon feedstock reduces the CO2 emissions if the process emissions for the CCU process are lower than the extraction of coal, gas or oil. The comparison to the conventional process shows the effective CO2 reduction even if the technology is not emission negative by itself (Zimmerman et al., 2018). For example the production of fuels out of CO2 for the transport sector substitutes common fossil fuels even if the CO2 is emitted after the combustion. The substitution of conventional produced electricity by renewable energy sources has to be taken into account in this criteria as well. Especially for the chemical industry the question of resource availability highly important. The organic chemical industry is based on carbon. For the transformation to a low carbon economy, the carbon has to be taken from industrial or biological sources instead of fossil fuels. This aspect of CO2 reduction by substitution is mostly neglected in studies: In the 14 analyzed publications only six mention the criteria substitution of fossil fuels in their studies (Bazzanella and Ausfelder, 2017; IEA, 2017; Bründlinger et al., 2018; Gerbert et al., 2018; Lösch et al., 2018; Lytton, 2018). In case of recapturing the carbon after the use phase, the CO2 reductions are multiplied (Bründlinger et al., 2018; Lösch et al., 2018), which is the attempt of a circular economy. The effort of recapturing the carbon again to replace a raw material has to be investigated for every single technology.
Recycling
Recycling (vi) has an impact on environmental and economic value of a technology. Recycling is applicable on different process steps of a technology. Especially the reuse potential of the product affects the CO2 balance of the life cycle. Yet the reuse potential is not clearly defined and not considered in technology assessments of CO2 reduction strategies. Only in automotive technology assessments and municipal waste treatment reuse is rated (Kröll, 2007; Sadhukhan et al., 2016). In the investigated studies only five mention the terms cycle or circular economy (Ausfelder et al., 2017; Bazzanella and Ausfelder, 2017; Bründlinger et al., 2018; Lösch et al., 2018; Lytton, 2018). The options of reusing the whole product or parts of it have to be considered as well as the kind of disposal: storage in dumps, chemical, or energetic recycling. In case of chemical recycling the decomposition in chemical building blocks is preferred. If only a burning process is applicable, the distribution and concentration of carbon effects the possibility of carbon dioxide recycling. The reuse potential is interesting to assess technologies which are promoting a circular economy. A high reuse potential qualifies the process or product being one part of a closed carbon cycle. In an energetic point of view, a reuse potential is maximized if the carbon is fed back in the cycle as early as possible. A C1 building block needs less energy than the oxidized carbon to be used as a raw material in the circular economy.
Acceptance
Finally the social acceptance (vii) of a technology in the society is a highly critical condition for a commercial implementation. Especially in Germany the examples phasing out nuclear energy or prohibition of fracking have shown the influence of the civil society (Knopf et al., 2011; Drögemüller, 2017; Süptitz and Schlereth, 2017). Considering the global impact of a new technology, the effects on human rights, environmental, and economic risks or chances in the whole value chain are mandatory. Therefor all stakeholders have to be involved in the discussion in case of an implementation. Still only 2 of 14 investigated reports mention acceptance in their results (Schlesinger et al., 2014; Bründlinger et al., 2018). Moreover, Zimmermann confirmed that “social assessment shows low or no representation” in further techno economic assessments (Zimmermann and Schomäcker, 2017). Critical points for the acceptance of the society globally are health, safety, food, and environmental risks, more precisely defined in the sustainable development goals (United Nations, 2015b). Especially in Germany additional critical points are waste treatment and the construction of new infrastructure. The construction of new infrastructure is highly connected to the energy transition in Germany, where the basis are wind turbines, gas pipelines, solar panels and power transmission lines. Further impact factors for social acceptance are high costs for public funded projects and permanent storage approaches like CCS or waste of nuclear energy.
System Expansion
Derived from the analysis of criteria in common technology assessments regarding CO2 reduction strategies, the energy demand and the CO2 reduction potential are criteria of special interest. Thus, the energy and CO2 balance of the CCU, CCS, and CDA approach described in Figures 3–5 are analyzed here. To create a basis for a fair comparison the system expansion approach is used. According to Figure 1, the system expansion is applied on the example of the Carbon2Chem® project with the steel and the chemical sector.
CO2 Reduction
CCU-approach
The starting point is the CCU system shown in Figure 3, where steel production via the conventional blast furnace route and the chemical production are connected. The CO2 emissions of each of the process steps are added for both the steel and the chemical production. Figure 7 illustrates the impact the system expansion approach for the CCU technology regarding CO2 reduction.
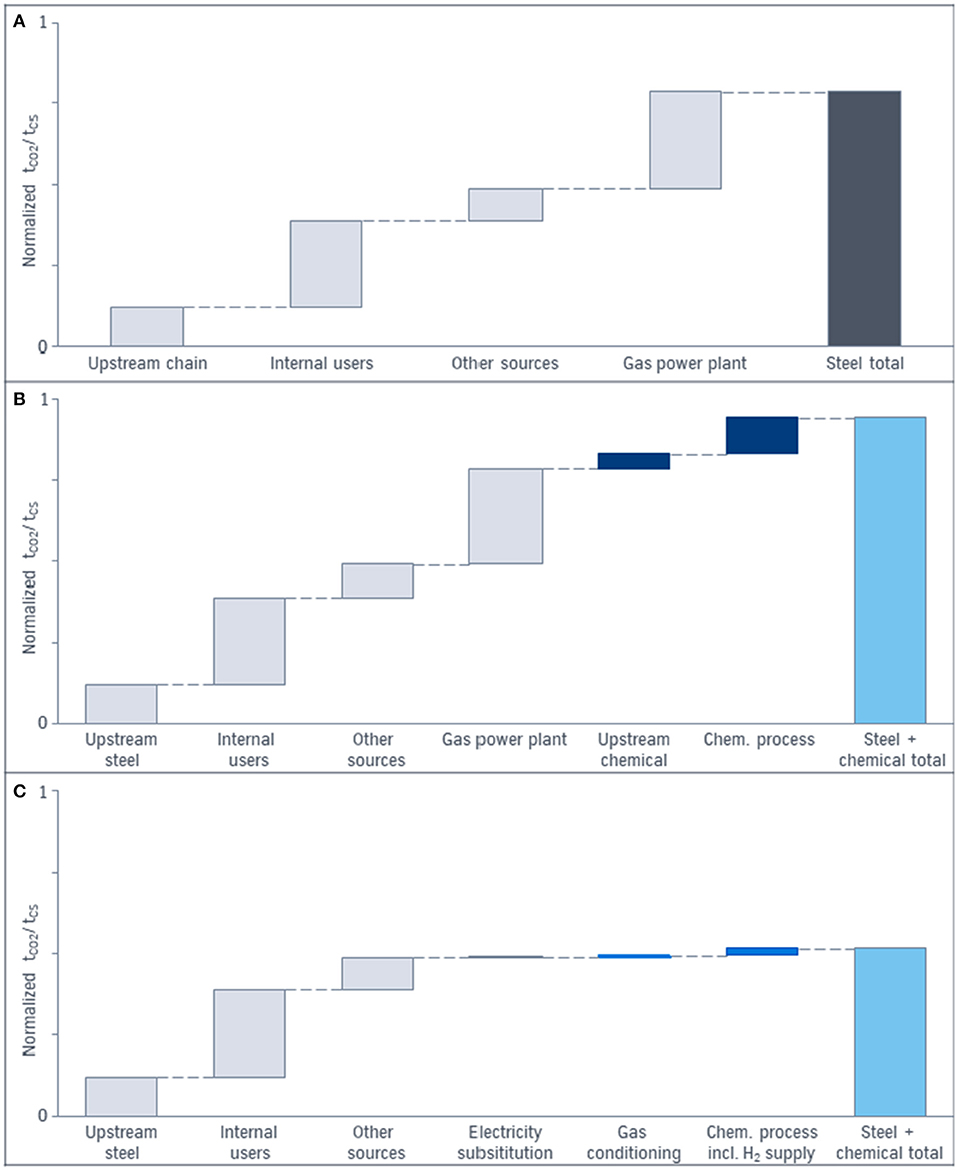
Figure 7. Impact of the system expansion approach considering total CO2 emissions in ton of CO2 per ton of crude steel: (A) CO2 emissions of the conventional blast furnace route (gray). (B) CO2 emissions of the conventional steel (gray) and conventional chemical production (dark blue). (C) CO2 emissions of the CCU process including the blast furnace route (left gray bars) and the chemical production via utilization of top gases (dark blue bars). Wind power as electricity source is assumed.
The light blue bars on the right in Figure 7 represent the summed up CO2 emissions of all process steps of the different systems. In the diagram on the top (a) the single sector view for conventional steel production via blast furnace route is shown. The direct CO2 emissions per ton of crude steel are separated in emissions due to internal users like the cowpers, diffuse CO2 emissions and concentrated CO2 emissions after the power plant. The diagram (b) presents the application of the system expansion approach and considers CO2 emission of the conventional steel production (gray) plus the CO2 emissions due to the feedstock and the process of a conventional chemical plant (dark blue bars). The total CO2 emissions (light blue) serve as base case for the comparison with the CCU result. Diagram (c) demonstrates the CO2 emissions of the CCU approach: The light blue bar on the right represents the total CO2 emissions due to non-avoided, or additional emitted CO2 of the whole CCU system with steel and a chemical product in the product basket. The gray bar represents the unavoidable CO2 emissions of the steel production under the assumptions taken in Figure 2 that only the top gases burned for electricity generation are used for CCU. Increased use of top gases in CCU technologies—as well as in CCS—leads to higher modifications of the process and higher investment and/or conversion costs. To increase the amount of usable gases either more capture units are necessary to cover the distributed CO2 sources behind the subunits of the steel production or the gas is redirected in front of the subunits and the heating processes have to be substituted with electric power. Due to the shutdown of the power plant, the electricity has to be substituted (gray). Utilization of chemical off-gases in the power plant is not included here. The blue bars in the middle represent either the direct or indirect emitted CO2 for purification, compression, and conditioning of the top gases and the subsequent chemical synthesis. The right blue bar includes the hydrogen production via electrolysis. Here, for the electricity supply wind park energy is considered. In case of the emission factor of 2018 in Germany the CO2 emissions are multiplied enormously. The CO2 amount of the chemical productions in (b) and (c) is scaled according to the ratio ton of product per ton of crude steel. Nevertheless, the amount and the quality of the product is identical in (b) and (c). The size of the bars can vary with the chemical product and product specific assumptions. The bars of Figure 7 are based on methanol as a chemical product. In case of recycling or multiple use of the chemical product it is possible to reduce the CO2 emissions furthermore.
Due to the combination of the blast furnace route with CCU the CO2 balance of steel is already improved compared to (a), because renewable electricity is used instead of power from the gas power plant. But the difference between (a) and (b) demonstrates the error if the steel sector only serves as a comparison instead of the total system steel plus chemistry. The qualitative diagrams of Figure 7 shows ~50% decrease of emitted CO2 for the CCU approach (c) compared to the conventional routes (b) if system expansion is applied. The decrease illustrates the potential of CCU for CO2 reduction under specific conditions and not in general.
CCS-approach
The CCS approach according to Figure 4 is extended from the steel to the chemical process analog to CCU. But so far only the single processes of e.g., coal power plants or steel plants have been considered in terms of CO2 storage. For that reason Figure 4 shows only a theoretical system of CCS for steel and chemical waste gases and a plausible calculation of the actual CO2 reduction potential is not possible. In case of applying the system expansion to CCS under present conditions, the emissions of the conventional chemical process have to be added, but the theoretical CCS potential is not represented. Furthermore, the aim of reduction of fossil fuels as feedstock e.g., in the chemical sector is not accomplished anyway.
CDA-approach
The CDA approach is a solution for CO2 reduction in single sectors. As shown in Figure 5, the direct reduction of iron ore by hydrogen is the CDA technology for the steel sector. Due to the system expansion, the chemical sector has to be added. The problem is that so far no approach except biomass feedstock for direct avoidance exists in the chemical sector, because the production is based on carbon feedstock. Therefor a stringent CO2 reduction potential for CDA is not calculated here. In case of adding the emissions of the conventional process to generate the identical product market basket, the problem of fossil fuels is not solved.
Energy Demand
To assess the energy demand of the CO2 reduction strategies again the system expansion is applied.
CCU-approach
To increase the transparency of the energy demand calculation, the CCU approach is subdivided in the subunits according to Figure 3. The results are represented in Figure 8.
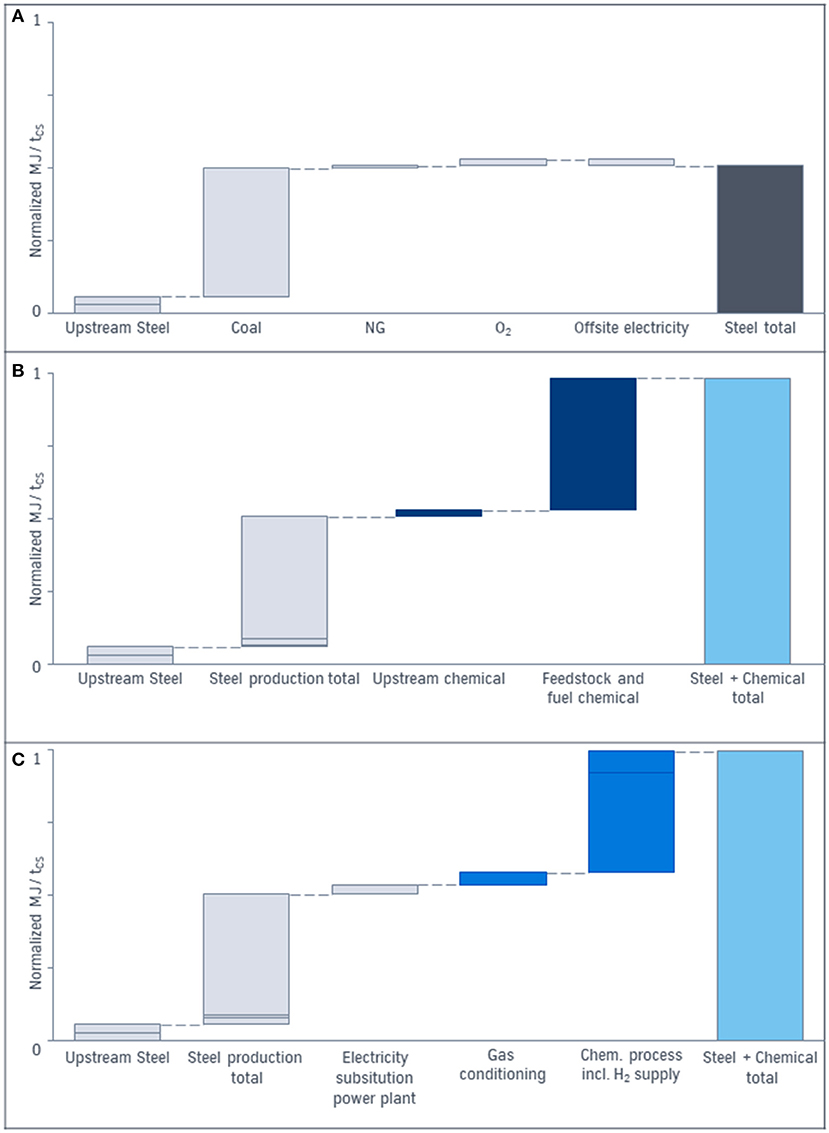
Figure 8. (A) Energy demand in MJ per ton of crude steel of the conventional production of steel only. (B) Energy demand in MJ per ton of crude steel of the conventional steel and chemical production. (C) Energy demand in MJ per ton of crude steel of the CCU process. The total energy demand (light blue) is the result of energy demand of all subunits.
The total energy demand per ton of crude steel of the conventional process for steel [gray bars in (a)] is often compared with the energy demand of the CCU approach. Due to the system expansion approach the energy demand of the chemical process (dark blue) has to be added (b). The energy demand of the CCU approach leading to the same product basket is demonstrated in (c). The considered energy includes the energy content of the feedstock e.g., coal or natural gas as well as the upstream energy for the production of coal, iron ore and natural gas, the energy content of the top gases, demand for steam, fuels, and electricity for an integrated steelmill and for a separated chemical process. In contrast to the base case (b) the energy demand on (c) represents the integration of chemical and steel production via CCU: For the steel energy demand (gray) the electricity generated in the power plant out of top gases in the base case has to be substituted by renewable energy in the CCU process. For the chemical process out of topgases (blue) compression and purification (gas conditioning), hydrogen production via electrolysis and steam demand influence the energy demand. The comparison of the total energy demand (light blue) for CCU and the conventional process via system expansion indicates similar levels.
As described for the CO2 reduction of the CDA and the CCS approach above, both strategies are not applied yet on the chemical sector. For a comparison the energy demand of CCU, CCS, and CDA, the conventional chemical production has to be added or the energetic value of the product has to be subtracted of the energy balance of the CCU process, which both would affect the total energy demand of the system.
The application of the system expansion on energy balance of the steel and chemical sector demonstrates again explicitly the impact of the system boundaries. The conclusions on the energy demand of the base case are significantly different without consideration of the chemical sector.
Conclusion
Within this publication various studies on the carbon capture and carbon avoidance technologies have been presented. The main evaluation criteria for the different underlying technologies were analyzed: CO2 reduction potential and energy demand. The shown discrepancy of carbon reduction potential and energy demand in the investigated studies shows the necessity of a comparison on system level. The view on only single sectors like steel production gives a misleading conclusion concerning the effectiveness of the applied approach. This is presented by the comparison of the CCU approach including the steel and the chemical production with the single sector of steel production. The results of this work show that the system expansion approach is applicable for CCU. A major requirement is the consideration of an equal product market basket. Technologies have to be compared by their holistic impact, which means (i) equal system boundaries and assumptions as well as (ii) representative criteria applied on a circular economy.
The strong impact of the system expansion application on CO2 reduction potential has been demonstrated, comparing only the steel sector to the CCU approach. In this case, the CO2 reduction potential is only about 20%. Under consideration of an equal product basket the CO2 reduction potential increases to about 50%. Furthermore, in case of increased amount of utilized top gases the CO2 reduction potential can be expanded proportionally. The impact of the correct system boundaries is equally demonstrated for the energy demand. There is no difference in the energy demand for both the CCU and the conventional processes. But by incorrect consideration of the sole steel sector as a base case, the conclusion would be an increased energy demand for CCU. For CCS and CDA the aim of an optimum on system level has not been carefully considered so far in literature. In the conventional processes either in the steel or in the chemical sector fossil fuels still occur. For a fair comparison of the CO2 reduction potential and the energy demand of the different strategies—CCU, CCS, and CDA—a calculation based on system expansion with consistent conditions is indispensable.
Additionally, the influence of including upstream chains into the system boundaries is demonstrated for the CO2 reduction as well as the energy balance for all strategies affecting the feedstock. Due to substitution of natural gas as the chemical feedstock, the CCU approach reduces CO2 and energy demand in the upstream chain. Due to the fact that the electricity supply of the integrated system has to be shifted from fossil to renewable sources in all cases renewable energy supply is crucial. Finally the availability of renewable energy is one leading factor concerning the implementation of CO2 reduction technologies.
For a holistic comparison of the different CO2 reduction strategies—CDA, CCS, and CCU—a general methodology beyond CO2 reduction and energy demand is mandatory. Recent literature reveals gaps in stringent methodology and in addressing technological, economic, environmental, and social aspects. The impact of a CO2 reduction strategy is determined by ecological, economical, technological, and social criteria, which cannot be considered separately. Especially in case of circular economy the assessment has to consider the whole system instead of single value chains. Mandatory criteria for depiction of a circular economy like reuse potential and substitution of fossil fuels are introduced and additional criteria are under discussion. In this work representative criteria like technology readiness level and social acceptance have been evaluated. The impact and relevance of these criteria have to be analyzed more in detail, applied on case studies of specific technologies and validated by experts. Furthermore, the completeness of criteria is not examined so far. To confirm the conclusions and develop a multi criteria methodology for a holistic comparison of the different CO2 reduction strategies, expert interviews with differentiated perspectives of stakeholders provide a solution.
Data Availability Statement
The datasets generated for this study are available on request to the corresponding author.
Author Contributions
All authors contributed conception and design of the study. WL and TW organized the literature and the analyzed studies for the meta-analysis. The CCU approach based on the Carbon2Chem® example was invented by MO and is coordinated within the project by MO and GD. The calculation of energy and CO2 balances was done by TW and verified by WL, GD, and MO. TW wrote the first draft of the manuscript. WL wrote sections of the manuscript. All authors contributed to manuscript revision, read and approved the submitted version.
Funding
The authors would like to thank the Federal Ministry of Education and Research for funding the project Carbon2Chem® (03EK3037A).
Conflict of Interest
TW, WL, and MO are employed by thyssenkrupp AG.
The remaining author declares that the research was conducted in the absence of any commercial or financial relationships that could be construed as a potential conflict of interest.
References
Ausfelder, D., Erlach, B., Fischedick, M., Henning, H. M., Kost, C., Münch, W., et al. (2017). Sektorkopplung – Untersuchungen und Überlegungen zur Entwicklung Eines Integrierten Energiesystems (Schriftenreihe Energiesysteme der Zukunft). München: DECHEMA e.V.
Bazzanella, A. M., and Ausfelder, F. (2009). CO2 - und was nun? Technische optionen für den umgang mit CO2. Chem. Ing. Tech. 81, 1565–1573. doi: 10.1002/cite.200900072
Bazzanella, A. M., and Ausfelder, F. (2017). DECHEMA Gesellschaft für Chemische Technik und Biotechnologie e.V. Low Carbon Energy and Feedstock for the European Chemical Industry. Frankfurt: Deutsche Energie-Agentur GmbH (Dena).
Bründlinger, T., Elizalde-König, J., Frank, O., Gründig, D., Jugel, C., Kraft, P., et al. (2018). Dena-Leitstudie Integrierte Energiewende. Berlin: Metabolic.
Drögemüller, C. (2017). Schlüsselakteure der Endlager-Governance: Entsorgungsoptionen und -Strategien Radioaktiver Abfälle Aus Sicht Regionaler Akteure. Berlin: Freie Universität Berlin.
European Commission Joint Research Centre (2010). Institute for Environment and Sustainability: International Reference Life Cycle Data System (ILCD) Handbook - General Guide for Life Cycle Assessment - Detailed Guidance 1st Edn. EUR 24708 EN. Luxembourg: Publications Office of the European Union.
Gerbert, P., Herhold, P., Buchardt, J., Schönberger, S., Rechenmacher, F., Kirchner, A., et al. (2018). Klimapfade für Deutschland. Berlin: Bundesverbandes der Deutschen Industrie e.V. (BDI).
Hank, C., Gelpke, S., Schnabl, A., White, R. J., Full, J., Wiebe, N., et al. (2018). Economics & carbon dioxide avoidance cost of methanol production based on renewable hydrogen and recycled carbon dioxide – power-to-methanol. Sustain. Energy Fuels 2, 1244–1261. doi: 10.1039/C8SE00032H
Kennedy, E., Sabag, O., Gladek, E., Thorin, T., Mason, T., Moroney, M., et al. (2017). CORESYM: CarbOn-Monoxide Re-use Through Industrial SYMbiosis Between Steel and Chemical Industries. Amsterdam: Shell.
Knopf, B., Kondziella, H., Pahle, M., Götz, M., Bruckner, T., and Edenhofer, O. (2011). Der Einstieg in den Ausstieg: Energiepolitische Szenarien für Einen Atomausstieg in Deutschland. Bonn: Abteilung Wirtschafts- und Sozialpolitik der Friedrich-Ebert-Stiftung.
Kröll, M. (2007). Methode zur Technologiebewertung für Eine Ergebnisorientierte Produktentwicklung. Stuttgart: Universität Stuttgart.
Kublik, F., Stones, A., von Glischinski-Kurc, M., Khong, C., Borggreve, A., and Whysall, J. (2017). Shell Energieszenarien. Deutschland: IREES GmbH.
Lösch, O., Toro, F., Belbin, N. A., Reitze, F., Schön, M., and Institut für Ressourceneffizienz und Energiestrategien GmbH (IREES) (2018). Prozessemissionen in der Deutschen INDUSTRIE und Ihre Bedeutung für die Nationalen Klima-Schutzziele – Problemdarstellung und Erste Lösungsansätze. Karlsruhe: Umweltbundesamt.
Markewitz, P., Zhao, L., and Robinius, M. (2017). “Technologiebericht 2.3 CO2- abscheidung und speicherung (CCS),” in Technologien für die Energiewende, eds Wuppertal Institut, ISI, IZES (Hrsg.) (Wuppertal; Karlsruhe; Saarbrücken: Teilbericht 2 an das Bundesministerium für Wirtschaft und Energie (BMWi).
Matthes, F., Busche, J., Döring, U., Emele, L., Gores, S., Harthan, R. O., et al. (2013). Politikszenarien für den Klimaschutz VI. Dessau-Roßlau.
Oles, M., Lüke, W., Kleinschmidt, R., Büker, K., Weddige, H. J., Schmöle, P., et al. (2018). Carbon2Chem® – ein cross-industrieller ansatz zur reduzierung der treibhausgas-emissionen. Chem. Ing. Tech. 90, 169–178. doi: 10.1002/cite.201700112
Otto, A. (2015). Chemische, Verfahrenstechnische und Ökonomische Bewertung von Kohlendioxid als Rohstoff in der Chemischen Industrie. Aachen: Rheinisch-Westfälischen Technischen Hochschule.
Pérez-Fortes, M., and Tzimas, E. (2016). Techno-economic and environmental evaluation of CO2 utilisation for fuel production: synthesis of methanol and formic acid. Appl. Energy 161, 718–732. doi: 10.1016/j.apenergy.2015.07.067
Pfluger, B., Tersteegen, B., Franke, C., Bernath, T., Boßmann, G., Deac, R., et al. (2017). “Langfristszenarien für die transformation des energiesystems in Deutschland,” in Modul 3: Referenzszenario und Basisszenario (Berlin), 44. Available online at: http://publica.fraunhofer.de/eprints/urn_nbn_de_0011-n-4810927.pdf (accessed December 20, 2019).
Ravenscroft, C. M. (2017). Direct From Midrex by Midrex Technologies, Inc. Available online at: http://www.midrex.com/wp-content/uploads/Midrex_2017_DFM3QTR_FinalPrint.pdf (accessed February 28, 2019).
Sadhukhan, J., Siew Ng, K., and Martinez-Hernandez, E. (2016). Novel integrated mechanical biological chemical treatment (MBCT) systems for the production of levulinic acid from fraction of municipal solid waste: a comprehensive techno-economic analysis. Bioresour. Technol. 215, 131–143. doi: 10.1016/j.biortech.2016.04.030
Schlesinger, M., Hofer, P., Kemmler, A., Kirchner, A., Koziel, S., Ley, A., et al. (2014). Entwicklung der Energiemärkte. Basel: Osnabrück Köln.
Süptitz, J., and Schlereth, C. (2017). Fracking: messung der gesellschaftlichen akzeptanz und der wirkung akzeptanzsteigernder massnahmen. Schmalenbachs Z. Betriebswirtsch. Forsch. 69, 405–439. doi: 10.1007/s41471-017-0035-z
Szima, S., and Cormos, C. (2018). Improving methanol synthesis from carbon-free H2 and captured CO2: a techno-economic and environmental evaluation. J. CO2 Util. 24, 555–563. doi: 10.1016/j.jcou.2018.02.007
United Nations (2015a). “Adoption of the paris agreement,” in Framework Convention on Climate Change. Paris: United Nations. Available online at: https://unfccc.int/files/essential_background/convention/application/pdf/english_paris_agreement.pdf (accessed December 20, 2019).
United Nations (2015b). Sustainable Development Goals. Available online at: https://sustainabledevelopment.un.org/?menu=1300 (accessed February 28, 2019).
von der Assen, N., Müller, L. J., Steingrube, A., Voll, P., and Bardow, A. (2016). Selecting CO2 sources for CO2 utilization by environmental-merit-order curves. Environ. Sci. Technol. 50, 1093–1101. doi: 10.1021/acs.est.5b03474
Wenzelides, M., and Acatech (2018). CCU und CCS – Bausteine für den Klimaschutz in der Industrie (Acatech POSITION). München: Herbert Utz Verlag.
Wohlfarth, K., Schlomann, B., Jochem, E., Reitze, F., Schön, M., and Felipe Toro Institut für Ressourceneffizienz und Energiestrategien IREES (2016). Sektorale Emissionspfade in Deutschland bis 2050- Sektoren Gewerbe. Karlsruhe: Handel, Dienstleistungen (GHD) und Industrie.
Zimmerman, A., Wunderlich, J., Buchner, G., Müller, L., Armstrong, K., Michailos, S., et al. (2018). Techno-Economic Assessment & Life-Cycle Assessment Guidelines for CO2 Utilization. Global CO2 Initiative.
Keywords: carbon capture and utilization, CCU, carbon circular economy, Carbon2Chem, cross-industrial network, system boundaries, system expansion, CO2 reduction
Citation: Wich T, Lueke W, Deerberg G and Oles M (2020) Carbon2Chem®-CCU as a Step Toward a Circular Economy. Front. Energy Res. 7:162. doi: 10.3389/fenrg.2019.00162
Received: 13 June 2019; Accepted: 16 December 2019;
Published: 14 January 2020.
Edited by:
Angela Dibenedetto, University of Bari Aldo Moro, ItalyReviewed by:
Xuezhong He, Norwegian University of Science and Technology, NorwayEduardo René Perez Gonzalez, São Paulo State University, Brazil
Copyright © 2020 Wich, Lueke, Deerberg and Oles. This is an open-access article distributed under the terms of the Creative Commons Attribution License (CC BY). The use, distribution or reproduction in other forums is permitted, provided the original author(s) and the copyright owner(s) are credited and that the original publication in this journal is cited, in accordance with accepted academic practice. No use, distribution or reproduction is permitted which does not comply with these terms.
*Correspondence: Teresa Wich, dGVyZXNhLndpY2hAdGh5c3NlbmtydXBwLmNvbQ==