 Didier Devaux
 Hugo Leduc
 Philippe Dumaz1
 Renaud Bouchet
- 1Univ. Grenoble Alpes, Univ. Savoie Mont Blanc, CNRS, Grenoble INP, LEPMI, Grenoble, France
- 2Blue Solutions, Odet, Ergué Gabéric, Quimper, France
The energy conversion and storage are great challenges for our society. Despite the progress accomplished by the Lithium(Li)-ion technology based on flammable liquid electrolyte, their intrinsic instability is the strong safety issue for large scale applications. The use of solid polymer electrolytes (SPEs) is an adequate solution in terms of safety and energy density. To increase the energy density (resp. specific energy) of the batteries, the positive electrode thickness must be augmented. However, as for Li-ion liquid electrolyte, the cationic transference number of SPEs is low, typically below 0.2, which limits their power performance because of the formation of strong gradient of concentration throughout the battery. Thus, for a given battery system a compromise between the energy density and the power has to be found in a rapid manner. The goal of this study is to propose a simple efficient methodology to optimize the thickness of the SPE and the positive electrode based on charge transport parameters, which allows to determine the effective limiting Li+ diffusion coefficient. First, we rapidly establish the battery power performance thanks to a specific discharge protocol. Then, by using an approach based on the Sand equation a limiting current density is determined. A unique mother curve of the capacity as a function of the limiting current density is obtained whatever the electrode and electrolyte thicknesses. Finally, the effective limiting diffusion coefficient is estimated which in turn allows to design the best electrode depending on electrolyte thickness.
Introduction
Batteries are one of the most widely used electrochemical energy storage devices thanks to their high energy permitting to operate devices for a long period of time (Kim et al., 2015). The Lithium (Li)-ion system is the predominant solution to power many applications from small electronic devices to electric cars (Kurzweil and Garche, 2017). As the demand in energy output from consumers is constantly increasing new battery systems must be developed and optimized depending on the application requirements. In this context Li metal is an ideal as negative electrode due to its high specific capacity, and low operating voltage (Xu et al., 2014). However, in combination with a conventional liquid electrolyte, the Li electrodeposits on the metallic Li are uneven giving rises to low Coulombic efficiency and dendrite growth (Tarascon and Armand, 2001; Wu et al., 2019). Replacing the liquid electrolyte by a solid polymer electrolyte (SPE) permits to envision safe high energy density batteries (Armand, 1994; Agrawal and Pandey, 2008).
In term of design, a practical Li metal battery stack should be optimized through its positive electrode formulation and overall material assembly notably to reduce the cost per elemental cell (Gallagher et al., 2014). The goal being to produce a long lasting battery with high rate performance to obtain extended specific energy (Eftekhari, 2017; Schnell et al., 2018; Zeng et al., 2019). Regarding the SPE, enough ionic conductivity in the order of 1 mS.cm−1 is obtained at 80°C for PEO-based electrolyte (Devaux et al., 2012). PEO possesses mechanical properties and flexibility high enough to be processed by hot-pressing, extrusion, or solvent-casting methods to form of thin films ranging from 10 to 100 μm (Baudry et al., 1997; Porcarelli et al., 2016; Schnell et al., 2018; Yang et al., 2019). The goals being to minimize the SPE thickness to reduce ohmic loss and to increase the diffusion limited current density during battery operation. Moreover, PEO possesses other advantages such as a good adhesion, and electrochemical and chemical stability toward metallic Li (Armand, 1983). Indeed, PEO is usually used as a fundamental SPE brick which will also contain other polymers or additives to improve the desired properties-transport number, mechanical strength, electrochemical window, etc. (Bouchet et al., 2013; Zhang et al., 2017). LiFePO4 is a reference candidate as positive active materials thanks to its bi-phased redox reaction at about 3.43 V vs. Li+/Li° which ensures safety (Padhi et al., 1997). At last, for a given electrode formulation, the energy density is directly linked to the active material loading (Du et al., 2017). So, for a given active material, increasing the electrode thickness is the simplest way to reach higher specific energy.
The electrode formulation is of importance through the loading of active material and the electrode porosity to reach the best power performance at an optimal electrode thickness (Newman, 1995; Yu et al., 2006, 2013). Zheng et al. reported on positive electrodes made of LiNi1/3Co1/3Mn1/3O2 (NCM) or LiFePO4 and showed that Li ion diffusion within the electrolyte in the electrode was the limiting discharge process (Zheng et al., 2012). Interestingly, they showed that the specific C-rate at which capacity starts to drop is representative to the overall battery rate performance. The electrode capacity, and thus active material loading, follows a negative power law, with the C-rate. Therefore, as expected low loaded electrodes provide higher rate performance than their higher loaded counterparts. A similar conclusion was substantially drawn by Gallagher et al. who combined experimental and simulation approaches and Heubner et al. on thick NCM electrodes (Gallagher et al., 2016; Heubner et al., 2019). In consequence, the ionic diffusion processes at stake in a battery system must be fully characterized as it governs the battery voltage divergence before the full recovery of the capacity because the Li-ion concentration reaches a null concentration at the cathode. All other electrochemical processes (ion and electron migration, charge transfer, etc.) are mostly related to “ohmic” drops which simply increase the battery polarization when the rate increases.
Typically, the relationship between discharge capacity and C-rate is similar for each battery technology. At low C-rate, the capacity is maximal and constant. At C-rate higher than a threshold value, the capacity falls rapidly (Gallagher et al., 2016). This behavior limits the high rate capabilities in terms of rapid charge and fast discharge (Doyle and Newman, 1997; Kang and Ceder, 2009). In literature a series of empirical and semi-empirical equations based on a phenomenological stretched exponential decay function have been developed to fit the sigmoidal shape of the capacity-C/rate curve (Gallagher et al., 2016; Wong et al., 2017; Heubner et al., 2018b; Tian et al., 2019). The physical meaning behind these equations is to consider a time dependent relaxation process describing herein a single rate limiting diffusion phenomena. So, those equations use as main parameters (i) a time constant and (ii) an empirical exponent value to stretch the exponential function. The meaning of the exponent is unclear as some studies set this parameter to a constant value of 2 or let it free to get better fits. The uncertainty regarding this empirical parameter is similar to that encounter with the Peukert exponent (Doerffel and Sharkh, 2006).
Therefore, ionic diffusion in the electrolyte, and within the active materials are known to be the major physical limitations that affect the battery rate capability (Jiang and Peng, 2016). Thus by coupling experimental and simulation analysis, many studies aim to improve power and energy from the single cell to the stack level (Yu et al., 2006; Safari and Delacourt, 2011; Singh et al., 2015). The mostly accepted theoretical model is the one developed by Newman and coworker based on concentrated solution theory (Doyle et al., 1993; Fuller et al., 1994; Newman, 1995; Srinivasan and Newman, 2004). A complete description of a given battery system is required to fit the cycling data which requires numerous parameters. Some of these parameters such as transference number, ionic diffusion coefficients, thermodynamic factors or tortuosity, to cite a few, are difficult to obtain properly as their determination is rather tough and non-univocal which can lead to large approximation. In addition, each set of parameters has to be determined again each time a chemical modification is made (additives, binders, electrode formulation, active materials…) which can be time consuming.
In practice, the fast determination of the discharge capacity depending on the C-rate is of interest to screen series of batteries in which many parameters are tuned such as the porosity, the formulation, and the active material loading of electrodes or even the nature of the current collectors. Back in 1994, a protocol was proposed composed of successive discharges starting from the highest C-rate down to the lowest without charging step in between (Doyle et al., 1994). More recently, Heubner et al. presented a methodology based on chronoamperometry measurement (Heubner et al., 2018a). Starting from charged Li-ion batteries, instead of applying a constant current as discharge step a constant voltage step at the lower battery cut-off voltage is performed. The transitory current recorded is then converted through the current-time integration into relative capacity. This method, a slow charge plus the chronoamperometry, takes about a dozen of hours to complete, but presents some limitations to fully capture the battery capacity when the active materials go through different phase change in charge (resp. in discharge). As pointed out by the authors, a typical example of such material is LiFePO4 with a two-phase mechanism.
Herein, firstly, to reduce the time-consuming measures necessary to test battery power depending on all the parameters a cycling procedure similar to that of Doyle et al. is used (Doyle et al., 1994). Through this rapid cycling routine, the relationship between discharge capacity and current density is determined with a good accuracy at least 8 times faster than conventional galvanostatic charge-discharge cycles alternation. Then, we propose two complementary methodologies to quickly estimate the effective diffusion coefficient of the rate limiting process at stake which allows by comparing it to the diffusion coefficient into the electrolyte or active material particles, to identify which component can be optimized. Those methodologies are based on limiting current and Sand time (Sand, 1901; Bard and Faulkner, 2001). For this purpose model all-solid-state batteries made of Li metal, PEO based electrolyte acting as SPE, and LFP-based positive electrode were used. By keeping the negative electrode in excess, the interplay between positive electrode and SPE thicknesses is finely understood and general rules are provided to pinpoint toward the optimal balance in thicknesses between SPE and positive electrode. The goal being to provide a simple physical interpretation of practical power signature curves based on the Sand's equation, which permits the determination of the effective limiting diffusion processes in real system.
Experimental
The metallic Li foil was provided by the company Blue Solutions. The Li was stored in an Argon filled glove box (Campus, Jacomex) with sub-ppm values of H2O and O2. The solid polymer electrolyte (SPE) is a random copolymer comprising PEO to ensure ionic motion and poly(propylene oxide) to provide flexibility to the resulting membrane, and doped with lithium bis-trifluoromethanesulfonimide (LiTFSI) salt. The concentration of Li salt was added to reach a molar ratio of ethylene oxide to Li salt of 25. The Li salt and Li metal foil are stored in an Argon filled glove box (Campus, Jacomex) with sub ppm value of H20 and O2. The polymer and LiTFSI were dissolved in Dimethylformamide (DMF) by stirring at 350 rpm and 80°C for 3 h in a vial. When the solution was clear and transparent, it was cast onto Petri dish made of Teflon and let dry at ambient temperature (T) for 8 h. Then, to remove the solvent, the Petri dish was placed in an oven at 60°C for at least 3 days. The resulting SPE membrane was peeled off the Teflon substrate and placed inside the Ar glove box for at least a week prior any further manipulation. Still inside the glove box, SPEs were cut into wide pieces and several of them placed in a hot press. The SPEs were then pressed for several minutes à 80°C at 200 bars while adjusting the SPE quantity. After pressing and cooling, SPE disks were punch out from the pressed SPE pieces. This lead to SPE disk with thickness (y) of 18, 36, 54, 108, and 216 μm. Low porosity (<5%) positive electrodes using LiFeO4 as active materials were specifically prepared by Blue Solutions through an extrusion process. The thickness of the positive electrode (x) were 20, 33, 48, and 60 μm on top of an Al current collector. The capacities of the electrodes are proportional to their thicknesses.
Inside the globe box, a Li disk of 14 mm diameter was punch out from the Li foil. Then, a layer of SPE was also cut in a disk shape of 16 mm in diameter. The two materials were laminated at 80°C and 3 bars multiple times using a home-made laminating machine until the SPE was fully adherent to the Li. The electrolyte thickness was checked after the laminating process and no variation was observed. A 12 mm diameter positive electrode disk was also punch out from the electrode foil. Several passages through the laminating machine were done to ensure adhesion between the three material layers composing the Li metal polymer battery. The battery assemblies were varied in terms of positive electrode and SPE thicknesses. So, all along the text, the Li Metal Polymer (LMP) batteries are denoted LMP(x-y) with x and y corresponding to the electrode and SPE thicknesses, respectively. For each LMP(x-y) system, between 4 and 6 replicates were assembled.
After assembly, the battery was placed inside a stainless steel CR2032 coin cell using stainless steel shims and a wave spring. The coin cell was sealed using a crimping machine inside the glove box. On average 1.2 bars are applied to the battery assembly with an active surface S corresponding to the positive electrode geometrical surface. Then, the battery cells were taken out of the glove box and placed on coin cell holder. The coin cells were put inside an oven (Memmert) held at 80°C and connected to a VMP3 (Bio-Logic SAS) multi-potentiostat with impedance capability.
The cycling procedure consists in a series of charge-discharge galvanostatic cycles in between 2.5 and 3.7 V vs. Li+/Li°. All along the text the battery potential E is referred to the Li+/Li° couple. Initially, the batteries are subjected to 8 conditioning cycles at a low current density (J0) identical in charge and discharge so that the delivered specific capacity corresponds to the effective LiFePO4 capacity, 160 mAh.g−1. After this initial procedure, conventional galvanostatic cycling to produce the power signature of the battery is made. It consists in a series of subsequent charge and discharge steps by constantly charging at a current density of J0 and by increasing the discharge current density Jn. In between each cycle charge/discharge a rest period of 30 min is used to relax the gradients of concentration. Taking into account the rest periods, this conventional cycling procedure needs more than a week-long time period. At each step, the areal charge capacity (Qn) was calculated by integration of the current density Jn over time (t) during the galvanostatic steps according to:
For the rapid power procedure, after the conditioning galvanostatic cycles at J0 previously described, the batteries are fully charged also at J0, then we accumulate several discharges separated by a rest period of 30 min to relax the gradients of concentration. We start by the highest current density, followed by 30 min of relaxation, then a discharge at slightly lower current density is performed, and so on, until a final discharge step at J0 (the lowest current density). This is done without charging the battery in between each discharge steps. For clarity, the cycling behavior, evolution of E as a function of the fraction δ of Li inserted in the LiδFePO4 phase, with 0 < δ < 1, for a representative LMP(48-18) battery is provided in Supplementary Figure 1. This rapid power procedure takes about 1 day to fully complete from the charge to the final discharge step, at least eight times shorter than the conventional cycling procedure. The underlying assumption of this cycling procedure is that by starting from a fully charged battery, the discharge capacity at a given current density Jn is the sum of the discharge capacities obtained at higher current densities, J > Jn, plus the one obtained when applying Jn. In other word, Qn(Jn) is calculated based on the following equation:
with ΔtN the time necessary to discharge the battery under the constant current density JN.
For both cycling procedures, the capacities calculated at each Jn of the battery replicates lie within a typical deviation below 1% which shows the very good reproducibility of our cells. This is a mandatory condition to go further into the data analysis.
Finally, to have an independent measure of the transport properties of our electrolyte, electrochemical impedance spectroscopy was executed on Li symmetric cell comprising the SPE (Bouchet et al., 2003). This technic permits to determine the different cell resistances such as the electronic (Rc), electrolyte (Rel), interface (Rint), and diffusion (Rd) resistances. Li symmetric cells were assembled via a similar lamination process than that described for the LMP batteries and sealed in CR2032 coin cells. After placing the cells in an oven at 80°C, impedance spectroscopy using an excitation signal of 40 mV in a frequency range between 10 MHz and 0.1 Hz was done. A typical Nyquist plot showing the opposite of the impedance imaginary part [-Im(Z)] as a function of the real part [Re(Z)] is presented in Supplementary Figure 2. An electrical equivalent circuit, displays in the inset of Supplementary Figure 2, comprising the cell resistances (Rc, Rel, Rint), a cable inductance (Lc) at high frequency, a constant phase element for the interface (CPEint), and a short Warburg element (Wd) for the diffusion loop at low frequencies, permits to model the Nyquist plot. From the Warburg element two main parameters are extracted corresponding to Rd and the relaxation time (τr) at the maximum of the quarter of lemniscate. Rd and Rel are related to the cationic transference number (t+) while τr is linked to the ambipolar diffusion coefficient (Damb) and the SPE thickness y by the following equations (Sørensen and Jacobsen, 1982; Ross MacDonald, 1992; Bouchet et al., 2003):
In addition, Damb is linked to the Li+ diffusion coefficient () by the relationship.
Results and Discussion
The cycling behavior of a typical LMP(48-18) battery is shown in Figure 1 that represents E as a function of the fraction δ of Li inserted in the LiδFePO4 phase, with 0 < δ < 1, recorded during conventional cycling. For clarity, only a representative charge performed at J0 = 0.1 mA.cm−2 is represented in Figure 1 and some discharge current density are indicated. The battery charge presents a typical long plateau at about 3.44 V corresponding to the oxidation of LFP materials (Padhi et al., 1997) followed by a potentiostatic step at 3.7 V to reach the full electrode capacity. During discharge, a lower potential plateau at about 3.40 V, corresponding to the reduction of LFP, is observed. This plateau is less pronounced for discharge steps executed at Jn higher than 0.3 mA.cm−2 due to an increase in the battery of gradient of concentration. Moreover, these observations on the conventional cycling behavior of a typical LMP(48-18) battery remain valid for all of the other considered LMP(x-y) batteries and associated replicates.
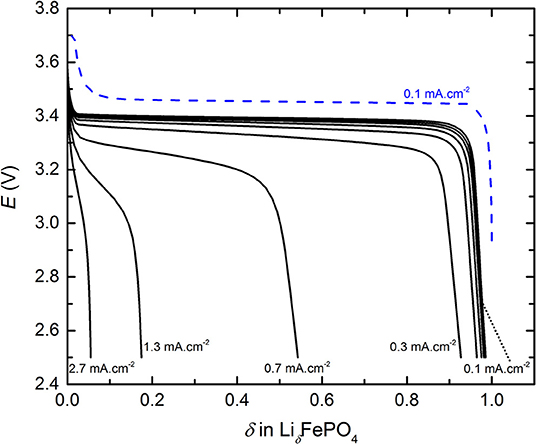
Figure 1. Typical cycling profiles, potential E as a function of the fraction δ of Li inserted in LiδFePO4, of the conventional power test for a LMP(48-18) battery. The dashed blue curve is the charge step.
For the conventional cycling (see Figure 1) and the rapid power test (see Supplementary Figure 1), the discharge capacities were extracted by using Equations (1) and (2), respectively. Then, each Qn value was normalized by the discharge capacity delivered at J0, denoted Q0. Thus, Figure 2 represents the normalized discharge capacity, ratio Qn/Q0, as a function of the discharge current densities, Jn, for the two cycling procedures of the LMP(48-18) batteries. The values reported in Figure 2 corresponds to average values with their standard deviations from the different battery replicates. For both procedures and for low Jn values, below 0.3 mA.cm−2, Qn remains close to Q0 by 3%. For both procedures and for high Jn values, higher than 0.3 mA.cm−2, the ratio Qn/Q0 quickly drops linearly with the increase of Jn down to values below 0.2 when Jn > 1 mA.cm−2. Similarly to Li-ion batteries (Gallagher et al., 2014), the relationship between the discharge capacity and the current density of the all-solid-state Li batteries present a transition regime at a critical current density value. Moreover, the data point recorded at the highest Jn value, at 2.8 mA.cm−2, deviates from the linear trend of Qn/Q0 with Jn when Jn > 0.3 mA.cm−2 due to supercapacitor effect arising from the high surface carbon fillers and coating of the LFP particles. Such capacitive effect is only seen for the highest current densities of the LMP(x-y) batteries and is not taken into account for the data analysis provided in the remaining of the text. The evolution of the normalized discharge capacities with the current densities are in excellent accordance for the conventional cycling and the rapid power test. Indeed, differences in Qn/Q0 values lie within the error bars typically when Jd > 0.3 mA.cm−2. In addition, the accordance in between the two procedures is also observed for each studied LMP(x-y) batteries. The rapid power test is then a robust tool to picture the battery power performance in a time-efficient manner with a strong accuracy when compared to conventional cycling procedure. Other interesting cycling routine can be found in literature but will less accuracy regarding phase transition positive active materials as LFP (Heubner et al., 2018a).
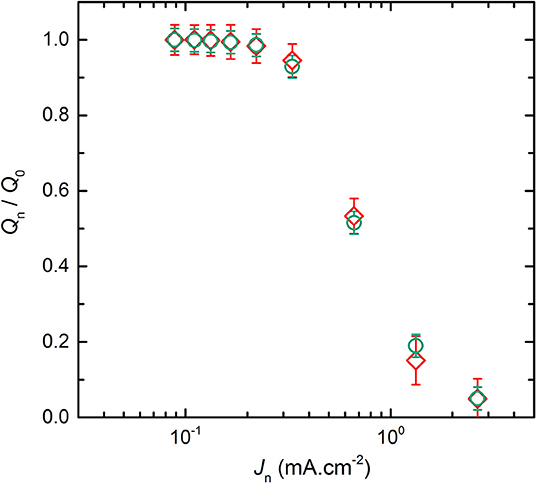
Figure 2. Average normalized capacity, ratio Qn/Q0, of the LMP(48-18) battery as a function of the discharge current densities, Jn, for the two cycling procedures. The symbols correspond to the (♢) conventional cycling and (⃝) rapid power test.
To understand the effect of electrode thicknesses on battery power, Figure 3A represents the average normalized discharge capacity as a function of Jn for the LMP(x-18) batteries with x values of 20, 33, 48, and 60 μm while the SPE thickness is maintained at 18 μm. For each LMP(x-y) batteries reported in Figure 3A, the evolution of Qn/Q0 with Jd is similar to that already detailed in Figure 2. The main difference between each battery is the location of the transition regime between the current density regime where Qn remains close to Q0 and the regime where Qn/Q0 decreases with Jd. Based on Figure 3A, the thinnest the positive electrode, the later Qn will deviate strongly from Q0. A similar conclusion can be drawn for all the other LMP(x-y) batteries in which y is constant and x being either 20, 33, 48, or 60 μm. For completeness, Supplementary Figure 3 shows the ratio Qn/Q0 as a function of Jn for the LMP(x-36) and LMP(x-54) batteries. The effect of the positive electrode thickness on the power is then similar to that reported for Li-ion batteries comprising a liquid electrolyte (Cornut et al., 2015; Heubner et al., 2018b). As a complementary case, Figure 3B shows the average normalized discharge capacity as a function of Jn for the LMP(33-y) batteries with y values of 18, 36, and 54 μm while the positive electrode thickness is constant at 33 μm. For a given positive electrode thickness, the transition regime occurs at lower current density when the SPE thickness increases. This observation remains valid for all the other LMP(x-y) batteries in which x is constant and y being either 18, 36, 54, 108, and 216 μm. For completeness, Supplementary Figure 4 shows the ratio Qn/Q0 as a function of Jn for the LMP(20-y), LMP(48-y), and LMP(60-y). From Figures 3A,B, the power performance of the all-solid-state Li batteries are dependent on both positive electrode and SPE thicknesses. Interestingly, in most of the studies on standard Li-ion batteries, only the electrode thickness has been varied shading the impact of the electrolyte thickness. Understanding finely the partition of these two parameters on the battery performance is of first interest to envision an optimized battery assembly.
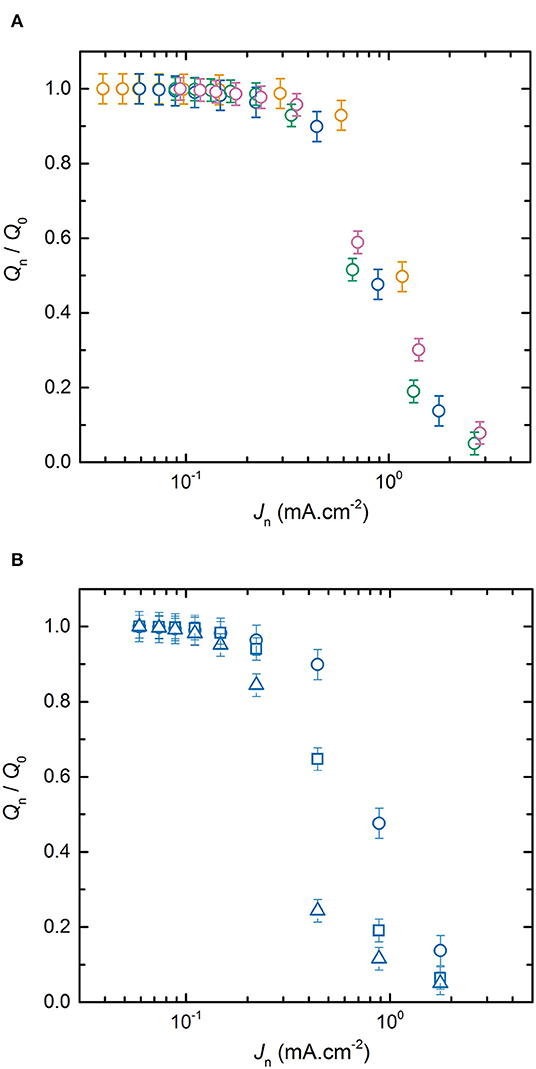
Figure 3. Average normalized capacity, ratio Qn/Q0, as a function of the discharge current densities Jn. (A) LMP(x-18) batteries with positive electrode thickness x of (orange) 20, (blue) 33, (green) 48, and (pink) 60 μm; and (B) LMP(33-y) batteries with SPE thickness y of (⃝) 18, (□) 36, and (△) 54 μm.
From each Qn/Q0 vs. Jn plots, we define the current density corresponding to the transition regime as the current density at which the Qn/Q0 = 1 baseline (low Jn regime) crosses the linear interpolation of Qn/Q0 vs. Jn (high Jn regime). This drop of capacity is due to a Li ion diffusion limitation, therefore current density corresponding to this data point is called the diffusion limiting current, denoted Jlim. For clarity, the graphical determination of Jlim is shown in Supplementary Figure 5 for the LMP(20-18) batteries. In order to provide more insight on Jlim, we propose a methodology based on the Sand equation for controlled-current technique (Sand, 1901; Rosso et al., 2006). By definition, for a current density above Jlim, the Sand time (τs) corresponds to the transition time at which the flux of ionic species is not large enough to satisfy the applied current. The Sand equation (Brissot et al., 1999) is theoretically given by:
with n the number of exchanged electron (n = 1 for LFP), F the Faraday constant (9.648 104 C.mol−1), CLi the Li concentration in the SPE (Devaux et al., 2012) located in the electrolyte and in the positive electrode (882 mol.m−3 for both), t+ the cationic transference number, and Damb the ambipolar diffusion coefficient. The use of this equation is an approximation since the boundaries condition of a plan electrode is not perfectly respected on the cathode side.
For Jn ≥ Jlim, τs can be estimated as being equivalent to the discharge time. In other words, τs at a specific current density is defined as:
Damb and t+ of a Li salt in PEO can be measured or calculated using many techniques such as electrochemical methodologies based on polarization (Shi and Vincent, 1993; Geiculescu et al., 2006) or relaxation (Mullin et al., 2011), impedance spectroscopy (Bouchet et al., 2003), pulse-field NMR (Hayamizu et al., 1999), or molecular dynamic simulation (Diddens et al., 2010) to name a few. By looking into literature data and focusing on high molecular PEO based electrolyte, at 80°C, Damb is in the range of 5 10−8 cm2.s−1 and t+ of about 0.15. In addition, impedance spectroscopy was performed on Li symmetric cells comprising SPE thickness of 18, 36, and 54 μm. The electrical equivalent circuit (see inset of Supplementary Figure 2) was used to fit all the impedance spectra in order to extract t+ and Damb values. , calculated using Equation (5), and t+ are both independent of the SPE thickness with an average value consistent with literature analysis of 3.4 ± 0.7 10−8 cm2.s−1 and 0.15 ± 0.02, respectively.
The plot of τs as a function of shows a linear behavior for the data points for which the condition Jn ≥ Jlim is satisfied which confirms the Sand behavior. As an example, Supplementary Figure 6 shows τs vs. for a LMP(48-18) battery including the linear regression line. The slope of the regression line is then directly proportional to Damb and thus to . Considering a t+ of 0.15 as determined by impedance spectroscopy, has been calculated for each LMP(x-y) battery. is independent of the positive electrode and SPE thickness with an average value of 3.1 ± 0.6 10−8 cm2.s−1. So, the Li+ diffusion coefficient determined by the Sand equation when applied to battery cycling data is rather similar to the Li+ diffusion coefficient within the SPE. Therefore, the power limiting phenomena in these all-solid-state batteries is then the diffusion of the Li+ cation in the electrolyte spanning from the Li negative electrode to the Al current collector of the positive electrode rather than the diffusion of Li+ in the LFP active material (Doyle and Newman, 1995). The use of the sand equation is then an efficient tool to quickly determine the effective limiting diffusion process at stake in batteries when J > Jlim, i.e., at rates where only a part of the full capacity is recovered.
To go further and compare all the LMP(x-y) batteries together, Jlim was extracted from each Qn/Q0 vs. Jn plots. Figure 4 represents the average normalized capacity as a function of the ratio Jlim/Jn for the LMP(20-18), LMP(33-36), LMP(48-216), and LMP(60-54) batteries. All the experimental normalized capacity curves of the LMP(x-y) batteries overlap to a mere curve which demonstrates that the limiting phenomenon in stake here is the same whatever the electrode and electrolyte thickness and is due to the diffusion in the polymer electrolyte. In literature, a mere curve is usually obtained when the normalized capacity is represented as a function of the C-rate or its inverse. The mere curve is then fitted by an exponential decay function stretched by an empirical value, typically of 2, and adjusted using a relaxation time parameter (Heubner et al., 2018b; Tian et al., 2019). In our case, no semi-empirical function is used as the only parameter corresponds to a physical parameter Jlim, graphically determined. The next step is to provide a simple model to get more insight on the partition of Jlim due to the diffusion into the electrolyte and/or into the electrolyte spanning into the positive electrode.
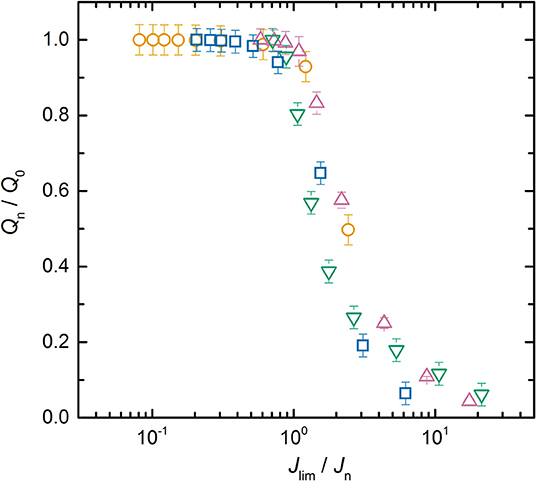
Figure 4. Average normalized capacity, ratio Qn/Q0, as a function of Jlim/Jn for the (⃝) LMP(20-18), (□) LMP(33–36), (∇) LMP(48-36), and (△) LMP(60-54) batteries.
Figure 5 represents the average Jlim of the different LMP(x-y) batteries as a function of the positive electrode thickness x. For a given positive electrode thickness, Jlim increases with the diminution of the SPE thickness. The Jlim values span within those obtained for a 20 μm thick positive electrode between 0.06 and 0.48 mA.cm−2 when y equals to 216 and 18 μm, respectively. When y = 18 μm, Jlim decreases linearly with x. For higher y value, the slope of the Jlim decays with x is less pronounced as y increases until a plateau value for the highest reported SPE thicknesses of 216 μm. The best power performance is thus expected for battery comprising a thin positive electrode and a thin SPE layer. However, by looking at the interplay between the x and y value, battery with higher specific energy can be assembled without impairing much the power performances. Indeed, Jlim is an indicator of the onset of battery capacity decrease from its nominal value, i.e., Q0. In Figure 5, the LMP(60-18) battery shows a Jlim value higher than the one of the LMP(20-36). This implies that Jlim is a weak function of the positive electrode thickness and a strong function of the SPE thickness. In consequence, for the LMP(x-y) batteries, the specific volumetric energy density per single cell can be augmented simply by selecting the best compromise between positive electrode and SPE thicknesses.
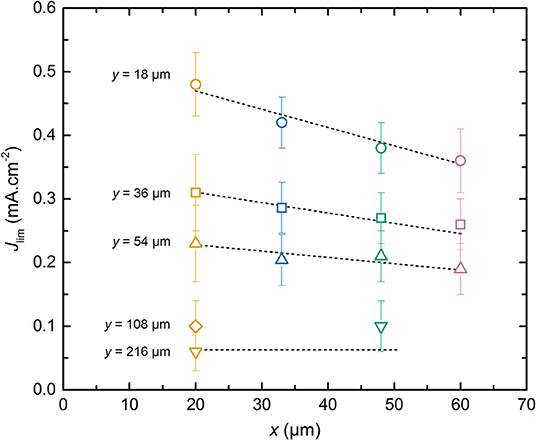
Figure 5. Average limiting current, Jlim, as a function of the positive electrode thickness, x. The dashed lines are guidelines for the eyes depending on the SPE thickness, y. The symbols correspond to SPE thickness y of (⃝) 18, (□) 36, (△) 54, (♢) 108, and (∇) 216 μm. The symbol colors correspond to positive electrode thickness x of (orange) 20, (blue) 33, (green) 48, and (pink) 60 μm.
The weak dependence of Jlim relatively to x can be understood by considering that the effective surface ensuring the Li+ diffusive flux at the interface of composite electrode/electrolyte is lower than the geometrical surface of the electrode due to the presence of active material and carbon particles in the composite electrode. So, the current density corresponding to the flux of Li+ in the SPE located inside the electrode is higher than the one in the electrolyte. In addition, the Li+ diffusion length depends on the electrode tortuosity. These effects can be described by introducing a parameter α with 0 < α ≤ 1 in which the total Li+ diffusion path corresponds to α. x+y. One can expect that the diffusion path in the composite electrode should be longer than the thickness of the electrode due to its tortuosity. However, here we measure an effective value, and it appears that the diffusion in the electrolyte located in the electrode seems higher than that of the raw electrolyte probably due to moisture content. This leads to an α value below unity. In Figure 6, Jlim is plotted as a function of α. x+y. By adjusting α to a value of 0.35, all the Jlim data collapse onto a master curve that is fitted using a reciprocal function, shown as the dashed curve in Figure 6, that yields to the following equation:
with K = 13.2 mA.cm−1 based on least squares fit (R2 > 0.99).
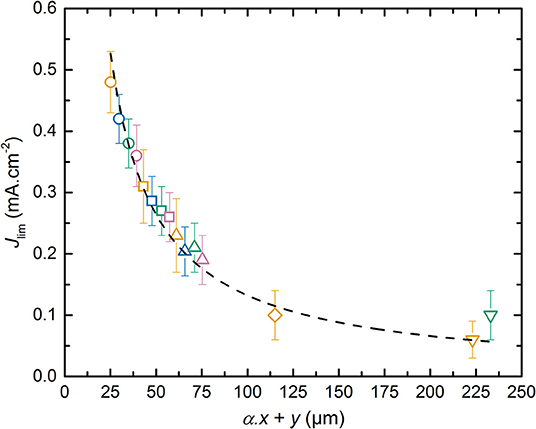
Figure 6. Limiting current density, Jlim, as a function of α. x+y. The dashed curve corresponds to the fit obtained using a reciprocal function. The symbols correspond to SPE thickness y of (⃝) 18, (□) 36, (△) 54, (♢) 108, and (∇) 216 μm. The symbol colors correspond to positive electrode thickness x of (orange) 20, (blue) 33, (green) 48, and (pink) 60 μm.
To provide a physical meaning of the parameter K in Equation (8), the LMP(x-y) can be modeled via a one dimensional approach as extensively performed by the group of Doyle et al. (1993). Thus, the Fick law in 1-D can be simply applied in which the diffusion current is proportional to the Li+ concentration gradient, the thickness of the diffusion process, and the diffusion coefficient of the limiting phenomena. Based on the results obtained in Figure 6, Jlim is an inverse function of the sum α. x+y and corresponds thus to the current value at which the Li concentration gradient throughout the battery falls down to a null value at the Al current collector/positive electrode. Jlim can then be expressed as a function of the effective Li+ diffusion coefficient () according to :
Combining Equation (9) into (8) permits to directly calculate a corresponding value of 1.6 10−8 cm2.s−1 based on the K parameter. The effective diffusion coefficient is then in the same range than the Li+ diffusion coefficient determined by the Sand time methodology. In consequence, the effective diffusion coefficient corresponds to the effective Li+ diffusion coefficient in the SPE from the positive electrode to electrolyte layer. The Jlim methodology is less accurate than the Sand time methodology but is much faster to implement in order to quickly determine the limiting diffusion phenomena in the batteries. In addition, the α parameter is interesting since it depends on the electrode formulation and tortuosity as well as the ionic transport within the SPE used in the positive electrode. The variability of this parameters as function of the electrode formulation is a tool to optimize the electrode composition and texture, but is beyond the scope of our study.
Conclusion
The battery power signature is rapidly determined via a rapid power test. This method consists in applying consecutive galvanostatic discharge step from high to low current density. The results given by this method is identical to that obtained by conventional galvanostatic cycling, i.e., series of charge-discharge steps. At current density higher than the limiting current density (Jlim), the application of the Sand equation for controlled-current technique is proven to be effective in determining the diffusion coefficient of the limiting process. Herein, in the Li polymer batteries, the Li+ diffusion in the solid polymer electrolyte acting as battery separator and positive electrode binder limits the battery performance. In addition to the fast determination of Jlim, a physical meaning of this parameter is provided. Jlim is directly linked to an effective Li+ diffusion coefficient throughout the battery that is similar to the one reported by the Sand equation. In consequence, the rapid power test is an efficient technique to compare series of batteries that differ by their assembly and to determine the main limiting factor, and thus optimize in turn the battery assembly. Battery design as then to consider the cumulative effect of both effect arising from the SPE layer thickness and from the positive electrode thickness. For example, in our LMP batteries, for a 54 μm thick electrolyte a positive electrode up to 48 μm can be used without impairing the battery power performance. For completeness, other factors than the power performance should also be considered, especially in case of Li metal based battery with the impact of the heterogeneous Li electrodeposition during charge step. To go further, this methodology should be applied to Li metal polymer batteries having different positive electrode formulations as well as on other battery technology.
Data Availability Statement
All datasets generated for this study are included in the article/Supplementary Material.
Author Contributions
RB, DD, MD, and ML designed the project study. MD and ML produced the composite electrodes. DD, PD, and HL conducted the experiments. RB, DD, and HL analyzed the data. RB and DD wrote the manuscript. All the authors commented the manuscript.
Funding
The work has been done in the context of a French FUI20 fund (Fond Unique Interministériel) with the collaborative project named ALEPH.
Conflict of Interest
MD and ML are employed by the company Blue Solutions.
The remaining authors declare that the research was conducted in the absence of any commercial or financial relationships that could be construed as a potential conflict of interest.
Acknowledgments
We thank the BPI (Banque Publique d'Investissement) and the Blue Solutions company for their financial support.
Supplementary Material
The Supplementary Material for this article can be found online at: https://www.frontiersin.org/article/10.3389/fenrg.2019.00168/full#supplementary-material
References
Agrawal, R. C., and Pandey, G. P. (2008). Solid polymer electrolytes: materials designing and all-solid-state battery applications: an overview. J. Phys. D Appl. Phys. 41:223001. doi: 10.1088/0022-3727/41/22/223001
Armand, M. (1983). Polymer solid electrolytes - an overview. Solid State Ionics 9–10, 745–754. doi: 10.1016/0167-2738(83)90083-8
Armand, M. (1994). The history of polymer electrolytes. Solid State Ionics 69, 309–319. doi: 10.1016/0167-2738(94)90419-7
Bard, A. J., and Faulkner, L. R. (2001). Electrochemical Methods Fundamentals and Applications, 2nd Edn. New York, NY: John Wiley Sons, Inc.
Baudry, P., Lascaud, S., Majastre, H., and Bloch, D. (1997). Lithium polymer battery development for electric vehicle application. J. Power Sour. 68, 432–435. doi: 10.1016/S0378-7753(97)02646-3
Bouchet, R., Lascaud, S., and Rosso, M. (2003). An EIS study of the anode Li/PEO-LiTFSI of a Li polymer battery. J. Electrochem. Soc. 150, A1385–A1389. doi: 10.1149/1.1609997
Bouchet, R., Maria, S., Meziane, R., Aboulaich, A., Lienafa, L., Bonnet, J.-P., et al. (2013). Single-ion BAB triblock copolymers as highly efficient electrolytes for lithium-metal batteries. Nat. Mater. 12, 452–457. doi: 10.1038/nmat3602
Brissot, C., Rosso, M., Chazalviel, J.-N., and Lascaud, S. (1999). Dendritic growth mechanisms in lithium/polymer cells. J. Power Sour. 81–82, 925–929. doi: 10.1016/S0378-7753(98)00242-0
Cornut, R., Lepage, D., and Schougaard, S. B. (2015). Interpreting lithium batteries discharge curves for easy identification of the origin of performance limitations. Electrochim. Acta 162, 271–274. doi: 10.1016/j.electacta.2014.11.035
Devaux, D., Bouchet, R., Glé, D., and Denoyel, R. (2012). Mechanism of ion transport in PEO/LiTFSI complexes: effect of temperature, molecular weight and end groups. Solid State Ionics 227, 119–127. doi: 10.1016/j.ssi.2012.09.020
Diddens, D., Heuer, A., and Borodin, O. (2010). Understanding the lithium transport within a rouse-based model for a PEO/LiTFSI polymer electrolyte. Macromolecules 43, 2028–2036. doi: 10.1021/ma901893h
Doerffel, D., and Sharkh, S. A. (2006). A critical review of using the Peukert equation for determining the remaining capacity of lead-acid and lithium-ion batteries. J. Power Sour. 155, 395–400. doi: 10.1016/j.jpowsour.2005.04.030
Doyle, M., Fuller, T., and Newman, J. (1993). Modeling of galvanostatic charge and discharge of the lithium/ polymer/insertion cell. J. Electrochem. Soc. 6, 1526–1533. doi: 10.1149/1.2221597
Doyle, M., and Newman, J. (1995). The use of mathematical modeling in the design of lithium/polymer battery systems. Electrochim. Acta 40, 2191–2196. doi: 10.1016/0013-4686(95)00162-8
Doyle, M., and Newman, J. (1997). Analysis of capacity-rate data for lithium batteries using simplified models of the discharge process. J. Appl. Electrochem. 27, 846–856. doi: 10.1023/A:1018481030499
Doyle, M., Newman, J., and Reimers, J. (1994). A quick method of measuring the capacity versus discharge rate for a dual lithium-ion insertion cell undergoing cycling. J. Power Sources 52, 211–216. doi: 10.1016/0378-7753(94)02012-4
Du, Z., Wood, D. L., Daniel, C., Kalnaus, S., and Li, J. (2017). Understanding limiting factors in thick electrode performance as applied to high energy density Li-ion batteries. J. Appl. Electrochem. 47, 405–415. doi: 10.1007/s10800-017-1047-4
Eftekhari, A. (2017). Lithium-ion batteries with high rate capabilities. ACS Sustain. Chem. Eng. 5, 2799–2816. doi: 10.1021/acssuschemeng.7b00046
Fuller, T. F., Doyle, M., and Newman, J. (1994). Simulation and optimization of the dual lithium ion insertion cell. J. Electrochem. Soc. 141, 1–10. doi: 10.1149/1.2054684
Gallagher, K. G., Goebel, S., Greszler, T., Mathias, M., Oelerich, W., Eroglu, D., et al. (2014). Quantifying the promise of lithium–air batteries for electric vehicles. Energy Environ. Sci. 7, 1555–1563. doi: 10.1039/c3ee43870h
Gallagher, K. G., Trask, S. E., Bauer, C., Woehrle, T., Lux, S. F., Tschech, M., et al. (2016). Optimizing areal capacities through understanding the limitations of lithium-ion electrodes. J. Electrochem. Soc. 163, A138–A149. doi: 10.1149/2.0321602jes
Geiculescu, O. E., Rajagopal, R., Creager, S. E., DesMarteau, D. D., Zhang, X. W., and Fedkiw, P. (2006). Transport properties of solid polymer electrolytes prepared from oligomeric fluorosulfonimide lithium salts dissolved in high molecular weight poly(ethylene oxide). J. Phys. Chem. B 110, 23130–23135. doi: 10.1021/jp062648p
Hayamizu, K., Aihara, Y., Arai, S., and Martinez, C. G. (1999). Pulse-gradient spin-echo 1H, 7Li, and 19F NMR diffusion and ionic conductivity measurements of 14 organic electrolytes containing LiN(SO2CF3)2. J. Phys. Chem. B 103, 519–524. doi: 10.1021/jp9825664
Heubner, C., Lämmel, C., Nickol, A., Liebmann, T., Schneider, M., and Michaelis, A. (2018a). Comparison of chronoamperometric response and rate-performance of porous insertion electrodes: Towards an accelerated rate capability test. J. Power Sour. 397, 11–15. doi: 10.1016/j.jpowsour.2018.06.087
Heubner, C., Nickol, A., Seeba, J., Reuber, S., Junker, N., Wolter, M., et al. (2019). Understanding thickness and porosity effects on the electrochemical performance of LiNi0.6Co0.2Mn0.2O2-based cathodes for high energy Li-ion batteries. J. Power Sour. 419, 119–126. doi: 10.1016/j.jpowsour.2019.02.060
Heubner, C., Seeba, J., Liebmann, T., Nickol, A., Börner, S., Fritsch, M., et al. (2018b). Semi-empirical master curve concept describing the rate capability of lithium insertion electrodes. J. Power Sources 380, 83–91. doi: 10.1016/j.jpowsour.2018.01.077
Jiang, F., and Peng, P. (2016). Elucidating the performance limitations of lithium-ion batteries due to species and charge transport through five characteristic parameters. Sci. Rep. 6:32639. doi: 10.1038/srep32639
Kang, B., and Ceder, G. (2009). Battery materials for ultrafast charging and discharging. Nature 458, 190–193. doi: 10.1038/nature07853
Kim, J. G., Son, B., Mukherjee, S., Schuppert, N., Bates, A., Kwon, O., et al. (2015). A review of lithium and non-lithium based solid state batteries. J. Power Sour. 282, 299–322. doi: 10.1016/j.jpowsour.2015.02.054
Kurzweil, P., and Garche, J. (2017). “Overview of batteries for future automobiles,” in Lead-Acid Batteries for Future Automobiles, eds J. Garche, E. Karden, P. T. Moseley, and D. A. J. Rand (Amsterdam: Elsevier BV), 27–96. doi: 10.1016/B978-0-444-63700-0.00002-7
Mullin, S. A., Stone, G. M., Panday, A., and Balsara, N. P. (2011). Salt diffusion coefficients in block copolymer electrolytes. J. Electrochem. Soc. 158, A619–A627. doi: 10.1149/1.3563802
Newman, J. (1995). Optimization of porosity and thickness of a battery electrode by means of a reaction-zone model. J. Electrochem. Soc. 142, 97–101. doi: 10.1149/1.2043956.
Padhi, A. K., Nanjundaswamy, K. S., and Goodenough, J. B. (1997). Phospho-olivines as positive-electrode materials for rechargeable lithium batteries. J. Electrochem. Soc. 144, 1188–1194. doi: 10.1149/1.1837571
Porcarelli, L., Gerbaldi, C., Bella, F., and Nair, J. R. (2016). Super soft all-ethylene oxide polymer electrolyte for safe all-solid lithium batteries. Sci. Rep. 6:19892. doi: 10.1038/srep19892.
Ross MacDonald, J. (1992). Impedance/admittance response of a binary electrolyte. Electrochim. Acta 37, 1007–1014. doi: 10.1016/0013-4686(92)85216-8
Rosso, M., Brissot, C., Teyssot, A., Dollé, M., Sannier, L., Tarascon, J.-M., et al. (2006). Dendrite short-circuit and fuse effect on Li/Polymer/Li cells. Electrochim. Acta 51, 5334–5340. doi: 10.1016/j.electacta.2006.02.004
Safari, M., and Delacourt, C. (2011). Mathematical modeling of lithium iron phosphate electrode: galvanostatic charge/discharge and path dependence. J. Electrochem. Soc. 158, A63–A73. doi: 10.1149/1.3515902
Sand, H. J. S. (1901). On the concentration at the electrodes in a solution, with special reference to the liberation of hydrogen by electrolysis of a mixture of copper sulphate and sulphuric acid. Phil. Mag. 1, 45–79. doi: 10.1080/14786440109462590
Schnell, J., Günther, T., Knoche, T., Vieider, C., Köhler, L., Just, A., et al. (2018). All-solid-state lithium-ion and lithium metal batteries – paving the way to large-scale production. J. Power Sour. 382, 160–175. doi: 10.1016/j.jpowsour.2018.02.062
Shi, J., and Vincent, C. A. (1993). The effect of molecular-weight on cation mobility in polymer electrolytes. Solid State Ionics 60, 11–17. doi: 10.1016/0167-2738(93)90268-8
Singh, M., Kaiser, J., and Hahn, H. (2015). Thick electrodes for high energy lithium ion batteries. J. Electrochem. Soc. 162, A1196–A1201. doi: 10.1149/2.0401507jes
Sørensen, P. R., and Jacobsen, T. (1982). Conductivity, charge-transfer and transport number - an ac-investigation of the polymer electrolyte LiSCN-poly(ethyleneoxide). Electrochim. Acta 27, 1671–1675. doi: 10.1016/0013-4686(82)80162-X
Srinivasan, V., and Newman, J. (2004). Discharge model for the lithium iron-phosphate electrode. J. Electrochem. Soc. 151, A1517–A1529. doi: 10.1149/1.1785012
Tarascon, J.-M., and Armand, M. (2001). Issues and challenges facing rechargeable lithium batteries. Nature 414, 359–367. doi: 10.1038/35104644
Tian, R., Park, S.-H., King, P. J., Cunningham, G., Coelho, J., Nicolosi, V., et al. (2019). Quantifying the factors limiting rate performance in battery electrodes. Nat. Commun. 10:1933. doi: 10.1038/s41467-019-09792-9
Wong, L. L., Chen, H., and Adams, S. (2017). Design of fast ion conducting cathode materials for grid-scale sodium-ion batteries. Phys. Chem. Chem. Phys. 19, 7506–7523. d. doi: 10.1039/C7CP00037E
Wu, X., Song, K., Zhang, X., Hu, N., Li, L., Li, W., et al. (2019). safety issues in lithium ion batteries: materials and cell design. Front. Energy Res. 7:65. doi: 10.3389/fenrg.2019.00065
Xu, W., Wang, J., Ding, F., Chen, X., Nasybulin, E., Zhang, Y., et al. (2014). Lithium metal anodes for rechargeable batteries. Energy Environ. Sci. 7, 513–537. doi: 10.1039/C3EE40795K
Yang, J., Wang, X., Zhang, G., Ma, A., Chen, W., Shao, L., et al. (2019). High-performance solid composite polymer electrolyte for all solid-state lithium battery through facile microstructure regulation. Front. Chem. 7:388. doi: 10.3389/fchem.2019.00388
Yu, D. Y. W., Donoue, K., Inoue, T., Fujimoto, M., and Fujitani, S. (2006). Effect of electrode parameters on LiFePO4 cathodes. J. Electrochem. Soc. 153, A835–A839. doi: 10.1149/1.2179199
Yu, S., Kim, S., Kim, T. Y., Nam, J. H., and Cho, W. I. (2013). Model prediction and experiments for the electrode design optimization of LiFePO4/Graphite electrodes in high capacity lithium-ion Batteries. Bull. Korean Chem. Soc. 34, 79–88. doi: 10.5012/bkcs.2013.34.1.79
Zeng, X., Li, M., Abd El-Hady, D., Alshitari, W., Al-Bogami, A. S., Lu, J., et al. (2019). Commercialization of lithium battery technologies for electric vehicles. Adv. Energy Mater. 9:1900161. doi: 10.1002/aenm.201900161
Zhang, H., Li, C., Piszcz, M., Coya, E., Rojo, T., Rodriguez-Martinez, L. M., et al. (2017). Single lithium-ion conducting solid polymer electrolytes: advances and perspectives. Chem. Soc. Rev. 46, 797–815. doi: 10.1039/C6CS00491A
Keywords: lithium battery, polymer electrolyte, power performance, transport limitation, effective diffusion coefficient, power cycling procedure
Citation: Devaux D, Leduc H, Dumaz P, Lecuyer M, Deschamps M and Bouchet R (2020) Effect of Electrode and Electrolyte Thicknesses on All-Solid-State Battery Performance Analyzed With the Sand Equation. Front. Energy Res. 7:168. doi: 10.3389/fenrg.2019.00168
Received: 14 September 2019; Accepted: 24 December 2019;
Published: 22 January 2020.
Edited by:
Xiangming He, Tsinghua University, ChinaReviewed by:
Nitash P. Balsara, University of California, Berkeley, United StatesZonghai Chen, Argonne National Laboratory (DOE), United States
Peng Bai, Washington University in St. Louis, United States
Copyright © 2020 Devaux, Leduc, Dumaz, Lecuyer, Deschamps and Bouchet. This is an open-access article distributed under the terms of the Creative Commons Attribution License (CC BY). The use, distribution or reproduction in other forums is permitted, provided the original author(s) and the copyright owner(s) are credited and that the original publication in this journal is cited, in accordance with accepted academic practice. No use, distribution or reproduction is permitted which does not comply with these terms.
*Correspondence: Didier Devaux, ZGlkaWVyLmRldmF1eEBncmVub2JsZS1pbnAuZnI=; Renaud Bouchet, cmVuYXVkLmJvdWNoZXRAZ3Jlbm9ibGUtaW5wLmZy