 Ying Wang
 Yuxuan Lei*
- School of Management, China University of Mining and Technology, Beijing, China
This study defines a green mining system as a synergetic operation system composed of a mining subsystem and an environmental governance subsystem. Through conducting a case study of China's coal enterprises, this study identifies the mining subsystem as the first production stage and the environmental governance subsystem as the second production stage. To evaluate green mining efficiency, an entire green mining efficiency indicator system was constructed by analyzing the main inputs and outputs of the two subsystems. Using the 2019 data collected from Chinese coal mining enterprises based on the constructed indicator system, this study presents a two-stage combination Data Envelopment Analysis model to assess green mining efficiency in terms of mining efficiency and environmental governance efficiency. According to this empirical study's results, there were four main findings. First, coal enterprises can be divided into three categories in accordance with the efficiency value ranking generated by the two-stage model and the corresponding synergetic development levels. Second, the percentage distribution of coal enterprises based on their green mining efficiency level embodies the attributes of a spindle structure. Third, the exported parameters information from the two-stage model supports green mining efficiency improvement as quantitative evidence. Fourth, the model results form the basis for policy proposals and improvement countermeasures.
Introduction
In recent years, the imperative of low-carbon economic development has been acknowledged globally. Reducing the environmental impacts of mining activities is recognized as a key component of low-carbon economic development. Therefore, it is vital to conduct research on green mining efficiency and sustainable development strategies for the mining industry. Joshua Kirkey, Communications Advisor for Natural Resources Canada (NRC), defines green mining as “technologies, best practices and mine processes that are implemented as a means to reduce the environmental impacts associated with the extraction and processing of greenhouse gases, used water and minerals” (Kirkey, 2014). In short, the development of innovative green mining technologies aims to improve the mining sector's economic and environmental performance simultaneously.
Following decades of deep exploitation of resources, the associated environmental problems have become increasingly aggravated. The main environmental challenges associated with coal mining include the handling of coal gangue, the escape of coalbed methane (CBM), mine drainage, soil erosion, and land subsidence. The Chinese authorities have been seeking to establish more effective policy systems to propel the implementation of green mining technologies. The close coordination of coal mining and environment governance is of great significance for the sustainable development of China's mining industry (Shi, 2012; Nurmi, 2017).
The purpose of this study is to evaluate coal mining efficiency in China through the use of a creative Data Envelopment Analysis (DEA) model under the framework of green and sustainable growth. A key focus of attention in China's pursuit of a clean, sustainable environment is its coal industry. Indeed, it is regarded as a strategic objective. This study constructs an entire green mining efficiency indicator evaluation system and establishes a two-stage combined DEA model that reflects the real production condition of China's coal mining enterprises. Accordingly, the specific countermeasures and policy implications under the guidance of green mining are summarized based on the empirical study results.
The remainder of this paper is organized as follows. Literature Review presents a literature review. Materials and Methods develops a two-stage model that combines input- and output-oriented slack-based measures for green mining efficiency evaluation. It also outlines the two-stage evaluation indicator system of green mining. Empirical Study presents the empirical study of China's coal mining enterprises in 2019 and analyzes the empirical results. Conclusions outlines the main findings and policy implications for improving the ecological performance of China's coal industry.
Literature Review
Table 1 summarizes the main relevant literature carried out between 2006 and 2018. About a decade ago, Franks, Brereton, and Moran and Mamurekli evaluated the environmental cumulative effects of coal resource development and utilization and suggested that the authorities involved should play significant roles in improving impact assessment and institutional formulation (Franks et al., 2010; Mamurekli, 2010). Using evidence from China's coal sector, a recent study by Zhang et al. addressed the relationship of energy-price regulations and price fluctuations by building simultaneous equations for coal price and coal supply and constructing a forward-looking coefficient to evaluate different coal pricing policies from 2008 to 2016 (Zhang et al., 2019). Sueyoshi and Yuan focused on the unintended consequences of China's coal capacity cut policy and revealed that the capacity cut policy should be differentiated across regions due to the fragmentation of the coal markets, unbalanced distribution of resources, and a mismatch between production and demand centers (Sueyoshi and Yuan, 2018). These same researchers used the intermediate DEA innovation model to study the energy utilization efficiency and sustainable development of Asian countries (Sueyoshi and Yuan, 2015, 2018). Bi et al. used different DEA models to study the exploitation and utilization efficiency of coal resources in China and to make comparisons between China and the United States (Bi et al., 2014).
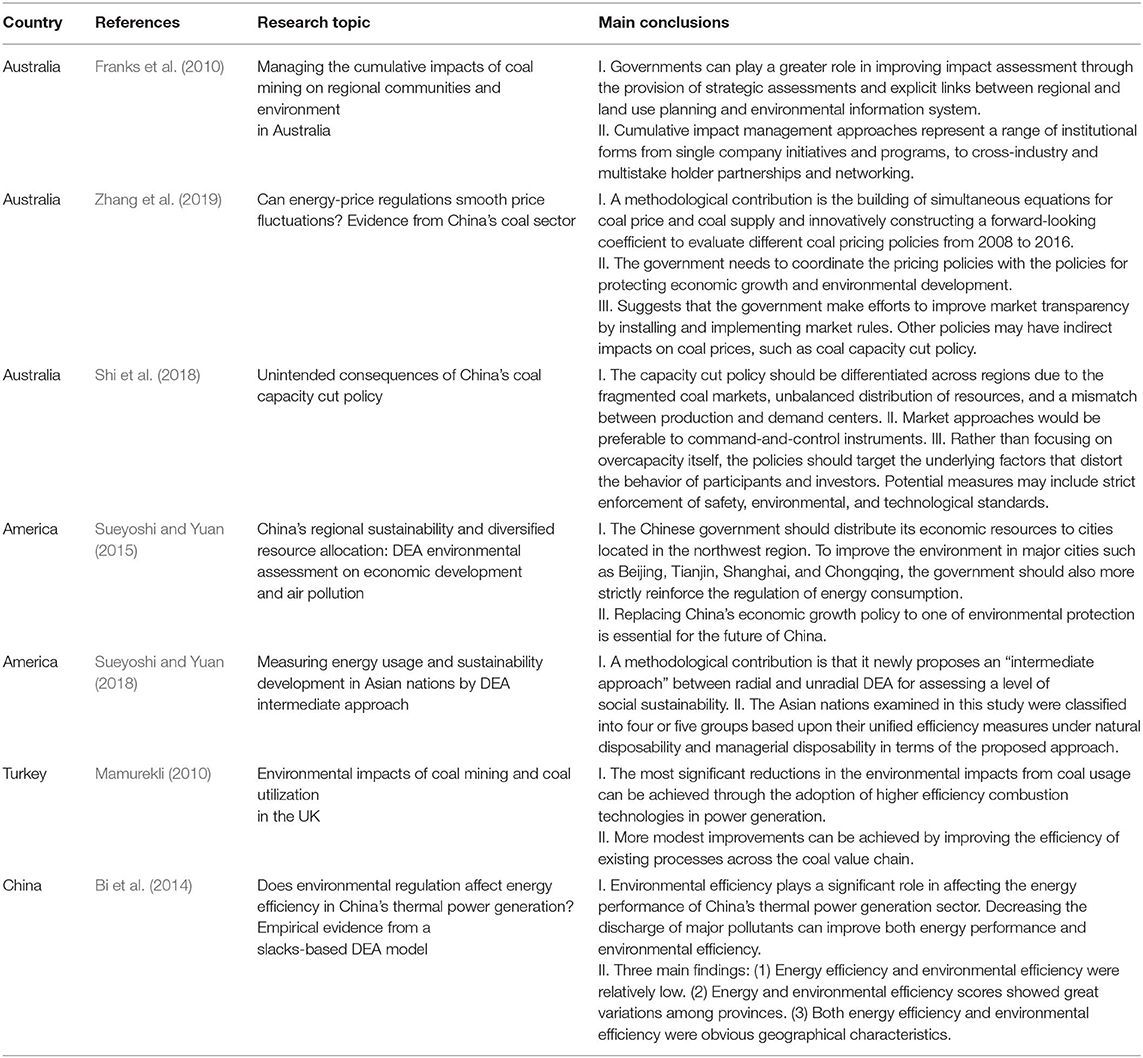
Table 1. Research carried out on this topic between 2009 and 2019.
To date, little research has been carried out on mining efficiency and sustainable development countermeasures in China based on the concept of green mining. Hence, this study constructs an entire green mining efficiency indicator evaluation system and sets up a two-stage combined DEA model that reflects the real production conditions of coal mining enterprises. Specific countermeasures and strategies for sustainable development under the guidance of green mining are formulated on the basis of empirical study results.
Second, from the perspective of model establishment, the authors also tracked and analyzed the relevant research on DEA theory and its derivative models, which, in recent years, have been used to examine energy efficiency and environmental performance.
The classical DEA models and their extensions include the constant returns to scale model (CCR), variable returns to scale model (BCC), additive model, and slacks-based DEA models (Cook and Seiford, 2009). Yang and Pollitt simultaneously considered the undesirable outputs and uncontrollable variables to propose six DEA-based performance evaluation models based on research relating to Chinese coal-fired power plants (Yang and Pollitt, 2009). Scholars such as Sueyoshi and Goto have applied different DEA models to systematically evaluate the operational and environmental efficiency of the United States US coal-fired power plants. To examine the influence of the US Clean Air Act (CAA), they used a range-adjusted measure to examine the environmental and unified performance of United States coal-fired power plants. They discussed a combined use of DEA and Discriminant Analysis (DA) (DEA–DA) to determine the efficiency scores and ranks of the electric power industry (Sueyoshi and Goto, 2010, 2012b). Tao and Zhang applied two environmental DEA models incorporating undesirable outputs to measure the environmental efficiency of the electric power industry in the Yangtze River Delta from 2000 to 2010 (Tao and Zhang, 2013). Meanwhile, Xie et al. used a two-stage environmental network DEA model to compare the efficiency of 30 provincial administrative power systems in China (Xie et al., 2012). Zhou et al. proposed a non-radial DEA approach by integrating the entropy weight and a slacks-based model (SBM) to access the environmental efficiency of the Chinese power industry at the provincial level from 2005 to 2010 (Zhou et al., 2013). Using CCR and BCC models with advanced DEA linear programming, Fang et al. attempted to compare the relative technical efficiency performance of listed coal mining companies in China and the United States (Fang et al., 2009). Sing data spanning 2002–2010, Wang et al. put forward an innovative approach based on the meta-frontier DEA theory to conduct an empirical study on energy efficiency in the eastern, central, and western regions of China. They discovered the main factors that lead to inefficiency by taking the provincial heterogeneities of production technology into full consideration (Wang et al., 2013). Wang et al. established a method based on a meta-frontier function and a non-radial directional distance function to assess performance following the interconnection of energy-saving and emissions reduction. An empirical analysis was organized to examine the primary factors that cause performance loss in energy-saving and emissions reduction (Wang et al., 2015). Zhang et al. used dynamic SBM models to evaluate the overall efficiency of decision-making units (DMUs) for the whole term period, as well as the term period efficiencies in industrial water pollution (Zhang et al., 2019). This proposed dynamic DEA model incorporates carryover activities and helps measure a period's specific efficiency based on long-term optimization during the whole period. It can also calculate the system and period efficiencies under dynamic conditions. Patricija Bajec and Danijela Tuljak-Suban proposed an integrated analytic hierarchy process (AHP) as well as an SBM DEA model (Bajec and Tuljak-Suban, 2019). First, an AHP pairwise comparison was used to rank a set of criteria (inputs, outputs) according to their importance. Then, an SBM DEA model that evaluated both the undesirable and desirable outputs was used. Incorporating undesirable performance criteria, this combined model was employed to evaluate the efficiency of logistics service providers. Yang and Wei used the game cross-efficiency DEA model to study the urban total factor energy efficiency of China's 26 interprovincial cities from 2005 to 2015. They concluded that city-scale and economic development can improve the energy efficiency of a city, while investment and endowment will lower the urban energy efficiency (Yang and Wei, 2019). Wu et al. divided 38 industries into four categories through cluster analysis and used a DEA model with non-homogeneous inputs and outputs to evaluate the energy and environmental efficiencies of 38 industries in China's industry from 2007 to 2011 (Wu et al., 2019). The results showed that the energy and environmental efficiency of China's industry is generally low, that the variation is large, and that efficiency increased over 5 years. Li Xie proposed a combined different DEA model using a Gini criterion to measure environmental efficiency (Xie et al., 2019). The authors used data for 36 Chinese industries spanning 2006–2015 and a multiple DEA with a Gini criterion as well as a systematic clustering approach. They first calculated the environmental efficiency score of Chinese industries, then identified the pollution sources based on a ranking and clustering analysis. The main conclusion was that the ranking of various industries' environmental efficiency varied greatly by time. Shao and Han proposed an SBM model to address the inefficiency of the production system after considering pollutant abatement technology heterogeneity for different kinds of pollutants (Shao and Han, 2019). The authors then employed the model to study the inefficiency of the Chinese industrial production system, analyzing the inefficiency in the stages of economic production and pollutant treatment. Sueyoshi et al. used DEA Window Analysis to evaluate the efficiency using moving averages (Sueyoshi et al., 2017). In other words, the analysis outcome focused on recent years by different windows. Therefore, the advantage of this study is that the policy implications are more accurate and credible. In their recent research on resource abundance, industrial structure, and regional carbon emissions efficiency in China, Wang and Shi et al. employed the SBM with window analysis approach to estimate the carbon emissions efficiency and abatement potential while applying the panel Tobit model to investigate the influencing factors of carbon emissions efficiency under the framework of DEA (Wang et al., 2019). Xian and Shi et al. constructed a non-parametric DDF model based on the DEA technique to measure carbon efficiency and productivity in the study of carbon emission intensity reduction targets for China's power industry (Xian et al., 2018). They determined that the nationwide 18% CO2 reduction target is not feasible through improving the technical efficiency or an upgrading of technologies for electricity generation and carbon abatement in the short or medium term. Wang and Shi et al. optimized the frontier-based optimization model by combining environmentally extended input–output analysis (EEIOA) and DEA to calculate an environmental inefficiency score in the study of spatial heterogeneity and driving forces of environmental productivity growth in China (Wang et al., 2019). They found that from 2007 to 2012, all regions experienced environmental productivity progress. According to the driving factors of environmental productivity, seven regions can be divided into three modes (Wang et al., 2019).
There are three main findings from the above literature review. First, the research to date concerning green mining efficiency and sustainable development countermeasures based on the concept of green mining and the DEA approach, especially relating to China, is relatively rare. As for the green mining evaluation indicator system, the highly correlated literature is sparse. Second, there has been much less empirical research on mining industry efficiency performance using DEA than on electricity or other energy industries. In addition, the focus of most studies on environmental efficiency or energy utilization efficiency in China has been at the state, regional, or industry level, rather than at the enterprise level. Second, there is nearly no literature using a two-stage combined DEA model to assess integrated green mining efficiency, which incorporates mining efficiency in the first production stage and environmental governance efficiency in the second stage. Most of the existing literature has focused on only one aspect of the efficiency measurement, i.e., energy production or environmental efficiency (Fang et al., 2009). Therefore, in this paper, to reveal the features of real-life production circumstances and reflect the relationship between mining and environmental governance efficiency performance, we attempted to establish a two-stage combined DEA evaluation model. Moreover, to measure green mining efficiency, we aimed to simultaneously examine the mining and environmental governance performance of China's coal industry at the enterprise level by conducting undesirable outputs conversion and distinguishing uncontrollable input variables between the two stages. Our goal was to enrich the understanding of the synergetic green mining performance of mining enterprises and thereby help the authorities formulate more targeted improvement policies.
Materials and Methods
Following the seminal work of Charnes et al., DEA as a non-parametric approach to efficiency measurement has been widely studied and applied (Charnes et al., 1978). The classical models and their extensions include the constant returns to scale model (CCR), variable returns to scale model (BCC), additive model, and slacks-based DEA models (Cook and Seiford, 2009). Compared to other measures of productivity and efficiency, the utility of DEA is a function of its ability to analyze efficiencies in systems featuring multiple inputs and outputs. DEA, as a useful tool for performance analysis, is used to evaluate the relative efficiencies of DMUs using some specific linear programming models (Tong and Ding, 2008). DEA has a number of advantages. First, it does not require any prior assumptions on the relationships between input and output data (it is therefore a non-parametric approach) (Seiford and Thrall, 1990; Zhou and Ang, 2008). Second, it only requires physical quantities of inputs and outputs for evaluating technical and scale efficiency indicators (i.e., only allocation efficiency needs fact or prices), and thus, the information required for DEA is less than that in the traditional case (Qiu-ying, 2019). Third, it is a more objective efficiency assessment because the weighting of each index is the optimal weighting determined by dimension less real data from the DMU (Tong and Ding, 2008). In addition, as Tong and Ding point out, the reason for DMU inefficiency can be found through a projection analysis of each DMU, and then, an improvement can be planned for the future. All of the above-mentioned advantages are sufficient for us to study the characteristics of the subject in this paper.
Basic Equations
In this section, we introduce a slacks-adjusted two-stage combined with input- and output-oriented BCC model. We considered applying the linear transformation function simultaneously to switch the undesirable outputs in the first stage and incorporating undesirable outputs as uncontrollable input variables to measure the second stage efficiency of coal mining enterprises located in central-west China in 2019. According to the production features of each evaluation unit, we primarily adopted the input- and output-oriented BCC equations as a reference foundation for building our two-stage slacks-adjusted combination model. Under the constraints of variable returns of scale (VRS), the production possibility set of BCC theory is defined as:
The input-oriented equations of BCC are:
min θ0
The output-oriented equations of BCC are:
minφ0
Building a Two-Stage Green Mining System Model
Currently, according to the actual conditions of China's coal enterprise operating system, and the imperative for green mining, the coal enterprises should simultaneously conduct environmental governance and restoration through the promotion of resource recycling while exploiting the coal resource. The coal enterprise operating system can be divided into two subsystems, namely, coal mining subsystem and environmental governance subsystem, respectively. The mining subsystem refers to a sequential production assignment of exploiting, transportation, ventilation, drainage, equipment maintenance, power supply, water supply, and so on. Its main purpose is to produce coal and generate profits. Within the mining subsystem, the input cannot be entirely converted into desirable outputs such as marketable coal and valuable associated resources. The undesirable outputs of industrial pollutants inevitably appear in the production process due to the limitations of the existing mining technologies. Therefore, to fulfill the goal of environmental governance, a subsystem of environmental governance is necessary to transform the undesirable outputs and newly invested inputs into desirable outputs (Bian and Yang, 2010). The two synergetic subsystems constitute the entire green mining system and are connected by undesirable outputs in this two-stage production model (Toloo et al., 2017). The system framework model is shown in Figure 1.
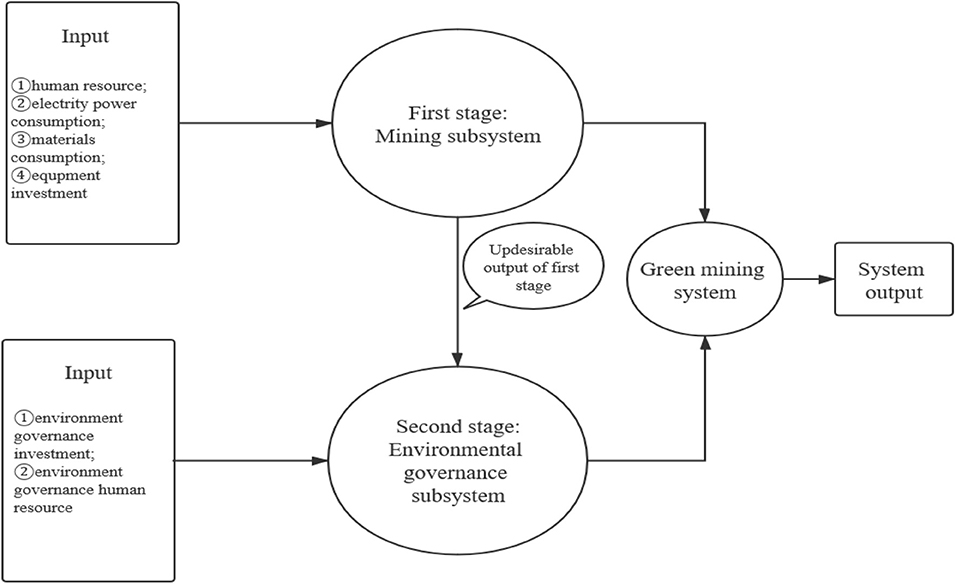
Figure 1. Two-stage green mining system framework.
To describe the two-stage system shown in Figure 1, we assume that there are n(j = 1, …, n) DMUs, and each DMU has two stages. For every DMUj(j = 1, …, n), we put into m kinds of resources in the first stage and the output of this stage is ; represents main desirable outputs, and represents the pollutants generated during the mining process, t being the undesirable output.
In the second stage, we invest I kind of resource elements process the pollutants generated in the first stage ; the final output of second stage is . Among the variables mentioned above, zj is an intermediate variable of great significance, which represents both the undesirable output of the first stage and the partial input of the second stage (Wu et al., 2017). To evaluate the first stage efficiency, it is necessary to adopt an appropriate method to deal with the undesirable output of contaminants and convert them into desirable outputs to meet the requirement of the DEA method (Sueyoshi and Goto, 2012a). Contrary to the desirable outputs, the smaller the value of undesirable outputs, the better the model can operate. In reality, according to the DEA efficiency evaluation theory, there are several transformation methods for undesirable outputs, such as the directional distance function, curve measure evaluation method, and linear transformation function. In this study, we selected the linear transformation function to convert the undesirable outputs into normal desirable outputs (Zhou and Ang, 2008). We adopted the equation of in which z represents a large enough vector large. After conversion, can be accepted as normal desirable outputs and adopted by the traditional DEA efficiency evaluation model.
Building a Two-Stage Combined DEA Model
According to the guidelines of the green mining concept, we decided to select the input-oriented radial BCC theory as the first stage modeling foundation (Sueyoshi and Goto, 2012c). In addition, to calculate the DMU efficiency of the first stage or of the mining subsystem, we introduced adjusted slack variables with constraint conditions and added the linear transformation function to refine the original BCC model and set up our own measurement method (Bi et al., 2014).
θ1 represents the efficiency value of the first stage.
From the perspective of continuously pursuing improvements in environmental governance, we selected the output-oriented radial BCC theory as the second stage modeling foundation. Hence, we designed another DEA model to calculate the efficiency of the second stage DMU of the environment governance subsystem also through introducing adjusted slack variables only in the constraint conditions. In this stage, it is important to pay attention to the different input features. As discussed above, the undesirable output of contaminants from the first stage accounts for partial inputs for the second stage. These inputs are also uncontrollable, which should be processed by the uncontrollable input method (Yang and Pollitt, 2009). Meanwhile, the newly added input elements of the second stage should be processed by the adjustable input method.
θ2 represents the efficiency value of the second stage.
Regarding the model construction, first, it is necessary to point out that we established the two-stage combined DEA model on the basis of the coal mining enterprise real production scenarios and green mining concept. Specifically, we divided the coal enterprise production system into two subsystems. One subsystem was defined as the coal mining process, while the other subsystem was defined as the comprehensive utilization of associated resources process, which can also be called the environmental governance process.
Second, we calculated the efficiency values of the different two stages through the constructed two-stage combined DEA model. Although the second stage of the DEA model seems relatively independent, we actually created the linkage between the two stages' model output by processing and transforming the undesirable contaminants generated from the first stage into desirable input elements for the second stage. According to the concept of green mining, a coal enterprise should strive toward recycling resources and environmental governance simultaneously. This two-stage combined model is able to not only reflect the real production scenarios but also measure the level of coordinated development of the two subsystems by providing efficiency values for the two stages.
Third, for each coal mining enterprise, this study combined two orientation DEA measures into one model to assess the efficiency value objectively in terms of economic development and environmental governance. We identified the first stage as the output-oriented production subsystem and the second stage as the input-oriented generation subsystem.
Establish the Two-Stage Evaluation Indicator System of Green Mining
First, according to the two-stage green mining system framework established in Literature Review, the first stage corresponds to the mining subsystem, through which the input elements can be transformed into coal output that can generate economic profits. We designed the input indicators of the mining subsystem based on the production costs and their sensitivity value sequence to coal output. Specifically, the input indicators are human resource costs, electricity and materials consumption costs (Huang et al., 2007), and fixed asset investment. The other production cost elements have been ignored because they represent only a small proportion of the total production costs. Meanwhile, the output indicators of the mining subsystem include total coal production, coal output value, and pollutants or associated resources during the mining process. The coal gangue is identified as representing solid waste (Ma et al., 2015). The liquid waste generated during the mining process is mainly mining water and industrial sewage. The coalbed methane is identified as representing waste gas. Thus, we selected the total coal production, coal gangue output, polluted mining water volume, and coalbed methane emission quantity as output indicators in the first stage. The undesirable outputs of pollutants or associated resources should be separated from the desirable outputs of coal in this stage. Obviously, the total coal output should be defined as desirable output elements and the coal gangue, polluted mining water, and coalbed methane should be defined as undesirable output elements.
The second stage corresponds to the environmental governance subsystem, through which the input elements can be converted into valuable output. It is critical to point out that the new input elements, such as environmental governance investment and relevant human resources, are indispensable inputs for the pollutant treatment and associated resource reutilization in this stage. As a result, the input indicators are composed of two parts in the second stage. These are, respectively, the pollutants or associated resources produced from the first stage, like coal gangue, polluted mining water, and coalbed methane, and the new inputs of environmental governance investment and the relevant human resources in the second stage. The output of the second stage refers to beneficial yields from pollution treatment and control. The comprehensive utilization of coal gangue has two aspects. One aspect is backfilling the mining subsidence area, and the other is the production of building materials. The abandoned mine water is treated and recycled back into production and domestic water. The coalbed methane produced during the mining process (mainly methane) is a safe and reliable clean energy source, which can be developed into multiple industrial feedstocks. Based on the strategic guidelines of the China Ministry of Environmental Protection and the Energy Bureau enacted in 2017, the utilization ratio of coalbed methane has been an important indicator of green mining. Therefore, we selected the comprehensive recycling utilization of coal gangue, polluted mine water, and coalbed methane as the output indicators for the second stage. The indicator system of green mining efficiency assessment is shown in Table 2.
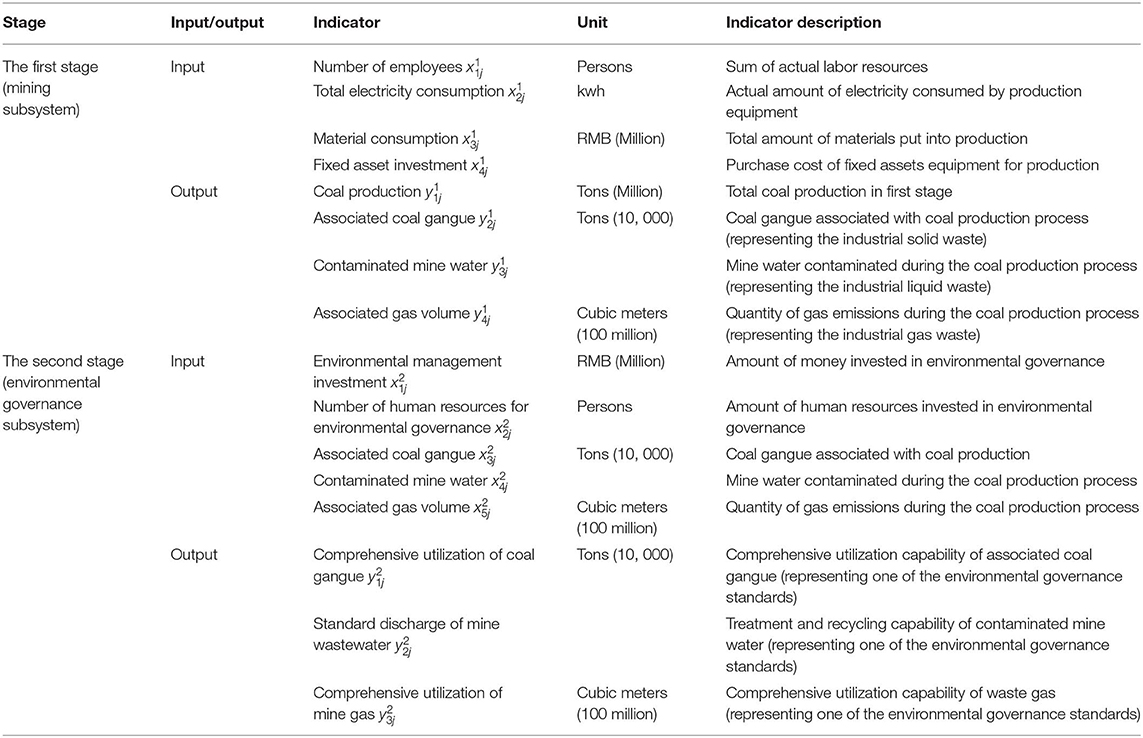
Table 2. The two-stage green mining efficiency evaluation indicator system.
Data and Sample
We selected 30 coal mining enterprises in the central and western regions of China that have received considerable attention from the National Energy Administration and the National Development and Reform Commission. They are defined as DMUs with three essential characteristics. The first is that the total coal production falls within the range of 3.6–7.8 million tons. The second is that they have similar resource endowment conditions, and the third is that they have all constructed some form of environmental governance structure. We obtained updated 2019 data through a questionnaire and field research. In addition, the enterprises are required to accept the relevant administrative authority's supervision and evaluation. Through long-term investigation and research into China's coal industry, we selected 30 coal enterprises that represent the real and universal situations of green mining in China. All the above factors describe the characteristics of the sample for this empirical study. To achieve a reasonable level of discrimination, one rule of thumb was to limit the number of input and output indicators. For example, the number of DMUs should be at least twice the total number of inputs and outputs (Chen, 2009). Here, we have 30 DMUs, 4 inputs and 4 outputs in the first stage, and 5 inputs and 3 outputs in the second stage. Thus, our results have a reasonable level of discrimination. The summary statistics of the original data (index form) are provided in Table 3.
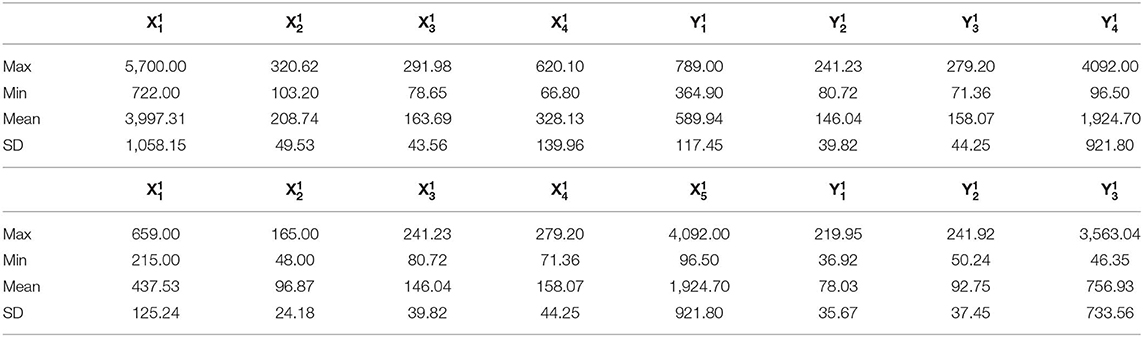
Table 3. Summary statistics of input and output indicators.
Empirical Study
There are three main findings as shown in Tables 4, 5, Figures 2, 3. The efficiency values of the two-stage model are presented in Table 4. The θ1 represents the efficiency value of the first stage, and the θ2 represents the efficiency value of the second stage. To illustrate the real status of the two-stage efficiency level for each DMU, we drew the histogram in Figure 2 according to the data given in Table 4. The fluctuation features and ranking differences of the two-stage efficiency level of each DMU can be observed clearly in Figure 3.
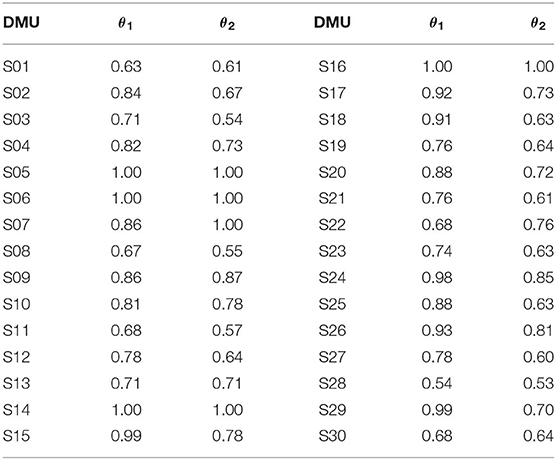
Table 4. The calculated efficiency values of the two-stage model for each DMU.
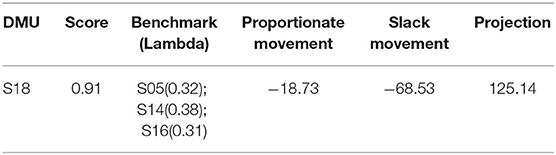
Table 5. Detailed calculation results relating to material consumption.
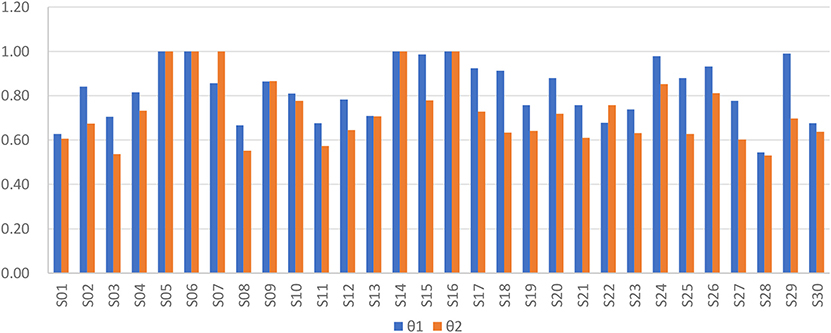
Figure 2. The two-stage efficiency value of each decision-making unit (DMU).
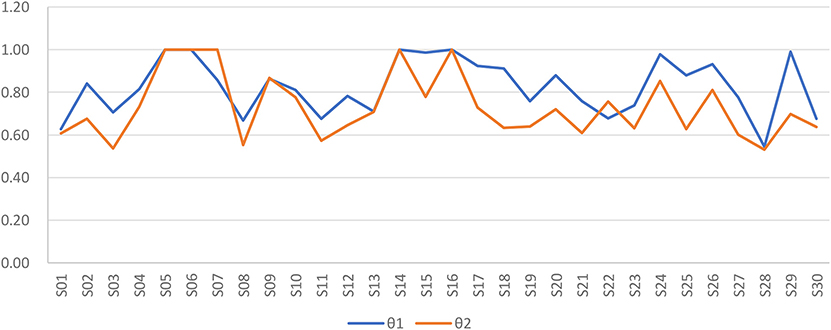
Figure 3. The fluctuation curve of the two-stage efficiency level.
First, we recognized that the efficiency values for both stages fluctuated dramatically among the 30 DMUs, as portrayed in Figures 2, 3. They show that there was great potential for efficiency improvement in various coal enterprises, especially in the environmental governance stage. For the coal enterprises whose efficiency levels in the second stage were relatively low, it was apparent that efforts should be made to improve both mining and environmental governance efficiency and to maintain a balance between environmental and economic benefits.
Second, from the comparison of the efficiency value ranking scores, the 30 coal enterprises generally fell into three categories. In this article, we defined the categories largely on the ranking scores of the two-stage efficiency level. The top 6 of the two-stage efficiency values ranking constituted the first category, while the last 6 of the two-stage efficiency values ranking constituted the third category, and the middle 7–24 of the two-stage efficiency values belonged to the second category. The enterprises whose two-stage efficiency values were simultaneously high among the sample enterprises, i.e., whose efficiency value ranked at a high position in both stages, with hardly any difference, such as S05, S06, S14, and S16, are clearly apparent in Figures 2, 4 and were classified into the first category. It is important to highlight that the first category enterprises ranked highly in terms of both mining and environmental governance. Consequently, the synergetic development level in the two stages is the highest among the sample. Actually, these enterprises were continuously engaged in seeking synergetic performance growth in both the mining stage and environmental governance stage. The enterprises whose second stage efficiency values were lower than those of the first category at different degrees, and whose efficiency value ranking scores were also lower than those of the first category, i.e., S02, S04, S07, S08, S09, S10, S12, S13, S15, S17, S18, S19, S20, S21, S22, S23, S24, S25, S26, S27, S29, and S30, are clearly apparent in Figures 2, 4 and belong to the second category. It is also meaningful to note that deviations in ranking of the efficiency value of the second stage not only existed but also were larger than those of the first category. Logically, the synergetic development level of the second stage was lower than that of the first category. Obviously, in reality, these enterprises had tended to focus on mining efficiency while neglecting environmental governance to some degree. Consequently, they generally had poor environmental governance performance. The enterprises whose efficiency level ranked in the last six positions, such as S01, S03, S11, and S28 can be seen in Figures 2, 4 and are classified as belonging in the third category. It is not difficult to surmise that it was the poor operation standards that lead to the lowest efficiency values ranking status of the third category enterprises. Undoubtedly, the third category enterprises had a poor synergetic development level of mining and environmental governance.
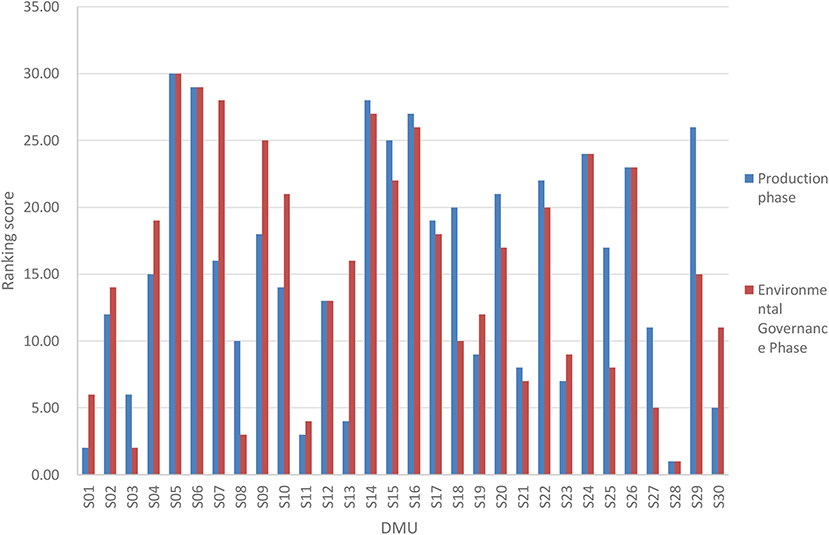
Figure 4. The efficiency level ranking of the two stages for each DMU.
In addition, we determined the enterprise percentage of the three different categories as demonstrated in Figure 5. It can be seen that the second category enterprises accounted for the highest percentage among all the sample enterprises. The first category enterprises accounted for almost the same percentage among all the sample enterprises. This percentage distribution situation resembled a spindle structure. In reality, this kind of distribution structure also conforms with the real green mining development status of coal mining enterprises in China at the present stage.
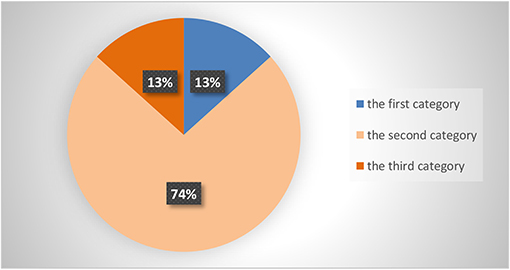
Figure 5. The enterprise percentage distribution of the three different categories.
Third, we were able to obtain the specific data and corresponding countermeasures to improve the efficiency levels. Detailed information about the efficiency value, benchmark (lambda), proportionate movement, slack movement, and projection value of each input and output can be achieved from the exported model calculation results. Owing to space limitations, we chose one input of material consumption from DMU18 in the first stage to be displayed in Table 5. We devised countermeasures to adjust its input value to optimize its efficiency value according to the corresponding parameters exported from the model calculation results. Based on the data information in the proportionate movement and slack movement columns, we adjusted the amount and direction of input elements to reach the projection value. Correspondingly, the efficiency value can be optimized eventually. For instance, to reach the projection value and optimize the efficiency value of DMU18 in the first stage, we can diminish the input value of material consumption in the first stage by 0.6853 million yuan on the basis of the data information found in the proportionate movement column. Meanwhile, we can decrease the value of the input element of material consumption by DMU18 in the first stage by 0.1873 million yuan according to the data information found in the slack movement column to reach the projection value of 1.2514 million yuan, thereby improving the efficiency value rationally. Actually, we can carry out such adjustments for all the input and output indicators of the two stages according to the parameters exported from the MAXDEA calculation results to realize green mining performance improvement across all 30 DMUs. Owing to space limitations, we displayed the full information in Appendix. By generating quantified evidence, all of these precise adjustments indicate that this empirical study is exactly what is needed by the coal authorities to improve green mining efficiency.
Conclusions
This study set up a two-stage green mining system structure and the correlated input–output indicator system to evaluate green mining efficiency. In addition, a two-stage combined DEA model was proposed to assess the mining subsystem and environmental governance subsystem efficiency of 30 sample coal enterprises situated in China's central-west region in 2019. This empirical study provides detailed information about the efficiency value, efficiency ranking level, benchmark of scale to return, value of slack movement, value of proportionate movement, and value of projection for the 30 DMU. Together, all of this information provides policy makers (especially at the enterprise level) with valuable insights into green mining and improvement countermeasures. DEA has been widely applied to evaluate the performance of the energy industry. However, few studies to date have attempted to deal with the case of mining enterprises by evaluating their mining and environmental governance performance simultaneously. The four key findings of this study were as follows.
First, the coal enterprises fell into three categories based on a comparison of their two-stage efficiency values and ranking status. The first category enterprises had high efficiency ranking (top 6) in terms of both mining and environmental governance and their synergetic development level in the two stages was the highest among the sample. Consequently, the enterprises in the first category were regarded as being green mining enterprises with a high level of efficiency. The enterprises in the second category had a lower efficiency ranking in both mining and environmental governance than those in the first category. Moreover, the larger deviations in the efficiency ranking in the second stage of the second category revealed that the synergetic development level in the two stages was lower than that of the first category. In reality, the second category enterprises could be generally regarded as green mining enterprises with middle-level efficiency. The third category enterprises had the lowest efficiency ranking (lowest 6) in the two stages. Accordingly, the operation capability and synergetic development level of mining and environmental governance were both poor. It was therefore unrealistic to discuss the green mining efficiency level of the third category enterprises.
Second, we determined the enterprise percentage of the three different categories. From Figure 5, it can be seen that the second category enterprises accounted for the highest percentage among all the sample enterprises. There was almost no difference in the ratio of the first and the third category enterprises. They both accounted for 13% of the sample enterprises. This percentage distribution situation embodied the features of a spindle structure. Actually, this kind of distribution situation also conforms with the real green mining development status of mining enterprises in China at the present stage. This finding is helpful for policy makers tasked with formulating rational countermeasures geared at optimizing the layout of the coal industry in the central and western area by adjusting the percentage distribution.
Third, the exported parameters information from the two-stage combined DEA model definitely provided a quantitative basis for efficiency level improvements. This is crucial for coal enterprise managers who are trying to pursue continuous progress in green mining implementation and operation capability.
Fourth, several specific policy implications and improvement countermeasures for mining enterprises come to light from the empirical study results. With respect to the grim environmental damage that has accompanied coal mining in China for decades, high priority should be given to the establishment of a green mining policy system to encourage mining enterprises to shoulder the responsibility for implementing green and low-carbon development.
From the perspective of optimizing coal mining industrial layout, the authorities should create a green mining efficiency evaluation system in coal mining enterprises based on the two-stage model and, in strict accordance with the efficiency ranking status of the two-stage model, formulate a set of rules needed to eliminate the enterprises that have poor operations. According to our empirical study, the third category enterprises had the lowest efficiency value rankings in the two-stage model. This means that based on the quantified evaluation results, such enterprises should be eliminated. Meanwhile, to boost the green mining efficiency of the mining sector, the authorities should also design incentive policies to stimulate the smart expansion and growth of the first category enterprises.
From the perspective of technology innovation, the authorities should reinforce the application and reformation of green mining technologies. Currently, green mining technologies primarily refer to mine filling, water preservation, simultaneous extraction of coal and gas, oxidizing utilization of ventilation air methane (VAM), and gangue discharge reduction. Specifically, the authorities should formulate regulations and establish standards to encourage the application of green mining technologies and simultaneously curb the use of old mining methodologies at the coal enterprise level. The government should also foster green mining technology innovations through cooperation mechanisms by forging efficient operation frameworks organized by government sectors, commercial corporations, and coal enterprises. It is essential to identify priority areas of technology application and innovation. Methane extraction and comprehensive utilization technologies are definitely of great significance in improving the environmental governance efficiency in the second stage. Therefore, it is imperative to propel the policy design with respect to the application and innovation of methane extraction and comprehensive utilization technologies in coal mining enterprises.
In terms of institutional innovation, to implement rigorous control over production behaviors that intentionally ignore environmental performance, the authorities should strengthen the relevant legislation and regulations. As for positive institutional design, feasible tax subsidies, and financial aid policies should be created to encourage enterprises to promote the comprehensive utilization of coalbed methane, coal gangue, and other associated resources. For instance, a value-added tax (VAT) exemption policy for imported equipment should be issued to motivate enterprises to invest in advanced equipment that facilitates clean production and green mining implementation. In addition, a green mining assistance fund could be established from the central government budget to finance the renovation of coal mine gas control technologies. Meanwhile, green mining system channels could be increased through the issuance of treasury bonds and creation of financial instruments (Zhu et al., 2019). As for public governance, the authorities should build and improve the stakeholder common governance institutions to achieve the goal of joint progress between enterprises and the society. Co-governance mechanisms could also serve as important factors for conducting transparent and strict supervision of information disclosure pertaining to the environmental governance performance of coal enterprises.
Data Availability Statement
All datasets generated for this study are included in the article/supplementary material.
Author Contributions
YW conceived the idea and developed the model. YL and SW collected the data and finished the programming. SW analyzed the results and wrote the paper.
Funding
This work was supported by grants from the Provincial and Ministerial Coalbed Methane Joint Fund Project of China (No. 2015012017).
Conflict of Interest
The authors declare that the research was conducted in the absence of any commercial or financial relationships that could be construed as a potential conflict of interest.
References
Bajec, P., and Tuljak-Suban, D. (2019). An integrated analytic hierarchy processslack based measure-data envelopment analysis model for evaluating the efficiency of logistics service providers considering undesirable performance criteria. Sustainability 11, 1–18. doi: 10.3390/su11082330
Bi, G.-B., Song, W., Zhou, P., and Liang, L. (2014). Does environmental regulation affect energy efficiency in China's thermal power generation? Empirical evidence from a slacks-based DEA model. Energy Policy 66, 537–546. doi: 10.1016/j.enpol.2013.10.056
Bian, Y., and Yang, F. (2010). Resource and environment efficiency analysis of provinces in China: a DEA approach based on Shannon's entropy. Energy Policy 38, 1909–1917. doi: 10.1016/j.enpol.2009.11.071
Charnes, A., Cooper, W. W., and Rhodes, E. (1978). Measuring the efficiency of decision making units. Eur. J. Oper. Res. 2, 429–444. doi: 10.1016/0377-2217(78)90138-8
Chen, T.-H. (2009). Performance measurement of an enterprise and business units with an application to a Taiwanese hotel chain. Int. J. Hospitality Manage. 28, 415–422. doi: 10.1016/j.ijhm.2008.10.010
Cook, W. D., and Seiford, L. M. (2009). Data envelopment analysis (DEA) - thirty years on. Eur. J. Oper. Res. 192, 1–17. doi: 10.1016/j.ejor.2008.01.032
Fang, H., Wu, J., and Zeng, C. (2009). Comparative study on efficiency performance of listed coal mining companies in China and the US. Energy Policy 37, 5140–5148. doi: 10.1016/j.enpol.2009.07.027
Franks, D. M., Brereton, D., and Moran, C. J. (2010). Managing the cumulative impacts of coal mining on regional communities and environments in Australia. Impact Assess. Proj. Appraisal 28, 299–312. doi: 10.3152/146155110X12838715793129
Huang, J. J., Chen, Z. Y., and Jiang, B. (2007). Research on investment estimation of environmental management engineering of abandoned dew mining mountain. Geol. Hydrobiol. Eng. 109–112.
Kirkey, J. (2014). Eco Friendly Mining Trends for 2014. Available online at: https://www.mining-technology.com/features/featureenvironment-friendly-mining-trends-for-2014-4168903/
Ma, J., Yu, Z. M., and Shu, S. H. (2015). Environmental hazards and measures of coal gangue to mining area. Coal Eng. 47, 70–73.
Mamurekli, D. (2010). Environmental impacts of coal mining and coal utilization in the UK. Acta Montanistica Slovaca 15, 134–144.
Nurmi, P. A. (2017). Green mining - a holistic concept for sustainable and acceptable mineral production. Ann. Geophys. 60, 1–7. doi: 10.4401/ag-7420
Qiu-ying, L. (2019). Input and output efficiency of urban agglomerations in China using DEA multi-stage model %. J Ecol. Econ. 15, 95–100.
Seiford, L. M., and Thrall, R. M. (1990). Recent developments in DEA: the mathematical programming approach to frontier analysis. J. Econ. 46, 7–38. doi: 10.1016/0304-4076(90)90045-U
Shao, Y., and Han, S. (2019). The synergy in the economic production system: an empirical study with Chinese Industry. Sustainability 11, 1–12. doi: 10.3390/su11040980
Shi, H. Q. (2012). Mine green mining. 2012 Int. Confer. Future Energy Environ. Mater. 16(Pt A), 409–416. doi: 10.1016/j.egypro.2012.01.067
Shi, X., Rioux, B., and Galkin, P. (2018). Unintended consequences of China's coal capacity cut policy. Energy Policy 113, 478–486. doi: 10.1016/j.enpol.2017.11.034
Sueyoshi, T., and Goto, M. (2010). Should the US clean air act include CO2 emission control?: examination by data envelopment analysis. Energy Policy 38, 5902–5911. doi: 10.1016/j.enpol.2010.05.044
Sueyoshi, T., and Goto, M. (2012a). DEA radial measurement for environmental assessment and planning: desirable procedures to evaluate fossil fuel power plants. Energy Policy 41, 422–432. doi: 10.1016/j.enpol.2011.11.003
Sueyoshi, T., and Goto, M. (2012b). Efficiency-based rank assessment for electric power industry: a combined use of Data Envelopment Analysis (DEA) and DEA-discriminant analysis (DA). Energy Economics 34, 634–644. doi: 10.1016/j.eneco.2011.04.001
Sueyoshi, T., and Goto, M. (2012c). Environmental assessment by DEA radial measurement: U.S. coal-fired power plants in ISO (Independent System Operator) and RTO (Regional Transmission Organization). Energy Econ. 34, 663–676. doi: 10.1016/j.eneco.2011.08.016
Sueyoshi, T., and Yuan, Y. (2015). China's regional sustainability and diversified resource allocation: DEA environmental assessment on economic development and air pollution. Energy Econ. 49, 239–256. doi: 10.1016/j.eneco.2015.01.024
Sueyoshi, T., and Yuan, Y. (2018). Measuring energy usage and sustainability development in Asian nations by DEA intermediate approach. J. Econ. Struct. 7:6. doi: 10.1186/s40008-017-0100-0
Sueyoshi, T., Yuan, Y., Li, A., and Wang, D. (2017). Social sustainability of provinces in China: a Data Envelopment Analysis (DEA) window analysis under the concepts of natural and managerial disposability. Sustainability 9, 1–18. doi: 10.3390/su9112078
Tao, Y., and Zhang, S. (2013). Environmental efficiency of electric power industry in the Yangtze River Delta. Math. Comput. Model. 58, 927–935. doi: 10.1016/j.mcm.2012.10.025
Toloo, M., Emrouznejad, A., and Moreno, P. (2017). A linear relational DEA model to evaluate two-stage processes with shared inputs. Comput. Appl. Math. 36, 45–61. doi: 10.1007/s40314-014-0211-2
Tong, L., and Ding, R.-J. (2008). Efficiency assessment of coal mine safety input by data envelopment analysis. J. China Univ. Mining Technol. 18, 88–92. doi: 10.1016/S1006-1266(08)60019-X
Wang, J., Wang, K., Shi, X., and Wei, Y.-M. (2019). Spatial heterogeneity and driving forces of environmental productivity growth in China: would it help to switch pollutant discharge fees to environmental taxes? J. Clean. Prod. 223, 36–44. doi: 10.1016/j.jclepro.2019.03.045
Wang, Q., Su, B., Sun, J., Zhou, P., and Zhou, D. (2015). Measurement and decomposition of energy-saving and emissions reduction performance in Chinese cities. Appl. Energy. 151, 85–92. doi: 10.1016/j.apenergy.2015.04.034
Wang, Q., Zhao, Z., Zhou, P., and Zhou, D. (2013). Energy efficiency and production technology heterogeneity in China: a meta-frontier DEA approach. Econ. Model. 35, 283–289. doi: 10.1016/j.econmod.2013.07.017
Wu, J., Li, M., Zhu, Q., Zhou, Z., and Liang, L. (2019). Energy and environmental efficiency measurement of China's industrial sectors: a DEA model with non-homogeneous inputs and outputs. Energy Econ. 78, 468–480. doi: 10.1016/j.eneco.2018.11.036
Wu, J., Xiong, B., An, Q., Sun, J., and Wu, H. (2017). Total-factor energy efficiency evaluation of Chinese industry by using two-stage DEA model with shared inputs. Ann. Operations Res. 255, 257–276. doi: 10.1007/s10479-015-1938-x
Xian, Y., Wang, K., Shi, X., Zhang, C., Wei, Y.-M., and Huang, Z. (2018). Carbon emissions intensity reduction target for China's power industry: an efficiency and productivity perspective %. J. Clean. Prod. 197, 1022–1034. doi: 10.1016/j.jclepro.2018.06.272
Xie, B.-C., Fan, Y., and Qu, Q.-Q. (2012). Does generation form influence environmental efficiency performance? An analysis of China's power system. Appl. Energy 96, 261–271. doi: 10.1016/j.apenergy.2011.11.011
Xie, L., Chen, C., and Yu, Y. (2019). Dynamic assessment of environmental efficiency in chinese industry: a multiple dea model with a gini criterion approach. Sustainability 11, 1–12. doi: 10.3390/su11082294
Yang, H., and Pollitt, M. (2009). Incorporating both undesirable outputs and uncontrollable variables into DEA: the performance of Chinese coal-fired power plants. Eur. J. Oper. Res. 197, 1095–1105. doi: 10.1016/j.ejor.2007.12.052
Yang, Z., and Wei, X. (2019). The measurement and influences of China's urban total factor energy efficiency under environmental pollution: based on the game cross-efficiency DEA. J. Clean. Prod. 209, 439–450. doi: 10.1016/j.jclepro.2018.10.271
Zhang, R., Lu, C.-C., Lee, J.-H., Feng, Y., and Chiu, Y.-H. (2019). Dynamic environmental efficiency assessment of industrial water pollution. Sustainability 11, 1–22. doi: 10.3390/su11113053
Zhou, P., and Ang, B. W. (2008). Linear programming models for measuring economy-wide energy efficiency performance. Energy Policy 36, 2911–2916. doi: 10.1016/j.enpol.2008.03.041
Zhou, Y., Xing, X., Fang, K., Liang, D., and Xu, C. (2013). Environmental efficiency analysis of power industry in China based on an entropy SBM model. Energy Policy 57, 68–75. doi: 10.1016/j.enpol.2012.09.060
Zhu, N., Bu, Y., Jin, M., and Mbroh, N. (2019). Green financial behavior and green development strategy of Chinese power companies in the context of carbon tax. J. Clean. Prod. 245:118908. doi: 10.1016/j.jclepro.2019.118908
Appendix
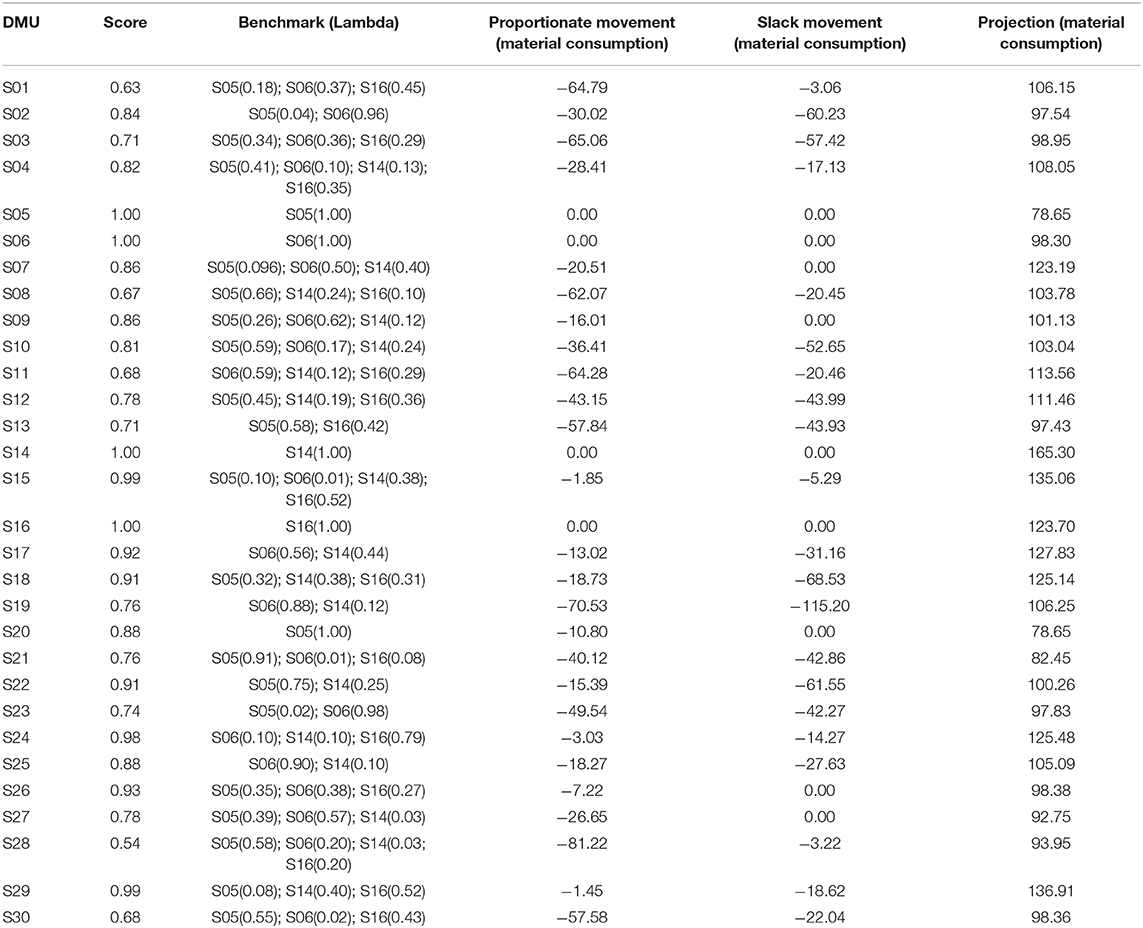
Table A1. Detailed calculation results for all 30 enterprises.
Keywords: green mining, mining efficiency, environmental governance efficiency, two-stage combined DEA model, improvement countermeasure
Citation: Wang Y, Lei Y and Wang S (2020) Green Mining Efficiency and Improvement Countermeasures for China's Coal Mining Industry. Front. Energy Res. 8:18. doi: 10.3389/fenrg.2020.00018
Received: 13 November 2019; Accepted: 03 February 2020;
Published: 04 March 2020.
Edited by:
Xunpeng Shi, University of Technology Sydney, AustraliaReviewed by:
Keying Wang, Hubei University of Economics, ChinaQunwei Wang, Nanjing University of Aeronautics and Astronautics, China
Copyright © 2020 Wang, Lei and Wang. This is an open-access article distributed under the terms of the Creative Commons Attribution License (CC BY). The use, distribution or reproduction in other forums is permitted, provided the original author(s) and the copyright owner(s) are credited and that the original publication in this journal is cited, in accordance with accepted academic practice. No use, distribution or reproduction is permitted which does not comply with these terms.
*Correspondence: Ying Wang, MjAzOTgxOTczNEBxcS5jb20=; Yuxuan Lei, bGVpeXV4dWFuQGdtYWlsLmNvbQ==