 Yimin Tan
 Na Liu1†
 Kejian Lin
- 1School of Industrial Engineering, Beijing Institute of Technology, Zhuhai, China
- 2Sea Electric Energy, Inc., Mississauga, ON, Canada
- 3Sea Electric Energy, Inc., Shenzhen, China
Point absorbers utilize the relative motion between the floating body and the submerged body to harvest the wave energy. This paper presents the parametric study of a two-body wave energy point absorber to investigate the influence of key design factors. The absorber employs a slotless Halbach linear generator as the power take-off system to improve the energy conversion efficiency. In this work, we linearized our developed nonlinear time domain model and presented it in frequency domain to improve the simulation efficiency, where the results of the time domain model and the frequency domain model are compared. The stochastic linearization method is employed to linearize the nonlinear dragging effect of a two-body point absorber. The case study suggests that both stiffness of the power take-off system and viscous floater dragging coefficient should be as small as possible and the optimal mass of the bodies should be adopted to achieve the maximum power output. Under the irregular wave condition, the power matrix against the wind speed and the damping coefficient of the power take-off system shows that the optimal damping coefficient is determined by the local weather and geographic condition. Regarding the determinants of the damping coefficient, the factors that affect the power take-off system is investigated. We find that the Halbach PM array length and the coil width should be specially optimized to obtain the desired damping coefficient of the power take-off system at a given point absorber dimension. Lastly, a test-rig has been built to validate the magnetic domain model.
1. Introduction
To date, various kinds of wave energy converters (WEC) have been proposed to harness wave energy and several designs have been put into sea tests (Hong et al., 2016; Lehmann et al., 2017). Among different types of the WECs, the point absorber is the most suitable design to power the standalone devices because of its structural simplicity. Point absorbers typically consist of one or two heaving bodies that extract the wave energy from the heaving motion by a power take-off (PTO) system. For one-body point absorbers, the motion refers to the relative displacement between a floater and a fixed frame. For the two-body point absorbers, the input motion is the relative displacement between the floater and a submerged oscillating body caused by the difference in buoyancy. Compared to one-body designs, two-body point absorbers do not require a bulky structure to lower the resonant frequency and the installment is not significantly restricted by the water depth. In addition, Beatty et al. (2015) and Davis et al. (2014) have proven that the two-body design leads to an increase in the captured power because of the additional hydrodynamic added mass of the submerged body. The experimental study conducted by Beatty et al. (2019) has proven that the point absorber with a heaving plate will yield a higher power production by 41%. Furthermore, the heaving plate of the submerged body reacts to the wave-brought oscillation so that the stability of the WEC can be increased. Thus, it is favorable to employ the Self-reacting Two-body Point Absorber (STPA) for powering the offshore devices.
Efforts have been made to model the STPA from different aspects. Cummins (1962) first proposed a time domain approach in 1962 to describe the hydro-dynamics of floating objects that formed the foundation of the subsequent time domain modeling works by Babarit et al. (2012), De Andrés et al. (2013), and Olaya et al. (2013). Besides the time domain model, various works (Bosma et al., 2012; Beatty et al., 2015, 2019; Liang and Zuo, 2017) have been done to model WEC in frequency domain. Compared to the time domain model, the frequency domain model can save the computational effort and significantly improve the optimization efficiency. With the developed frequency domain models, parametric studies have been conducted to numerically analyze the performance of STPA. Diamond et al. (2015) presented a numerical and experimental study that modulated the added mass for maximizing the performance of a SPTA. The dynamic effects associating with the linear hydrodynamic terms were accounted in the study, however, the nonlinear viscous drag was neglected and the result is only validate under the regular wave assumption. In the STPA, the heaving plate of the submerged body will introduce a significant nonlinear viscous dragging force that can not be neglected. In order to implement the frequency domain model more accurately, the linearization of the nonlinear viscous drag, has to be addressed. To study the dynamics of the SPTA, Liang and Zuo (2017) and Beatty et al. (2019) linearized the nonlinear quadratic dragging by matching a linear system to the experiment results (Beatty et al., 2015) that has a relative small displacement. As presented by Beatty et al. (2019), the linearized model matches well with the experiments. However, the tests were conducted under the scenario that the STPA operates close to the linear region. While deployed in the sea environment, the STPA will work near its resonant point to maximize the power production and the displacement will be significantly enlarged. As a result, the performance prediction with empirical linearization might not be reliable. Statistic linearization method provides an alternative approach to linearize the nonlinear terms in wave energy converters. To accurately linearize the non-linear dragging term in a single body catenary anchor leg mooring buoy, Salem et al. (2012) compared the quadratic, cubic, and stochastic linearization method and pointed that the stochastic linearization method shows a good agreement for the period range of incident wave. A similar linearization method had been applied by Siow et al. (2014) in describing the dragging behavior of the a fixed submerged structure. Although the stochastic linearization method has been applied in the static ocean engineering discipline, few effort has been made to linearize the nonlinear dragging term in the wave energy point absorber by adopting the method. Guanwardane et al. (2017) proposed frequency domain model that attempts to linearize the non-linear hydrostatic stiffness of a heaving-sphere point absorber using the stochastic linearization method. Although the model shows a moderate accuracy against the nonlinear time domain model without a large heaving amplitude, the nonlinear dragging effect has been neglected. Spanos et al. (2016) presented the dynamic analysis of a nonlinear wave energy point absorber to resolve the large displacements of a single body wave energy harvester. In the analysis, the authors applied the stochastic linearization technique to minimize the mean square error between the linear and the nonlinear systems. Later, da Silva et al. (2019) discussed the plausibility of linearizing the commonly nonlinear terms, including the dragging force, for a single floater point absorber. Besides, Tom et al. (2016) linearized the quadratic viscous drag for an oscillating surge wave energy converter to find the optimal design. It should be noted that the majority of the above research are limited to the analysis and optimization of a one-body point absorber. To our knowledge, the influence of this linearization method on a two-body self reacting SPTA hasn't been explored and verified yet. As a step of our on-going project, we aim to demonstrate the potential of the stochastic linearization method on the frequency domain modeling of the STPA.
Besides the dynamics of the STPA, the PTO system usually determines the performance of wave energy converters. To date, several typical PTO systems have been proposed to extract energy from the ocean wave for point absorbers (Vermaak and Kamper, 2012; Zurkinden et al., 2014; Hong et al., 2016; Liang et al., 2017). The direct-driven linear generators directly link to the wave without any motion transmission, therefore the relative high efficiency and the low maintenance cost are the main advantages over other mechanisms. Conventionally, the slotted linear generator are widely employed in the PTO system, e.g., the works by Danielsson et al. (2006) and Elwood et al. (2010). However, the detent force of the slotted topology significantly destabilize the relative displacement between the floater and the reacting body by introducing the electromagnetic nonlinearity. In order to avoid the unnecessary nonlinearity, we have proposed to employ a slotless linear generator to eliminate the magnetic detent force (Tan et al., 2018). In the design, the magnetic flux density loss of a slotless topology is compensated by the Halbach PM arrays because this arrangement of the PMs can greatly enhance the magnetic distribution in the air gap. Due to the fact that the equivalent PTO damping coefficient will significantly affect of the performance of the STPA, the second aim of this work is to investigate the determinants of the damping coefficient in the PTO system.
To sum up, the present study has two main parts. First, to save the computational cost, we have developed the frequency domain model of a two-body STPA whose nonlinear viscous dragging force is linearized employing the stochastic linearization method. This linearized frequency domain model has been numerically verified by comparing the results to that of the nonlinear time domain model. Subsequently, the dependence of the STPA performance on the PTO stiffness, PTO damping coefficient, dragging settings, and masses of the floating body and the submerged body has been investigated using the developed frequency domain model. Second, for the PTO damping coefficient matching, a magnetic domain model of the slotless Halbach PM array linear generator has been developed. We have investigated the influence of the key magnetic domain parameters on the PTO damping coefficient. In the following sections, the mathematical formulation is presented in sections 2.1 and 2.2. The analysis of the STPA under regular and irregular waves are presented in sections 3.1 and 3.2. Then, the study of the PTO system is presented in section 4.1 while the validation of the PTO system model is presented in section 4.2.
2. Modeling
2.1. Dynamics of Wave Energy Converter and Its Frequency Domain Model
The scheme of the targeting self-reacting point absorber has been shown in Figure 1. The floater is piercing through the water surface while driven by the wave. A heaving plate is adopted in the reacting body as suggested by the experimental result of Beatty et al. (2019). The submerged reacting body is hanging in the water. In the design, coils and the permanent magnets are both embedded in the reacting body, while the relative displacement is transmitted to the PTO system by the central shaft. As energy is extracted from the relative displacement between the floater and the reacting body, the heave motion is mainly considered in this modeling work.
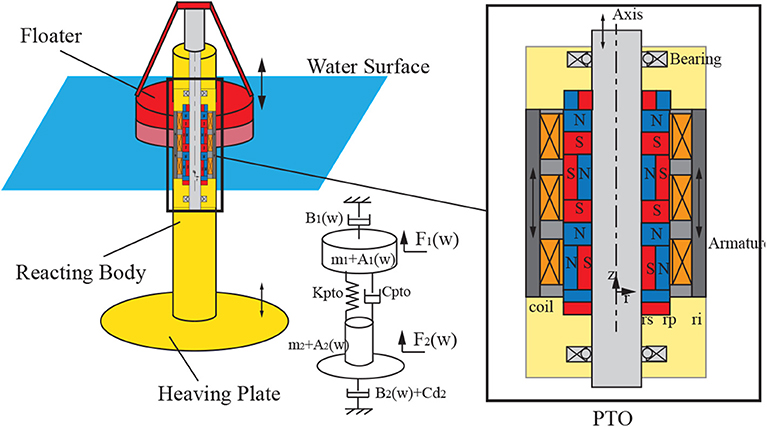
Figure 1. Scheme of the self-reacting point absorber.
The point absorber is modeled as two-body oscillation system as shown in Figure 1. The linear potential flow theory is applied to model the wave-structural interaction, in which theory, the water is assumed to be inviscid, incompressible, and irrotational under the moderate sea state.
The equation of the motion in the time domain can be written as,
As mentioned above, the main nonlinear force encountered by a submerged structure is the nonlinear dragging force. The term is derived from the Morrison equation. In the above equation, Cd is the dragging coefficient. Ad is the effective cross-sectional area, dominated by the heave plate. ρ is the density of water. To conduct the frequency domain analysis, the term has been linearized using the stochastic linearization method, introduced by Salem et al. (2012) and Chakrabarti (2002).
Under the regular wave excitation,
where σẋ is the RMS value of the response velocity.
Under the irregular wave excitation,
where ωn represents the natural frequency of the system.
Substituting the above expressions in Equations (1) and (2), and conducting Laplace transform, we can obtain the equation of motion in complex frequency domain.
Under the irregular wave excitation,
Under the regular wave excitation,
In the above equations, X1 and X2 are the heave motion amplitudes of the floater and reacting body. The parameter m1, m2 and Ac1, Ac2 are the respective masses and cross-sectional areas of the floater and the reacting body. A1(ω) and A2(ω) are the added mass of the floater and the reacting body. B1(ω) and B2(ω) are the radiation damping coefficients. Fexc1(ω) and Fexc2(ω) are the vector of the wave excitation force in the frequency domain. For a complex geometry as for the STPA, the above functions are obtained using Boundary Element Method by AQWA. The parameter Cpto and Kpto are the equivalent damping coefficient and stiffness of the PTO system, which will be discussed in the following section.
Writing the above equations in a matrix format,
where H is the transfer matrix whose elements are lists below,
Under the irregular wave excitation,
Under the regular wave excitation,
Extending variable s with ωj, the response of the STPA in the frequency domain can be solved iteratively. Ignoring the damping term in the transfer matrix, we can obtain the natural frequencies by setting the determinant of the characteristic matrix to be zero.
The relative motion speed between the two bodies equals to Ẋrel = Ẋ1 − Ẋ2 while the average absorbed power of such a wave energy converter can be expressed as,
2.2. Determinant of the Power-Take-Off System
Regarding the PTO system, the slotless design topology is selected to eliminate the cogging force induced force ripple, so that the stability of the STPA can be significantly improved. In order to compensate for the magnetic flux density loss in the air gap, the Halbach magnet array has been adopted to improve the conversion efficiency of the STPA. The magnetic topology of the PTO system has been shown in Figure 1.
In the modeling, we have assumed that the coil is moving inside the armature without introducing the fringing effects. In addition, the permeability of the armature is assumed to be infinitely large for its ferromagnetic property. The geometry of the PTO system can be simply divided into three regions: the central shaft region(non-magnetic), the PM arrays region, and the coil region(including the air gap). Introducing magnetic vector potential term A, defined as B = ∇ × A, the magnetic domain equations can be written as,
By setting corresponding boundary conditions and conducting mathematical manipulations, we can obtain the final magnetic flux density distribution whose analytical expression is shown below.
where I and K denote to the modified Bessel functions of first and second kind.
With the derived expression of the magnetic flux density distribution, we can obtain the flux linkage and the EMF of the linear generator. Assuming each coil (turns of N) occupies the area shown in Figure 1 with a height of h. Then, the flux linkage of a single coil can be obtained from the integration, as in Wang et al. (2003),
Consequently, we can derive the coil-induced EMF, which equals to . The EMF induced magnetic force exerting on a coil can be calculated using the current density generated at a given load. Thus, the total reacting force of 3-phase winding can be written in the following format,
Treating this force as a damping related term, we can obtain the equivalent damping coefficient of the PTO system.
Conventionally, it is considered that the selection of the wiring AWG will significantly affect the absorbed power of the PTO system. When a thinner wire is chosen, in the same winding space, the turn number increases which leads to a higher EMF and winding resistance. It is necessary to find an optimal AWG gauges that can maximize the total power output.
Recall Equation (24), the relationship between the generated EMF and the diameter of the chosen winding wire can be rewritten as,
where .
The function G(t) is determined by the geometric parameters. Under the same winding topology, the turn number is inversely proportional to the square of the wire diameter, . While keeping other design factors constant, the EMF only depends on the winding turns. The total resistance of the winding can be expressed as,
where rcoil is the average winding coil radius, ρe is the relative resistance, and d is the diameter of the wire. Then the maximum generated power under a given geometry is written as,
It is noticed that the power output does not depend on the selection of the diameter of the winding wire. Thus, for maximizing the power output, the winding wire AWG is not one of the main influential parameter. As the wave power is converted by the magnetic reacting force, the equivalent PTO damping coefficient is independent of the AWG selection.
3. Dynamic Responses
3.1. Response of the STPA in Regular Waves
An equivalent PTO damping coefficient Cpto has to be pre-assigned before conducting analysis toward the dynamics of the STPA. In the PTO system, i.e., the Halbach linear generator, the NdFeB (Grade N42) PM has been selected because of its high magnetic flux density. In this study, the dimension of the PMs is chosen to have an inner diamter of 0.1 m, an outer diameter of 0.15 m, and a height of 0.05 m. The air gap between the coils and the PMs is 6 mm, coil (AWG 22, 2511 turns) has an ID of 0.162 m, an OD of 0.202 m, and a height of 0.05 m. Based on our previous study, as in Tan et al. (2018), the equivalent PTO damping is calculated to be 4114 N·s/m and the relationship between the magnetic reacting force and the relative motion speed is shown in Figure 2.

Figure 2. The reacting force vs. the relative motion speed of the PTO system.
In the PTO system, through mathematical manipulation, we can prove that the coil can achieve a maximum power output, while the load impedance matches internal resistance. Thus, the extracted electric power will be the half of that average absorbed power.
In order to investigate the influence of the key design parameters, the dynamic responses of the STPA has been derived under the regular wave excitation. In the simulation, the wave height is assumed to be 2 m (Crest to Trough), corresponding to moderate sea state (WMO Code 4). The simulation parameters are listed in Table 1. For validating the frequency domain model and the effectiveness of the stochastic linearization, the result has been compared to that of the nonlinear time domain model, which is shown in Figure 3. A good agreement between the two models can be observed.
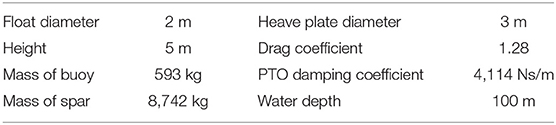
Table 1. Key dimensions.
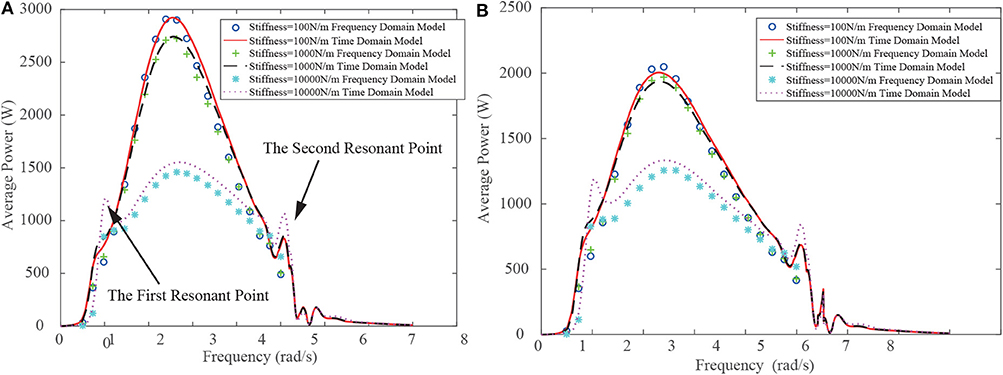
Figure 3. Extracted average power vs. wave frequency at various PTO stiffness. (A) Without floater dragging. (B) With floater dragging.
Figure 3A shows the relationship between extracted average power vs. wave frequency at different PTO stiffness while the floater dragging coefficient is assumed to be zero. We can clearly observe that when the stiffness of the PTO system equals to 100 N/m, the average power of the STPA reaches 2KW. When this value is increased to 104 N/m, the power drops to 1.5 KW. To further investigate the influence of the PTO stiffness on the generator performance, Figure 4A exhibits the relationship between extracted average power and the stiffness. It is found out that along with the increase of the stiffness, the extracted peak average power decreases. Figure 4B shows the influence of the PTO stiffness on the resonance of the system. The first natural frequency and the second natural frequency corresponds two peaks in Figure 3A. It can be observed that when the PTO stiffness increases, the extracted average power decreases. However, the frequency, at which the STPA extracts the maximum power, unnoticeably increases along with the PTO stiffness. This pattern indicates that the PTO stiffness is not the dominant factor that deciding the natural point. When the PTO stiffness increases, the spring force that prevents the relative displacement between the floater and the reacting body is greatly enlarged while the natural point is nearly kept constant. In consequence, the extracted peak average power decreases. The above analysis suggests that in the design of the STPA, it is favorable to choose a PTO stiffness as small as possible.
Figure 4. (A) Maximum extracted average power vs. PTO stiffness. (B) Resonant frequencies vs. PTO stiffness.
The above simulation has been conducted under the assumption that the dragging coefficient of the floater is zero, suggested by the work of Beatty et al. (2015). In order to investigate the necessity of artificially introducing the dragging coefficient to the floater, Figure 3B shows the relationship between the extracted power and the wave frequency at a floater dragging coefficient of 1.28. We can notice that when the dragging force is introduced, the extracted average power significantly decreases. This phenomenon can be clearly observed in Figure 5A, which shows the relationship between the extracted average power and the floater dragging coefficient. In addition, the floater dragging coefficient does not have remarkable influence on the resonant frequencies of the STPA, as shown in Figure 5B. Therefore, in the design of the STPA, the floater dragging coefficient should not be intentionally introduced.
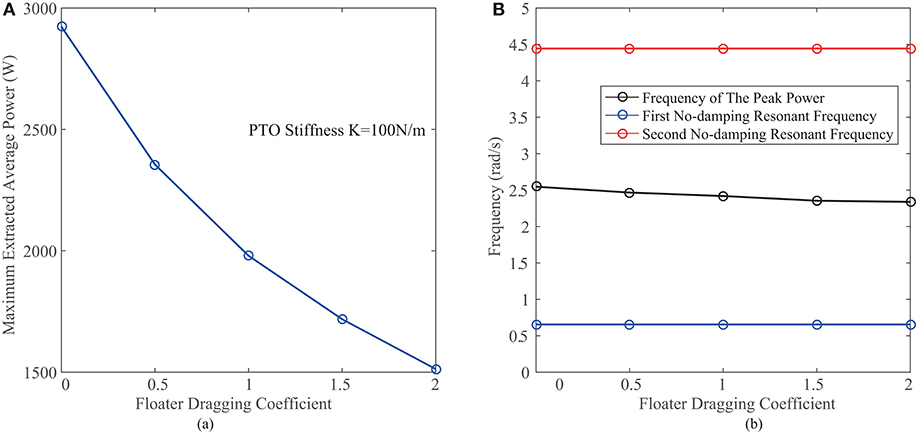
Figure 5. (A) Maximum extracted average power vs. floater dragging coefficient. (B) Resonant frequencies vs. floater dragging coefficient.
The floater mass and the reacting body mass are the other two factors that would significantly affect the performance of the STPA, and those masses can be easily tuned in the design process. Figures 6, 7 exhibit the influence of the floater mass and the reacting body mass on the STPA performance, with other parameters set to be the values in Table 1. The result indicates that the peak extracted average power is significantly subjected to the varying of floater masses compared to the reacting body mass. This phenomenon is mainly because of the mismatch between the resonant frequency and frequency (FMP), at which the system achieves the maximum power output. As the extracted power depends on the relative motion speed between the floater and the reacting body, shown in Equation (31), the power is determined by the wave frequency and the relative displacement amplitude at the same time. The increase of the floater mass will lower the second resonance frequency toward the FMP so that the peak power increases. Meanwhile, the increase of the reacting body mass will also lower the first resonance frequency, which in turn will make the resonant point away from the FMP. Therefore, in the design of the STPA, the mass of the floater should be designed as large as possible and the optimal density should close to that of water. Meanwhile, the reacting body mass should be chosen to have the most cost-efficient value.
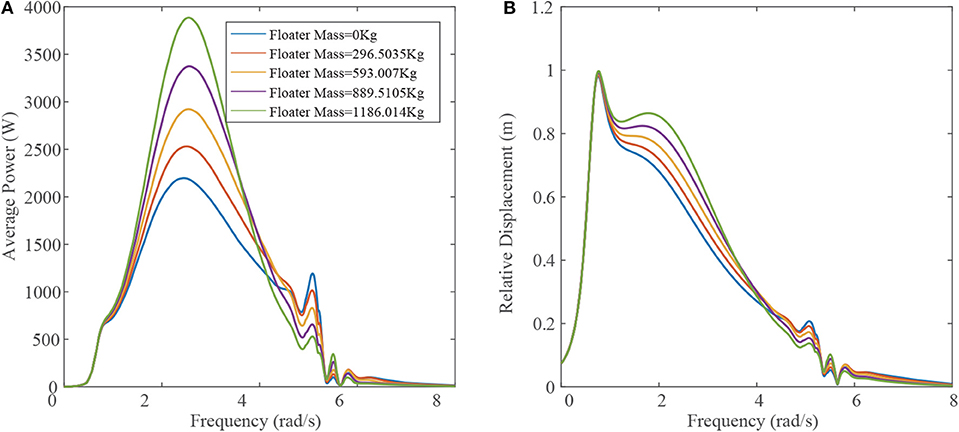
Figure 6. Extracted average power (A) and relative displacement (B) vs. wave frequency at various floater masses.
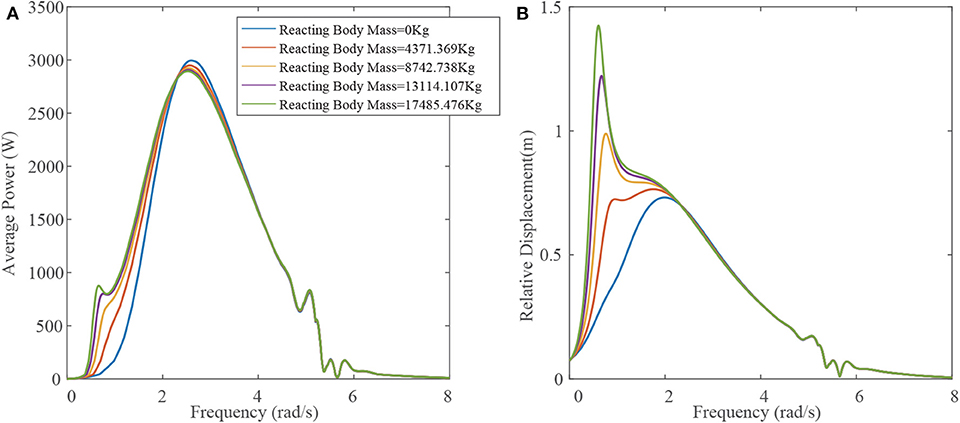
Figure 7. Extracted average power (A) and relative displacement (B) vs. wave frequency at various reacting body masses.
Besides the above parameters discussed, the PTO damping coefficient determines the power extraction ability of the STPA. Figure 8A shows the extracted power against the wave frequency at various PTO damping coefficient. As indicated by the arrow, when the damping increases, the peak point shifts toward the left. This decrease of the FMP can be clearly observed in Figure 8D. The reason is that when the damping ratio increases, it becomes harder for the PTO system to achieve a large relative displacement at a higher frequency. The restriction effect of the damping coefficient can be seen in Figure 8B, which exhibits the influence of the PTO damping coefficient on the relative displacement. Meanwhile, it has to be noticed that the first and second natural frequencies are not affected the PTO damping coefficient. Figure 8C extracts the peak point of each curve in Figure 8A and displaces the max average power against the PTO damping coefficient. When the damping coefficient increases from a relative small value, the peak average power is monotonically increasing until reaching a certain point. After the peak point, the power decreases along with the rising of the damping coefficient. The reason is that a significant large damping coefficient will hinder the relative displacement between the two bodies whose kinetic energy is the source of the power generation.
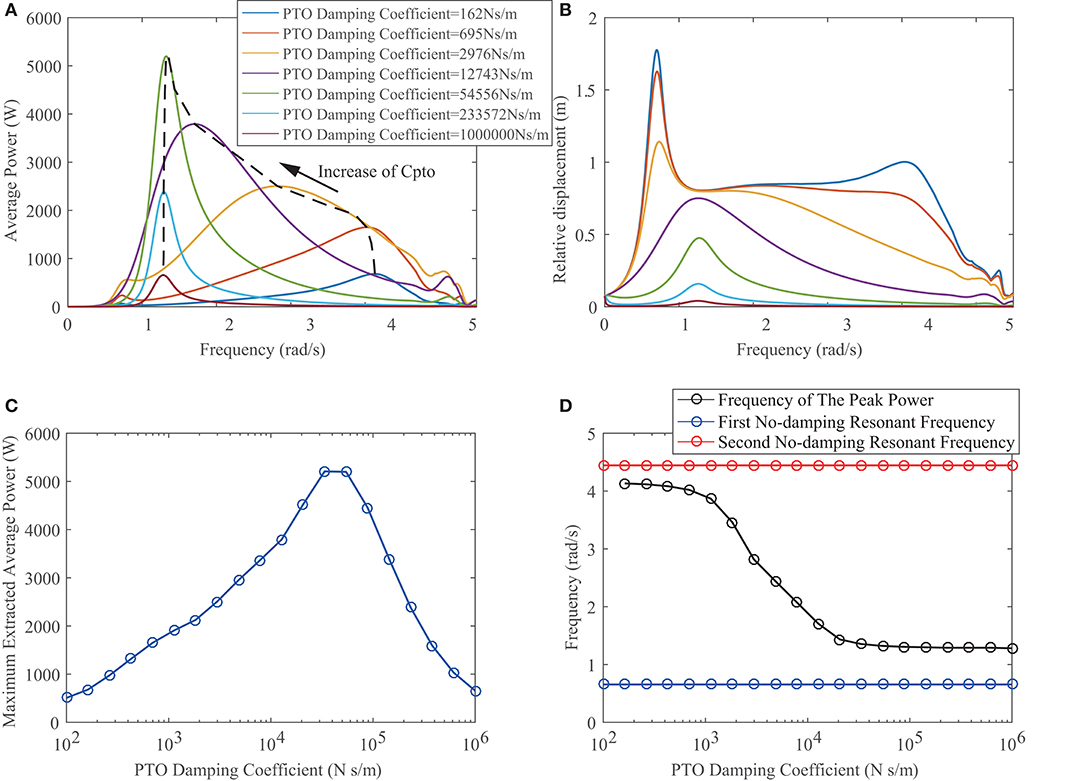
Figure 8. Extracted average power (A) and relative displacement (B) vs. wave frequency at various PTO damping coefficients. Maximum extracted average power (C) and resonance frequencies (D) vs. PTO damping coefficient.
3.2. Response of the STPA in Irregular Waves
The above sections have discussed the influence of the design parameters under the regular wave condition. To validate the developed frequency domain model in an ordinary operation environment, the response of the STPA in the irregular waves have been obtained. In the simulation, it is assumed that the STPA is working under a normal sea state. The Pierson-Moskowitz spectrum, introduced by Pierson and Moskowitz (1964), has been employed to represent the incoming waves, whose peak frequency and significant wave height are assumed to be 0.785 rad/s and 2 m. In the simulation, several assumptions have been made. First of all, the wave is fully developed over a vast area and the wind has fully interacted with wave so that there is no additional energy transfer between these two. Moreover, the waves are assumed to be steady, thus there is no sudden high wave and no collapse of the wave crest, suggested by Ochi (2005). Lastly, seasonal, tidal, geographical influences have been ignored for simplification.
The dynamic response of the floater and the reacting body under the irregular wave input is shown in Figure 9. While keeping other simulation constant, as in Table 1, the PTO stiffness is set to be 1500 N/m and the floater dragging coefficient is assumed to be 1.28. The red curve and the blue curve represent the frequency domain model response and the time domain model response which is obtained by conducting FFT based on the previous time domain results, as in Tan et al. (2018). The results suggest that the frequency domain model generally matches the time domain model response. It is noticed that the red curve contains some local peaks, which is mainly due to the discrete time step in simulation. Thus, the frequency domain model not only improves the calculation efficiency of the STPA simulation, but also exhibits an accurate result when discussing the response spectrum under the irregular wave excitation. In the current case, the STPA could generate an average power of 500 W at a PTO damping coefficient of 4114 N·s/m. While keeping the geometry parameters fixed, there should have an optimal PTO damping coefficient that will match FMP to the peak frequency of the irregular wave.
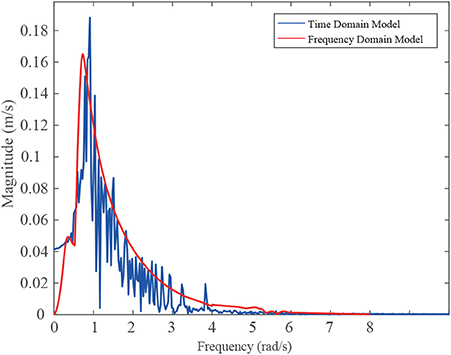
Figure 9. Spectrum of the relative motion speed under the irregular wave condition.
It is known that the wind is the major driver of ocean waves. A stronger wind will produce a more powerful wave. When discussing the irregular random ocean waves, the relationship between the blowing wind and the generated wave has to be employed to forecast the wave spectrum. Based the Pierson and Moskowitz's observation (Pierson and Moskowitz, 1964), the spectrum can be written as
where ω is the wave frequency, α = 8.1 × 10⁻³,β = 0.74,. U10 is the wind speed at the height of 10m above the water surface. The frequency of peak ωp and the significant wave height Hs can be calculated using the following equation set.
Then, with the above calculated spectrum, the average absorbed electric power of the STPA under the irregular wave condition can be calculated by the integration below,
For the design of the STPA, while the geometry is given, the generated power of the system depends on the wind strength and the equivalent PTO damping coefficient. Thus, the influence of these two parameters has been investigated and the result is shown in Figure 10. In this simulation, with the geometry kept constant, the PTO stiffness is set to be 100 N/m and the dragging coefficient of the floater is assumed to be zero. From Figure 10A, we can observe that the generated power monotonically increases along with the rise of wind speed, as the input wave power is significantly enlarged at a stronger wind. Figure 10B shows the relationship between the power and the PTO damping coefficient at various wind speeds. It is noted that the corresponding PTO damping coefficient of the peak absorbed power decreases as wind speed increases. The reason for this phenomenon can be explained as when the wind speed increases, the corresponding average energy wave frequency decreases. Thus, the equivalent PTO damping coefficient has to be reduced in order to compensate for the decrease of the driving frequency. The observation indicates that before deploying, the PTO system should be designed based on the local annual wind condition.
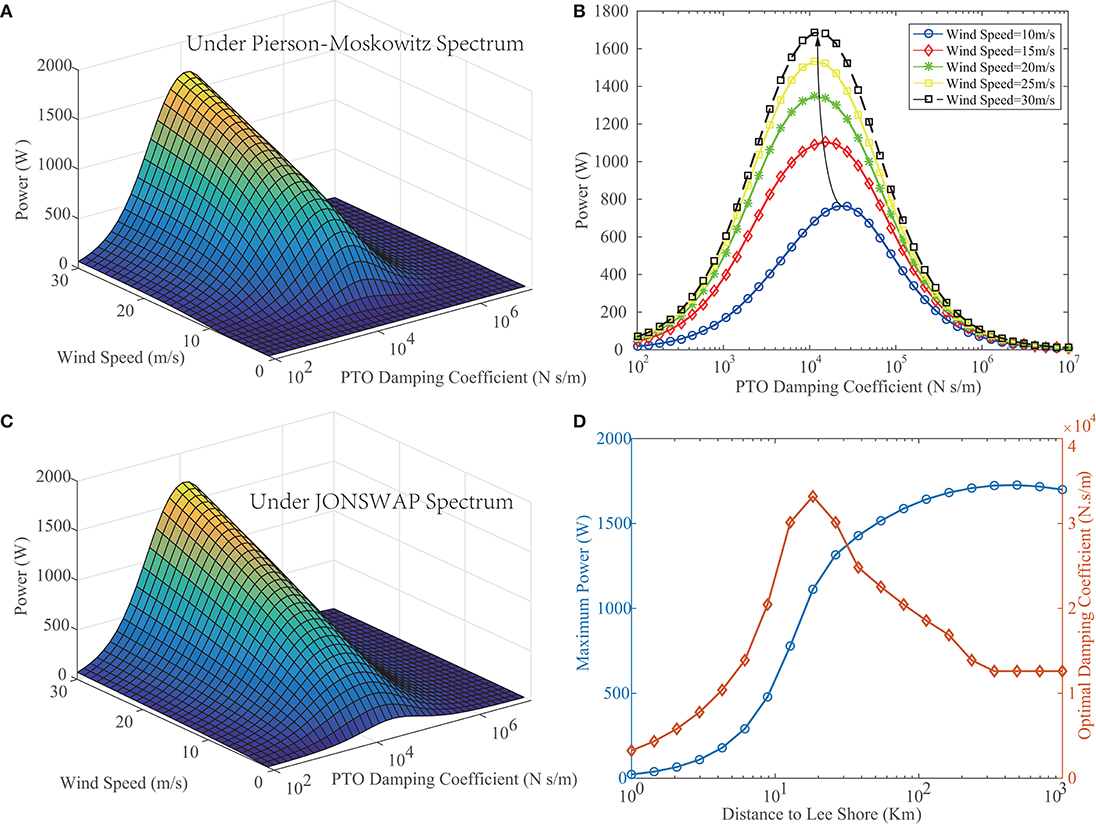
Figure 10. The influence of the wind speed and the equivalent PTO damping coefficient on the generated power. (A) Dependence of the extracted power on the wind speed and the PTO damping coefficient under the Pierson-Moskowitz spectrum. (B) The relationship between the power and the PTO damping coefficient at various wind speeds under the Pierson-Moskowitz spectrum. (C) Dependence of the extracted power on the wind speed and the PTO damping coefficient under the JONSWAP spectrum. (D) Influence of the distance to the lee shore on the maximum power and the optimal damping coefficient.
In the above simulation, the Pierson-Moskowitz spectrum is a highly idealized spectra in ocean engineering. The theory is based on the assumption of a fully developed sea. In practical cases, the wave spectrum is never fully developed. In the wave forming process, the non-linear wave-wave interactions will last for a long time and over a long distance. Hasselmann et al. (1973) introduced the JONSWAP spectrum that introduced an extra peak enhancement factor as a multiplier to the Pierson-Moskowitz spectrum.
where , , γ = 3.3, .
Compared to the Pierson-Moskowitz spectrum, the JONSWAP spectrum has introduced the distance to a lee shore, F*. Figure 10C shows the dependence of the extracted power on the wind speed and the PTO damping coefficient while the STPA is deployed 1,000 Km away from the lee shore. At this distance, the response is similar to that under the Pierson-Moskowitz spectrum. It is concluded that the sea can be treated as fully developed in a far offshore location. Figure 10D exhibits the influence of the distance on the power and the optimal damping coefficient at a wind speed of 30m/s. The maximum power extracted increases monotonically with the distance and tends to saturate while the distance reaches 100Km. In addition, at a given distance to the shore, there is an optimal PTO damping coefficient. The result suggests that in the design of the PTO, the equivalent damping coefficient should be chosen based on the geometrical location. It is admitted that in this numerical study, we have assumed the sea is mainly affected by the wind. Other influential factors, e.g., swell, haven't been discussed in this paper due to the short of field test data. In the future work, we will present the model result with experimental data using the spectrum measured at our test site.
4. Discussion
4.1. Influence of PTO System Design Parameters
While employing the Halbach linear generator as the PTO system and assuming the design has no detent force, the total electric power is proportional to the equivalent damping coefficient, suggested by Equation (31). Thus, while investigating the Halbach linear generator based PTO system, the equivalent PTO damping coefficient is the key optimization object. The Halbach PM linear generator has several key design parameters that will significantly affect the PTO damping coefficient, i.e., the length of a single set of Halbach PM array lt, the thickness of the PM lm, the height and thickness of a single coil, and the radius of the central shaft rs. In order to apply the Halbach PM linear generator in the STPA, we have studied the dependence of the PTO damping coefficient on the above listed parameters.
In this Halbach PM linear generator design, to stabilize the magnetic reacting force and minimize the detent force, a 2-pole and 3-phase-winding slotless topology is employed in this work. The 3-phase winding spreads evenly over the space. Thus, the length of a single coil has to be smaller than lt/3. Recall Equation (24), with the same winding method, is constant regardless of the coil dimension. With other parameters determined, the magnetic flux linkage of a single coil only depends on integration of the term Aθ over the space. Meanwhile, the distribution of the PM produced Aθ is independent of the coil design and is periodical along the axial direction, whose period equals to lt/2. Thus, the flux linkage monotonically increases along with the rising of coil length to lt/3. It is concluded that when a coil length of lt/3 is adopted, the maximum flux linkage can be achieved which will result in a larger PTO equivalent damping coefficient.
Figure 11 shows the influence of the PM thickness and the central shaft radius while keeping other parameter constant. It is observed that the PTO damping coefficient monotonically increases as the above two parameters rises. In addition, the relationship between the PTO damping and the two parameters is approximately linear. The reason is that rs and lm define the dimensions of the PM. While keep other parameters constant, the magnetomotive force becomes larger which will enhance the magnetic distribution in the air gap, thus, the equivalent PTO damping coefficient increases. Therefore, in the design of the Halbach PM linear generator, it is preferred to employ PMs as large as possible.

Figure 11. The influence of the PM thickness and the central shaft radius.
The last two parameters that will affect the performance of the Halbach PM linear generator is the Halbach PM array length lt and the coil width. While fixing the other parameters, the PTO damping coefficient increases along with the PM array length as the enlarged PM produces a stronger magnemotive force. When the lt is larger than a certain value, the increased magnetic pole distance will be prominent. Because the varying rate of the flux linkage is inversely proportional to the pole distance, the PTO damping coefficient decreases along with the further rising of lt. This trend can be clearly observed in Figure 12. While varying the coil width and keeping other parameters constant, similar pattern is observed. This is mainly because that when the coil width is small, a larger coil width consists of more winding turns, which in turn greatly increases the PTO damping coefficient. However, when the coil width reaches a certain value so that the air domain between the Halbach and the magnetic-conductive armature is too wide to maintain a certain magnetic distribution strength, the effect of decreasing strength will dominate over the increased wire turns. Thus, the PTO damping coefficient will decrease again. For any given design task, there should be an optimal combination of the lt and the coil width. Under the current case, as shown in Figure 12, when coil width equals to 76mm and PM array length equals to 550mm, the Halbach PM linear generator with a single set of winding coilb exhibits a maximum equivalent PTO damping coefficient of 6474N ·s/m.
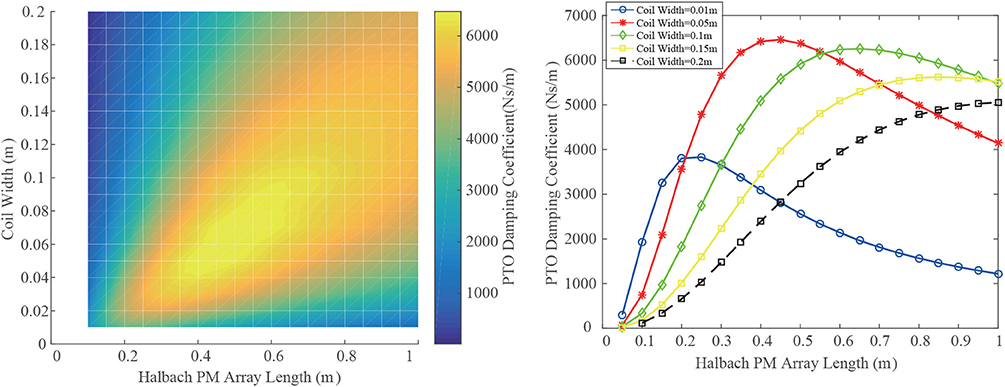
Figure 12. The influence of the Halbach PM array length and the coil width.
4.2. Validation of the PTO System Model
To validate the proposed PTO system model, we have built a compact sized test-rig to simulate the operation under the wave input, as shown in Figure 13. In the test-rig, a fabricated tabular Halbach PM array has been fixed at the two ends. The tabular array consists of a ring magnet set with an ID of 40 mm, an OD of 80 mm, and a height of 50 mm. The ring magnets are made of NdFeB magnets with a grade of N42. All the ring magnets are assembled on an aluminum central shaft. The coils are arranged in three-phase wrapped by an armature made of silicon steel (M19). The coil (2770 turns, AWG 22, 53Ω) of each phase has an ID of 92 mm, an OD of 132 mm, and a height of 67 mm. A linear actuator (KT DDG32-R-2.5KN-1800MM) controlled through Simulink has been utilized to provide the linear motion up to 1.2 m. A position sensor (WFD20-S-10V-2m) is used to measure relative displacement and provide a feedback signal to the actuator. A load cell (Tecsis F2808) is employed in the test-rig to evaluate the reacting force.
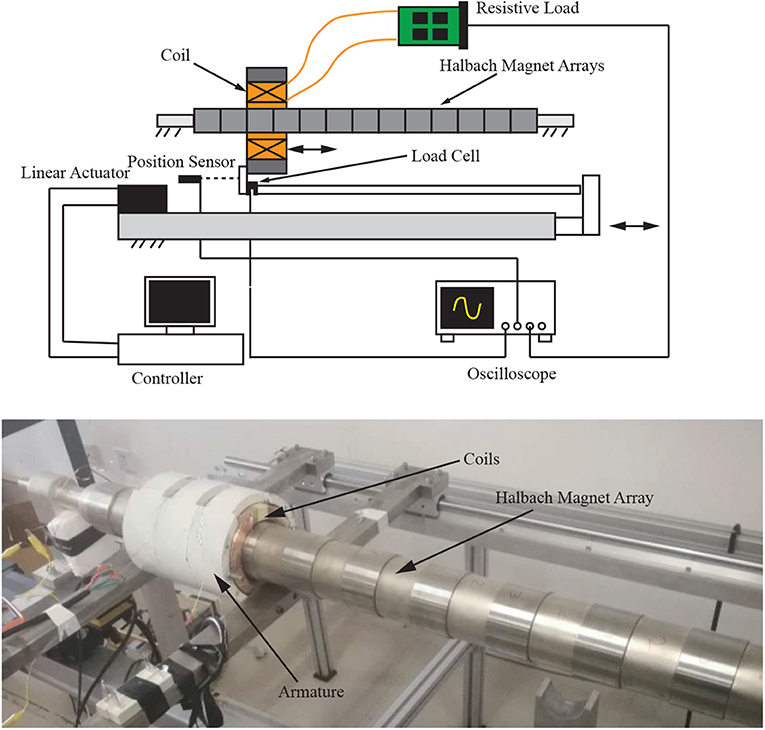
Figure 13. Test-rig for the PTO system.
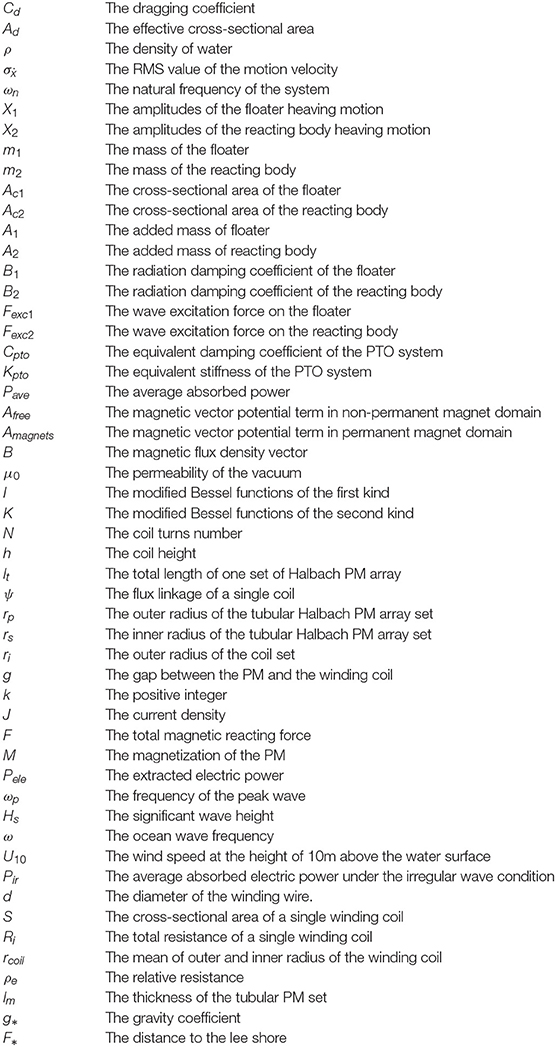
Figure 14A compares the analytical model result and the test data at different loading conditions. The experimental results coincide with the analytical model. The peak output voltage of a single phase coil is linear against the relative motion speed. Thus, the output voltage of the three-phase can be easily predicted according to the derived relationship. In addition, the experiment proves that when the load matches the impedance of the coil, the test-rig achieves a total maximum average power output of 142 W at a relative speed of 0.53 m/s (for safety concern). At a nominal speed of 1 m/s, it is predicted that the system could achieve a total output power of 569.6 W. As shown in the above sections, when applying the PTO system, its equivalent damping coefficient determines the general performance of the STPA. Figure 14B compares the magnetic reacting force of the analytical model and the experiment at different input speeds while the impedance matches. The result shows that the equivalent damping coefficient of the test-rig equals to 1102.75N·s/m while the calculated damping coefficient equals to 1102.95N·s/m. It indicates that the developed magnetic vector potential model effectively describes the performance of the PTO system and can be used for design optimization.
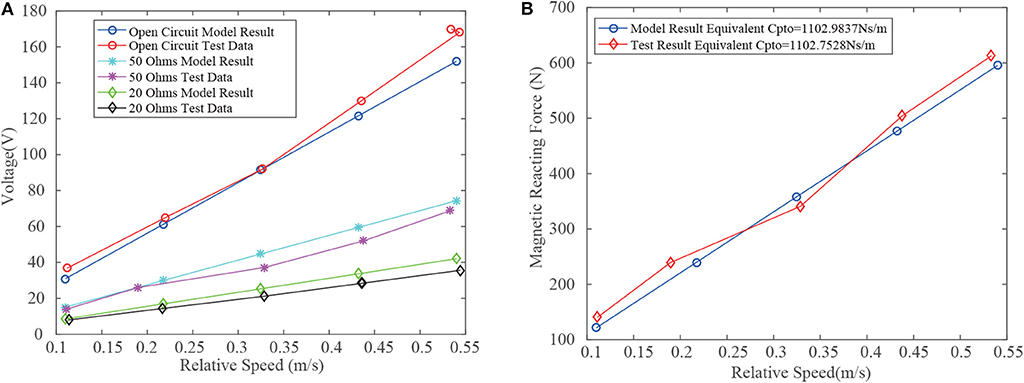
Figure 14. (A) The output voltage at different relative motion speeds. The loading condition has been indicated in the plot. (B) Magnetic reacting force at different relative speed while the load equals to 50Ω.
5. Conclusions
In this work, a frequency domain model is developed from our previous nonlinear time domain model in order to accelerate the design of a two-body self reacting point absorber. The nonlinear dragging term in the time domain model of the STPA has been linearized employing the stochastic linearization method. The solution of the relative displacement and the mean extracted power have been derived. The frequency domain model is numerically verified by matching the result to the nonlinear time domain model. Subsequently, a case study has been conducted to investigate the influence of the PTO stiffness, dragging coefficients, and the masses of the floater and the reacting body. The study result indicates that in the design of the STPA, the PTO stiffness and the dragging coefficient of the floater should be minimized. In addition, the floater mass should be specially optimized as the influence of the floater mass is prominent over the reacting body mass. Moreover, we find that the maximum power output doesn't coincide with the resonant frequencies of the system and the FMP is determined by the PTO damping coefficient of the point absorber. A small PTO damping coefficient will result in a low energy conversion efficiency and a large coefficient will hinder the relative displacement between the floater and the reacting body. Thus, in the design of the STPA, an optimal PTO damping coefficient should be obtained. With geometrical parameters fixed, the dependence of the power on the PTO damping coefficient has been investigated under the irregular wave excitation. The result shows that there is a corresponding optimal PTO damping coefficient under a given wind speed and offshore distance. For the STPA deployed at a certain location, the designated PTO damping coefficient should be calculated based on the local geometrical and weather condition.
We have studied the factors that affect the PTO damping coefficient. In this point absorber, the Halbach PM linear generator is employed as the PTO system. The magnetic domain model has been presented and the equivalent PTO damping coefficient is derived. It is found that the PTO damping coefficient increases when the dimension of the PM magnets is enlarged. In addition, the selection of the wire gauge does not affect the power extraction ability. Thus, at a given STPA dimension, the Halbach PM array length and the coil width are the most influential factors that determine the PTO damping coefficient. Finally, to validate the developed magnetic domain model, a test-rig of the Halbach PM linear generator has been built and the experiments have been conducted at various loading conditions.
Data Availability Statement
The datasets generated for this study are available on request to the corresponding author.
Author Contributions
All authors listed have made a substantial, direct and intellectual contribution to the work, and approved it for publication.
Conflict of Interest
YT, ZZ, and KL were employed by the Sea Electric Energy, Inc., Mississauga, Ontario, Canada. Meanwhile, YT and ZZ were employed by the Sea Electric Energy, Inc., Shenzhen, China. The remaining author declares that the research was conducted in the absence of any commercial or financial relationships that could be construed as a potential conflict of interest.
References
Babarit, A., Hals, J., Muliawan, M. J., Kurniawan, A., Moan, T., and Krokstad, J. (2012). Numerical benchmarking study of a selection of wave energy converters. Renew. Energy 41, 44–63. doi: 10.1016/j.renene.2011.10.002
Beatty, S. J., Bocking, B., Bubbar, K., Buckham, B. J., and Wild, P. (2019). Experimental and numerical comparisons of self-reacting point absorber wave energy converters in irregular waves. Ocean Eng. 173, 716–731. doi: 10.1016/j.oceaneng.2019.01.034
Beatty, S. J., Hall, M., Buckham, B. J., Wild, P., and Bocking, B. (2015). Experimental and numerical comparisons of self-reacting point absorber wave energy converters in regular waves. Ocean Eng. 104, 370–386. doi: 10.1016/j.oceaneng.2015.05.027
Bosma, B., Zhang, Z., Brekken, T. K., Özkan-Haller, H. T., McNatt, C., and Yim, S. C. (2012). “Wave energy converter modeling in the frequency domain: a design guide,” in 2012 IEEE Energy Conversion Congress and Exposition (ECCE) (Raleigh, NC: IEEE), 2099–2106. doi: 10.1109/ECCE.2012.6342553
Chakrabarti, S. (2002). The Theory and Practice of Hydrodynamics and Vibration. Singapore: World Scientific Publishing Company.
Cummins, W. (1962). The Impulse Response Function and Ship Motions. Technical report, David Taylor Model Basin. Washington, DC.
da Silva, L. S., Morishita, H. M., Pesce, C. P., and Gonçalves, R. T. (2019). “Nonlinear analysis of a heaving point absorber in frequency domain via statistical linearization,” in ASME 2019 38th International Conference on Ocean, Offshore and Arctic Engineering (Glasgow). doi: 10.1115/OMAE2019-95785
Danielsson, O., Eriksson, M., and Leijon, M. (2006). Study of a longitudinal flux permanent magnet linear generator for wave energy converters. Int. J. Energy Res. 30, 1130–1145. doi: 10.1002/er.1209
Davis, A. F., Thomson, J., Mundon, T. R., and Fabien, B. C. (2014). “Modeling and analysis of a multi degree of freedom point absorber wave energy converter,” in Asme 2014 33rd International Conference on Ocean, Offshore and Arctic Engineering (San Francisco, CA: American Society of Mechanical Engineers). doi: 10.1115/OMAE2014-23475
De Andrés, A., Guanche, R., Armesto, J., Del Jesus, F., Vidal, C., and Losada, I. (2013). Time domain model for a two-body heave converter: model and applications. Ocean Eng. 72, 116–123. doi: 10.1016/j.oceaneng.2013.06.019
Diamond, C. A., Judge, C. Q., Orazov, B., Savaş, Ö., and ÓReilly, O. M. (2015). Mass-modulation schemes for a class of wave energy converters: Experiments, models, and efficacy. Ocean Eng. 104, 452–468. doi: 10.1016/j.oceaneng.2015.05.018
Elwood, D., Yim, S. C., Prudell, J., Stillinger, C., Von Jouanne, A., Brekken, T., et al. (2010). Design, construction, and ocean testing of a taut-moored dual-body wave energy converter with a linear generator power take-off. Renew. Energy 35, 348–354. doi: 10.1016/j.renene.2009.04.028
Guanwardane, S., Folley, M., and SANJAYA, S. (2017). “Spectral-domain modelling of the non-linear hydrostatic stiffness of a heaving-sphere wave energy converter,” in Proceedings of the 28th International Symposium on Transport Phenomena (Peradeniya), 22–24.
Hasselmann, K., Barnett, T., Bouws, E., Carlson, H., Cartwright, D., Enke, K., et al. (1973). Measurements of wind-wave growth and swell decay during the Joint North Sea Wave Project (JONSWAP). Ergänzungsheft zur Deutschen Hydrographischen Zeitschrift Reihe (Deutches Hydrographisches Institut), 8–12.
Hong, Y., Eriksson, M., Castellucci, V., and Boström, C. (2016). Linear generator-based wave energy converter model with experimental verification and three loading strategies. IET Renew. Power Generat. 10, 349–359. doi: 10.1049/iet-rpg.2015.0117
Lehmann, M., Karimpour, F., Goudey, C. A., Jacobson, P. T., and Alam, M. R. (2017). Ocean wave energy in the united states: current status and future perspectives. Renew. Sustain. Energy Rev. 74, 1300–1313. doi: 10.1016/j.rser.2016.11.101
Liang, C., Ai, J., and Zuo, L. (2017). Design, fabrication, simulation and testing of an ocean wave energy converter with mechanical motion rectifier. Ocean Eng. 136, 190–200. doi: 10.1016/j.oceaneng.2017.03.024
Liang, C., and Zuo, L. (2017). On the dynamics and design of a two-body wave energy converter. Renew. Energy 101, 265–274. doi: 10.1016/j.renene.2016.08.059
Olaya, S., Bourgeot, J.-M., and Benbouzid, M. (2013). “Hydrodynamic coefficients and wave loads for a wec device in heaving mode,” in 2013 MTS/IEEE OCEANS-Bergen (Bergen: IEEE), 1–8.
Pierson, W. J. Jr., and Moskowitz, L. (1964). A proposed spectral form for fully developed wind seas based on the similarity theory of S. A. kitaigorodskii. J. Geophys. Res. 69, 5181–5190. doi: 10.1029/JZ069i024p05181
Salem, A. G., Ryu, S., Duggal, A. S., and Datla, R. V. (2012). Linearization of quadratic drag to estimate calm buoy pitch motion in frequency-domain and experimental validation. J. Offshore Mech. Arctic Eng. 134:011305. doi: 10.1115/1.4003645
Siow, C., Koto, J., Abyn, H., and Khairuddin, N. (2014). Linearized morison drag for improvement semi-submersible heave response prediction by diffraction potential. Sci. Eng. 6, 8–16.
Spanos, P. D., Arena, F., Richichi, A., and Malara, G. (2016). Efficient dynamic analysis of a nonlinear wave energy harvester model. J. Offshore Mech. Arctic Eng. 138:041901. doi: 10.1115/1.4032898
Tan, Y., Lin, K., and Zhang, Z. (2018). “Comprehensive modelling of a slotess halbach linear generator based wave energy converter,” in IECON 2018-44th Annual Conference of the IEEE Industrial Electronics Society (Washington, DC: IEEE), 1717–1722.
Tom, N., Lawson, M., Yu, Y.-H., and Wright, A. (2016). Spectral modeling of an oscillating surge wave energy converter with control surfaces. Appl. Ocean Res. 56, 143–156. doi: 10.1016/j.apor.2016.01.006
Vermaak, R., and Kamper, M. J. (2012). Experimental evaluation and predictive control of an air-cored linear generator for direct-drive wave energy converters. IEEE Trans. Industry Appl. 48, 1817–1826. doi: 10.1109/TIA.2012.2221671
Wang, J., Howe, D., and Jewell, G. W. (2003). Fringing in tubular permanent-magnet machines: part I. Magnetic field distribution, flux linkage, and thrust force. IEEE Trans. Magn. 39, 3507–3516. doi: 10.1109/TMAG.2003.819463
Zurkinden, A. S., Ferri, F., Beatty, S., Kofoed, J. P., and Kramer, M. M. (2014). Non-linear numerical modeling and experimental testing of a point absorber wave energy converter. Ocean Eng. 78, 11–21. doi: 10.1016/j.oceaneng.2013.12.009
Nomenclature
.
Keywords: wave energy converter, Halbach PM Array linear generator, stochastic linearization, frequency domain modeling, design optimization
Citation: Tan Y, Liu N, Lin K and Zhang Z (2020) Frequency Domain Modeling of a Halbach PM Linear Generator Based Two-Body Point Absorber for Wave Energy Conversion. Front. Energy Res. 8:19. doi: 10.3389/fenrg.2020.00019
Received: 02 December 2019; Accepted: 04 February 2020;
Published: 25 February 2020.
Edited by:
Siming Zheng, University of Plymouth, United KingdomReviewed by:
Hengxu Liu, Harbin Engineering University, ChinaCarlos Perez-Collazo, University of Vigo, Spain
Copyright © 2020 Tan, Liu, Lin and Zhang. This is an open-access article distributed under the terms of the Creative Commons Attribution License (CC BY). The use, distribution or reproduction in other forums is permitted, provided the original author(s) and the copyright owner(s) are credited and that the original publication in this journal is cited, in accordance with accepted academic practice. No use, distribution or reproduction is permitted which does not comply with these terms.
*Correspondence: Yimin Tan, eWltaW4udGFuQHNlZXRlY2hub2xvZ3kuY28=
†These authors have contributed equally to this work