 Shimo Yu
 Xiao Yan†
- China National Nuclear Corporation (CNNC) Key Laboratory on Nuclear Reactor Thermal Hydraulics Technology, Nuclear Power Institute of China, Chengdu, China
Two-phase flow is an important and common phenomenon in reactor systems, and there are significant differences in the heat and mass transfer characteristics of two-phase flow under different flow patterns. Researchers have proposed a variety of flow pattern transition mechanisms to predict the two-phase flow. But limited by the means of measurement, the critical void fraction for flow pattern transition can’t be determined. Two types of bubbly-slug flow transition criteria in vertical circular tubes are studied in this paper and a wire mesh sensor (WMS) was manufactured to measure the critical void fraction for bubbly-slug transition. One hundred forty-seven visualization tests were carried out for validation.
Introduction
In nuclear reactor system, two-phase flow is a common and important phenomenon. The structure of gas liquid interface is very complex because of the interaction between the phases and it varies as the velocity changes of the two phases. In a vertical circular tube, two phase flow is divided into four typical flow patterns including bubbly flow, slug flow, churn flow, and annular flow. The thermal hydraulic characteristics of two phase flow strongly depend on the flow pattern. Many flow pattern transition mechanisms are put forward in order to predict the two phase flow (Weisman and Kang, 1981; Barnea et al., 1982; Mcquillan and Whalley, 1985). The derivation process of flow pattern transition mechanism can be divided into two categories: the first ones are the empirical criteria based on a large number of experimental data, the second ones analyze the transition mechanism based on the physical process. Two widely used flow pattern transition mechanisms of the second category were proposed by Mishima and Ishii (1984) and Taitel et al. (1980). This paper focuses on the bubbly-slug flow transition criteria of the Mishima-Ishii and Taitel transition mechanisms. These two criteria base on different mechanism and take different critical void fraction. Electrical probes and optical probes have been widely used to measure the void fraction in two phase flow (Hibiki and Ishii, 1998; Kim et al., 2000; Euh et al., 2001) for several decades, but they can commonly only measure a spatial point at one time. Recent years’ the WMS developed by Prasser (Prasser et al., 2005; Prasser, 2007; Pietruske and Prasser, 2007; Beyer et al., 2010; Banowski et al., 2016) can measure the void fraction of the whole cross section instantaneously with a high spatial and temporal resolution. A comprehensive evaluation of WMS proposed by Tompkins et al. (2018) shows that the WMS is a good choice for this study. The authors of the present paper manufactured a WMS to measure the critical void fraction for bubbly-slug flow transition. The detailed analysis results are given and visualization experiment are carried out for the validation of the results.
Bubbly-Slug Flow Transition Criteria
For the adiabatic air water two phase flow in vertical circular tubes, the most widely used bubbly-slug flow transition criteria were proposed by Mishima and Ishii (1984) and Taitel et al. (1980). The two transition criteria are based on different physical mechanisms and take different critical void fractions for bubbly-slug transition.
Mishima-Ishii bubbly-slug flow transition mechanism is based on the drift flow model, and the superficial velocity of the two phases given by Equation (1).
Where J is the two phase mixture superficial velocity shown as Equation (2), C0 is the distribution parameter, C0 in Equation (3) is for circular tube.
The key parameter to determine the transition criterion is the critical void fraction α in Equation (1). To obtain the critical void fraction, Mishima and Ishii (1984) proposed a model of the bubble distribution structure as shown in Figure 1. The effective range of the interaction between bubbles are 1.5 times the diameter of the bubble rb and the probability of bubble coalescence will sharply increase when the distance between bubbles is less than or equal to 2rb. As a result, the critical void fraction for bubbly-slug flow transition can be derived by Equation (4).
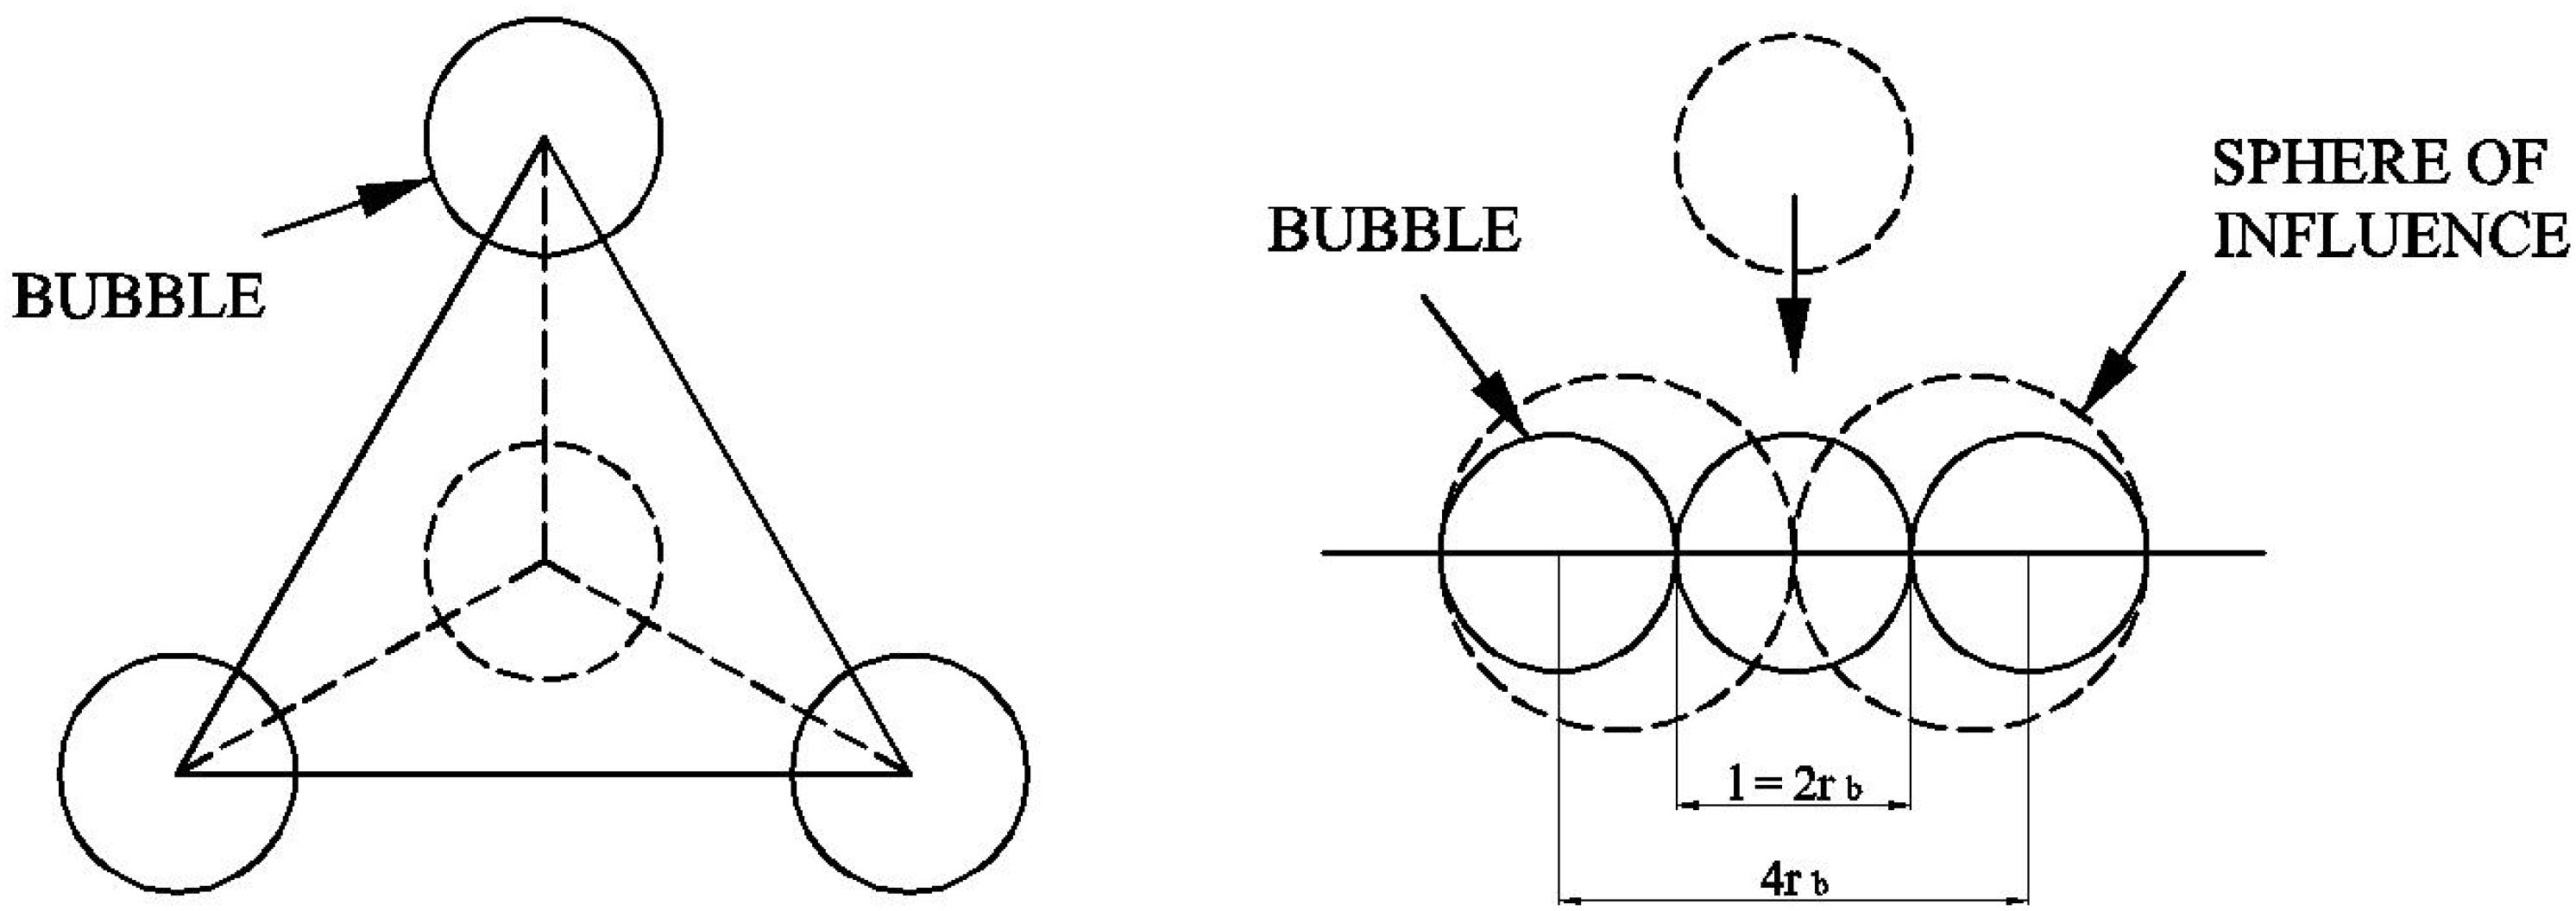
Figure 1. Bubble packing and coalescence pattern.
The Mishima-Ishii transition criterion based on the drift flow model can be derived by combining Equations (1) and (4). It is shown in Equation (5).
Taitel bubbly-slug flow transition mechanism is based on the raising velocity of big bubbles in two phase flow. Harmathy (1960) proposed the raising velocity of big bubbles relative to the liquid phase flow field. The velocity is shown in Equation (6) which is independent of bubble size.
The relationships between real velocity and superficial velocity of the two phases are shown in Equations (7) and (8).
And different from Mishima-Ishii criterion, Taitel chose 0.25 to be the bubbly-slug transition critical void fraction. The Taitel bubbly-slug transition criterion as shown in Equation (9) can be obtained by combining Equations (6)–(8).
Experiment Set Up
According to the analysis in the previous section, the critical void fraction for flow pattern transition is the key parameter for deriving the transition criterion. But it was difficult to measure the void fraction accurately limited by the measurements when Mishima and Ishii (1984) and Taitel et al. (1980). put forward the flow pattern transition mechanisms. Benefitting from the advance in measurement, the void fraction of two phase flow can be measured accurately. Different from traditional single point measurement (conductivity/optical probe) (Hibiki and Ishii, 1998; Kim et al., 2000; Euh et al., 2001), The WMS can measure the void fraction of the whole cross section instantaneously (Prasser et al., 2005; Pietruske and Prasser, 2007; Prasser, 2007; Beyer et al., 2010; Banowski et al., 2016). The authors of this paper built an experimental loop and manufactured a WMS to obtain the critical void fraction for bubbly-slug transition.
Experiment Loop
The experiment loop consists of a water loop part and an air loop part as shown in Figure 2. A by-pass loop is applied for smoothly adjusting the flow rate of water flowing through the test section. The experiment was carried out at the room temperature (∼20°C), and a heat exchanger was used in the water tank to take the heat generated by the pump for stabilizing the temperature. The water tank is 1.5 m high and 0.8 m in diameter, and it is opening to the atmosphere, so the system pressure is around 1 atm except the outlet of the pump which is a little higher than the atmosphere pressure. The compressed air is generated by the air compressor and stabilized by the 1 m3 air storage tank. The maximum water mass flow rate is 40 t/h and the maximum air volume flow rate is 2,400 NL/min. The Coriolis/Thermal mass flow meter and Venturi flow meter were used to measure the flow rate of water and air as shown in Table 1.
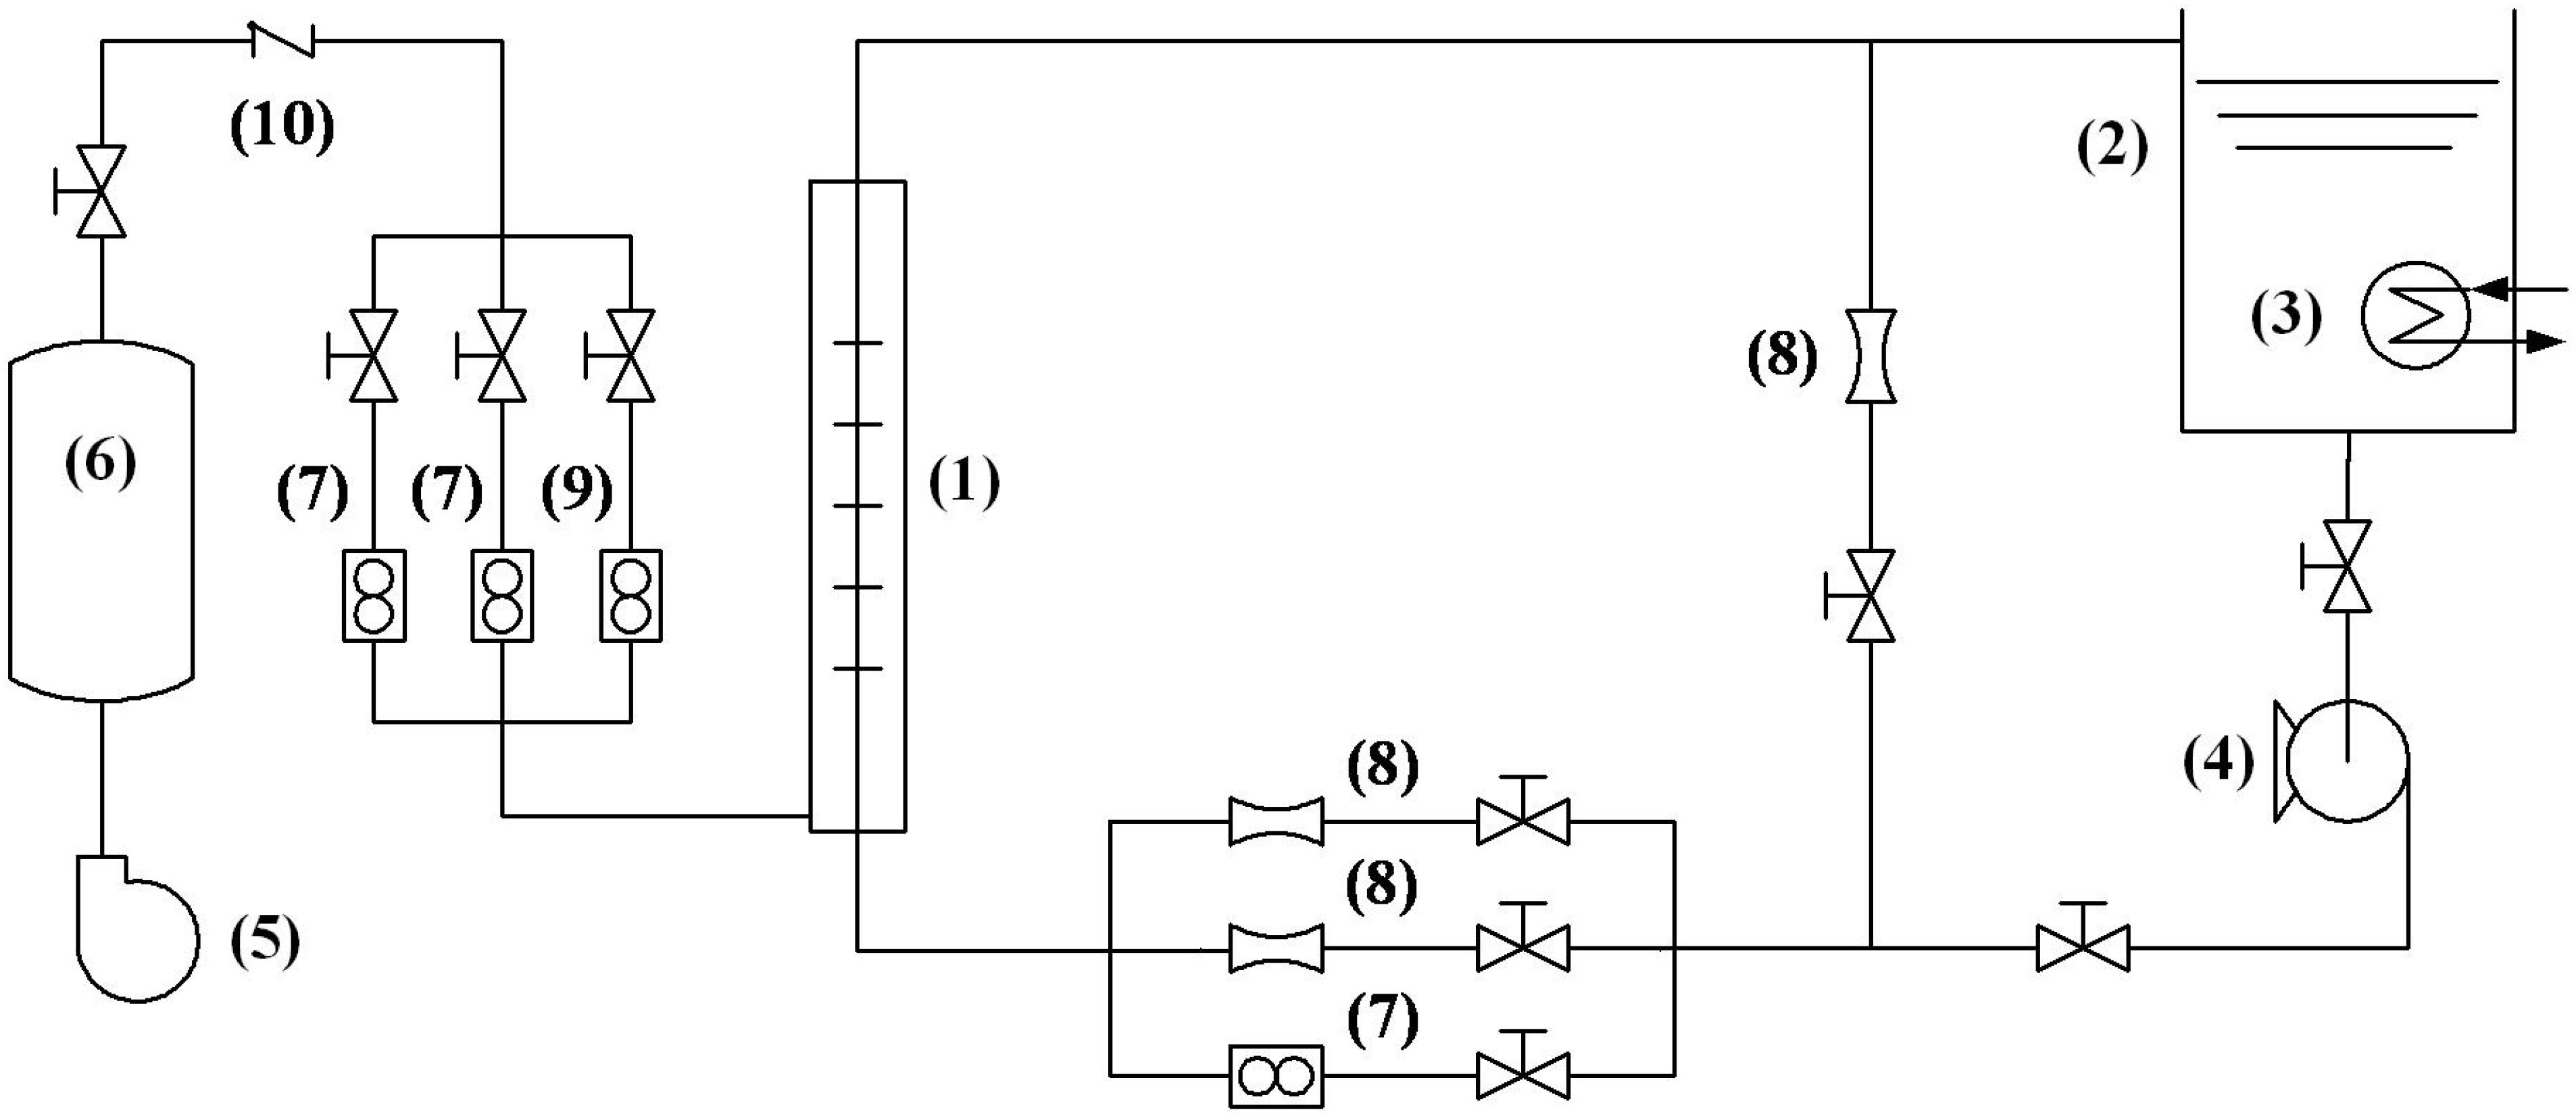
Figure 2. Scheme of the experiment set-up. (1) test section, (2) water tank, (3) heat exchanger, (4) pump, (5) air compressor, (6) air storage tank, (7) Coriolis meter, (8) Venturi meter, (9) Thermal meter, (10) check valve.
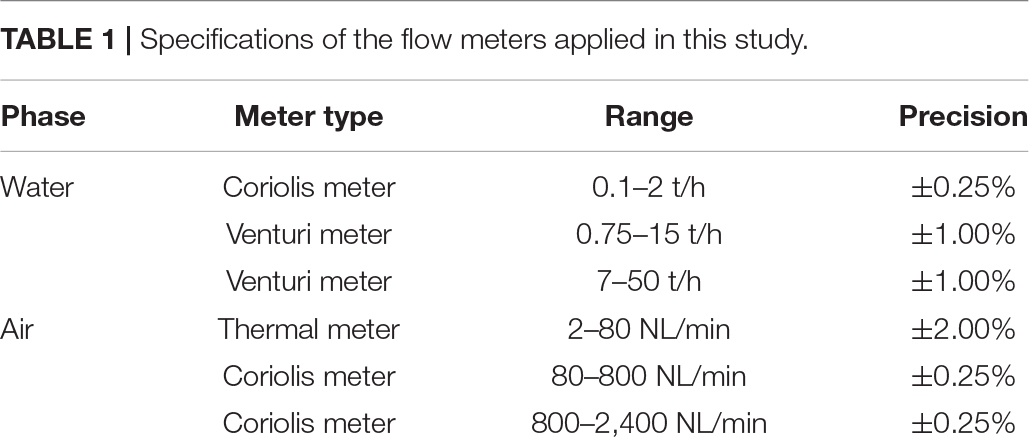
Table 1. Specifications of the flow meters applied in this study.
Test Section
The test section is a transparent plexiglass round tube with 3 m height and 50 mm inner diameter as shown in Figure 3A. The test section is placed vertically. Water and air mix at the bottom of the test section and flow out from the top of the test section. The WMS is placed on the top of test section to ensure that the two phase flow is fully developed. The water/air mixture is separated in the water tank. Referring to Prasser’s (2007) work on TOPFLOW facility, the air injector applies a uniform injecting structure consisting of 24 orifices of 1 mm diameter drilled around the tube wall as shown in Figure 3B.
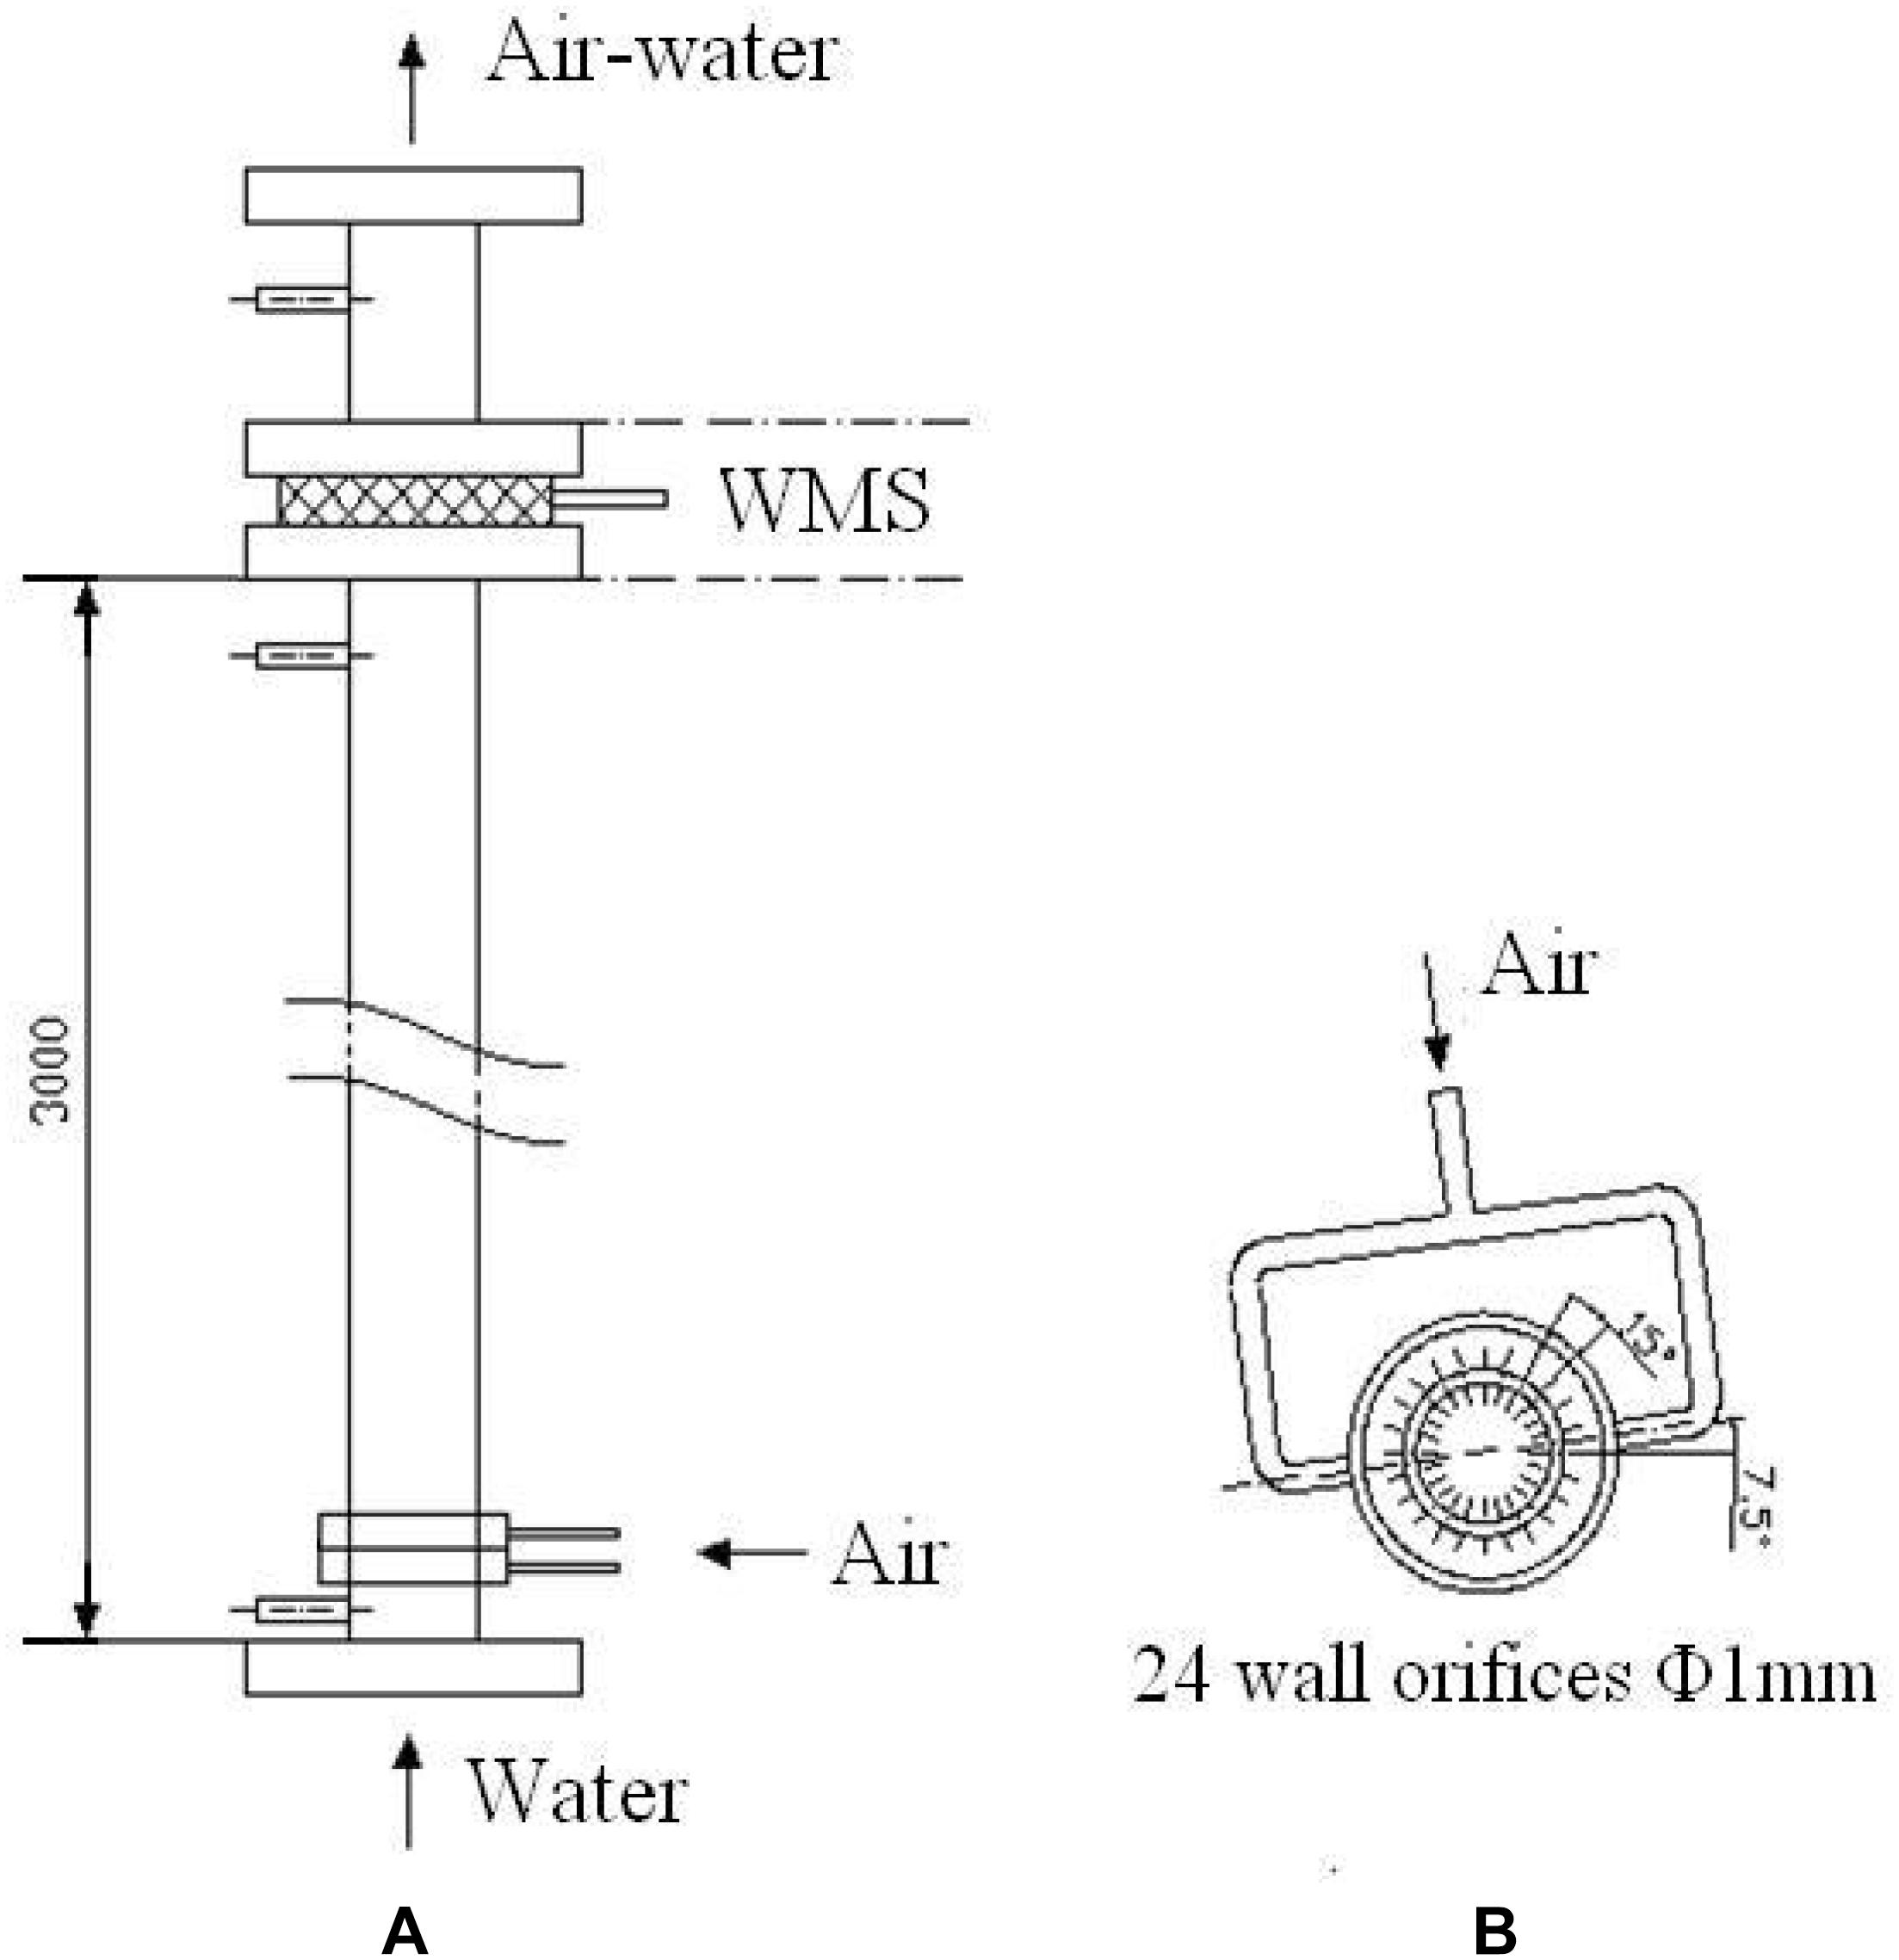
Figure 3. (A) Scheme of the experiment set-up, (B) air injector.
Wire Mesh Sensor
The WMS contains three layers of electrode wires as shown in Figure 4. Each layer is made up of 16 parallel wires and the distance between the wires is 3 mm. The axial distance between two adjacent layers is 2.5 mm. The middle layer is the transmitter electrode and the up and down layers are the receiver electrodes as shown in Figure 4B. The three layers structure forms two effective two layers WMS located up and down which can measure the bubble velocity. Actually, the bubble velocity isn’t studied in this paper, so just one effective two layers WMS is applied to measure the void fraction.
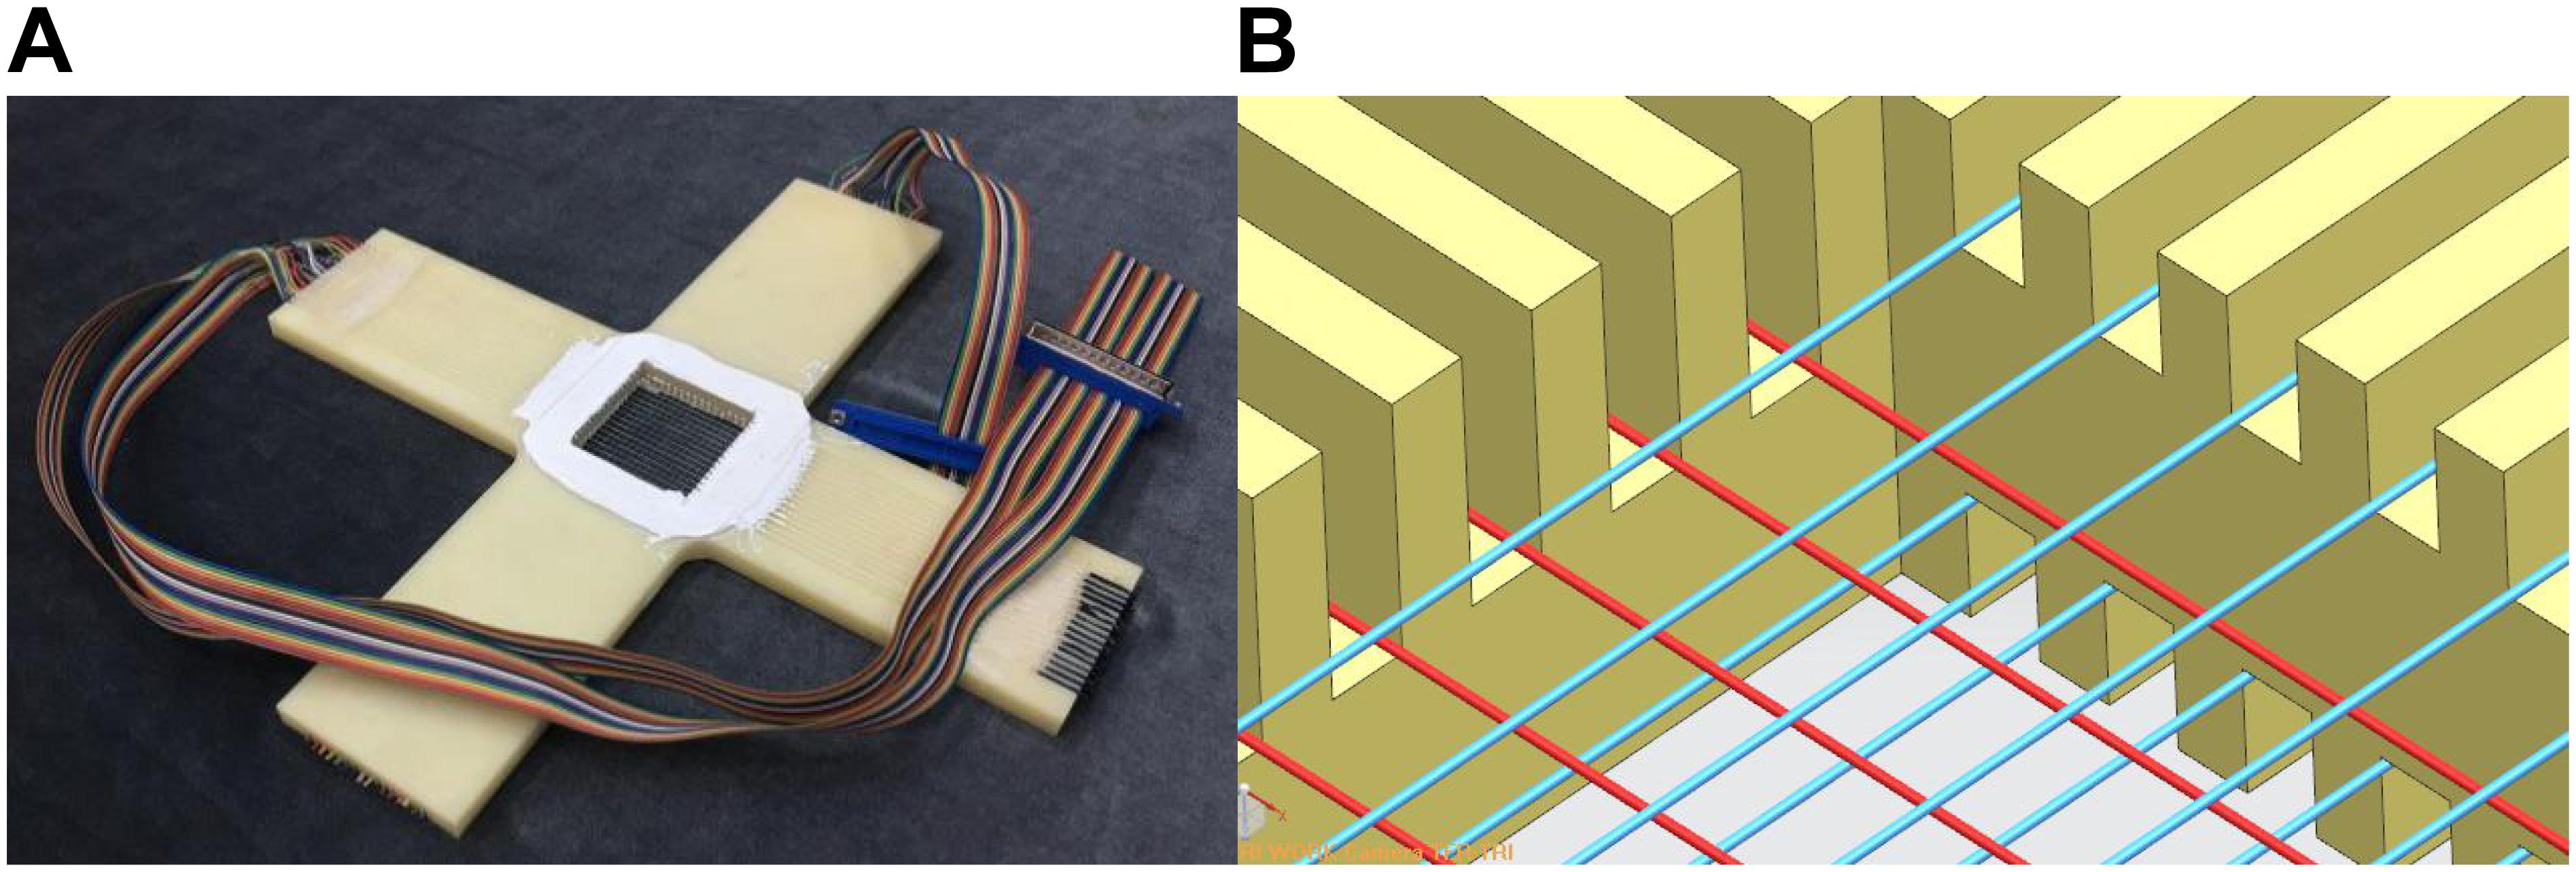
Figure 4. (A) The picture of WMS. (B) The detail of the three layers structure.
When the WMS is working, ±5 V pulsed square waves generated by the transmitter circuit pass through each transmitter electrode in turn, then pass through the fluid and received by the receiver electrode. The received original signal is filtered and amplified by the receiver circuit, and it is converted into digital signal by a 16 bits ADC. The conductivity of the fluid is between 420 and 450 μS/cm which is adjusted by salt. The scan frequency is 6,500 Hz. A three-dimensional voltage matrix V(i,j,k) can be obtained in each measurement. The void fraction can be calculated by Equation (10). The (i,j)in Equation (10) is the space coordinate and k is the time coordinate. The local reference voltage Vl(i,j) and Vg(i,j) for liquid phase and gas phase is measured in every test.
In every test, sampling begins after the experimental state is stable and lasts for 10 s. So a 16 × 16 × 65,000 void fraction matrix will be obtained in every test. Then the average void fraction of the cross section is calculated by Equation (11).
Calibration Experiment
Before the critical void fraction experiment, calibration experiment including single bubble and multi bubbles tests is carried out to evaluate the measuring error of the WMS. For single bubble tests (Yu et al., 2018), 95% of the bubble velocity data’s relative error is in ±15 and 93% of the bubble volume data’s relative error is in ±15%, Yu et al. (2018) gives the analysis process and detailed results of the single bubble test.
In this paper, the multi bubbles measuring error is more concerned because the critical void fraction is a macro parameter for multiple bubbles two phase flow. The available data shows that the WMS has a uncertainty of ±10.5% for void fraction measurement, but the accuracy is largely based on the practical application (Tompkins et al., 2018). So a calibration experiment is needed for this study. This paper uses the differential pressure method to evaluate the measuring error of the WMS. The pressure measuring points are located near the WMS as shown in Figure 5. The distance between the two measuring points is 265 mm. A Honeywell ST3000 differential pressure gauge whose precision is 0.1% is applied to measure the differential pressure. And the average void fraction is calculated by Equation (12) which is derived by the conservation of momentum. The term on the left hand side of Equation (12) is the differential pressure per meter which is calculated by the differential pressure data. The first term in the right hand side of Equation (12) is the friction pressure drop which is calculated by Lockhart-Matinelli separated flow model (Lockhart and Martinelli, 1949) in this paper. The second term on the right hand side is the gravity differential pressure, and sinθ = 1 for the vertical tube.
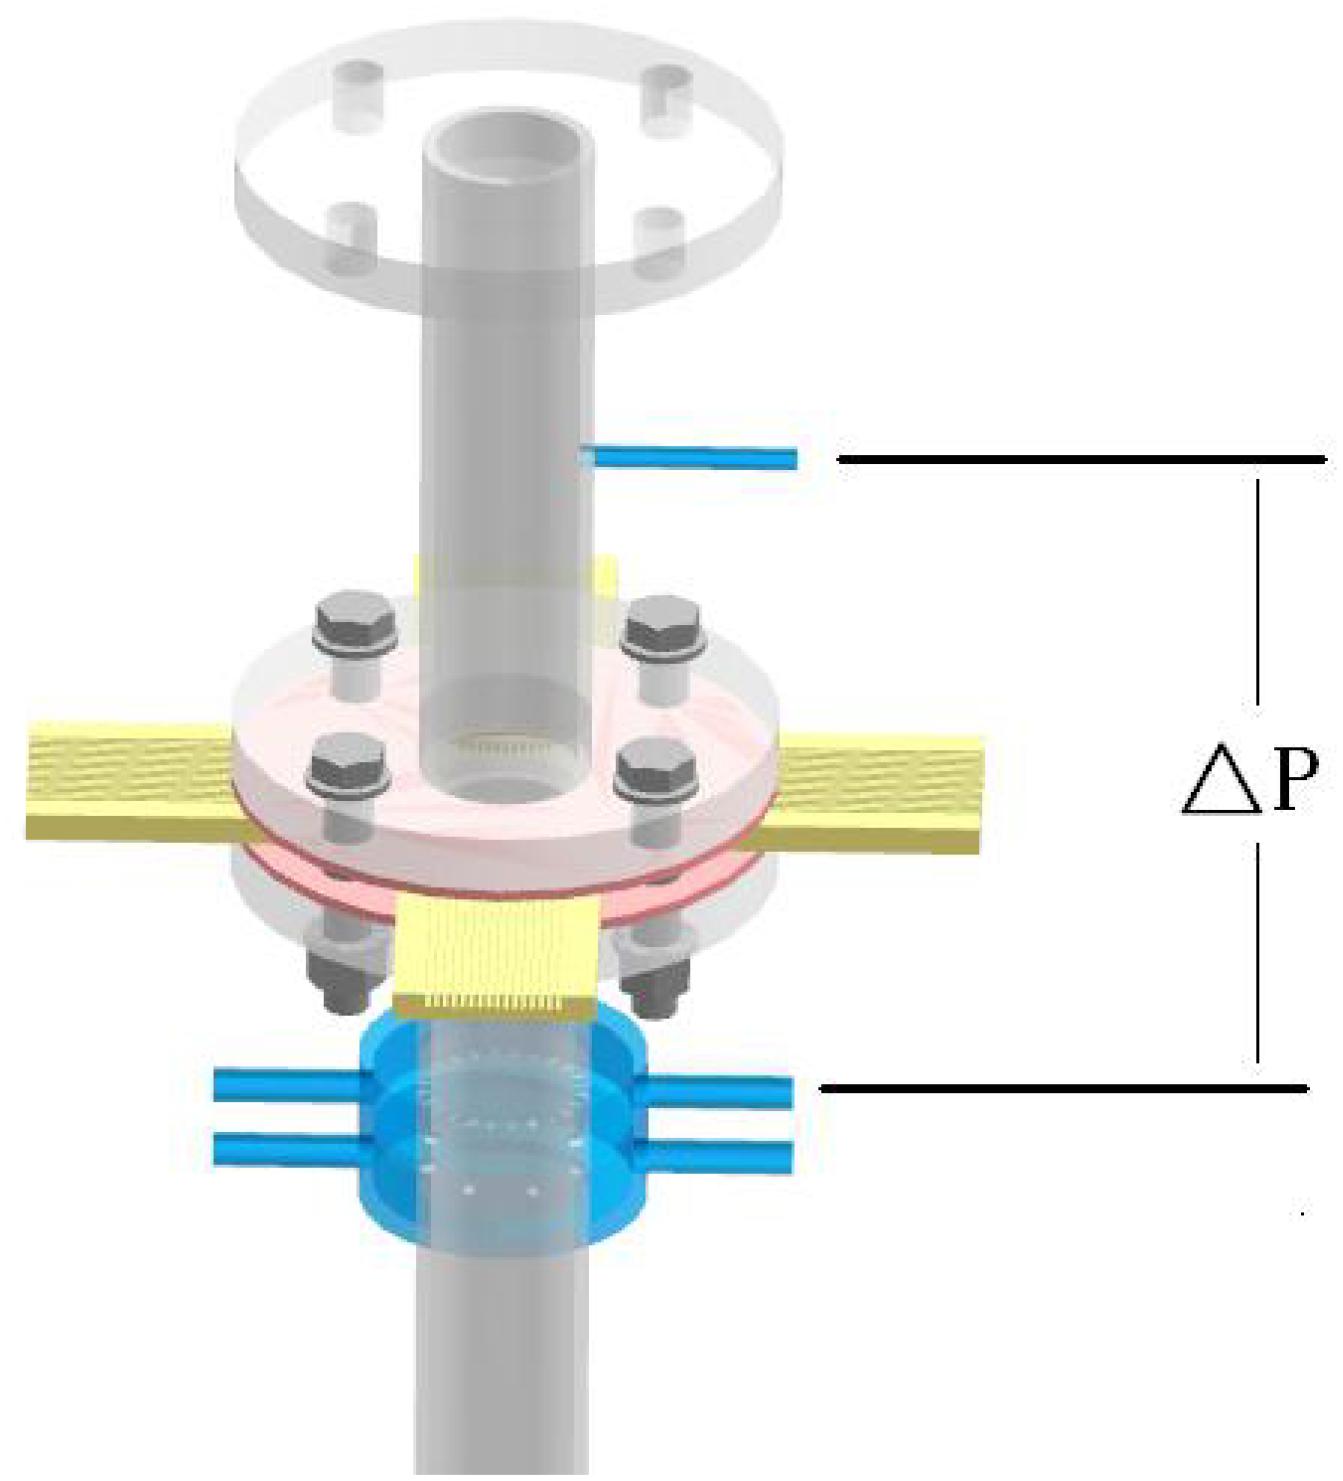
Figure 5. Differential pressure measuring.
In the multiple bubbles calibration tests, the superficial liquid velocity varies from 0.040 to 0.160 m/s and the superficial gas liquid varies from 0.014 to 0.530 m/s. the average void fraction of the cross section measured by WMS varies from 0.034 to 0.611 while the average void fraction calculated by Equation (12) varies from 0.041 to 0.583. The comparison result of void fraction obtained by WMS and differential pressure is shown in Figure 6. Ninety-four percentage of the data’s relative error is in ±15%.
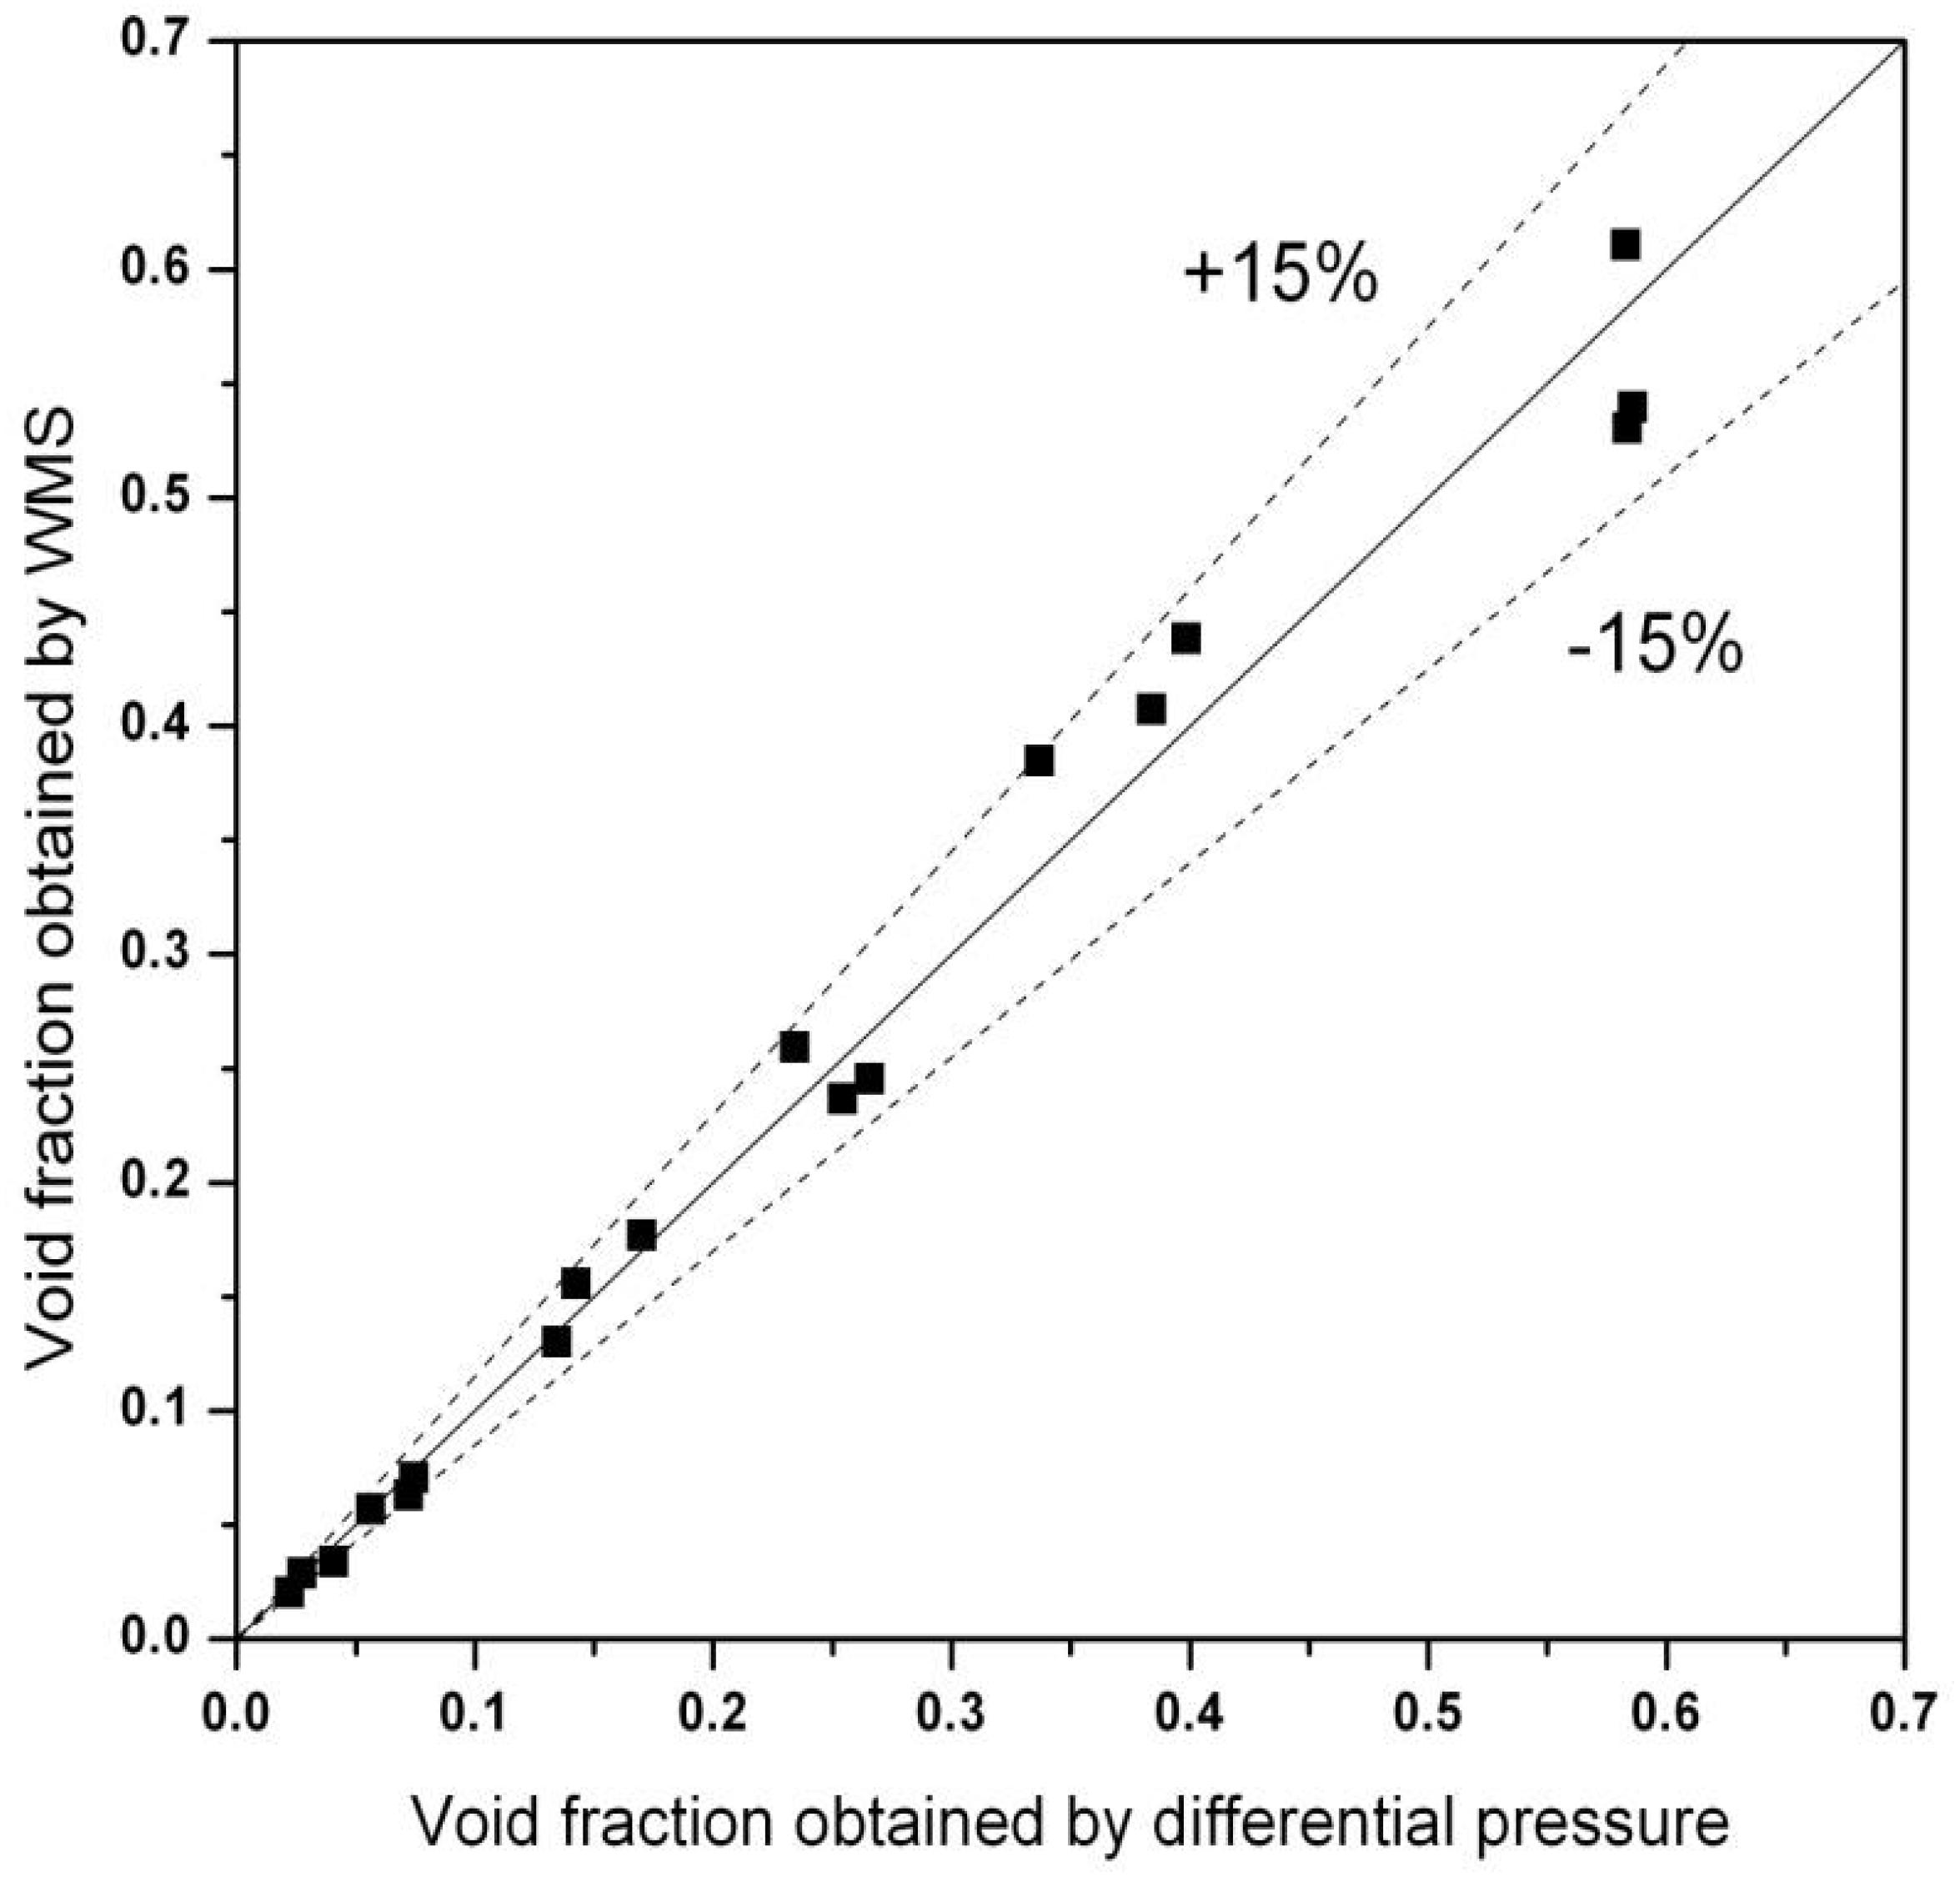
Figure 6. Comparison result of void fraction calculation.
Experimental Study of the Critical Void Fraction
After calibration experiment, 48 tests with different velocity combination of the two phases are carried out. The superficial liquid velocity varies from 0.040 to 3.272 m/s and the superficial gas liquid varies from 0.011 to 0.960 m/s. The flow patterns include bubbly flow, slug flow, and churn flow. To study the critical void fraction for bubbly-slug flow transition, 10 tests before and after the flow pattern transition are chosen which are shown in Table 2. The pictures of these 10 tests are shown in Figure 7. The slug flow is defined as having stable gas slugs that occupy almost all of the cross section of the tube. The void fraction of each test is measured by WMS. Figure 8 shows the instantaneous void fraction of the cross section in test E5. The time average void fraction is calculated by Equation (11) where the time coordinate k varies from 0 to 64,999. The experimental result of these 10 tests shown in Table 2 indicates that the critical void fraction of bubbly-slug transition is between 0.237 and 0.245 which is closer to the Taitel model.
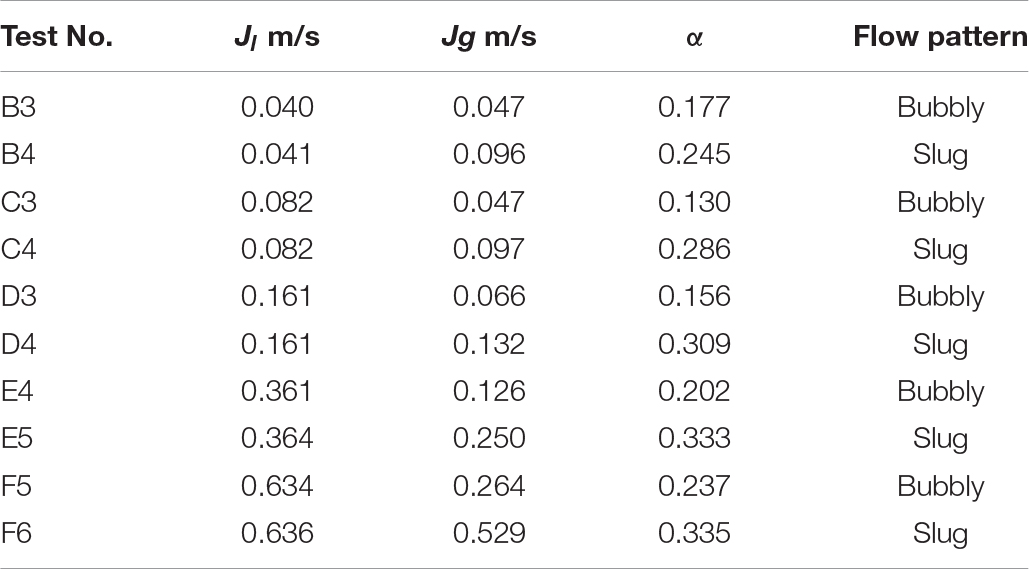
Table 2. Void fraction experimental results.
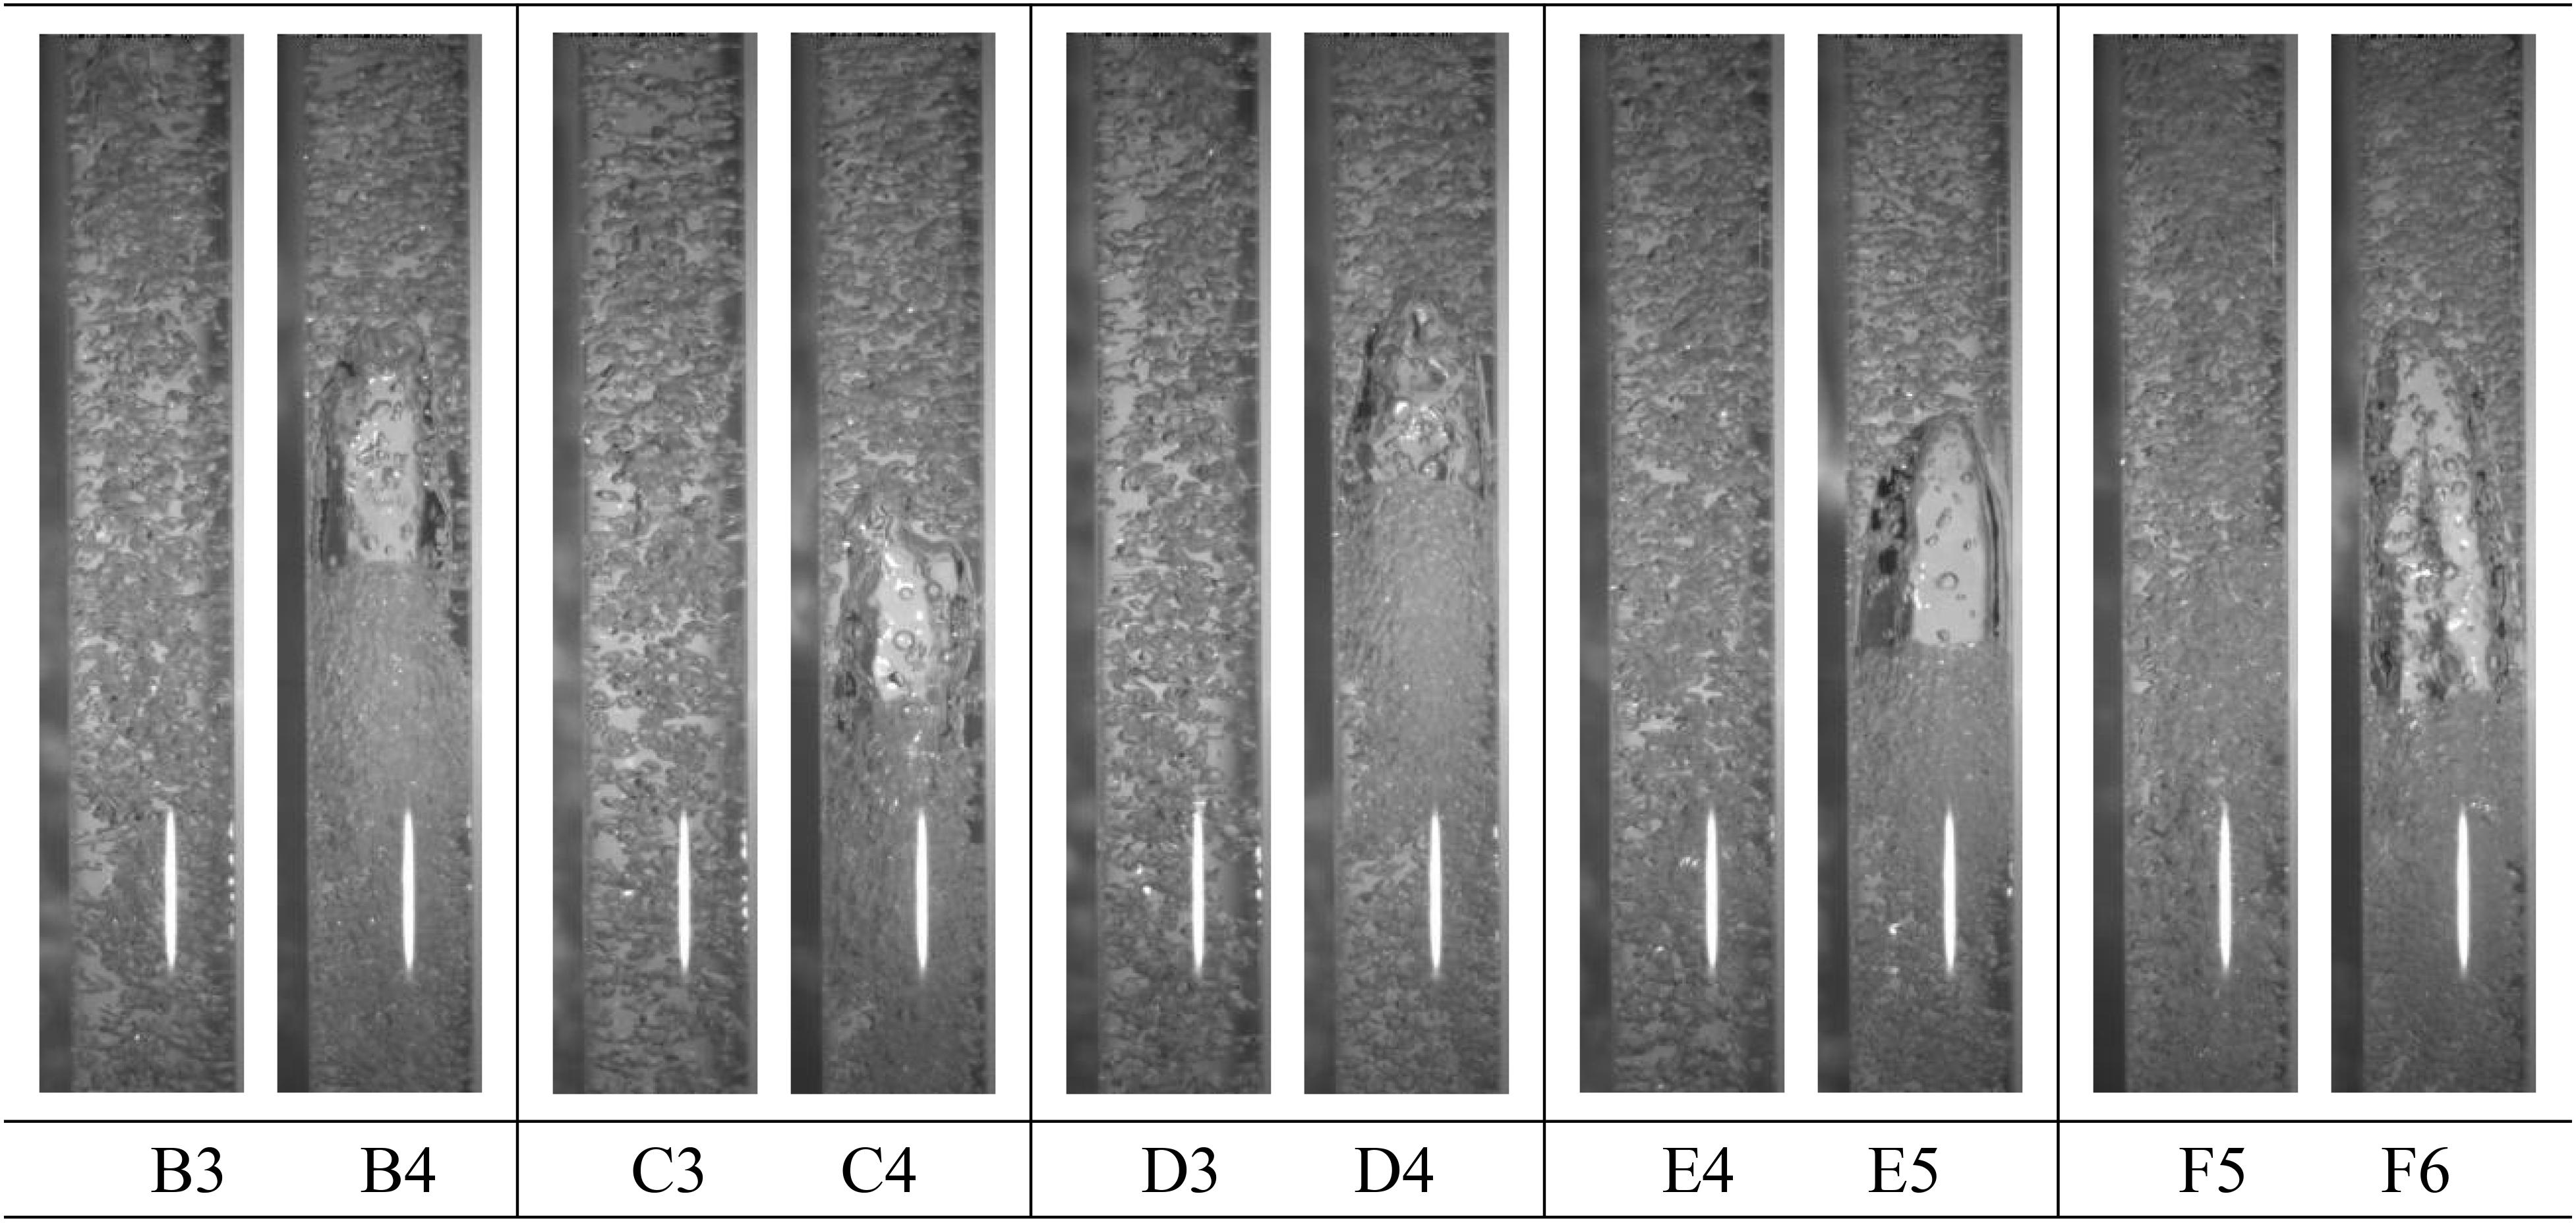
Figure 7. Pictures of 10 tests before and after bubbly-slug flow transition.
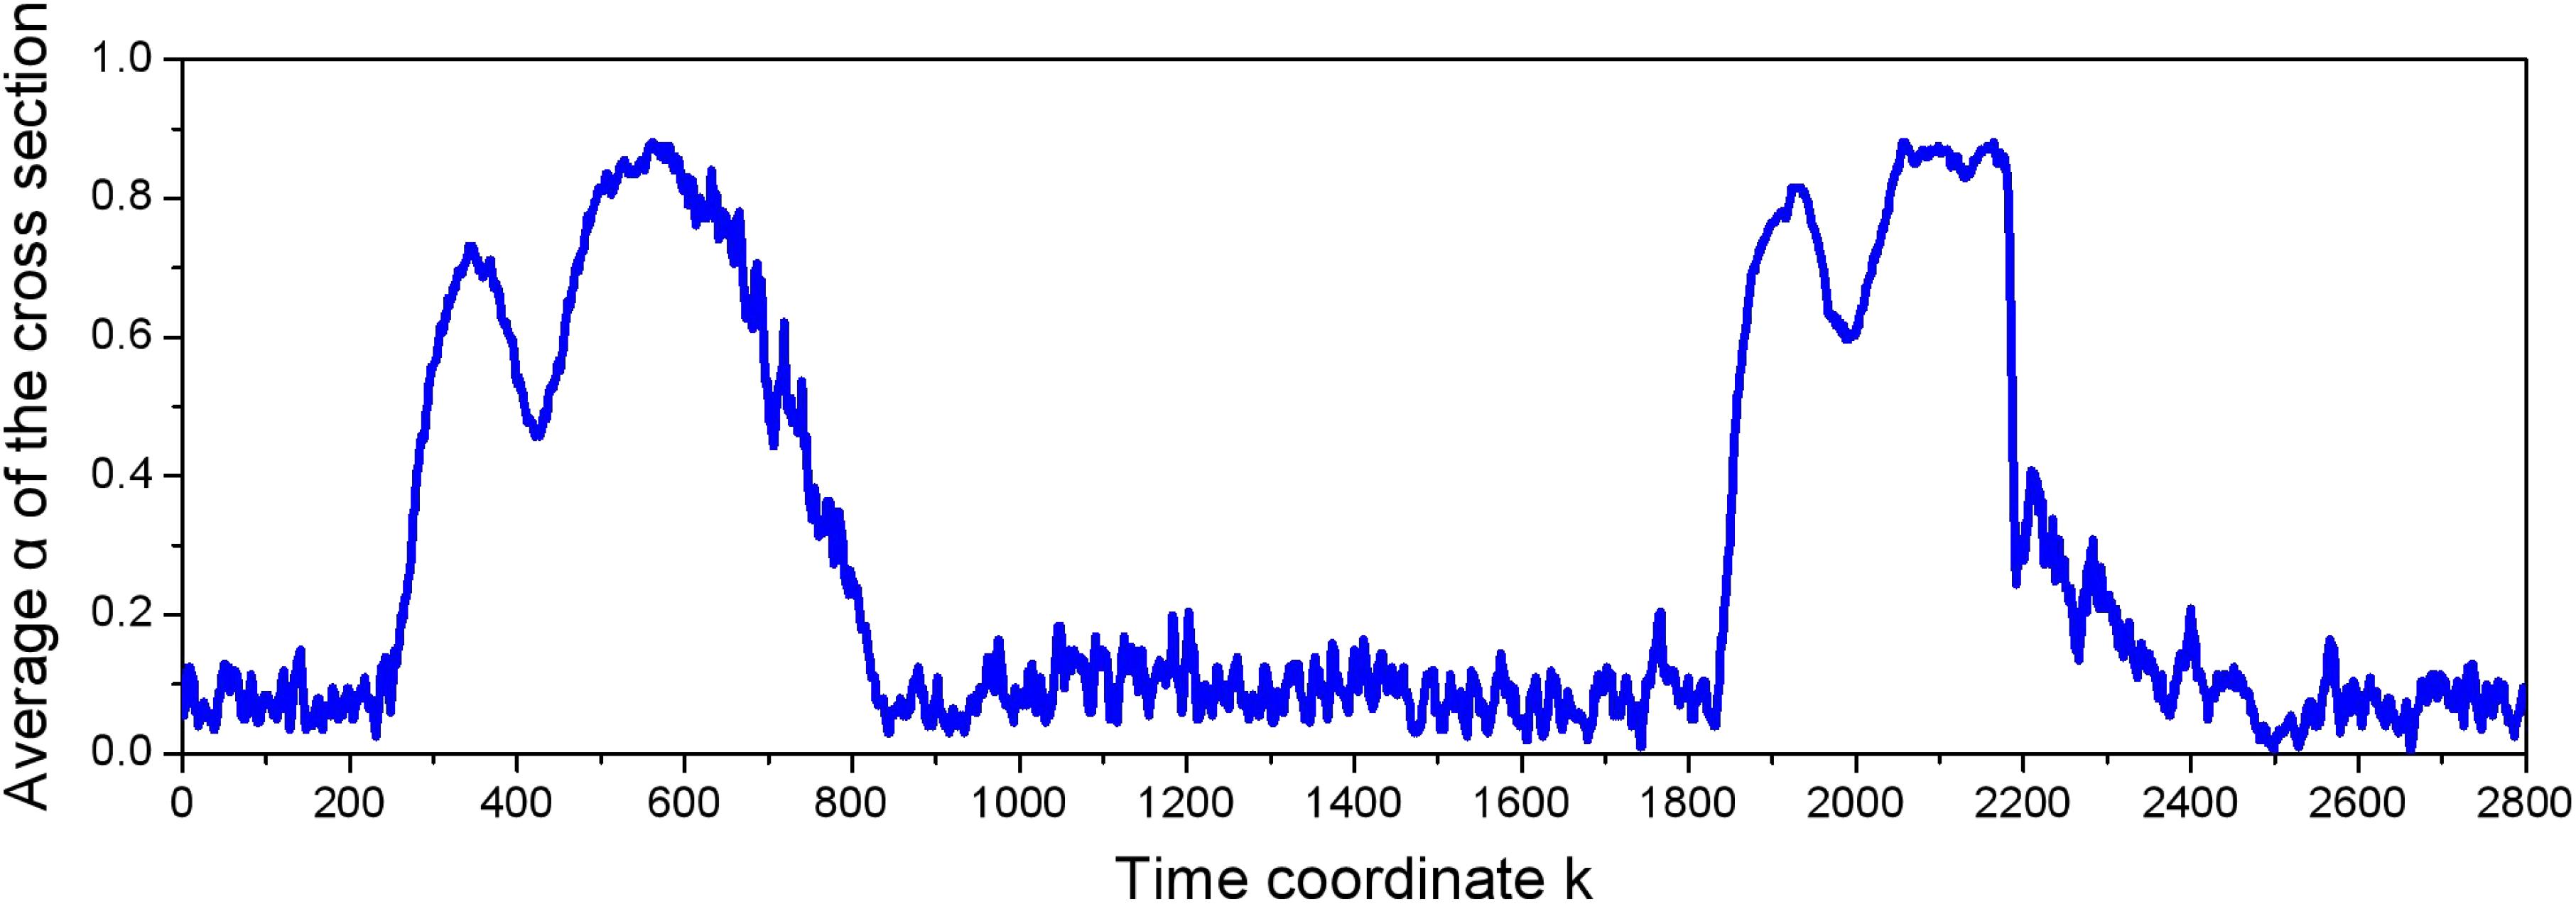
Figure 8. The instantaneous void fraction of the cross section in test E5.
Visualization Validation Experiment
The experimental study of the critical void fraction shows that shows that the critical void fraction of bubbly-slug flow transition is closer to the Taitel model. For further validation, an visualization validation experiment with 147 tests was carried out. The PCO dimax high speed camera was applied. The superficial velocity of the liquid phase is between 0.02 and 3.55 m/s and the superficial velocity of the gas phase is between 0.0075 and 1.92 m/s. The superficial velocity interval between adjacent tests is smaller. The flow pattern of the visualization validation experiment includes bubbly flow, slug flow, churn flow, and dispersed bubbly flow.
The Taitel bubbly-slug transition formula as shown in Equation (13) is obtained by substituting the parameters ρg = 1.18kg/m3, ρl = 997.05kg/m3, σ = 0.072N/mwhich are under the experimental condition into Equation (9). Figure 9 shows the comparison between Taitel criterion and experimental results. From the figure, it can be seen that the criterion agrees well with the experimental results at both low and high liquid velocity.

Figure 9. Comparison between Taitel criterion and experimental results.
In the same way, the Mishima-Ishii bubbly-slug transition formula as shown in Equation (14) can be obtained by substituting the physical parameters and the circular tube distribution parameter. Figure 10 shows the comparison between Mishima-Ishii criterion and experimental results. In the low superficial liquid velocity region (0.02–0.08 m/s), Mishima-Ishii criterion agrees well with the experimental results, while in the high superficial liquid velocity region (0.16–2.56 m/s), the superficial gas velocity given by Mishima-Ishii criterion is higher than the experimental results.
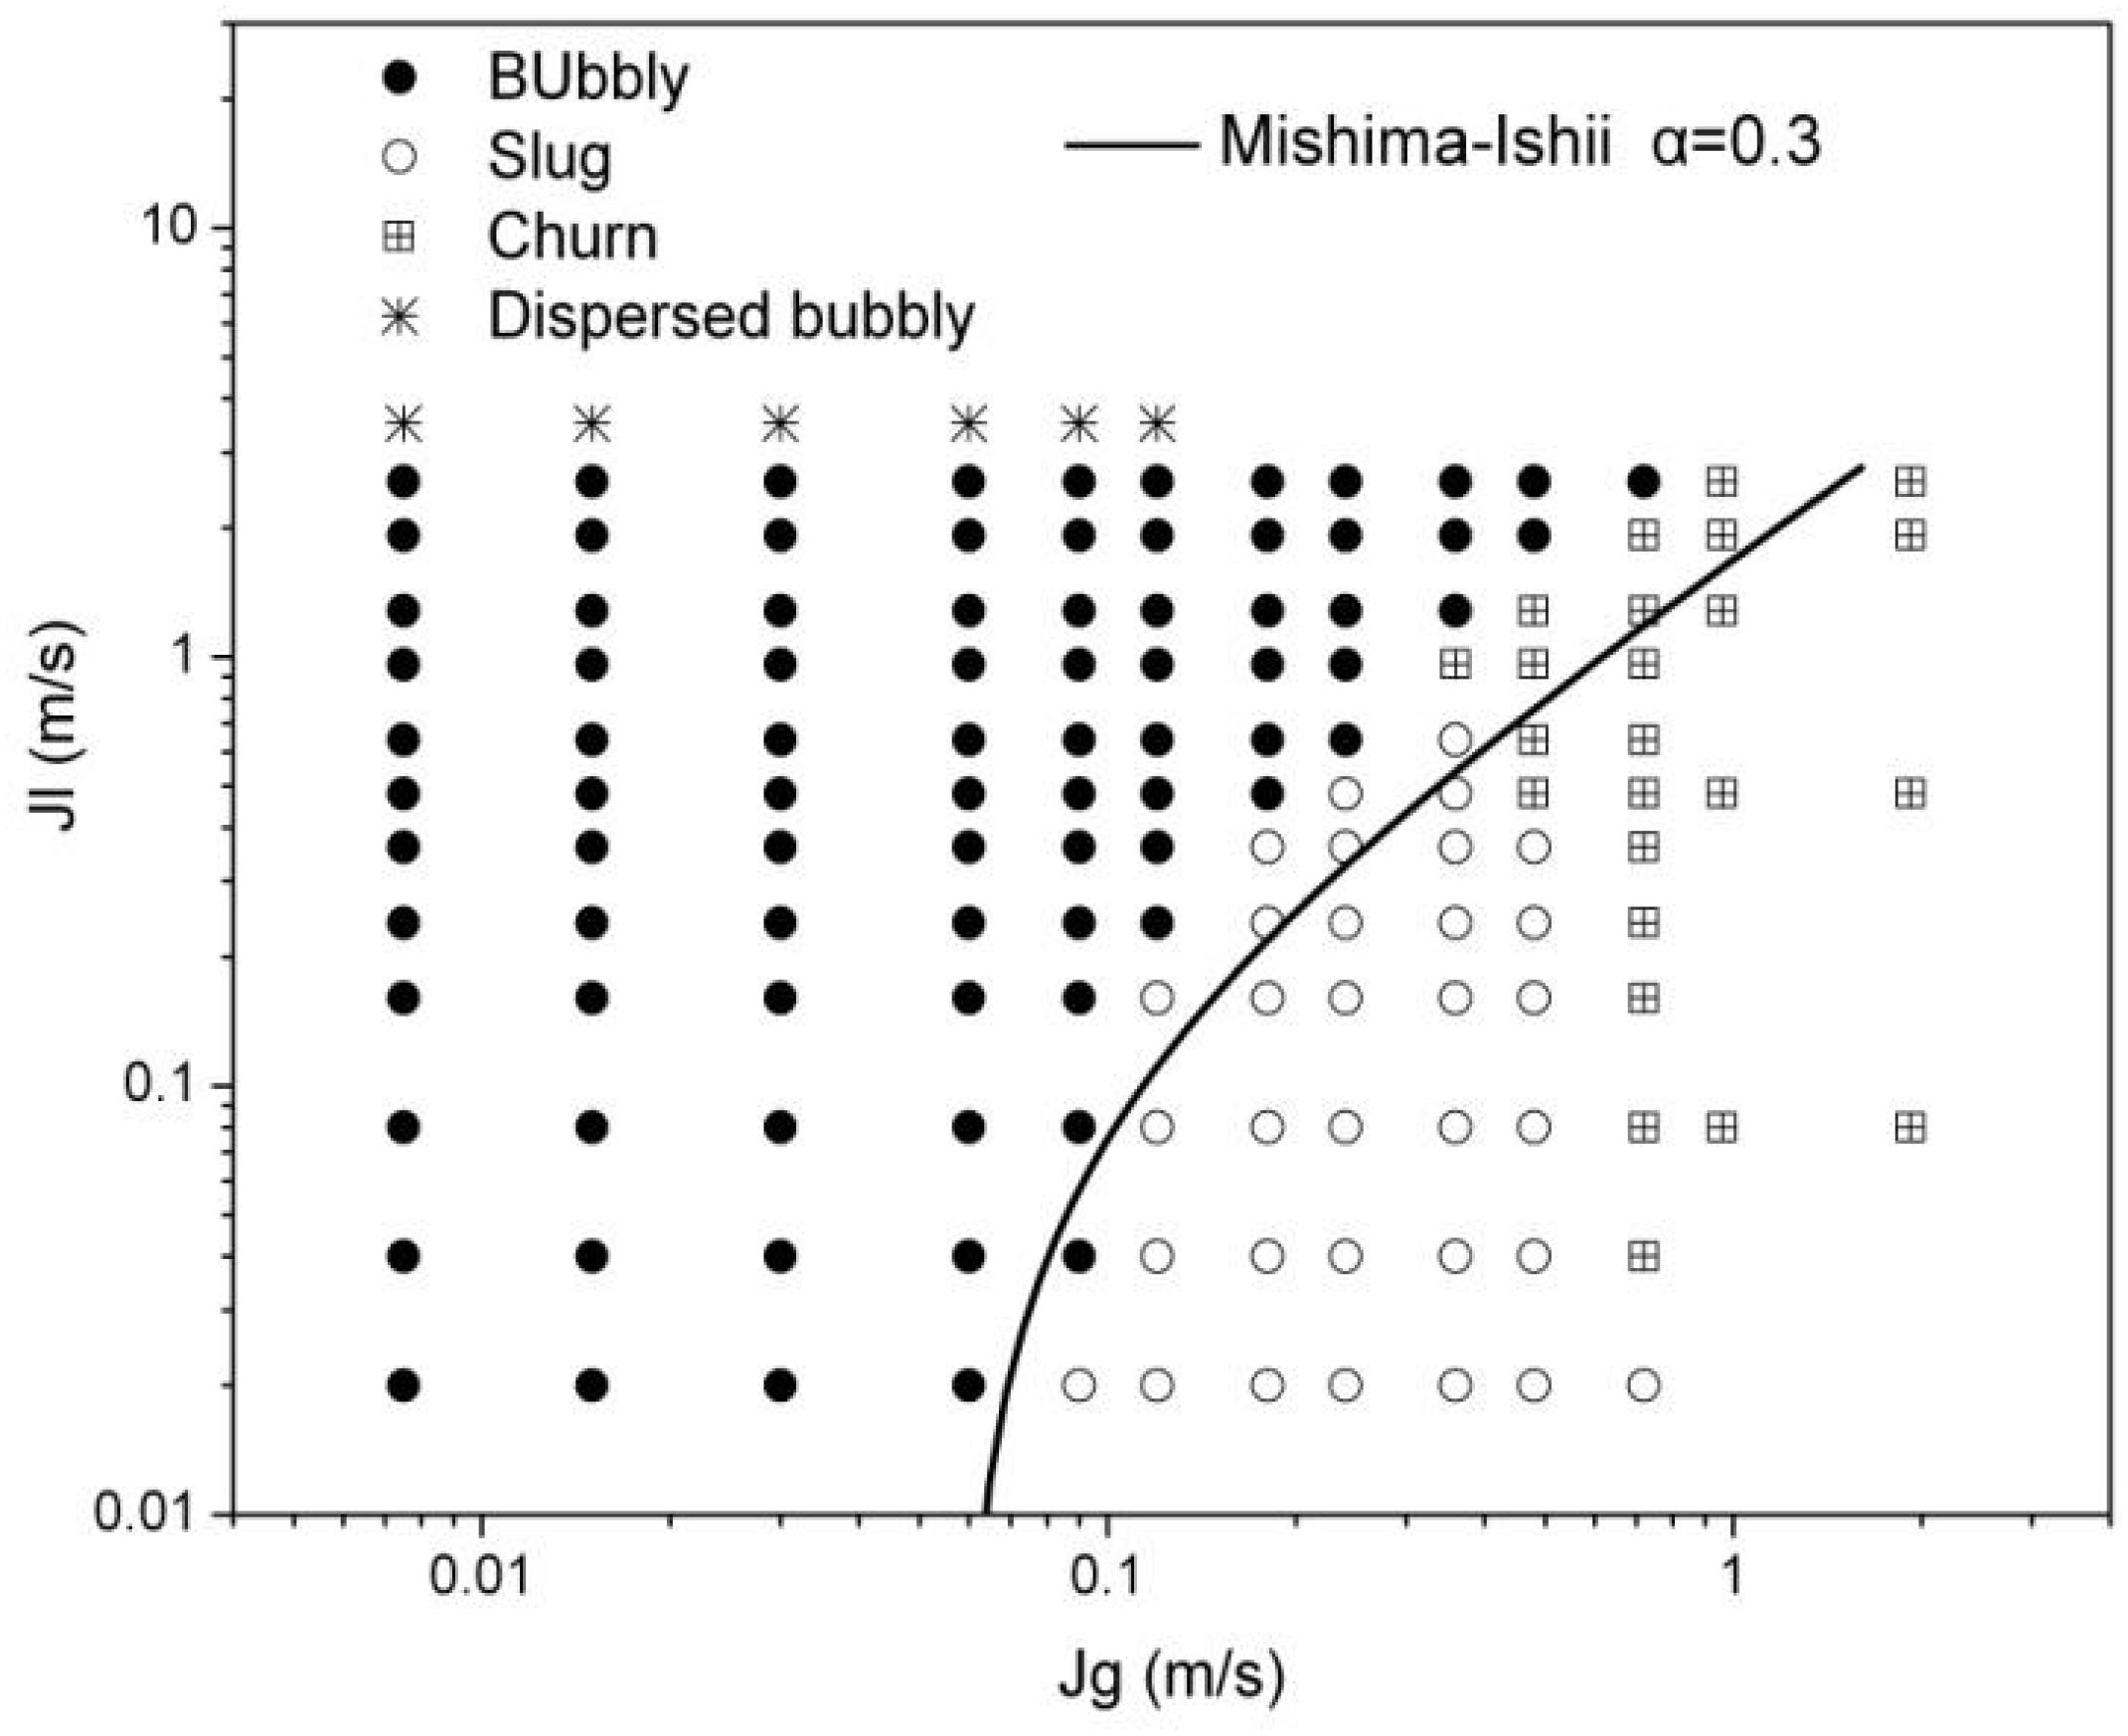
Figure 10. Comparison between Mishima-Ishii criterion and experimental results.
For the deviation of the Mishima-Ishii criterion, this paper considers whether it is caused by the inappropriate critical void fraction. So a modified Mishima-Ishii criterion is given by choosing 0.25 as the bubbly-slug transition critical void fraction. The formula is shown in Equation (15). Figure 11 shows the comparison between modified Mishima-Ishii criterion and experimental results. In the high superficial liquid velocity region (0.16–2.56 m/s), the modified Mishima-Ishii criterion is more accurate than the original Mishima-Ishii criterion. But the deviation becomes greater in the low superficial liquid velocity region (0.02–0.08 m/s), the superficial gas velocity given by modified Mishima-Ishii criterion is lower than the experimental results.
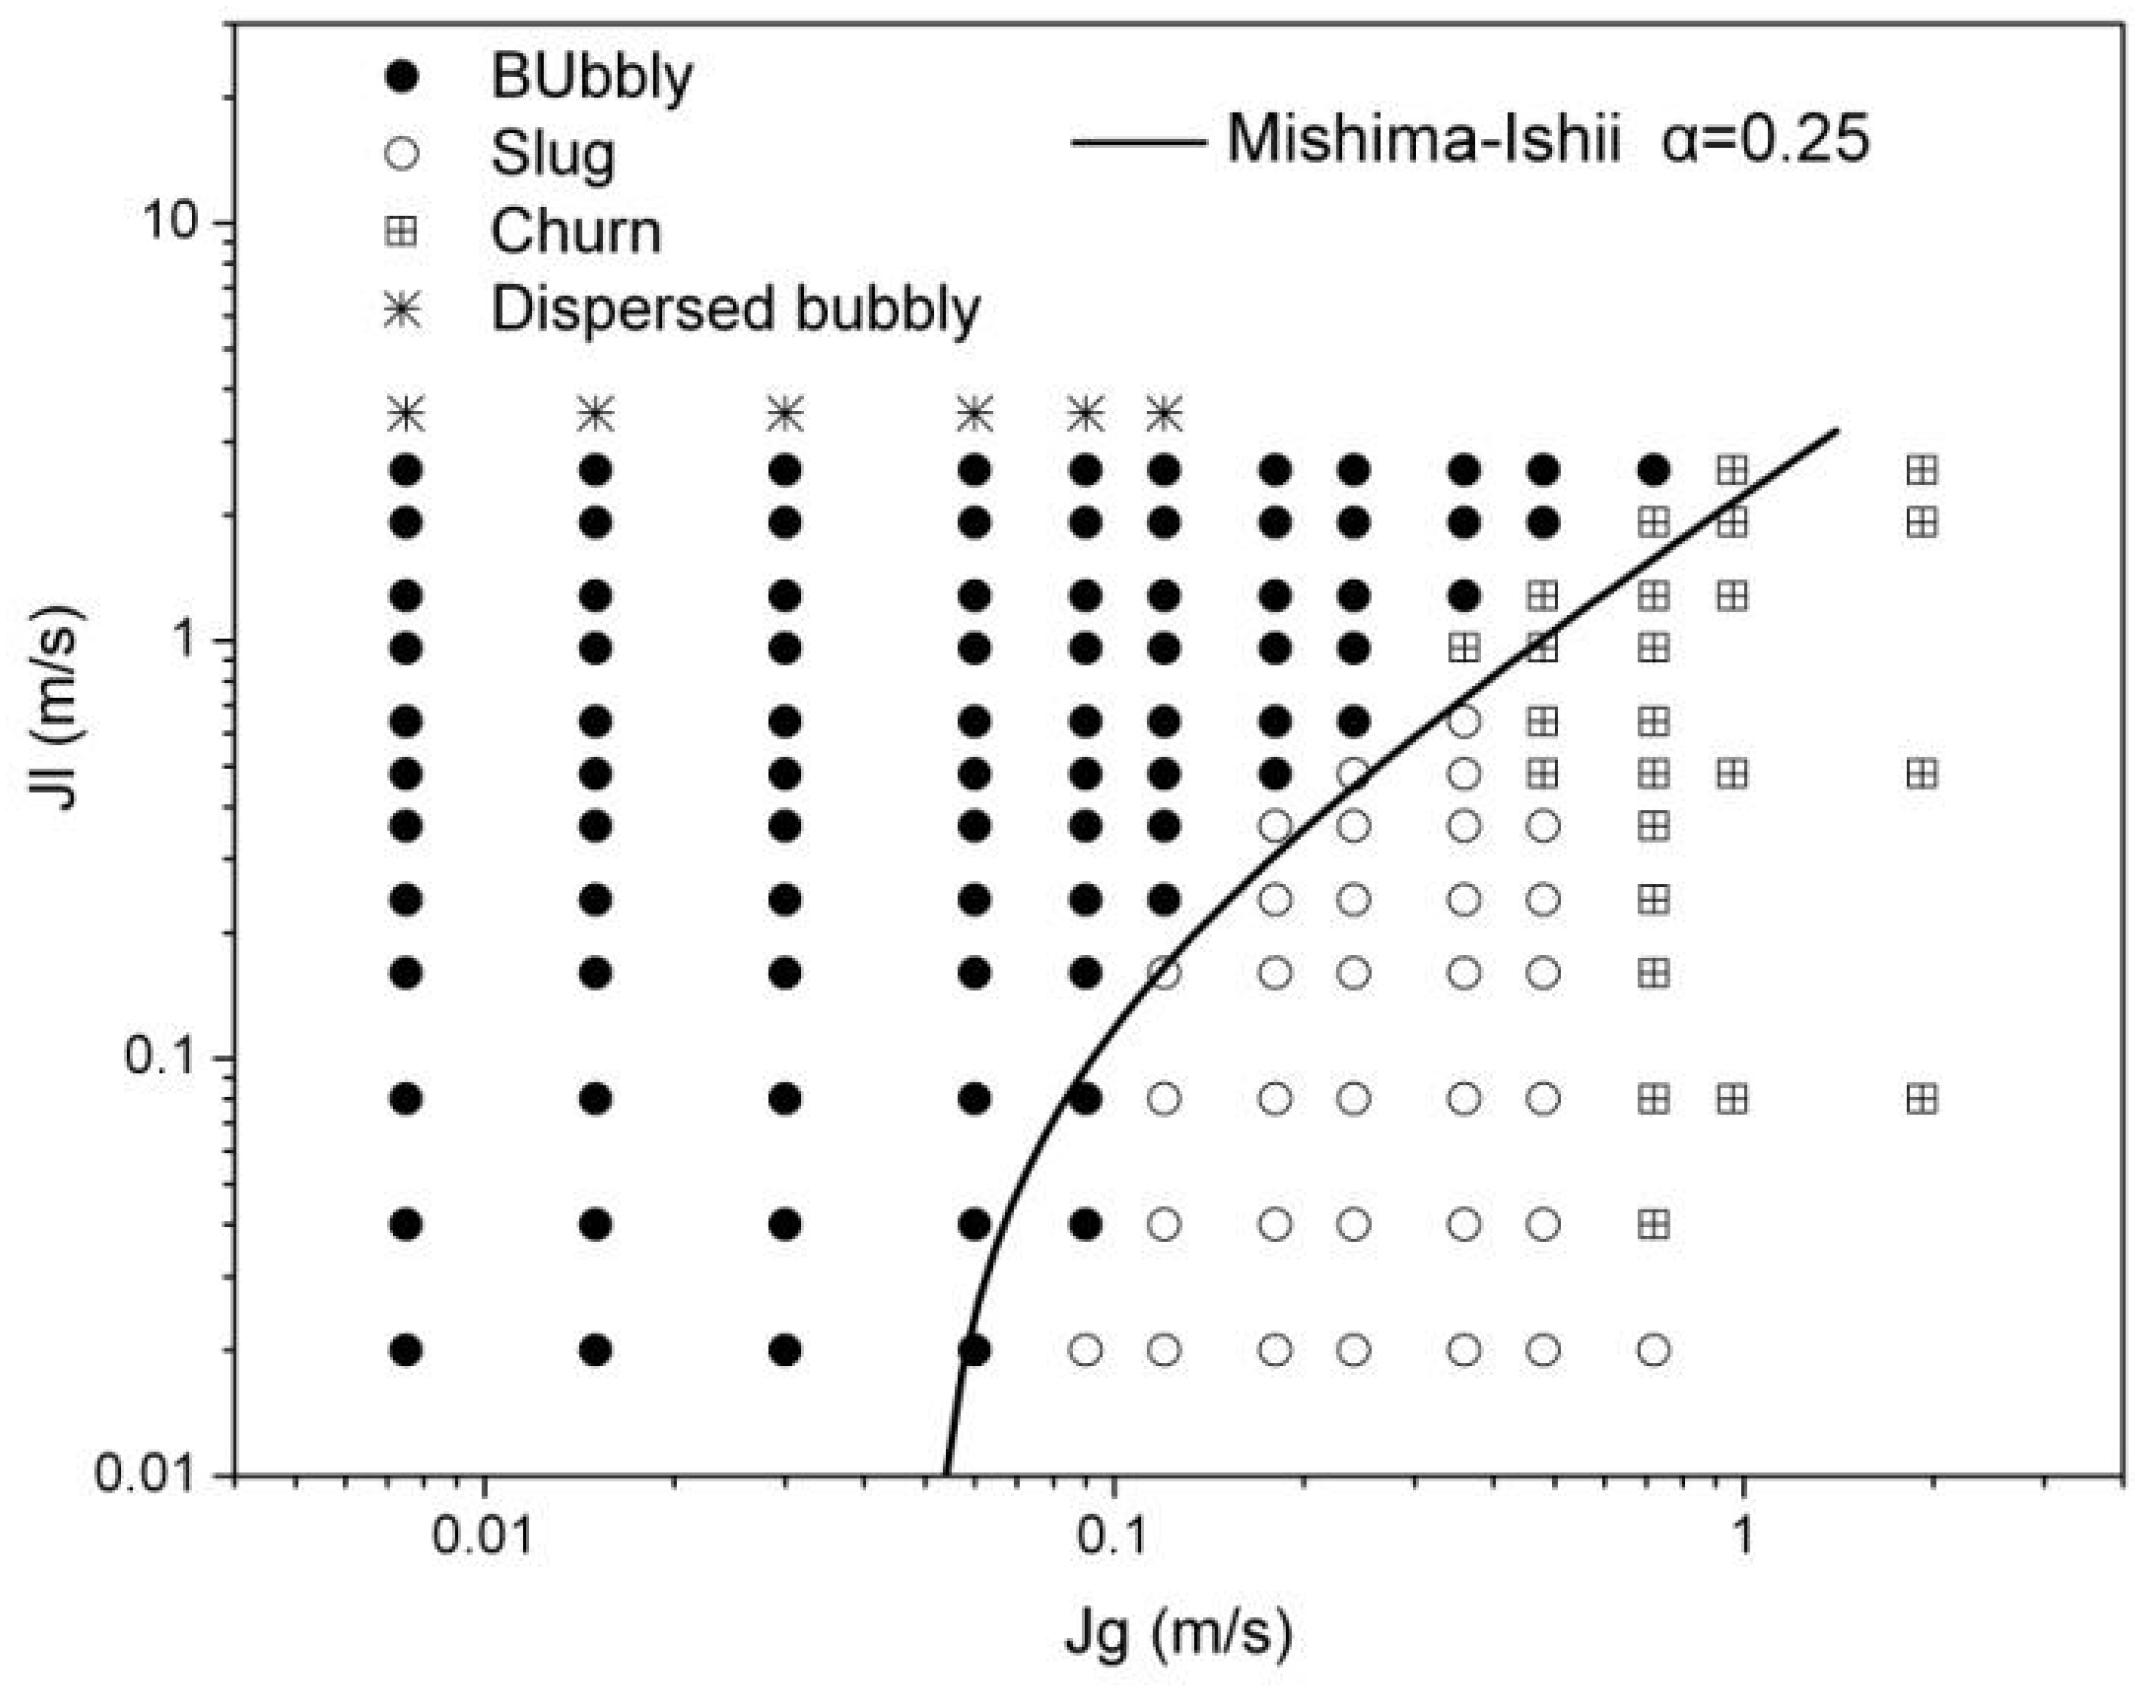
Figure 11. Comparison between modified Mishima-Ishii criterion and experimental results.
Conclusion
Two bubbly-slug flow transition criteria in vertical circular tubes proposed by Mishima and Ishii (1984) and Taitel et al. (1980). are studied in this paper. They are basing on different transition mechanism and apply different critical void fraction. A WMS was manufactured to measure the critical void fraction for bubbly-slug transition. Experimental result shows that the critical void fraction is closer to 0.25. For further validation, an visualization validation experiment including 147 tests were carried out. The validation experimental result shows that the Taitel bubbly-slug transition criterion basing on big bubble raising velocity model is more suitable for bubbly-slug flow transition in a vertical circular tube with 50 mm diameter.
Data Availability Statement
The datasets generated for this study are available on request to the corresponding author.
Author Contributions
SY gave substantial contributions to the conception or design of the work, and the acquisition, analysis, or interpretation of data for the work. XY provided approval for publication of the content. LZ, AX, JZ, SG, and YZ have given some help during the experiment.
Conflict of Interest
The authors declare that the research was conducted in the absence of any commercial or financial relationships that could be construed as a potential conflict of interest.
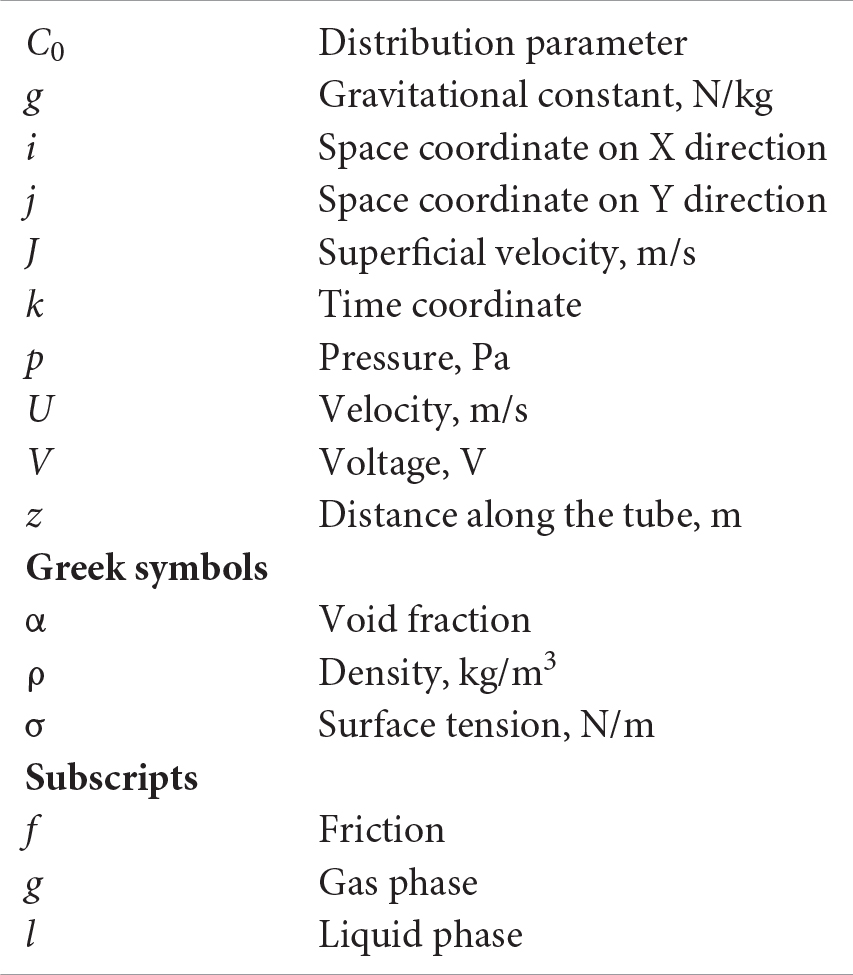
Nomenclature
References
Banowski, M., Beyer, M., Szalinski, L., Lucasa, D., and Hampel, U. (2016). Comparative study of ultrafast X-ray tomography and wire-mesh sensors for vertical gas–liquid pipe flows. Flow Meas. Instrum. 53, 95–106. doi: 10.1016/j.flowmeasinst.2016.02.001
Barnea, D., Shoham, O., and Taitel, Y. (1982). Flow pattern transition for vertical downward two phase flow. Chem Eng Sci. 37, 741–744. doi: 10.1016/0009-2509(82)85034-3
Beyer, M., Lucas, D., and Kussin, J. (2010). Quality check of wire-mesh sensor measurements in a vertical air/water flow. Flow Meas. Instrum. 21, 511–520. doi: 10.1016/j.flowmeasinst.2010.09.001
Euh, D. J., Yun, B. J., Song, C. H., Kwon, T. S., Chung, M. K., Lee, U. C., et al. (2001). Development of the five-sensor conductivity probe method for the measurement of the interfacial area concentration. Nucl. Eng. Des. 205, 35–51. doi: 10.1016/s0029-5493(00)00376-9
Harmathy, T. Z. (1960). Velocity of large drops and bubbles in media of infinite or restricted extent. Aiche 6:281. doi: 10.1002/aic.690060222
Hibiki, T., and Ishii, M. (1998). Effect of flow-induced vibration on local flow parameters of two-phase flow. Nucl. Eng. Des. 185, 113–125. doi: 10.1016/s0029-5493(98)00241-6
Kim, S., Fu, X. Y., Wang, X., and Ishii, M. (2000). Development of the miniaturized foursensor conductivity probe and the signal processing scheme. Int. J. Heat. Mass. Transf. 43, 4101–4118. doi: 10.1016/s0017-9310(00)00046-6
Lockhart, R. W., and Martinelli, R. C. (1949). Proposed correlation of data for isothermal two-phase, two-component flow in pipes. Chem. Eng. Prog. 45, 39–48.
Mcquillan, K. W., and Whalley, P. B. (1985). Flow patterns in vertical two-phase flow. Int. J. Multiphase Flow 11, 161–175. doi: 10.1016/0301-9322(85)90043-6
Mishima, K., and Ishii, M. (1984). Flow regime transition criteria for upward two-phase flow in vertical tubes. Int. J. Heat Mass Transfer. 27, 723–737. doi: 10.1016/0017-9310(84)90142-x
Pietruske, H., and Prasser, H. M. (2007). Wire-mesh sensors for high-resolving two-phase flow studies at high pressure and temperatures. Flow Meas. Instrum. 18, 87–94. doi: 10.1016/j.flowmeasinst.2007.01.004
Prasser, H.-M. (2007). Evolution of interfacial area concentration in a vertical air–water flow measured by wire–mesh sensors. Nucl. Eng. Des. 237, 1608–1617. doi: 10.1016/j.nucengdes.2007.02.024
Prasser, H. M., Misawa, M., and Tiseanu, I. (2005). Comparison between wire-mesh sensor and ultra-fast X-ray tomograph for an air–water flow in a vertical pipe. Flow Meas. Instrum. 16, 73–83. doi: 10.1016/j.flowmeasinst.2005.02.003
Taitel, Y., Bornea, D., and Dukler, A. E. (1980). Modelling flow pattern transitions for steady upward gas-liquid flow in vertical tubes. Aiche J. 26, 345–354. doi: 10.1002/aic.690260304
Tompkins, C., Prasser, H.-M., and Corradini, M. (2018). Wire-mesh sensors: a review of methods and uncertainty in multiphase flows relative to other measurement techniques. Nucl. Eng. De. 337, 205–220. doi: 10.1016/j.nucengdes.2018.06.005
Weisman, J., and Kang, S. Y. (1981). Flow pattern transitions in vertical and upwardly inclined line. Int. J. Multiphase Flow. 7, 271–291. doi: 10.1016/0301-9322(81)90022-7
Keywords: two-phase flow, bubbly-slug flow, transition mechanism, vertical tube, WMS
Citation: Yu S, Yan X, Zhou L, Xu A, Zhang J, Gong S and Zan Y (2020) Experimental Study of Bubbly-Slug Flow Transition Criteria in an Vertical Circular Tube by Using WMS. Front. Energy Res. 8:51. doi: 10.3389/fenrg.2020.00051
Received: 16 August 2019; Accepted: 12 March 2020;
Published: 15 April 2020.
Edited by:
Liangming Pan, Chongqing University, ChinaReviewed by:
Bruno Panella, Politecnico di Torino, ItalyFenglei Niu, North China Electric Power University, China
Keyou S. Mao, Purdue University, United States
Victor Petrov, University of Michigan, United States
Copyright © 2020 Yu, Yan, Zhou, Xu, Zhang, Gong and Zan. This is an open-access article distributed under the terms of the Creative Commons Attribution License (CC BY). The use, distribution or reproduction in other forums is permitted, provided the original author(s) and the copyright owner(s) are credited and that the original publication in this journal is cited, in accordance with accepted academic practice. No use, distribution or reproduction is permitted which does not comply with these terms.
*Correspondence: Xiao Yan, eWFueGlhb19ucGljQDE2My5jb20=