 Long Yun
 Lin Bin
 Fang Jie
 Zhu Rongsheng
 Fu Qiang
- China National Research Center of Pumps, Jiangsu University, Zhenjiang, China
Compared with the periodic unsteady flow induced by single-stage centrifugal pump, the internal flow state of multistage centrifugal pump is more complicated and the flow is more disordered. In this paper, the start-up process is divided into two stages: the closed-valve transition and the open-valve transition. The transient operation process is simulated numerically, and the pump characteristics and the evolution characteristics of the internal flow field are analyzed. It is found that multistage centrifugal pump start-up process of the closed-valve transition, when the impeller does the same work, compared with the steady state at the same speed, the mechanical energy in the internal flow field is converted into more kinetic energy and less pressure. Compared with the steady state at the same flow rate, in the initial stage of the open-valve start-up process, the stall group in the impeller flow channel is larger and the number of stall groups is more during the transient process, which exacerbates the rotational stall of the internal flow of the impeller, and the flow is more disordered. As a result, the amplitude of the hump fluctuation is greater than that under the same flow steady state. The research on the transient characteristics of the low specific speed multi-stage centrifugal pump during startup conditions is of great significance to the safety and reliability of nuclear power equipment and systems.
Introduction
Multi-stage centrifugal pumps need to be started frequently due to changes in operating conditions. During start-up, the speed of the pump increases rapidly from zero to thousands. The internal flow state of the pump changes from laminar to strong turbulent, and it also includes periodic unsteady flow induced by the dynamic and static interference of the impeller and the pressure water chamber. The internal flow of the pump exhibits unconventional transient characteristics. This article takes the CAP1400 Capacitive Water Pump (CVS) as the research object. The pump is a 13-stage low specific speed centrifugal pump. Capacitive make-up water pump is an extremely important class D pump in nuclear power plants, and it is a key device to ensure the safe and reliable operation of nuclear power plants.
In the running process of the multistage centrifugal pump, due to the change of operating conditions, it is necessary to start frequently, and the rapid increase of speed and flow during the start-up process will cause the pressure, velocity, radial force, and other parameters of the flow field to change strongly in a short time. At present, the research on the start-up process of the centrifugal pump generally uses the quasi-steady-state hypothesis method instead of the start-up transient process (Wu et al., 2009). However, due to the obvious transient effects of the start-up process, the numerical simulation is inaccurate. With the expansion of the centrifugal pump start-up process in various application fields and the increase of system complexity, it has been paid more and more attention by scholars in recent years.
Tsukamoto and Ohashi (1982) and Tsukamoto et al. (1995) considered that the pulse pressure and the hysteresis of the flow around the blade during the start-up process of the small low specific speed centrifugal pump were the main reasons for the dimensionless head curve to be lower than the quasi-steady head curve. And the fluctuation frequency of impeller speed was directly related to the transient effect of the head curve. Thanapandi and Prasad (1995) established a numerical model for a screw pump with different opening degrees by using the future analysis method. The transient dynamic characteristics of the pump were analyzed and verified by experiments. It was found that the dynamic characteristics of the pump deviated greatly from its steady-state characteristics. Xu et al. (2010), Li et al. (2010), and Li (2009) created a complete system model including circulating pipes and pumps. In the numerical simulation of rapid start-up process of centrifugal pumps, the sliding grid method was used to analyze the evolution process of unsteady flow in centrifugal pumps under transient conditions. Ping et al. (2007) established the basic equation describing the rapid start-up of centrifugal pumps. Taking a fast-start mixed-flow pump as an example, the transient effect of the flow field under the transient operation of fast start-up was theoretically analyzed and numerically calculated. It was found that the pump characteristics in the initial start-up stage were obviously different from those of the quasi-steady-state process. Wang et al. (2017) studied the transient characteristics of an ultra-low specific speed centrifugal pump under the start-up process of the closed-valve condition by compared the quasi-steady-state process. It was found that the magnitude of the start-up acceleration has an important influence on the transient impact head at the end of the closed-valve process. At the beginning of the start-up process, the static pressure distribution of them has the largest difference. With the rotational speed increases, the difference between them decreases gradually.
Up to now, scholars at home and abroad have a deep understanding of the transient characteristics of centrifugal pumps in the start-up process, but most of the research objects of the transient characteristics of the start-up process are limited to single-stage centrifugal pumps. Compared with single-stage centrifugal pump, the complex series structure of multistage centrifugal pump makes its internal flow more complex (Zhang et al., 2012; Liu et al., 2014; Wang et al., 2017), and because of the transfer of the flow states between stages, the transient internal flow characteristics will be more disordered during the start-up process.
CAP1400 is this new type of third-generation reactor. The performance of many equipment needs to be studied, especially the pumps that are very important to safety. The research focus and innovation of this paper is to reveal the transient characteristics of a new type of nuclear power pump through existing methods, together to provide a reference for the safety design of nuclear power plants. Therefore, based on the predecessors, this paper further studies the transient state of multistage centrifugal pumps by numerical simulation. Carrying out the research on the transient characteristics of the low specific speed multi-stage centrifugal pump during startup conditions is of great significance to the safety and reliability of nuclear power equipment and systems.
Theoretical Analysis of Start-Up Transient Process of Centrifugal Pump
Zhang (2013) according to the momentum moment theorem and the energy conservation principle, deduced the generalized Euler equation suitable for the start-up transient process of the centrifugal pumps, which is shown in Equation (1).
In Equation, Vu1 and Vu2 are the circumferential component of the absolute velocity of the liquid particle in the impeller at leading edge and trailing edge, u1 and u2 are the circumferential velocity of the liquid particle in the impeller at leading edge and trailing edge, ω is the instantaneous rotational angular velocity of the impeller, Q is the instantaneous volume flow, D is the nominal diameter of the impeller. For radial centrifugal impellers, D = D2. ΩJ and ΩM are two different blade influence coefficients, and the size is related to the impeller geometry parameters such as blade shape and blade thickness,
Where, .
According to Equation, the head of the centrifugal pump during the start-up transient process is mainly composed of two parts. One is the steady head of the centrifugal pump at the corresponding speed during the start-up process, as shown in the first item on the right side of the equation. Another is rotational acceleration and additional head of flow inertia during the start-up process, as shown in the second and third terms on the right side of the equation. The latter is the main reason for the transient effect in the start-up process of centrifugal pump.
Summary of Start-Up Process of Multistage Centrifugal Pump
The start-up process of centrifugal pump is a necessary process for the normal operation of pump system. This process usually refers to the stage in which the flow rate increases gradually from zero to the rated flow rate (Li, 2012). In order to prevent start-up power overload of multistage centrifugal pump, the start-up process usually includes two processes: closed-valve start and open-valve control. This paper uses full pressure start and the motor speed changes linearly. As shown in Figure 1, the closed-valve transition stages are divided into two sections, the first stage is impeller acceleration stage, the second stage is shut-off point operation stage. Under the condition of closing dead-point flow rate, the impeller speed increases rapidly from zero to rated speed, and then the multistage centrifugal pump operates at the critical dead-point condition of stable speed. When the start-up process of the closed-valve, full pressure start-up is preferred when the minimum torque and maximum flow rate are satisfied. The third and fourth stages are the open-valve transition stage. In the third stage, after the impeller reaches the rated speed, the valve is opened according to the predetermined law, and the flow rate gradually increases from zero to the rated flow rate. The fourth stage indicates stable operation stage. In the open-valve transition stage, because the boundary conditions change with time during the start-up process is not clear, this paper will use Flowmaster software and CFX software to simulate. Firstly, Flowmaster software is used to build the operation model of multistage centrifugal pump to obtain the parameters of the relevant boundary conditions, and then the boundary conditions are input into CFX. The transient numerical simulation of the start-up stage of the open-valve is carried out in the software.
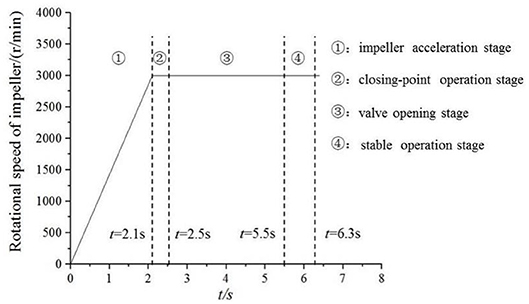
Figure 1. Different stages of the start-up process.
Computing Model and Mesh Generation
The main design parameters of the multistage centrifugal pump selected in this paper are as follows: flow rate Qd = 34.1 m3/h, head H = 1,800 m, speed n = 2,985 r/min, ns = 26.3. The main geometric parameters of the flow passage parts of the model pump are shown in Table 1.
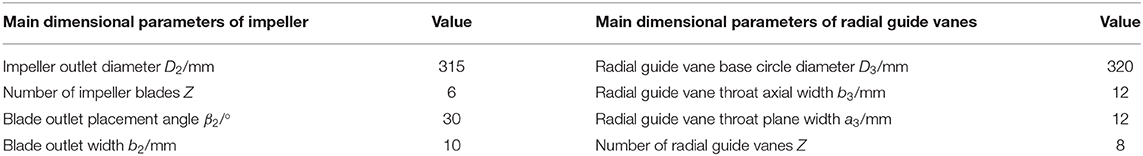
Table 1. Dimensional parameters of impeller and radial guide vane.
Commercial software Cero is used to build the three-dimensional model of the flow passage area of the multistage centrifugal pump, including the suction chamber, impellers at all levels, radial guide vanes, and pump casing. Compared with the other guide vanes at all levels, there is no anti-guide vane in the final guide vanes and the outlet of the last guide vanes directly contacts with the fluid field of the pump casing. The fluid field model of the multistage centrifugal pump is shown in Figure 2. Considering that the internal fluid flow state varies greatly during the start-up process, the impeller is divided into structured hexahedron mesh, which is shown in Figure 3.
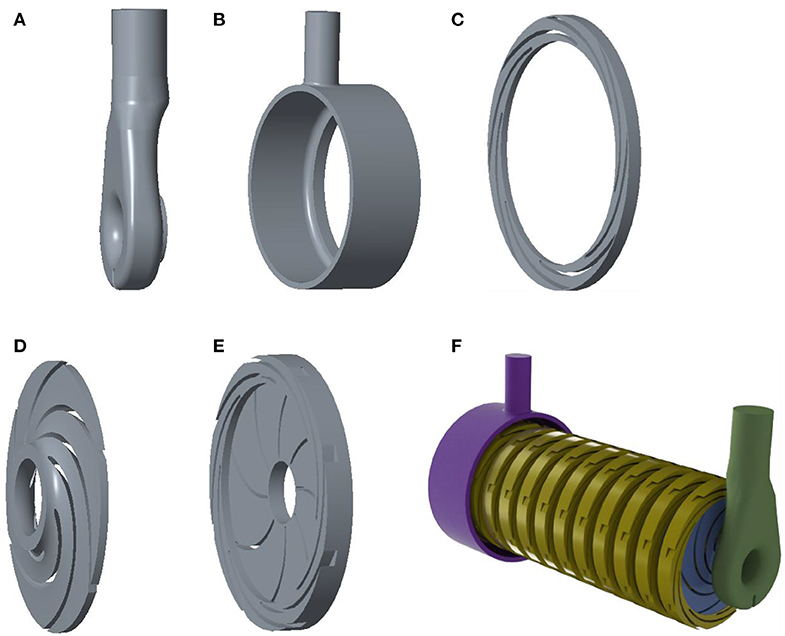
Figure 2. Fluid domain of multistage centrifugal pump. (A) Suction chamber, (B) pump casing, (C) final guide vane, (D) impeller, (F) radial guide vane, and (G) multistage centrifugal pump integral flow domain.
Figure 3. Meshing. (A) Grid independence verification and (B) structured grid of impeller.
Radial guide vane, suction chamber and pump casing adopt unstructured tetrahedral mesh with strong self-adaptability to realize complex structure mesh generation, which guarantees mesh quality above 3.0. At the beginning of the study, we conducted a grid-independent verification of a single-stage pump, as shown in Figure 3A. When the total number of grid cells is 1584810, the head change is <0.5%. Finally, the mesh number of suction chamber, pump casing, and impeller are 570325, 107906, and 326751, respectively. The number of radial guide vanes at the last stage is 144854, and the total number of grids is 13763729.
Turbulence Model and Boundary Condition Setting
This paper based on ANSYS CFX 18.1 to complete the start-up transient simulation numerical calculation. The Shear Stress Transport (SST) model is used in the turbulence model. The results of steady flow field with zero rotational speed and flow rate are taken as initial documents. The interface between impeller and radial guide vane is set to Frozen rotor mode with fixed rotor, the wall roughness is set to 0.125 mm, and the wall boundary condition is set to non-slip wall. The import boundary condition is set to the full pressure inlet, and the reference pressure is set to 1 atm. The outlet boundary condition is set to the mass flow outlet. The turbulence intensity is moderate [Medium (Intensity = 5%)]. When the closed-valve starts at the closing dead-point, the flow rate can be regarded as 0. But in fact, the internal flow of multistage centrifugal pump is still circulating under small flow rate, and the flow rate can be regarded as a constant value during the whole shut-off start-up process (Shao, 2016). The flow rate is about 1 5% of the design flow rate of the pump, and the mass flow rate is 0.01 kg/s in this chapter. When it is in the open-valve transition stage, the boundary condition of flow is the change value of flow parameters obtained by Flowmaster simulation.
In this paper, the total calculation time of closed-valve transition stage is set to 2.5 s, and the total time of open-valve transition stage is 3.8 s, and the time step is 0.002 s. In order to ensure absolute convergence within each time step, the maximum number of iterations within a time step is set to 50, and the residual value of convergence is set to 0.0001.
The rated speed is 2,985 r/min, the total calculating time is 2.5 s. Within 0 ≤ t ≤ 2.1 s, the rotational speed is uniformly accelerated to the rated speed of 2,985 r/min, and within 2.1 s ≤ t ≤ 2.5 s, the rotational speed is stable at 2,985 r/min.
The equation for calculating speed in expression function of closed-valve transition stage is shown in Equation (3).
The rotational speed nt remains constant during the open-valve transition stag, i.e., nt = −2,985 [revmin−1].
In Equation (3), Ttol = 2.1 [s], which means the start-up time is 2.1 s, among them function step () is the function of CFX itself, and its expression value is shown in Equation (4).
In Equation (4), x is dimensionless.
The equation for calculating head H in expression function is shown in Equation (5).
The equation for calculating power P written in the expression function is shown in Equation
Where:
torqu represents the all impellers torque consumed.
The calculation equation written in the expression function of efficiency η is as shown in Equation (9).
Analysis of Calculation Results of the Start-Up Process of the Closed-valve Transition
Contrastive Analysis of Pump Characteristics of the Start-Up Process of the Closed-Valve Transition
During the start-up process of the closed-valve transient, the speed increases linearly with the start-up time. In order to explore the relationship between the pump characteristics and the change of the speed during the start-up process of the multistage centrifugal pump. In this paper, the rotation period f of the custom function rotor is used to describe the variation law of the pump characteristics during the start-up process of the closed-valve transition. The rotor rotation period f represents the time taken for each revolution of the impeller. The calculation equation is shown in Equation (10).
Figure 4 shows the variation of characteristics of multistage centrifugal pump with start-up time in the process of the closed-valve transition. In order to make the change law of f function clear, the interval of ordinate values in the t-f function in Figure 4 is interpolated by natural logarithm.
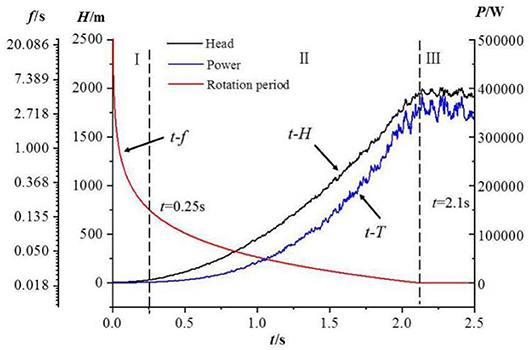
Figure 4. Pump characteristic change during the start-up process of the closed-valve transitional.
As can be seen from Figure 4, when the initial stage of the I-stage closed-valve is 0 ≤ t ≤ 0.25 s, the rotor rotation period is rapidly reduced from 25.2 to 0.169 s, and the head and power are almost unchanged. In this time range, the multistage centrifugal pump has just started, and the fluid is in a static state before starting. Although the impeller starts to rotate to work on the flow, the fluid still maintains its original state characteristics under the action of fluid inertia force. In the II-stage, when the start-up process develops to 0.25 ≤ t ≤ 2.1 s at the end of start-up, the rotor rotation cycle decreases slowly until it tends to decrease linearly, while the head and power increase slowly at the beginning of the closed-valve. With the increase of start-up time, the rotor rotation cycle increases gradually until it tends to increase linearly (Zhang et al., 2019a). Obviously, the change of head and power is closely related to the change of rotor rotation period. Within this time range, with the development of the start-up process of the closed-valve transition, the rotating speed increases, the working force of the fluid increases, the rotating centrifugal force of the fluid increases, the ability to overcome the inertia force of the fluid increases, and the head and power begin to increase linearly. At the 2.1 ≤ t ≤ 2.5 s end of the start-up process of the closed-valve transition, the rotating period of the rotor remains unchanged at 0.0201 s. At the end of the start-up process, the fluid still maintains the state of rotational acceleration, and the head and power will continue to increase in a short time. With the increase of time, the head and power gradually show periodic fluctuations. During the whole start-up process of the closed-valve transition, the fluid has obvious transient flow characteristics.
In order to explore the transient effect of multistage centrifugal pump in the start-up process of the closed-valve transition, the flow field under the steady state of the same speed at the corresponding time is simulated and calculated, and compared with the transient calculation results of the start-up process of the closed-valve transition. Five rotational speeds, 600, 1,200, 1,800, 2,400, and 2,985 r/min are taken here. The corresponding start-up process of the closed-valve transition is 0.42, 0.84, 1.27, 1.69, and 2.1 s, respectively. Figure 5 is a comparison diagram of the pump characteristics between the start-up process of the closed-valve transition and the steady state of the same speed.
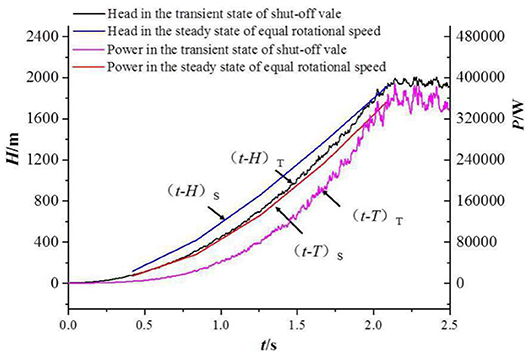
Figure 5. Comparison of the pump characteristics between the start-up process of the closed-valve transition and the steady state of the same speed. Subscript S indicates steady state and subscript T represents transient state.
Figure 5 shows that the head and power curves of steady state at the same speed basically coincide with the change trend of head and power curves of the start-up process of the closed-valve transition. It can be shows that the numerical simulation results of the start-up process of the closed-valve transition in this chapter are correct. Within the starting transition time of 0 ≤ t ≤ 2.1 s, the corresponding values of power and head in steady state are higher than those in transient state. At the end of the start-up process, the power and head states are basically the same, indicating that the fluid state during the closed-valve process has a certain hysteresis compared to the fluid state at the steady speed. In the start-up process of the closed-valve transition, on the one hand, the acceleration of liquid rotation and water flow leads to the instability of flow state. On the other hand, the flow field is extremely uneven due to the inertia of liquid flow in the start-up process of the closed-valve transition, which all aggravates the hydraulic loss in the passage. As a result, the head and power in the start-up process of the closed-valve transient state are lower than in the steady-state steady state.
Contrastive Analysis of Internal Flow Field During the Start-Up Process of the Closed-Valve Transition
This section compares and analyzes the differences in the distribution of the velocity field and pressure field during the closed-valve transitional start-up process by combining the flow at the same speed and steady state at the corresponding moment. The effects of transient effects on internal flow distribution are analyzed. It is used to explore the influence of transient effect on internal flow distribution during the start-up process of the closed-valve transition (Zhang et al., 2019b). Among them, Figures 6–8 are the velocity distribution diagrams of the first stage impeller during the start-up process of the closed-valve transition and the constant speed steady state of n = 600, 1,800, and 2,985 r/min. Figures 9–11 are the static pressure distribution diagrams of the first stage impeller during the start-up process of the closed-valve transition and the constant speed steady state of n = 600, 1,800, and 2,985 r/min.
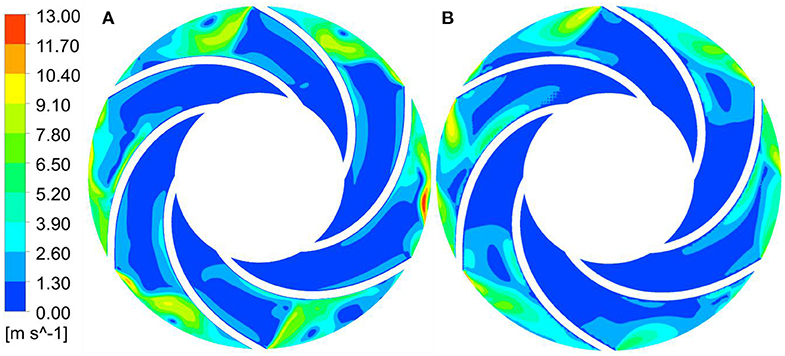
Figure 6. Velocity distribution of the first stage impeller with n = 600 r/min. (A) Start-up transient of closed-valve and (B) steady state at the same speed.
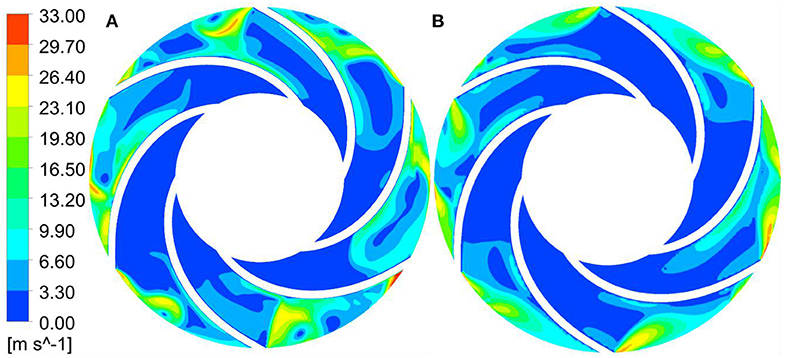
Figure 7. Velocity distribution of the first stage impeller with n = 1,800 r/min. (A) Start-up transient of closed-valve, (B) steady state at the same speed.
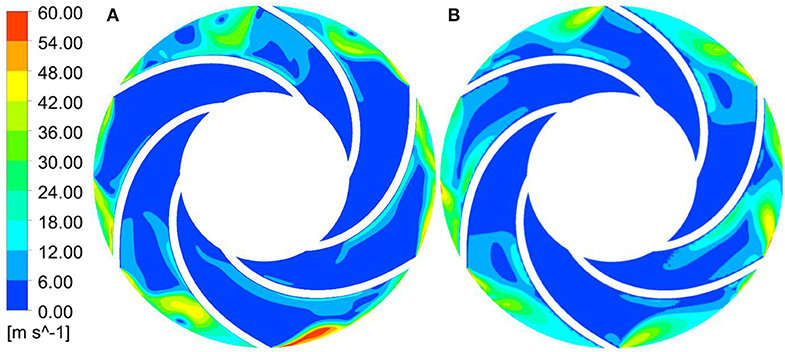
Figure 8. Velocity distribution of the first stage impeller with n = 2985 r/min. (A) Start-up transient of closed-valve and (B) steady state at the same speed.
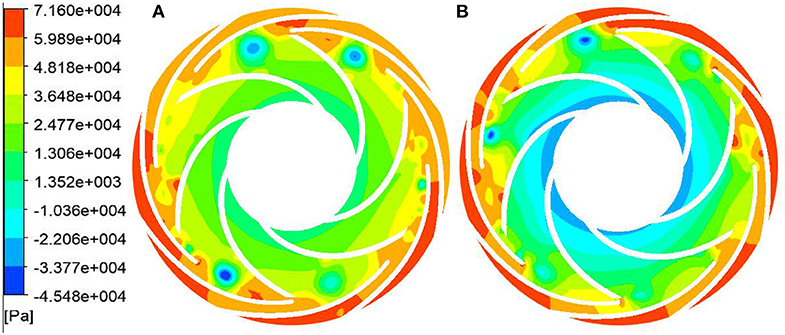
Figure 9. Static pressure distribution of the first stage impeller with n = 600 r/min. (A) Start-up transient of closed-valve and (B) steady state at the same speed.
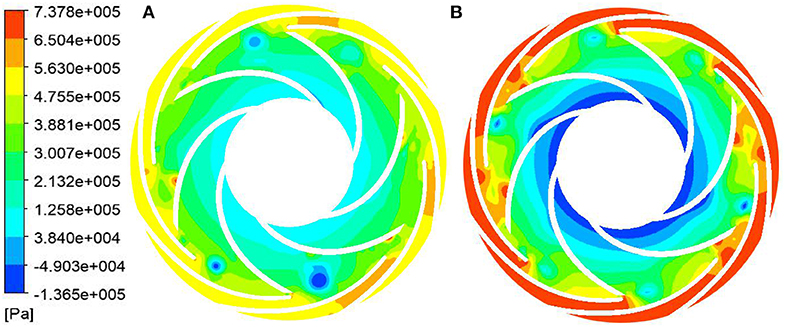
Figure 10. Static pressure distribution of the first stage impeller with n = 1,800 r/min. (A) Start-up transient of closed-valve and (B) steady state at the same speed.
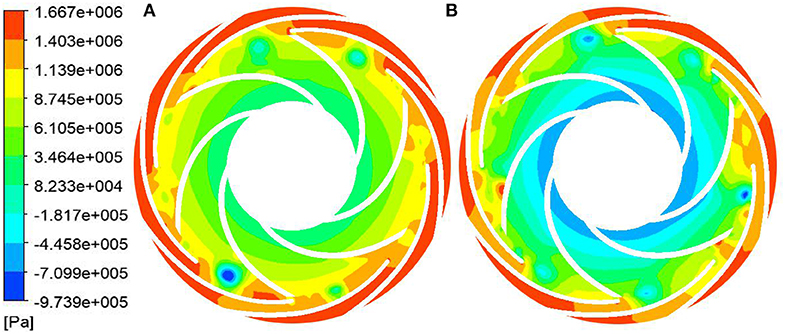
Figure 11. Static pressure distribution of the first stage impeller with n = 2,985 r/min. (A) Start-up transient of closed-valve and (B) steady state at the same speed.
Comparing the static pressure distribution and speed distribution in the two states, it can be seen that with the increase of the impeller speed, the inlet speed of the first stage impeller gradually increases, and the static pressure in the flow channel also gradually increases. This is because with the increase of time, the speed of the impeller continuously increases, and the functional force for liquids also increases. The total mechanical energy converted into liquid also increases, that is, the dynamic pressure head and the static pressure head are increasing. However, compared with the stable speed starting process at the corresponding moment, the internal speed of the impeller during the transient variable speed starting process is relatively large, and the static pressure of the static pressure in the flow channel is relatively small. This shows that under the condition that the impeller does the same work, the mechanical energy is converted into kinetic energy and the pressure energy is less during the transient variable speed startup process. This is a typical manifestation of transient effects in the transient operation of closed-valve transient starting. This is also consistent with the phenomenon that the transient flow head curve is lower than the flow head curve under the same speed and steady state at the corresponding moment.
During the start-up process of the closed-valve transition, there are a lot of zero velocity regions from the impeller inlet to the middle passage area. The velocity regions with magnitude are mainly accumulated near the back outlet area of the blade, while the distribution at the outlet area of the blade working face is relatively small. The maximum velocity region mainly exists in the middle passage near the impeller outlet. A small amount of liquid is distributed at the outlet of the blade back under the centrifugal force of the impeller. In the start-up process of the closed-valve transition, the zero-speed zone is the dead water zone, which means that there is no flow through the region. If a long time to maintain this state, it will consume a large number of impeller work energy, and make the pump body and fluid in the process of starting heat (Li et al., 2019). Compared with the transient variable speed start-up process of the closed-valve transition, the velocity gradient in the impeller passage during the steady speed start-up process at the corresponding moment is more uniform. And there is no zero velocity zone at the impeller outlet, while there is a scattered zero velocity zone at the impeller outlet during the transient variable speed start-up process. In the static pressure cloud diagram of the start-up process of the closed-valve transition, the static pressure distribution at different moments is similar. And the four main low-pressure vortex zones are at the impeller exit and exhibit a central symmetric distribution. Compared with the stable speed start-up process at corresponding time, the area of low-pressure vortices is larger, the central pressure is lower, the pressure gradient is larger and the number is larger. It shows that the internal flow condition of the start-up process of the closed-valve transient is more turbulent and more complicated than the steady-state steady state at the corresponding moment.
Calculation Setting and Result Analysis of the Start-Up Process of the Open-Valve Transition
Setting Up of Simulating and Calculating Settings for the Start-Up Process of the Open-Valve Transition
The start-up process of the open-valve transition studied is the next stage of the start-up process of the closed-valve transition. During the start-up process of the open-valve transition, the flow rate increases rapidly from zero to the rated flow rate while the impeller maintains the rated speed. Because it is difficult to simulate the transient process of multistage centrifugal pump of the start-up process of the open-valve transition in the laboratory, and the boundary conditions of numerical simulation calculation of the start-up process of the open-valve transition cannot be obtained, Flowmaster and CFX software will be used to simulate the start-up process of the open-valve transitions of multistage centrifugal pump. Firstly, Flowmaster software is used to build the operation model of multistage centrifugal pump, and the outlet flow rate and inlet pressure can be obtained. Secondly, the boundary condition is input through the UDF function in CFX, which can simulate the internal flow condition of multistage centrifugal pump during the open-valve transition. The simulation process steps are: (1) collecting and sorting out component parameters; (2) importing parameters and testing the operation status of components; (3) using Flowmaster for modeling and simulation; (4) importing the boundary condition parameters into CFD simulation software for numerical calculation.
In this paper, Flowmaster software is used to build centrifugal pump operation model. The operation model of centrifugal pump is shown in Figure 12. The operation model is mainly composed of circulating pipeline, elbow, centrifugal pump, torque controller, ball valve and water tank. In order to make the simulation process close to the actual situation, the setting parameters of the centrifugal pump come from the actual test measurement of the centrifugal pump. According to the start-up test report of the multistage centrifugal pump, this chapter determines that the time required for the flow rate to change from zero to rated flow rate in the start-up stage of the valve is 3 s, and the total calculation time for the numerical simulation of the whole start-up process of the open-valve transition is 3.8 s.
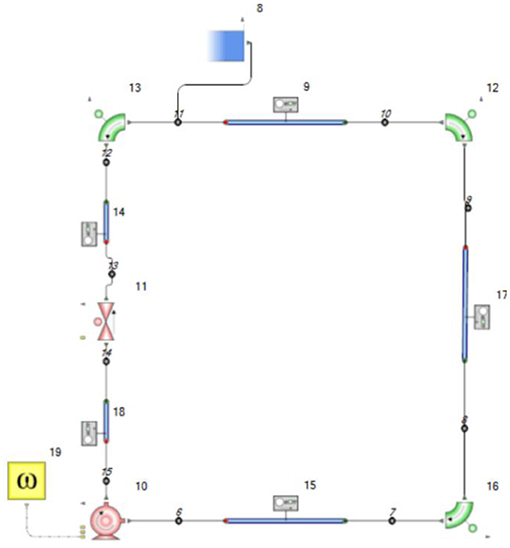
Figure 12. Operation model of multistage centrifugal pump. 8: water tank; 10: centrifugal pump; 11: ball valve; 15, 17, 9, 14, 18: pipeline; 12, 13, 16: elbow; 19: torque controller; others: monitoring nodes.
Contrastive Analysis of Pump Characteristics of the Start-Up Process of the Open-Valve Transition
The flow rate of multistage centrifugal pump varies with the start-up time during the start-up process of the open-valve transition. The change trend of pump characteristics with time under the transient start-up state is shown in Figures 13. Figure 14 shows the head changes of different series in the transient state of the start-up process of the open-valve transition. The single-stage head is obtained by calculating the pressure difference corresponding to the inlet of the impeller and the outlet of the guide vane. Due to the excessive number of stages, only the typical levels 1, 2, 3, 7, 8, and 13 are selected for analysis.
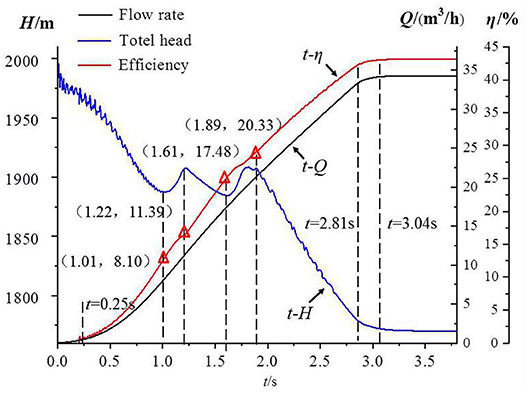
Figure 13. Pump characteristic change of start-up transient state in open-valve stage.
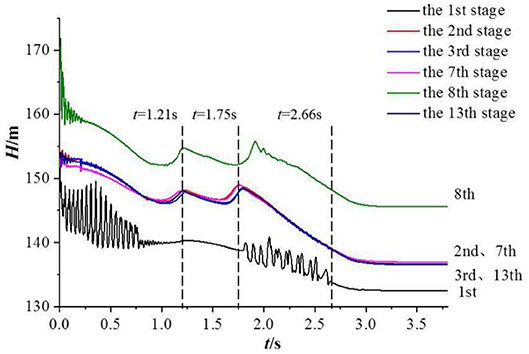
Figure 14. Head change of different stages in transient start-up state during open-valve stage.
As can be seen from Figure 13, in the start-up process of the open-valve transition, the flow rate and efficiency changes with the start-up time is similar. In the initial stage of start-up, 0 ≤ t ≤ 0.25 s and the final stage of start-up 2.75 s ≤ t ≤ 3.04 s, the flow rate and efficiency increase smoothly. While in the start-up stage, the flow rate and efficiency increase linearly, and at the beginning of the start-up, the head decreases with the start-up time. When t = 1.01 s, the head begins to rise. At t = 1.22 s, the first local maximum value appears, and then the head decreases again. At t = 1.61 s, the local minimum value appears, and then the head starts to rise again. Near t = 1.89 s, the second local maximum value appears, and the two maximum values are almost equal. Then, as the start-up time increases, the head continues to drop.
As can be seen from Figure 14, the difference between the first stage and the other stage is larger than that of other stages. Especially in the two periods of t ≤ 1 s and 1.75 s ≤ t ≤ 2.66 s, the fluctuation is intense, and there are fluctuations in different degrees at the beginning of the start-up of other stages. The boundary condition at the inlet is total pressure in the transient numerical simulation of the start-up process of the open-valve transition. This is not fully in line with the actual situation of the start-up process of the open-valve transition, which leads to drastic changes in the static pressure of the inlet, and the difference between the first head and other stages is significant. Except for the first stage, the change trend of the other single-stage head is the same as that of the total head, and there are different degrees of double humps. The time of the first hump appearing in the flow head curve at all levels is about t = 1.21 s, but the time of the second hump appearing is different. The second hump time at the 8th level head curve is the latest, and the 8th level single stage head is also the highest.
In order to further analyze the influence of the transient effect on the pump characteristics of the open-state transient state, especially the effect on flow head hump. The pump characteristics under steady state and transient start-up state under the same flow rate are compared. The flow rate here is 6.84, 8.10, 9.75, 11.39, 14.44, 17.48, 18.91, 20.33, 27.20, and 34.20 m3/h, the corresponding start-up transition time is 0.93, 1.01, 1.11, 1.22, 1.41, 1.61, 1.71, 1.89, 2.35, and 3.10 s. Figure 15 is a comparison of the pump characteristics of the start-up process of the open-valve transition and the steady state of the same flow rate. In the graph, subscript S denotes steady state, subscript T denotes transient state.
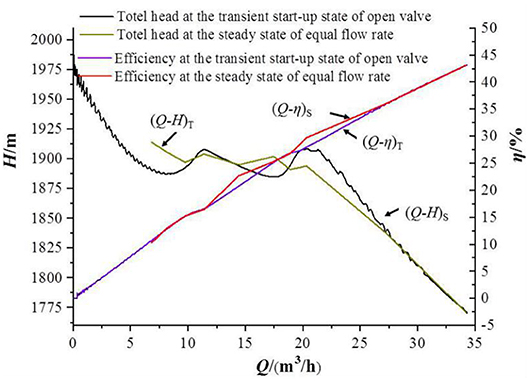
Figure 15. Comparison of outer characteristics of start-up transient state and steady state of equal flow rate in open-valve stage.
As can be seen from Figure 15 that in the steady state of the same flow rate and the start-up process of the open-valve transition, when the open-valve transition starts in the middle and late development period 27.20 m3/h ≤ Q ≤ 34.20 m3/h, the flow efficiency curve and the flow head curve are basically the same. When Q ≤ 20.33 m3/h, there are three hump peaks in the flow head curve under the same flow steady state, and the hump fluctuation amplitude is smaller than the hump fluctuation amplitude of the flow head curve under the start-up process of the open-valve transition.
Comparative Analysis of Streamlines Between Blades
In order to explore the influence of transient effect of the start-up process of the open-valve transition on hump, this paper chooses four flow points: maximum and minimum position of hump Q = 8.10 m3/h, Q = 11.39 m3/h, Q = 17.48 m3/h, Q = 20.33 m3/h. The streamline distribution between the blades of the second stage impeller at different flow points in the same steady flow state and the transient effect of the start-up process of the open-valve transition is compared and analyzed. Figure 15 shows the streamline distribution between blades with different flow rates in the start-up process of the open-valve transition. Figure 16 shows the streamline distribution between blades with different flow rates under the steady state of the same flow rate.
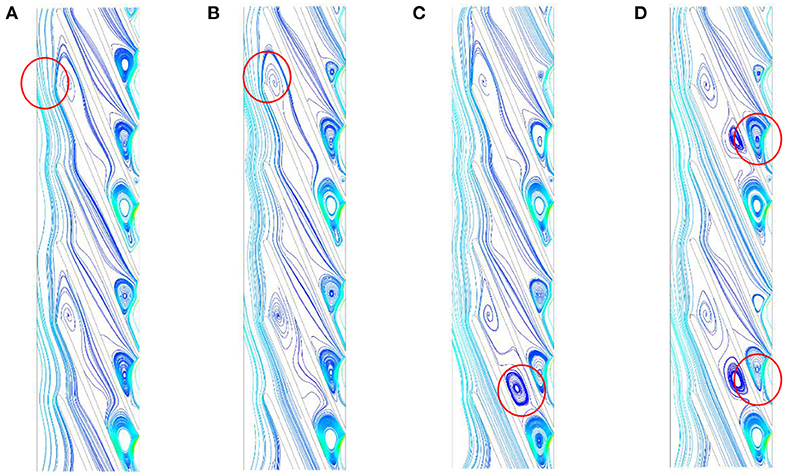
Figure 16. Streamline distribution among blades with different flow rates in the start-up process of the open-valve transient. (A) Q = 8.01 m3/h, (B) Q = 11.39 m3/h, (C) Q = 17.48 m3/h, and (D) Q = 20.33 m3/h.
Compared with Figures 16, 17, the flow disorder in the impeller passage and stall groups of varying degrees are the main reasons for the hump of the flow head curve, whether in the start-up process of the open-valve transition or in the steady state of the same flow condition. However, the range of stall groups is larger and the number of stall groups is larger in the start-up process of the open-valve transition. For example, stall groups exists not only at the inlet and outlet of impeller, but also in the middle passage at the flow rate of Q = 17.48 m3/h and Q = 20.33 m3/h. In the start-up process of the open-valve transition, the flow inertia of liquid will make the flow rate change out of step with the head change. And the increase of flow velocity will aggravate the rotational stall of impeller internal flow. Therefore, the hump fluctuation amplitude in the start-up process of the open-valve transition is higher than that in the steady state of the same flow rate.
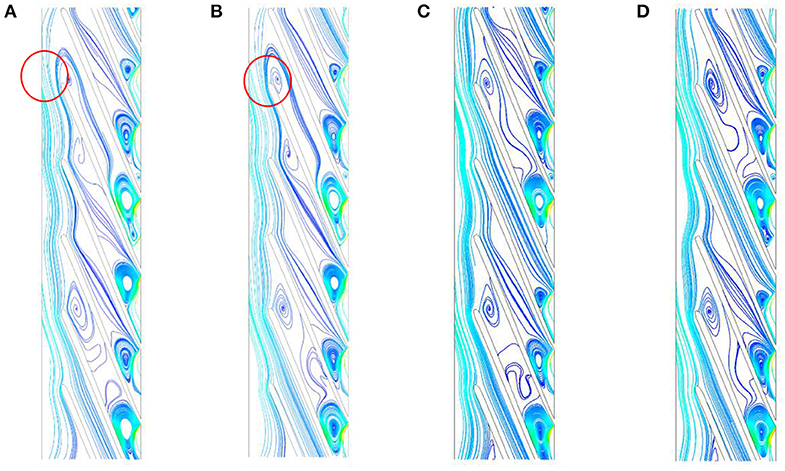
Figure 17. Streamline distribution among blades with different flow rates under steady state of equal flow rate. (A) Q = 8.01 m3/h, (B) Q = 11.39 m3/h, (C) Q = 17.48 m3/h, and (D) Q = 20.33 m3/h.
Analysis of Internal Flow Field in the Start-Up Process of the Open-Valve Transition
In this paper, the secondary (stage 2) impeller is used to analyze the internal flow field changes during the start-up process of the open-valve transition. The static pressure distribution of the impeller of stage 2 under the start-up process of the open-valve transition is shown in Figure 18.
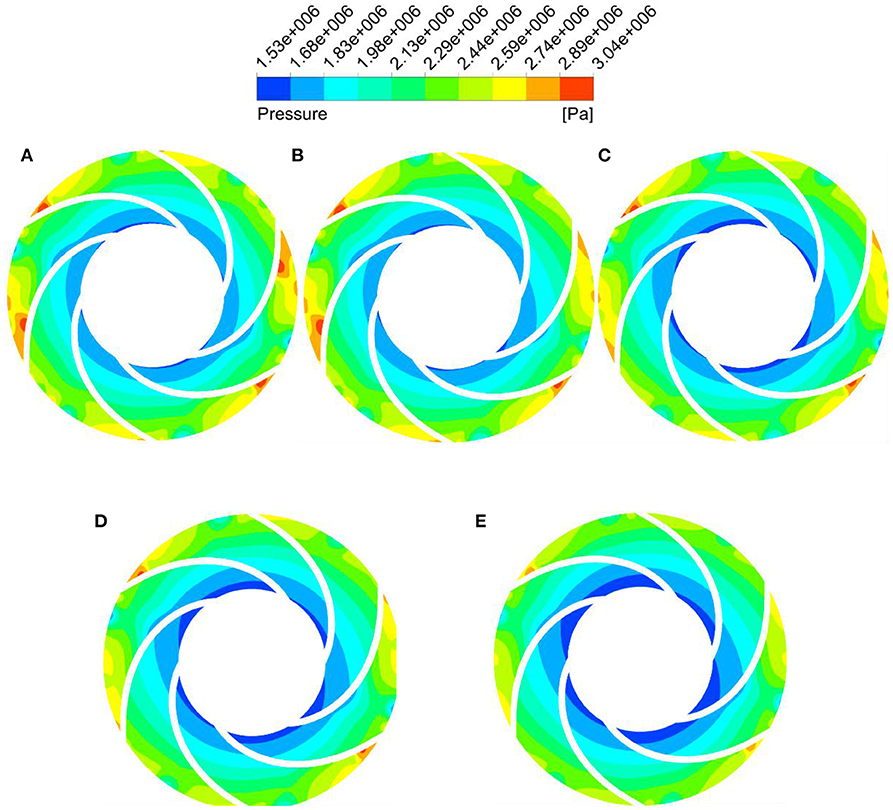
Figure 18. Static state distribution of the second stage impeller in the start-up process of the open-valve transition. (A) t = 0.93 s, (B) t = 1.36 s, (C) t = 1.83 s, (D) t = 2.35 s, and (F) t = 3.10 s.
As can be seen from Figure 18, under the start-up process of the open-valve transition, the average static pressure in the secondary impeller decreases with the increase of start-up time, increasing gradually along the radial direction from the impeller inlet, and the gradient of change becomes more uniform. This is because the impeller does have a certain functional force when the rotational speed is kept constant. With the increase of flow rate, the flow velocity in the impeller passage will also increase. According to the Bernoulli energy conservation equation, the dynamic pressure increases and the static pressure gradually decreases. However, with the liquid flows in the radial direction, the cross-section area of the channel increases gradually, and the static pressure value increases gradually. In the initial stage of the start-up process of the open-valve transition, there are many high-pressure vortices on the back of secondary impeller blade outlet. With the increase of start-up time, the number and scope of high-pressure vortices are gradually decreasing, which indicates that the internal flow tends to be stable with the development of start-up process. This is more evident from the turbulent kinetic energy distribution in the secondary impeller.
Turbulence kinetic energy is a measure of turbulence intensity. Its size and spatial distribution can reflect the scope and magnitude of fluctuating diffusion and viscous dissipation loss in the channel to a certain extent. And it is also an intuitive expression of the stability of internal flow. In this paper, the turbulent kinetic energy during the start-up process of the open-valve transition is analyzed, and the influence of transient flow rate on the stability of the internal flow field is studied. Figure 19 shows the turbulent kinetic energy distribution of the secondary impeller during the start-up process of the open-valve transition.
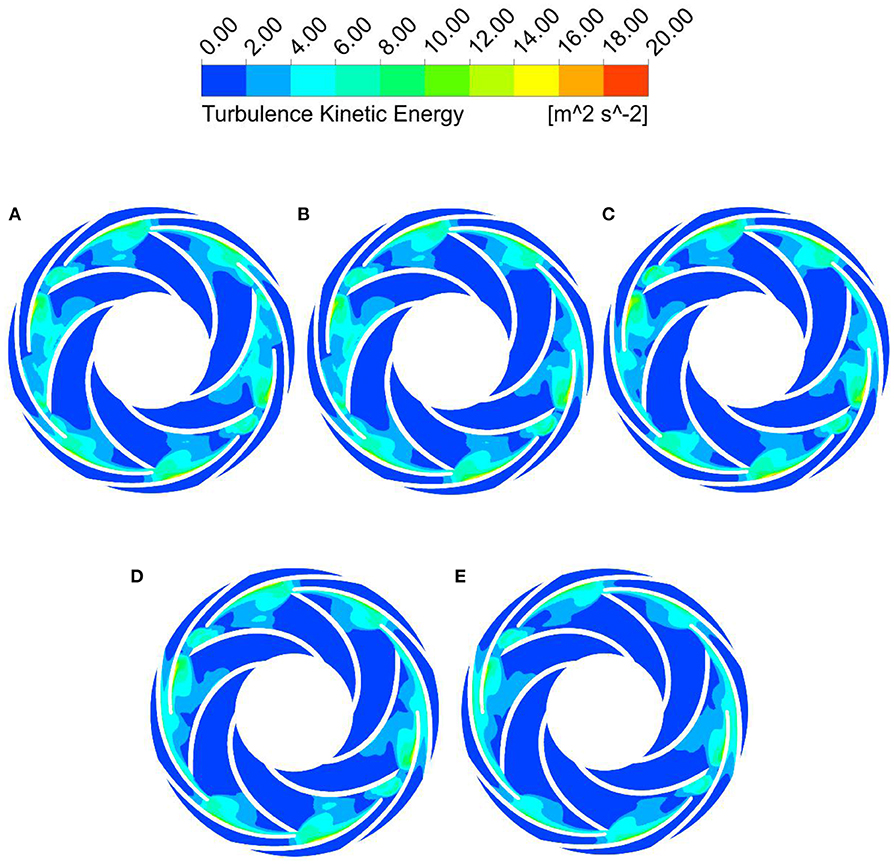
Figure 19. Turbulent energy distribution of the second stage impeller in the start-up process of the open-valve transition. (A) t = 0.93 s, (B) t = 1.36 s, (C) t = 1.83 s, (D) t = 2.35 s, and (E) t = 3.10 s.
It can be seen from Figure 19 that there is a certain similarity between the magnitude and distribution of the turbulent kinetic energy of the secondary impeller in the start-up process of the open-valve transition. The turbulent energy is the largest at the exit of each flow channel near the impeller, and there is a large pulsation diffusion and viscous dissipation loss, which is symmetrically distributed in the center. As shown in (a), the turbulent energy distribution is shown in the red circle, and a similar turbulent energy distribution appears again after three flow paths. The number of the impeller blades is 6, and the number of radial vane blades is 8, which are not mutually prime. The radial vanes and impellers have periodic dynamic and static interference. The internal flow field at each outlet of the impeller changes drastically, so the turbulent energy is the largest, and the distribution presents a central symmetric distribution. In the early start 0 ≤ t ≤ 1.83 s turbulent kinetic energy distribution is small change. In the middle and late stages of start-up 1.83 s ≤ t ≤ 3.1 s, the distribution range of turbulent kinetic energy gradually decreases with the development of the start-up process of the open-valve transition. The kinetic energy value is also gradually decreasing, indicating that its internal flow gradually begins to stabilize.
Discussions
The two transient processes of the closed-valve transition and the open-valve transition are numerically simulated, and the pump characteristics and the evolution characteristics of the internal flow field are analyzed. During the start-up process of the closed-valve transition, the head, and power curves of the same steady-state are slightly higher than the head and power curves of the start-up process of the closed-valve transition, but the trends in the two states are basically consistent. At the end of the start-up process of the closed-valve transition, the power and head are basically the same in both states, but the transient head will still increase in a short time under the influence of fluid inertia. When the impeller does the same work energy, compared with the steady state of the same speed, in the transient internal flow field of the closed-valve transient start process, the mechanical energy is converted into kinetic energy and the pressure energy is less. The mechanical energy in the internal flow field is converted into more kinetic energy and less pressure energy. This is a typical manifestation of transient effects during the closed-valve transitional start-up process.
Compared with the steady flow state of the same flow rate, in the initial stage of the open-valve transition process, the range of stall groups in the impeller flow channel is larger during the transient process, the number of stall groups is more, During the start-up process of the open-valve transient, there is a certain similarity between the size and distribution of turbulent energy in the flow field inside the impeller. With the development of the open-valve process, the flow rate gradually increases, internal flows have gradually stabilized.
Conclusions
In this paper, the start-up process of low specific speed multistage centrifugal pump is divided into two stages: variable speed closed-valve transition and variable flow open-valve transition. The difference of flow characteristics between the variable speed closed-valve transient start-up processes and the steady state of the same speed at the corresponding moment, and difference of flow characteristics between variable flow open-valve transient start-up processes and the steady state of the same flow rate at the corresponding moment are analyzed. The main conclusions are as follows.
1. According to the theoretical analysis, the centrifugal pump impeller has transient effects caused by two kinds of additional heads, a rotational acceleration head and a flow inertia head during the pump-start transient operation.
2. During the start-up process of the closed-valve transition, the variation trend of the pump characteristic with time is highly correlated with the variation trend of the rotor rotation period f with time. During the development period of the start-up process of the closed-valve transition, the head and power curves of the same steady state are slightly higher than the head and power curves of the start-up process of the closed-valve transition. But the variation trend in the two states are basically consistent, and the start-up process of the closed-valve transition is instantaneous. And the state of fluid flow during the start-up process has a certain hysteresis. At the end of the start-up process of the closed-valve transition, the power and head are basically the same in both states, but the transient head will still increase in a short time under the influence of flow inertia, and there is an impact head.
3. It is found that when the impeller does the same work, compared with the steady state at the same speed, the mechanical energy in the internal flow field is converted into more kinetic energy and less pressure, which is a typical performance of the transient effect during the start-up process of the closed-valve transition.
4. Compared with the steady state of the same flow rate, in the initial stage of the start-up process of the open-valve transition, the range of stall group in the impeller flow channel is larger. During the transient process, the number of stall groups is more, which exacerbates the rotational stall of the internal flow of the impeller and the flow is more disordered. This results in a hump fluctuation amplitude is greater than it in the steady state of the same flow rate. During the middle and later process of the open-valve transition, the changes of the flow efficiency curve and the flow head curve are basically consistent. There is a maximum value of the radial force in the time range of the hump in the initial stage of the start-up stage.
5. During the start-up process of the open-valve transient, there is a certain similarity between the size and distribution of turbulent energy in the flow field inside the impeller. The turbulent energy has a central symmetric distribution in each flow channel, and the turbulent energy is the largest near the impeller exit, and there is a large pulsation diffusion and viscous dissipation loss. With the development of the open-valve process, the flow rate gradually increases, the distribution range of turbulent energy is gradually reduced and the internal flow tends to become stable.
Data Availability Statement
The raw data supporting the conclusions of this article will be made available by the authors, without undue reservation, to any qualified researcher.
Author Contributions
LY: investigation, visualization, conceptualization, methodology, and software. LB: writing—reviewing and editing. FJ: data curation and writing—original draft preparation. ZR: supervision, methodology, and investigation. FQ: software and validation.
Funding
This work was funded by the China Postdoctoral Science Foundation Funded Project (Grant No. 2019M651734), National Youth Natural Science Foundation of China (Grant No. 51906085), Jiangsu Province Innovation and Entrepreneurship Doctor Project (2019), Zhejiang Postdoctoral Project (2019). This work was also supported by Key R&D programs of Jiangsu Province of China (BE2018112) and National Key R&D Program of China (2018YFB0606105).
Conflict of Interest
The authors declare that the research was conducted in the absence of any commercial or financial relationships that could be construed as a potential conflict of interest.
References
Li, D., Qin, Y., Zuo, Z., Wang, H., Liu, S., and Wei, X. (2019). Numerical simulation on pump transient characteristic in a model pump turbine. J. Fluids Eng. Trans. ASME 141:111101. doi: 10.1115/1.4043496
Li, W. (2012). Experimental Study and Numerical Simulation on Transient Characteristics of Mixed-Flow Pump during Starting Period. Zhenjiang: Jiangsu University.
Li, Z. (2009). Numerical Simulation and Experimental Study on the Transient Flow in Centrifugal Pump during Starting Period. Hangzhou: Zhejiang University. doi: 10.1115/1.4002056
Li, Z., Wu, D., Wang, L., Dai, W., and Chen, F. (2010). Experiment on instantaneous characteristics in centrifugal pump during startup period. J. Drain. Irrig. Machin. Eng. 28, 389–393.
Liu, H., Zhou, X., Wang, K., and Mao, L. (2014). Analysis on pressure fluctuation of radial diffusers in a multistage centrifugal pump. J. Central South Univ. 45, 3295–3300.
Ping, S., Wu, D., and Wang, L. (2007). Transient effect analysis of centrifugal pump during rapid starting period. J. Zhejiang Univ. 814–817.
Shao, C. (2016). Research on Characteristics of Super-Low Specific Speed Centrifugal Pumps during Transient Period. Zhenjiang: Jiangsu University.
Thanapandi, P., and Prasad, R. (1995). Centrifugal pump transient characteristics and analysis using the method of characteristics. Int. J. Mechan. Sci. 37, 77–89. doi: 10.1016/0020-7403(95)93054-A
Tsukamoto, H., and Ohashi, H. (1982). Transient characteristics of a centrifugal pump during starting stage. ASME J. Fluids Eng. 104, 6–13. doi: 10.1115/1.3240859
Tsukamoto, H., Yoneda, H., and Sagara, K. (1995). The response of a centrifugal pump to fluctuating rotational speed. ASME J. Fluids Eng. 117, 479–484. doi: 10.1115/1.2817287
Wang, Y., Chen, J., Liu, H., Shao, C., and Zhang, X. (2017). Transient characteristics analysis of ultra-low specific-speed centrifugal pumps during start-up period under shut-off condition. Trans. Chin. Soc. Agric. Eng. 33, 76–82. doi: 10.11975/j.issn.1002-6819.2017.11.009
Wu, D., Xu, B., Li, Z., and Wang, L.-Q. (2009). Numerical simulation on internal flow of centrifugal pump during transient operation. J. Eng. Thermophys. 30, 781–783.
Xu, B., Li, Z., Wu, D., et al. (2010). Numerical simulation on transient turbulent flow in centrifugal pump during starting period. Chin. Sci. Technol. 5, 683–687.
Zhang, D., Pei, Y., Wang, J., et al. (2012). Numerical simulation of the impeller-guide vane interaction flow field in multistage centrifugal pump. Petrol. Mach. 93–97.
Zhang, N., Liu, X., Gao, B., Wang, X., and Xia, B. (2019b). Effects of modifying the blade trailing edge profile on unsteady pressure pulsations and flow structures in a centrifugal pump. Int. J. Heat Fluid Flow 75, 227–238. doi: 10.1016/j.ijheatfluidflow.2019.01.009
Zhang, N., Liu, X., Gao, B., and Xia, B. (2019a). DDES analysis of the unsteady wake flow and its evolution of a centrifugal pump. Renew. Energy 141, 570–582. doi: 10.1016/j.renene.2019.04.023
Keywords: multistage centrifugal pump, start-up process, numerical simulation, internal flow, transient characteristics
Citation: Yun L, Bin L, Jie F, Rongsheng Z and Qiang F (2020) Research on the Transient Hydraulic Characteristics of Multistage Centrifugal Pump During Start-Up Process. Front. Energy Res. 8:76. doi: 10.3389/fenrg.2020.00076
Received: 10 February 2020; Accepted: 14 April 2020;
Published: 19 May 2020.
Edited by:
Yixiang Liao, Helmholtz-Zentrum Dresden-Rossendorf (HZ), GermanyReviewed by:
Jian Zhang, Harbin Institute of Technology, ChinaYu-Liang Zhang, Quzhou University, China
Copyright © 2020 Yun, Bin, Jie, Rongsheng and Qiang. This is an open-access article distributed under the terms of the Creative Commons Attribution License (CC BY). The use, distribution or reproduction in other forums is permitted, provided the original author(s) and the copyright owner(s) are credited and that the original publication in this journal is cited, in accordance with accepted academic practice. No use, distribution or reproduction is permitted which does not comply with these terms.
*Correspondence: Zhu Rongsheng, enJzQHVqcy5lZHUuY24=