 Tingting Ren
 Zhiqiang Zhu2
 Rui Zhang
- 1Fundamental Science on Nuclear Safety and Simulation Technology Laboratory, Harbin Engineering University, Harbin, China
- 2Wuhan Second Ship Design and Research Institute, Wuhan, China
Visualization experiments were carried out and sliding bubble coalescence behaviors were observed for subcooled flow boiling in a narrow rectangular channel. The results show that the consecutive coalescence process is composed of four steps based on the bubble morphological change: approaching, merging, adjustment, and stabilization, in which the more important are the merging and adjustment of the bubble. Bubble always slides along the heating surface and does not lift off in coalescence process. Bubble diameter and sliding velocity increase first, then decrease and finally stabilize. Bubble shape also oscillates from an irregular ellipse to a stable circle. In addition, a new small bubble may be induced in the coalescence process.
Introduction
The narrow rectangular channel has been widely used in engineering because of its characteristics of heat transfer enchantment and its ability to meet the requirements of small volume but high power. Bubble dynamics is the basis of boiling heat transfer research. Present research on the bubble behavior in narrow channels mainly focus on the behavior characteristics of individual bubbles, such as bubble nucleation, departure, growth and condensation. Ren et al. (2019, 2020) studied the effects of thermal parameters on the bubble nucleation, departure, growth, and sliding velocity in the previous work. Xu et al. (2013) has found in a visualization experiment that typical bubble sliding behavior exists in the narrow rectangular channel at low heat flux conditions. Li et al. (2013) also has found that most bubbles in the narrow channel slip along the heating wall instead of lifting off as in the conventional large channel. The distribution of bubble sliding velocity was obtained by statistical method. In fact, nucleate boiling is a complex process that involves the motion of individual bubbles and the interactions between them. In the former studies, many researchers experimentally or numerically investigated the bubble coalescence in the large space or channel, while few studies on bubble interaction in a narrow channel have been reported.
Bonjour et al. (2000) experimentally studied three types of bubble coalescence in pool nucleate boiling: (1) bubble coalescence away from the heating surface; (2) vertical bubble coalescence near the heating surface; (3) horizontal bubble coalescence near the heating surface. Liu et al. (2006) proposed to divide bubble coalescence into three types including vertical coalescence, horizontal coalescence and the mixtures of them. Feng et al. (2016) proposed that there were two forms of bubble coalescence, namely, connectionless coalescence and connected coalescence. In the study of Nguyen et al. (2013), the connected coalescence process includes the following steps: the approach and collision of bubbles, the formation and discharge of a liquid film, the rupture of the film when it reaches a critical thickness. Zhang and Shoji (2003) has found that the coalescence of bubbles had a great effect on the bubble departure frequency. Mukherjee and Dhir (2004) has numerically found that the lateral bubbles enhanced the heat transfer by trapping liquid layers during coalescence process. It has been found from Chen and Chung's (2002) experiment that the deformation caused by bubble coalescence increased the contact time between the cold liquid and the heating wall, thereby enhancing the heat transfer. According to Coulibaly et al.'s (2014) work, increasing liquid subcooling reduced the size and the departure frequency of coalesced bubble. Compared with the single-bubble boiling, the heat flux fluctuated more significantly during bubble coalescence process.
The above studies do not consider the limitations of space. In a narrow channel, the influence of flow resistance, surface tension and significantly enhances wall boundary constraints. The characteristics of bubble coalescence is different from those in the large channel (Lu et al., 2017). The bubbles grow to the narrow channel size and the distance between bubbles decrease, which enhance the bubble coalescence. However, sufficient research has not been conducted on the characteristics of bubble coalescence in narrow channels. In this work, visualization experiments were carried out to investigate the sliding bubble coalescence in an isolated bubble region in a narrow rectangular channel. The vapor-liquid interface evolution during bubble coalescence process and the change of characteristic parameters before and after coalescence were studied.
Experimental Method
Figure 1 shows the schematic diagram of the experimental equipment. The experimental loop mainly consists of a major circulation loop and a cooling loop. In order to intuitively study the characteristics of bubble coalescence, a visualization test section is designed and constructed. The main instruments in the circuit include a preheater, a test section, a condenser, a pressurizer, two pumps, an electromagnetic flowmeter, and some pipe valves. Before the formal experiment, water is heated by preheater and test section to reduce the solubility of the non-condensable gas in order to avoid the effect on the experimental phenomenon. In the experiment, deionized water is heated to boiling when flowing through the test section and then flows into the condenser through the riser. The condensed water flows to the preheater through the downcomer and is heated to a required temperature by the preheater. Then the water with a certain degree of subcooling flows into the test section and is heated again to boiling. In the cooling loop, the condenser is cooled by an air cooling tower and a large water tank. The circulation pumps are used to adjust the circulation flow and the pressurizer is used to maintain the system pressure.
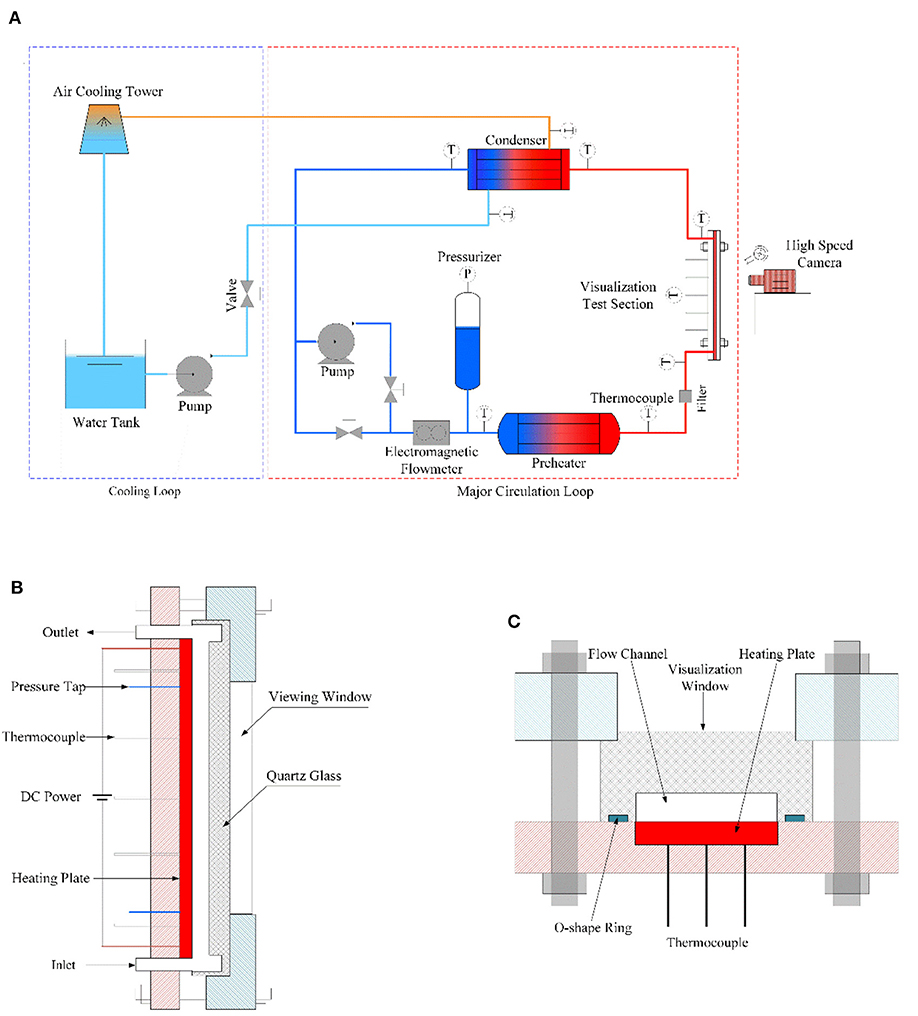
Figure 1. Schematic diagram of experimental equipment. (A) Schematic diagram of the experimental loop, (B) side section of the visualization test section, and (C) cross section of the visualization test section.
The vertical visualization test section details are shown in Figures 1B,C. A narrow rectangular flow channel of 700 mm × 40 mm × 2 mm is constructed by a quartz glass and a stainless steel heating plate, sealed by an O-shape ring. Two copper electrodes are welded to the stainless steel plate, connecting to a 50V/2000A DC (Direct Current) power. The heating length is 550 mm. The bubble coalescence behaviors are recorded by a high-speed camera equipped with a macro lens and the lens has a focal length of 105 mm and an aperture specification of F2.8. The camera is placed on a two-dimensional guide rail which can be movable in vertical and horizontal direction. Two adjustable fiber lights facing the test section are used to provide sufficient light.
Six N-type sheathed thermocouples are arranged at the inlets and outlets of the preheater, test section and condenser to measure fluid temperature. Eleven horizontal rows and three vertical rows K-type sheathed thermocouples are uniformly welded on the back of heating plate to measure the outer wall temperature at different positions. Additionally, the circulation flow is obtained by the electromagnetic flowmeter. In order to capture clear bubble images, the camera frame rate and resolution are, respectively, set to 4,300 frames per second and 1,024 × 1,024 pixels. Thus, the time interval between two adjacent images is 0.23 ms. A clear scale is taken for each experiment and the actual observation area is approximately 10.28 × 10.28 mm2. All instruments are connected with an NI (National Instruments) acquisition system to record the experimental data. When parameters, i.e., fluid temperature, wall temperature and flow rate reach stable, corresponding bubble images and thermal data are recorded simultaneously. The relevant parameters in the experiment are: the system pressure is 0.4 MPa, wall heat flux in test section is 114–212 kW·m−2, inlet fluid subcooling is 31°C, mass flow rate is 333–619 kg·m−2·s−1.
The determination of the bubble diameter and sliding velocity is described in the previous study (Ren et al., 2020). The N-type and K-type sheathed thermocouples respectively have accuracies of ±0.5°C and ±1°C. The heating power has an accuracy of 0.55%. The accuracies for bubble diameter and position are ±2 pixel. Based on the Kine and Mcclintock (1953) uncertainties analysis method, the relative uncertainty range for heat flux and inner wall temperature are, respectively, 1.8–4.2% and ±1°C. The relative uncertainty for bubble diameter and bubble velocity are, respectively, ±0.02 mm and ±0.08 m/s.
where F is a function of variables p1, p2, … pn; UF is the uncertainty for F and upi is the uncertainty for the variable pi. The relative uncertainty for the friction factor λ can be calculated as.
Results and Discussion
Morphology Changes During Bubble Coalescence
Figure 2 shows three different groups of bubble coalescence images: (a) the coalescence of two bubbles with similar size in the flow direction, (b) the coalescence of two bubbles with different size in the flow direction, (c) the coalescence of two bubbles in the horizontal direction. Based on Zheng et al.'s (2014) work, the consecutive coalescence process is composed of the following four steps according to the bubble morphological change: (1) approaching, (2) merging, (3) adjustment and (4) stabilization. In step (1), the two bubbles approach each other until the phase interfaces begin to contact; in step (2), the two bubble phase interfaces merge to form an irregularly shaped bubble; in step (3), the shape of new bubble is constantly adjusted and the oscillation gradually weakens; in step (4), the new bubble reaches stability and continues to slide. Among of those steps, step (2) and (3) are more important.
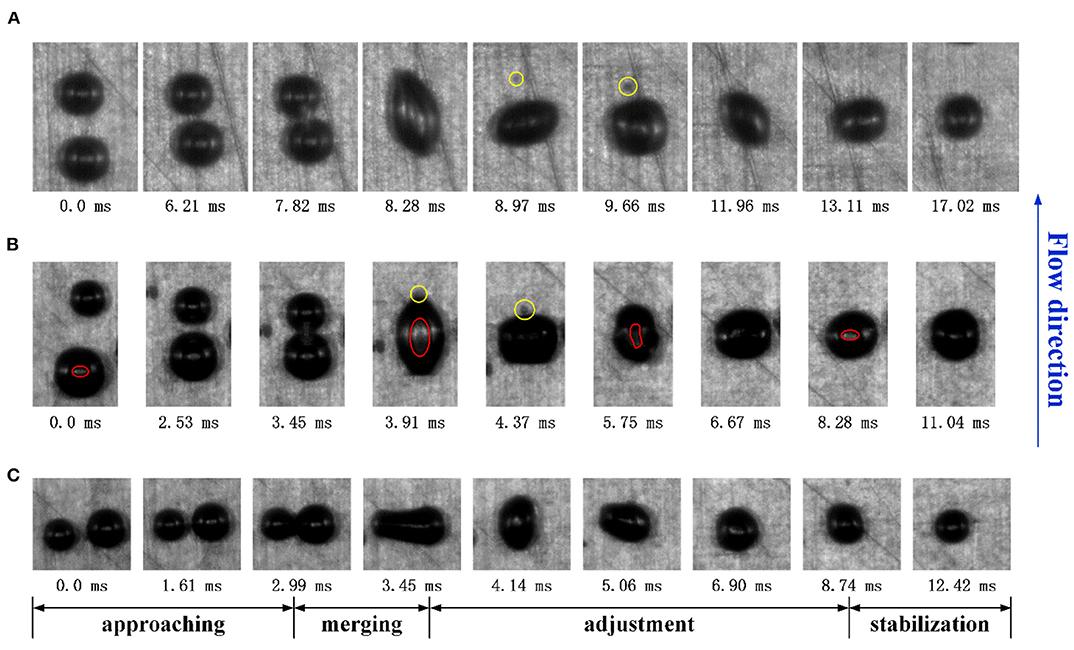
Figure 2. Bubble coalescence image. (A) q = 114.3 kW·m−2; ΔTsub,in = 31°C; G = 333.9 kg·m−2·s−1, (B) q = 212.2 kW·m−2; ΔTsub,in = 30.8°C; G = 619.6 kg·m−2·s−1, and (C) q = 212.2 kW·m−2; ΔTsub,in = 30.8°C; G = 619.6 kg·m−2·s−1.
Group (a) shows the coalescence process of two bubbles in the flow direction. At 0 ms, the two bubbles slide along the heating wall, then the distance between two bubbles decreases due to the different sliding velocities. At about 7.28 ms, the two bubble phase interfaces contacts each other and begin to merge. A new bubble is formed at 8.28 ms. In the long period adjustment process, the shape of bubble constantly changes. The oscillation gradually weakens and the bubble shape stabilizes at 17.02 ms. From the bubble images, there is a clear contact circle in the center of the bubble, which is represented by red lines in Figure 2B. This is caused by the contact between the bottom of the bubble and the heating surface. Therefore, it can be judged that the bubble always contact the wall surface in this process and no lifting off occurs.
Group (b) shows the coalescence process of two sliding bubbles with large size difference in the flow direction. In 0~3.45 ms, two bubbles get close to each other, the lower bubble gradually catches up with the upper one, and the diameter of the lower bubble decreases slightly. Then the bubble phase interfaces contact and coalesce, forming a new bubble. The time of bubble merging stage lasts about 0.5 ms and the time of bubble adjustment stage lasts about 7 ms. It is found in the experiment that if two bubble sizes differ greatly before coalescence, the oscillation during coalescence is small. If the size difference is small and both are large bubbles, there is a more severe oscillation and a longer adjustment period.
Group (c) shows the horizontal coalescence process of two sliding bubbles. Coalescence in horizontal direction is more difficult compared to that in vertical direction. However, the two bubbles in the figure are relatively close and the lateral position of two bubbles is shifted due to the growth of bubbles or the disturbance of the fluid. At 2.99 ms, the two bubble interfaces contact each other. After about 0.55 ms merging and 8.5 ms adjustment, a stable new bubble is formed. Similarly, the bubble always slides along the heating surface and does not lift off.
In addition, a small new bubble is generated in the coalescence process, which is reflected in Figures 2A,B. At 8.29 ms in Figure 2A, the length of the merging bubble in the vertical direction reaches the maximum value and then begins to shorten. A small amount of gas separates from the main bubble at the upper end because of inertia, which is then absorbed by the merging bubble during the movement. Similarly, the generation of a small bubble in Figure 2B occurs at 3.91 ms and also occurs at the top. If the small bubble is generated on the side, it may absorb heat energy to form a separate bubble, which is more likely to occur in the coalescence process of two larger bubbles.
Diameter Changes Before and After Bubble Coalescence
Based on coalescence process of sliding bubbles in Figures 2, 3 shows the bubble mean diameter and the ratio of the maximum diameter to minimum diameter variation with the time before and after coalescence. Considering the effects of light and flow heat transfer, the bubble may appear in various shapes. Bubble mean diameter is used to describe the bubble equivalent diameter, which is defined as the average diameter in all directions through the centroid. The ratio of bubble maximum diameter to the minimum diameter could approximately describe the bubble shape.
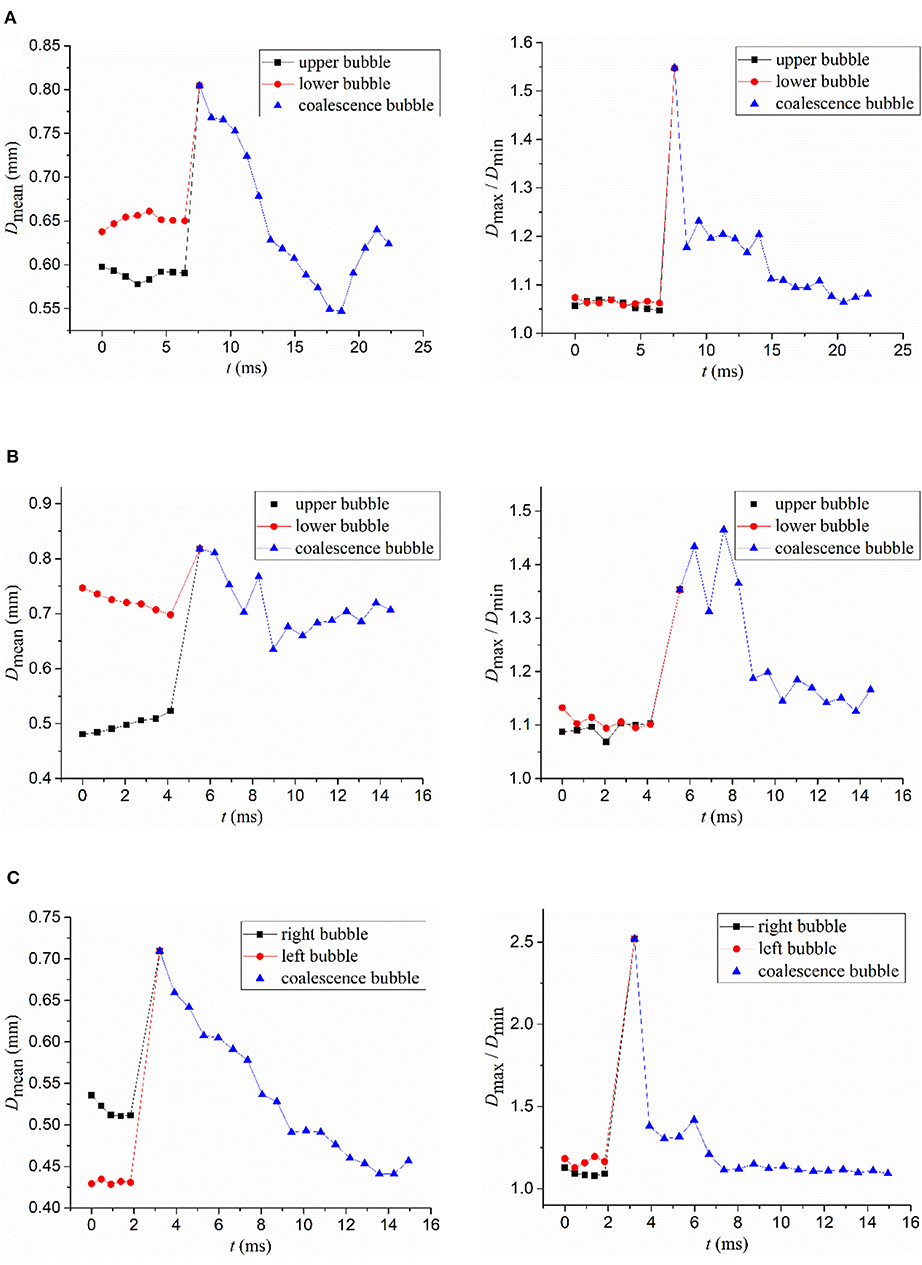
Figure 3. Bubble diameter and shape variation with time. (A) q = 114.3 kW·m−2; ΔTsub,in = 31°C; G = 333.9 kg·m−2·s−1, (B) q = 212.2 kW·m−2; ΔTsub,in = 30.8°C; G = 619.6 kg·m−2·s−1, and (C) q = 212.2 kW·m−2; ΔTsub,in = 30.8°C; G = 619.6 kg·m−2·s−1.
It can be seen from Figures 3A,B, for the coalescence occurring in the vertical flow direction, the bubble at the bottom tends to be larger, while the upper bubble is smaller. The bubble growth rate is relatively small in the sliding process. Before the interaction, a single bubble basically shows a stable state and the bubble diameter remains constant. When two bubbles are close to each other, they begin to interact by affecting the flow field and the bubble diameters and shapes are also disturbed to varying degrees. For example in group (b), the upper bubble diameter increases slightly, while the lower bubble diameter decreases. In the coalescence process, the bubble mean diameters for three groups increase at first, then decrease and finally stabilize. Later the new bubbles begin to absorb heat and grow like any other stable bubbles. The diameter of the final stable bubble is similar to the diameter of any bubble before coalescence, and its volume is less than the sum of the two bubble volumes before coalescence. This is because in subcooled boiling, the bubble size increases at the beginning of coalescence, increasing the contact area with the subcooled fluid. Moreover, the turbulence in the coalescence process further strengthens the disturbance of the fluid, resulting in greater condensation heat flux than evaporation heat flux. Therefore, the bubble volume decreases after coalescence.
According to Xu et al.'s (2013) work, the stable bubble is approximately spherical when it is sliding along the heating surface before coalescence. In this experiment, the front view is approximately circular. Hence, the ratio of the maximum diameter to the minimum diameter is about 1. It can be found from the bubble image that an irregular ellipse appears when the two bubbles first contact. At this time, the bubble maximum diameter is the largest and the minimum diameter is the smallest. In the subsequent adjustment stage, the bubble continuously trembles, while the degree of tremor weakens. The ratio of the maximum diameter to the minimum diameter gradually decreases until it finally stabilizes.
Velocity Changes Before and After Bubble Coalescence
Figure 4 shows the bubble velocity in the vertical direction variation with time before and after bubble coalescence. Compared to the vertical velocity, the horizontal velocity of the sliding bubble is very small and negligible. From the figure, a single sliding bubble moves at a uniform speed before the bubbles interaction. For two bubbles in the vertical flow direction, as shown in Figures 4A,B, the sliding velocity of the larger lower bubble is bigger than the velocity of the smaller upper bubble. In Figure 4C, the sliding velocities of the two bubbles with the same lateral position are similar. After bubble coalescence, the velocity of the new bubble formed increases first and then decreases with some fluctuations, which is the same as the bubble diameter change.
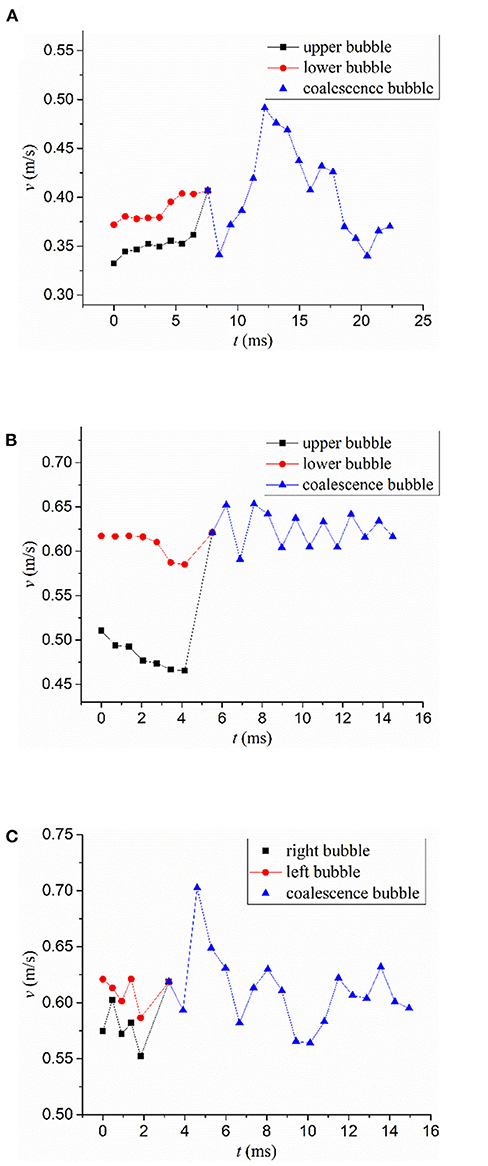
Figure 4. Bubble velocity variation with time. (A) q = 114.3 kW·m−2; ΔTsub,in = 31°C; G = 333.9 kg·m−2·s−1, (B) q = 212.2 kW·m−2; ΔTsub,in = 30.8°C; G = 619.6 kg·m−2·s−1, and (C) q = 212.2 kW·m−2; ΔTsub,in = 30.8°C; G = 619.6 kg·m−2·s−1.
Xu et al. (2011) pointed out in the research that the influence distance of the initial interaction between two sliding bubbles was about twice times of the average diameter. The coalescence between bubbles is a positive effect, which increases the bubble sliding velocity and is beneficial to the improvement of the heat transfer near the region. In the study, the sliding velocities of the two bubbles in group (a) increases slightly before coalescence, since the lower bubble is in the wake region of the upper bubble and is accelerated by the wake. At the same time, the acceleration promotes the movement of the upper bubble, so the velocities of two bubbles increase. However, the bubble sliding velocity is not only affected by coalescence, but also by the mainstream velocity, flow field disturbance and bubble size. It is known from previous study that the bubble sliding velocity is positively related to the bubble size (Ren et al., 2020). From Figure 3, the size of the upper bubble in group (b) decreases before coalescence and the velocity decreases as well. Bubble velocity in group (c) is basically unchanged. Therefore, Xu's conclusion is not applicable to this study, which might due to the limitation of the image window size. At 0 ms, the two bubbles are close to each other and at the end of the interaction, the acceleration is not obvious. In addition, the combined effects of bubble interaction, flow field disturbances and size change of bubbles may also lead to different results. If the bubble wake effect is greater, bubble velocity increases before coalescence. If other factors have greater influence, bubble velocity decreases or remain unchanged before coalescence.
Conclusions
In this paper, visualization experiments were carried out and sliding bubble coalescence behaviors were observed for subcooled flow boiling in a narrow vertical rectangular channel. The changes of morphology diameter and velocity before and after bubble coalescence were studied and analyzed. The main conclusions of the present work can be expressed as:
(1) The consecutive coalescence process is composed of four steps based on the bubble morphological change: approaching, merging, adjustment, and stabilization, in which the more important are the merging and adjustment of the bubble. If the size difference for two bubbles is small and both are large bubbles, there is a more severe oscillation and a longer adjustment period. In coalescence process, the bubble always slides along the heating surface and does not lift off.
(2) Bubble diameter increases first, then decreases and finally stabilizes in coalescence process. The new bubble volume is less than the sum of two bubble volumes before coalescence. Bubble shape also oscillates from an irregular ellipse to a stable circle. The change in bubble sliding velocity is the same as that in diameter.
(3) A new small bubble is generated next to the main bubble in the coalescence process, which is then absorbed by the main bubble during the movement or it may absorb heat energy to form a separate bubble.
Intuitive information is obtained about the interaction of bubbles in a narrow channel, which provides theoretical support for the study of boiling heat transfer. However, more quantitative analysis needs to be completed in future work.
Data Availability Statement
The datasets generated for this study are available on request to the corresponding author.
Author Contributions
TR contributed significantly to the analysis and manuscript preparation, performed the data analysis, and wrote the manuscript. ZZ and JS checked the English writing thoroughly. CY and RZ approved the final version.
Funding
The authors greatly appreciate support from Natural Science Foundation of China (Grant No. 11675045), support from the Natural Science Foundation of Heilongjiang Province, China (Grant No. LH2019A009), and the Open Fund Program of the State Key Laboratory of Nuclear Power Safety Monitoring Technology and Equipment (K-A2019.414).
Conflict of Interest
The authors declare that the research was conducted in the absence of any commercial or financial relationships that could be construed as a potential conflict of interest.
Acknowledgments
The authors are thankful for support from the Fundamental Science on Nuclear Safety and Simulation Technology Laboratory, Harbin Engineering University, China.
References
Bonjour, J., Clausse, M., and Lallemand, M. (2000). Experimental study of the coalescence phenomenon during nucleate pool boiling. Exp. Thermal Fluid Sci. 20, 180–187. doi: 10.1016/S0894-1777(99)00044-8
Chen, T., and Chung, J. N. (2002). Coalescence of bubbles in nucleate boiling on microheaters. Int. J. Heat Mass Transfer 45, 2329–2341. doi: 10.1016/S0017-9310(01)00334-9
Coulibaly, A., Bi, J., Lin, X., and Christopher, D. M. (2014). Effect of bubble coalescence on the wall heat transfer during subcooled pool boiling. Int. J. Thermal Sci. 76, 101–109. doi: 10.1016/j.ijthermalsci.2013.08.019
Feng, J., Li, X., Bao, Y., Cai, Z., and Gao, Z. (2016). Coalescence and conjunction of two in-line bubbles at low Reynolds numbers. Chem. Eng. Sci. 141, 261–270. doi: 10.1016/j.ces.2015.11.014
Kine, S. J., and Mcclintock, F. A. (1953). Describing uncertainties in single-sample experiments. Mech. Eng. 75, 3–8.
Li, S., Tan, S., Xu, C., Gao, P., and Sun, L. (2013). An experimental study of bubble sliding characteristics in narrow channel. Int. J. Heat Mass Transfer 57, 89–99. doi: 10.1016/j.ijheatmasstransfer.2012.10.002
Liu, Z., Herman, C., and Mewes, D. (2006). Visualization of bubble detachment and coalescence under the influence of a nonuniform electric field. Exp. Thermal Fluid Sci. 31, 151–163. doi: 10.1016/j.expthermflusci.2006.03.025
Lu, Q., Chen, D., Huang, Y., Yuan, D., and He, X. (2017). Visual investigation on the coalescence process and the thermal-hydraulic characteristics of the two-phase interface morphology in narrow vertical channel. Int. J. Heat Mass Transfer 115, 537–550. doi: 10.1016/j.ijheatmasstransfer.2017.08.052
Mukherjee, A., and Dhir, V. K. (2004). Study of lateral merger of vapor bubbles during nucleate pool boiling. J. Heat Transfer 126, 1023–1039. doi: 10.1115/1.1834614
Nguyen, V. T., Songab, C. H., Baeb, B. U., and Euh, D. J. (2013). Modeling of bubble coalescence and break-up considering turbulent suppression phenomena in bubbly two-phase flow. Int. J. Multiphase Flow 54, 31–42. doi: 10.1016/j.ijmultiphaseflow.2013.03.001
Ren, T., Zhu, Z., Yana, M., Shia, J., and Yan, C. (2019). Experimental study on bubble nucleation and departure for subcooled flow boiling in a narrow rectangular channel. Int. J. Heat Mass Transfer 144, 118670. doi: 10.1016/j.ijheatmasstransfer.2019.118670
Ren, T., Zhub, Z., Shia, J., Yana, C., and Zhang, R. (2020). Experimental study on bubble sliding for upward subcooled flow boiling in a narrow rectangular channel. Int. J. Heat Mass Transfer 152:119489. doi: 10.1016/j.ijheatmasstransfer.2020.119489
Xu, J., Chen, B. D., Huang, Y. P., Yan, X., and Yuan, D. (2013). Experimental visualization of sliding bubble dynamics in a vertical narrow rectangular channel. Nuclear Eng. Des. 261, 156–164. doi: 10.1016/j.nucengdes.2013.02.055
Xu, J., Chen, B. D., and Wang, X. J. (2011). Experimental visualization coalesced interaction of sliding bubble near wall in vertical narrow rectangular channel. Yuanzineng Kexue Jishu/Atomic Energy Sci. Technol. 45, 548–553. doi: 10.1007/s12264-011-1035-3
Zhang, L., and Shoji, M. (2003). Nucleation site interaction in pool boiling on the artificial surface. Int. J. Heat Mass Transfer 46, 513–522. doi: 10.1016/S0017-9310(02)00291-0
Zheng, Q., Gao, P. Z., Xu, C., Feng, G., and Jian, H. (2014). Research on bubble coalescence in narrow rectangular channel. Yuanzineng Kexue Jishu/Atomic Energy Sci. Technol. 48, 1015–1019. doi: 10.7538/yzk.2014.48.06.1015
Nomenclature
P System pressure, MPa
q Wall heat flux, kW·m–2
G Mass flow rate, kg·m–2·s–1
ΔTsub,in Inlet subcooling, °C
D Diameter, mm
v Velocity, m/s.
Keywords: bubble coalescence, narrow rectangular channel, subcooled flow boiling, sliding bubble, visualization experiment
Citation: Ren T, Zhu Z, Zhang R, Shi J and Yan C (2020) Visualization Experiment of Bubble Coalescence in a Narrow Vertical Rectangular Channel. Front. Energy Res. 8:96. doi: 10.3389/fenrg.2020.00096
Received: 01 March 2020; Accepted: 04 May 2020;
Published: 02 June 2020.
Edited by:
Shripad T. Revankar, Purdue University, United StatesReviewed by:
Boštjan Končar, Institut JoŽef Stefan (IJS), SloveniaJiankai Yu, Massachusetts Institute of Technology, United States
Copyright © 2020 Ren, Zhu, Zhang, Shi and Yan. This is an open-access article distributed under the terms of the Creative Commons Attribution License (CC BY). The use, distribution or reproduction in other forums is permitted, provided the original author(s) and the copyright owner(s) are credited and that the original publication in this journal is cited, in accordance with accepted academic practice. No use, distribution or reproduction is permitted which does not comply with these terms.
*Correspondence: Rui Zhang, cnpoYW5nQGhyYmV1LmVkdS5jbg==