 Yu Du
Yu Du Xiao Yan*
- CNNC Key Laboratory on Nuclear Reactor Thermal Hydraulics Technology, Nuclear Institute of China, Chengdu, China
Steam-submerged direct contact condensation is widely applied in industry fields. As it has the enormous capacity of heat and mass transfer, the phenomenon is widely used in nuclear engineering equipment which are related to safety, such as the suppression pool in the boiling water reactor (BWR). It is important to understand the regime map when we study this phenomenon because the characteristics of heat and mass transfer vary with the regime, including the characteristic of the interface of steam and water. Lots of researchers have investigated the regime of steam-submerged direct contact condensation. Different researchers have developed different regime maps with their own or other people's experimental data. This article reviews the present research on the regime maps and discusses further efforts on the important phenomenon.
Introduction
Direct contact condensation (DCC) is the phenomenon where steam condenses when it gets into contact with the same liquid directly. The DCC is widely used in industrial applications, as it has a remarkable advantage on heat transfer. In applications in nuclear engineering, steam-submerged DCC is an important phenomenon in safety-related equipment, such as the pressure suppression pool and in-containment refueling water storage tank (IRWST), in which the steam is discharged into the water pool. In researches of steam-submerged DCC, the characteristics of heat and mass transfer are always based on the regime. As a result, the regime map is the foundation of understanding the steam-submerged DCC.
Research of Regime Maps of Steam-Submerged DCC
Arinobu (1980) conducted experiments to study the steam-submerged DCC and developed a regime map with his experimental data. The steam mass flux was in the range of 5–100 kg/m2 s, while the temperature of water varied from 20 to 92°C. To study the influence of water depth, the submerged depths of the pipe were 0.2 and 0.4 m. And Arinobu proposed that the submerged depths of the pipe have little to do with the regime. The diameters of the pipe used in the experiment were 0.0161 and 0.0276 mm. The regime map is shown in Figure 1. Arinobu defined the regime with shape and position of the steam–water interface and optimized it with pressure oscillation. The characteristics of every regime are described as follows.
Region I: The steam condenses in the pipe, while the steam–water interface and pressure are both oscillating.
Region II: The steam mass flux is larger than the condensation rate, so there is a steam region forming at the pipe exit. Water will rush into the pipe as soon as the stream region collapses. And then the steam in the pipe will push the water out, because the smaller heat transfer area makes the condensation weaker when the interface is in the pipe. As a result, a new steam region will form, and the progress repeats. This regime is always called chugging by almost all researchers.
Region III: The water does not rush into the pipe anymore as the steam flux is large enough. There is no obvious pressure oscillation in this regime.
Region IV: The pressures in the pipe and pool are oscillating periodically, and violent oscillation of the steam–water interface is observed. This regime is called condensation oscillation (CO).
Region V: The steam surrounds the pipe and condenses. As a result, obvious oscillation was observed.
Region VI: The water temperature is high and the condensation capacity gets weaker, so the area of the steam–water interface becomes larger. The steam could escape from the water because it cannot be condensed completely.
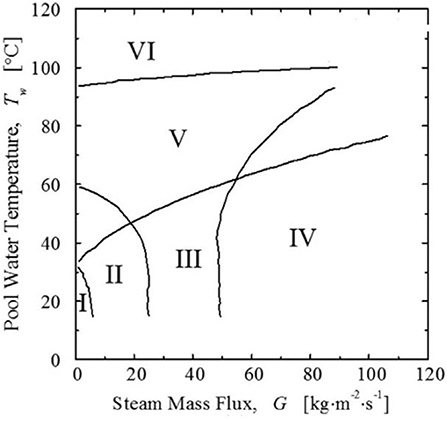
Figure 1. The regime map developed by Arinobu (1980).
Lahey and Moody (1993) named these regimes of Arinobu's map as follows. Chugging, CO, quasi-steady oscillation, transition region, and incomplete condensation. It is worth mentioning that Lahey called region III as CO. But the characteristic of CO was observed in region IV in Arinobu's research.
Chan and Lee (1982) conducted an experiment and developed a regime map of steam-submerged DCC, in which the steam mass flux varied from 1 to 175 kg/m2 s and the water temperature was in the range of 40 to 90°C. The pipe diameter in the experiment was 0.0508 m. The regime map is shown in Figure 2. Chan used two parameters to identify regimes: the axial location of the steam region relative to the pipe exit and the location where bubbles detach from the steam region. Though Chan identified seven regimes in his research, he classified them into three categories: chugging (<50 kg/m2 s), oscillatory bubbles (median flux), and oscillatory jet (>125 kg/m2 s). Chan describes the characteristics of each regime as follows.
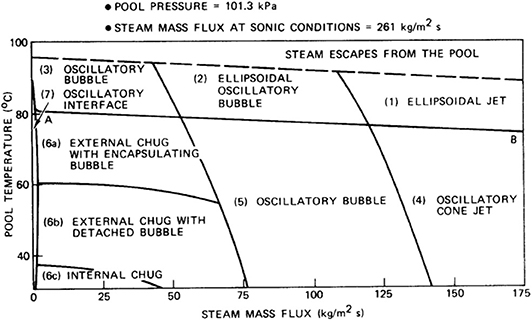
Figure 2. The regime map developed by Chan and Lee (1982).
Region l (ellipsoidal jet): In this regime, the water temperature is high, and the steam flux is large. The steam encapsulates the pipe as an ellipsoid, the small diameter of which is about eight pipe diameters. There is no bubble detachment observed in this regime.
Region 2 (ellipsoidal oscillatory bubble): The steam flux is lower. Though the steam region is still an ellipsoid, there is an obvious bubble detachment. The frequency of the detachment is about 11 Hz.
Region 3 (Oscillatory bubble): The steam flux is even lower. The steam region moves up and encapsulates more of the pipe. The bubble detaches above the pipe exit. The separated steam would condense as it floats up toward the water surface. The lower steam region still encapsulates the pipe and begins to grow into another column. The progress repeats. The detachment frequency of the bubble is about 7 Hz.
Region 4 (oscillatory cone jet): In this regime, the water temperature is low, and the steam mass flux is high. The steam region exists below the pipe exit. The bubble detaches at the point about one to two pipe diameters below the exit. Chan described this progress as an interface instability, which grows as the steam region moves away from the exit. And a volume of steam would detach when the instability grows large enough. The frequency of the detachment is about 40 Hz.
Region 5 (oscillatory bubble): The initial position of instability mentioned above is closer to the pipe exit. The detachment point moves up to about one pipe diameter below the exit. The detachment frequency is about 26 Hz. The detachment point and the initial position of instability will be closer to the exit when the steam flux becomes lower. It is the boundary of the oscillatory bubble and chugging when the detachment happens just at the exit, because the steam could only exist periodically in the pool and the water would enter the pipe periodically if the steam flux becomes lower. Chan separated the chugging into three regimes with the shape and pressure oscillation: internal chug, external chug with detached bubble, and external chug with encapsulating bubble (shown in Figure 2).
Region 7 (oscillatory interface): No bubble detachment was observed in this regime. The steam–water interface is right at the pipe exit. The steam flux is so low that we cannot measure accurate data.
If the water temperature is above the dashed line at the top of Figure 2, steam would escape from the water surface.
Aya et al. (1980, 1983) and Nariai and Aya (1986) developed a regime map in the 1980s with his experiment, as shown in Figure 3. In his experiment, the steam flux varied from 0 to 200 kg/m2 s, and the water temperature is in the range of 10 to 100°C. The diameters of pipes used in the experiment were 18 and 29 mm. Aya identified the regime with the amplitude and frequency of the pressure and the temperature in the pipe. The characteristics of each regime are described as follows.
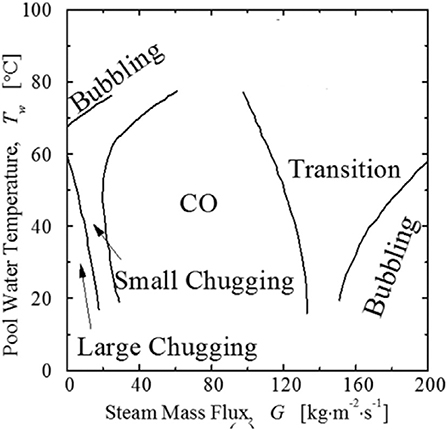
Figure 3. The regime map by Aya et al. (1980, 1983) and Nariai and Aya (1986).
Large chugging/intermittent growth (La-C): Pressure oscillations with high amplitude and frequency are observed, which results from the level of water rushing into the pipe.
Small chugging/beat (Sm-C): The steam–water interface oscillates near the pipe exit.
CO: A bubble grows and shrinks at the pipe exit. The frequency of pressure oscillation is just the same as that of steam–water interface oscillation.
Bubbling (B): In this regime, the water temperature or high steam mass flux is high, and the steam velocity is close to the sonic velocity. Bubble growth and detachment were both observed.
Transition (T): The behaviors of the steam–water interface are the transition from CO to bubbling.
Chun et al. (1996) conducted experiments and developed the regime map, as shown in Figure 4. The steam flux in the experiment varied from 200 to 700 kg/m2 s, while the water temperature varied from 12 to 83°C. The diameters of the pipe varied from 4.45 to 10.85 mm. Chun classified the regimes in which the steam–water interface is almost stable into three categories: conical, ellipsoidal, and divergent shapes. Chun thought that the diameter of steam region is related to the diameter of the pipe and indicated that the shape of the steam region is related to the steam flux and water subcooling. And the steam region shape would be divergent when the subcooling is small enough. Chun identified six regimes, summarized as follows.
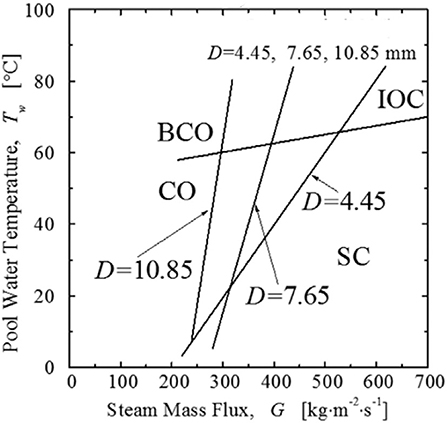
Figure 4. The regime map developed by Chun et al. (1996).
Chugging (C): The steam flux and water temperature are both low. The steam plume forms and collapses periodically. The water rushes into the pipe when the steam plume collapses and then is pushed out by the steam. The amplitude of pressure oscillation is large and irregular.
Transition region from chugging to CO (TC): The water cannot enter the pipe. A crowd of small bubbles forms near the pipe exit.
CO: The steam–water interface and pressure oscillate violently in a high frequency.
Bubble CO (BCO): The water temperature is high, and the steam flux is the same as that in CO. The steam bubble detaches with an irregular shape and condenses or escapes from the water surface.
Stable condensation (SC): The steam condenses rapidly. The sound of condensation and amplitude of pressure oscillation are both mild.
Interfacial oscillation condensation (IOC): The water temperature and steam flux are high. The steam condenses unstably. The steam–water interface oscillates violently.
Chun conducted experiments with pipes of different diameters. We can easily find that in the diameter range Chun have chosen, the steam flux would be smaller when we get a stable condensation, if the pipe diameter is lager. But this rule is not always applicative when the pipe diameter varies. In the regime map of Chun, the pipe diameter is 18 or 29 mm, and the steam region did not become stable even when the steam flux got to 200 kg/m2 s.
And when the pipe diameter turns to 50.8 mm, which is the pipe diameter used in Chan's experiments (Chan and Lee, 1982), the regime map is much different. In Chan's regime map (Chan and Lee, 1982), the detachment and oscillation are usual. This could be explained by the fact that when the pipe diameter is large enough, the condensation rate is not enough to consume the tail of the steam and the tail could detach from the main region. And the limited condensation could not affect the main steam region, the condensation and the momentum of the steam make the oscillation happen.
Cho et al. (1998) conducted experiments and proposed a regime map including six regimes, shown in Figure 5. The definitions of these regimes are similar with Chun's, while the boundaries are not all the same. The difference in regime maps may be the result of the different pipe diameters.
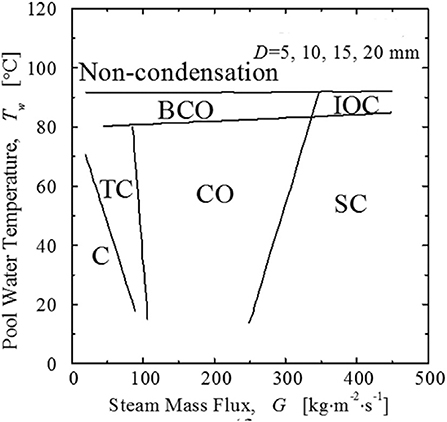
Figure 5. The regime map developed by Cho et al. (1998).
Petrovic De With et al. (2007) researched the steam-submerged DCC regime map with data from the literature. De With proposed that the previous planar regime maps could predict the regime under a certain condition, but it would not work when the diameter of pipe varies. De With proposed a three-dimensional regime map, shown in Figure 6. He conducted experiments to validate the regime map. He classified the regimes into three categories: chugging, jetting, and bubbling, similar with Chan and Lee (1982). And he also agreed with Chun et al. (1996) that there are three typical plume shapes in the jetting regime: conical, ellipsoidal, and divergent.
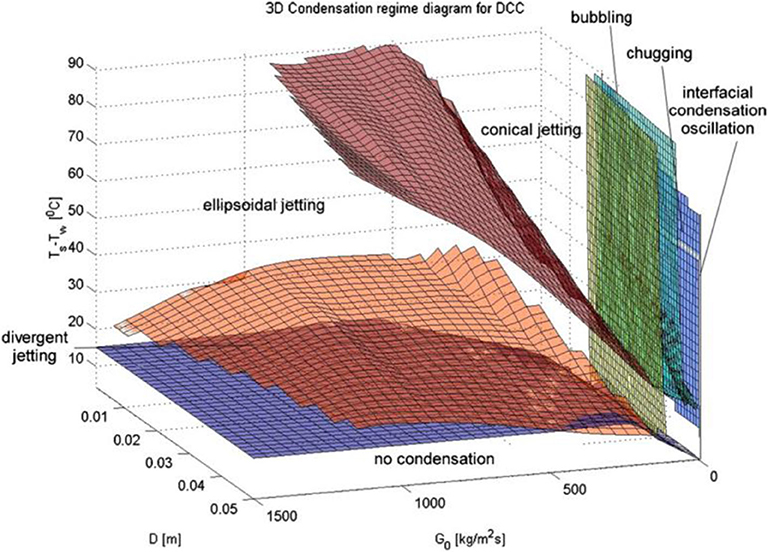
Figure 6. The regime map developed by Petrovic De With et al. (2007).
Wu et al. (2007, 2009a,b,c) has begun an experimental research on the steam-submerged DCC since 2007. His experiments included sonic and supersonic steam jets. Wu observed six typical regimes under the supersonic condition and four typical regimes under the sonic condition. He explained the causes of formation of different shapes under sonic and supersonic conditions with the expand–compress wave theory. And he developed a three-dimensional regime map, as shown in Figure 7. In the regime map, the pressure ratio (the ratio of the pressure of the pipe exit and pressure of the pipe inlet) is a factor which is related to the steam plume shape. The classifications of regimes are based on the compressing and expanding of the steam plume.
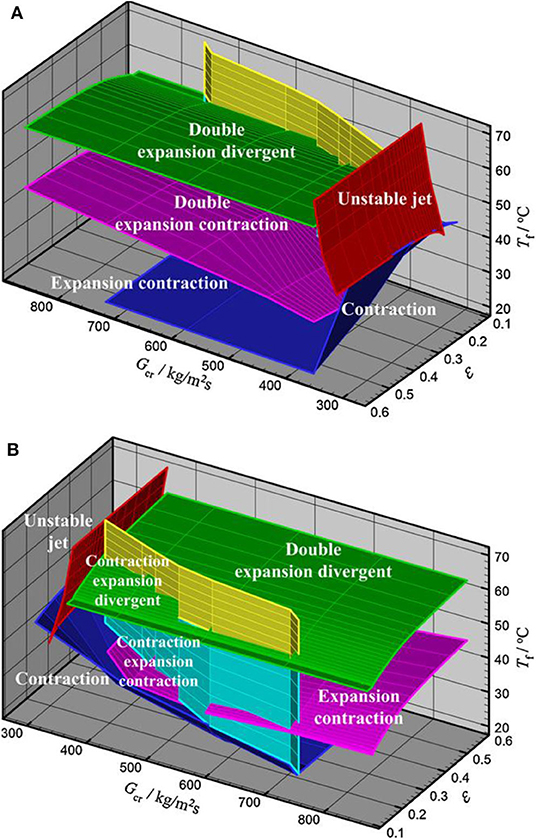
Figure 7. The regime map developed by Wu et al. (2009a). (A) View from a side. (B) View from another side.
Wu focused his attention on the stable condensation regime. In his research, different pipe exit diameters were used, but no obvious differences were observed between regimes of different diameters. It seems that the diameter does not affect the stable regime as efficiently as it does when the regime is unstable.
Xu et al. (2013) performed experiments to study the steam-submerged DCC regime map, in which the steam meets with the water flow in a vertical pipe. The regime map is shown in Figure 8. In his regime map, the regime is related to the steam flux, water temperature, and the Re of the water. Xu acquired a stable jetting regime, and there are five typical shapes: cylinder, conical, hemisphere, ellipsoidal, and divergent. In 2016, Xu and Guo (2016) conducted an experiment to study the regime map when the steam jet is oblique when it enters the pipe. The regime maps are shown in Figure 9.
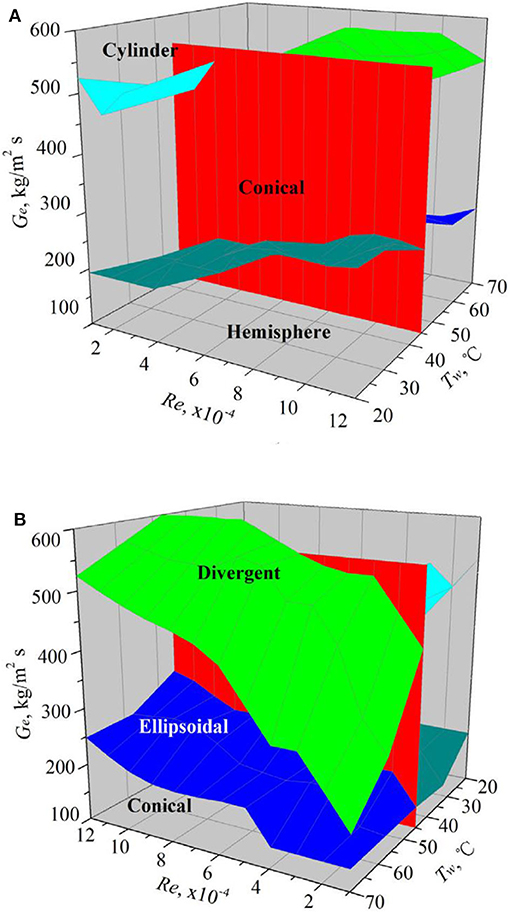
Figure 8. The regime map developed by Xu et al. (2013). (A) View from a side with low water temperature. (B) View from a side with high water temperature.
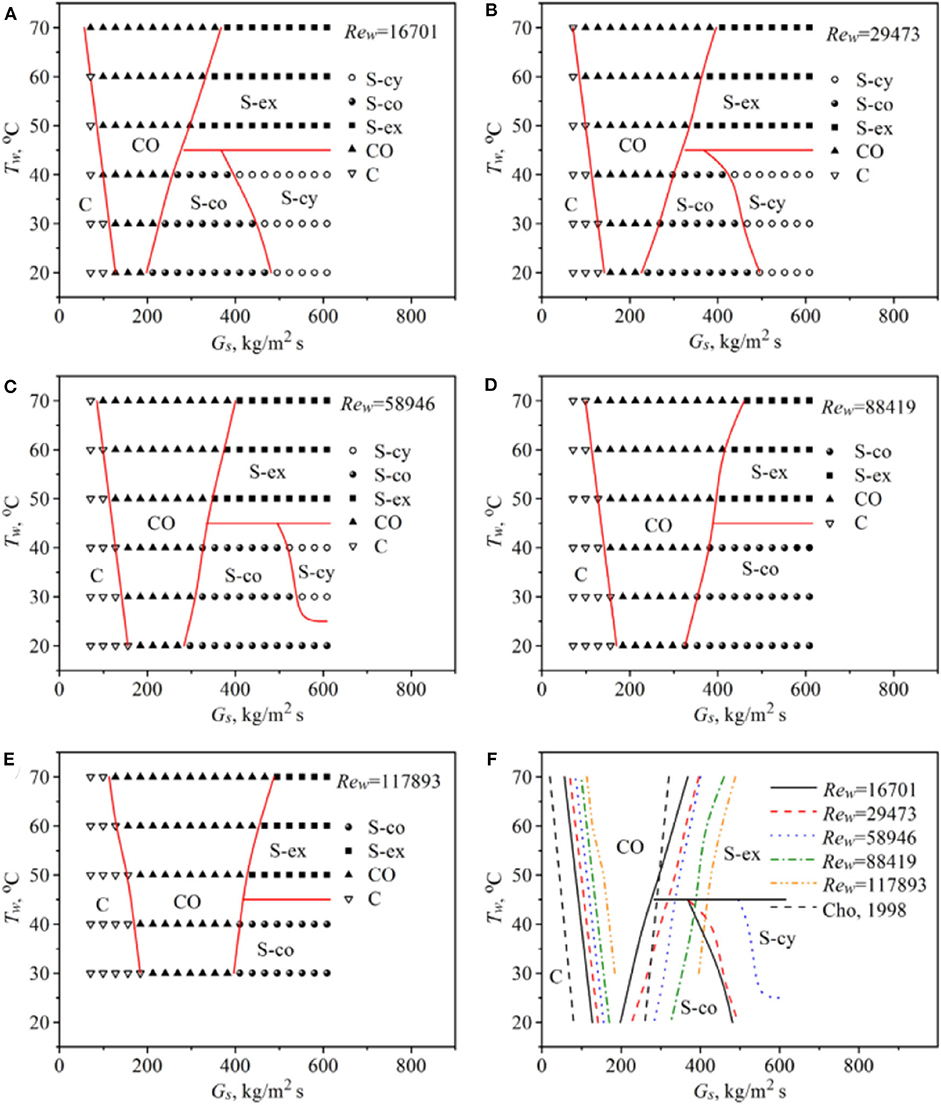
Figure 9. The planar regime maps developed by Xu and Guo (2016). (A) Re = 16,701; (B) Re = 29,473; (C) Re = 58,946; (D) Re = 88,419; (E) Re = 117,893; (F) transition lines for different Re.
Gregu et al. (2017) conducted experiments focusing on the chugging regime and further subdivided the chugging regime into four regimes, as shown in Figure 10. The characteristics of each regime are described as follows.
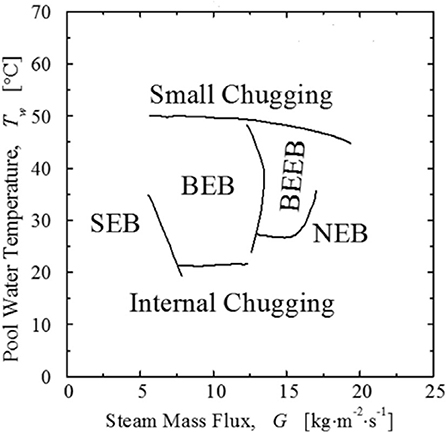
Figure 10. The regime maps developed by Gregu et al. (2017).
Small encapsulating bubbles (SEB): A small bubble encapsulates the pipe exit.
Big encapsulating bubbles (BEB): A large bubble encapsulates the pipe exit.
Big encapsulating elongated bubbles (BEEB): A large elongated bubble encapsulates the pipe exit.
Nonencapsulating bubbles (NEB): no bubble encapsulates the pipe exit.
Zhao and Hibiki (2018) reviewed the condensation maps of steam-submerged jet condensation in 2018, but some of the information is inaccurate, such as the diameter of the pipe in Chan's experiment (Chan and Lee, 1982) and the range of water temperature in Chan's research (Chun et al., 1996).
Shape and Length of the Steam Plume
The steam plume is stable when the steam flux is large and steady enough. Many researchers pay attention to the length of the steam plume, which is an important parameter of a stable regime. It is significant to know the length because it has an important effect on the heat transfer characteristics. Kerney et al. (1972) conducted experiments to study the length of a stable regime and acquired a semiempirical correlation to predict the dimensionless steam plume length. The pipes of different external structures with the same flow areas were used in Kerney's experiments. And it proved that the external structure has little to do with the dimensionless length. The correlation Kerney proposed was based on the dimensionless condensation driving potential and the steam flux, as shown in Equation (2). The condensation driving potential, B, which represents the condensation capacity, is defined in Equation (1). Most of the correlations of dimensionless steam plume proposed by the latecomers have a similar form with Kerney's correlation. But Weimer et al. (1973) proposed a correlation adding the ratio of densities between liquid and steam as a factor.
Hwan Kim et al. (2001) conducted experiments to study the length of a stable steam plume in 2011. He has observed conical and ellipsoidal steam plumes in the experiment, as shown in Figure 11. And Kim proposed a correlation of dimensionless steam plume length with his experimental data, as shown in Table 1.
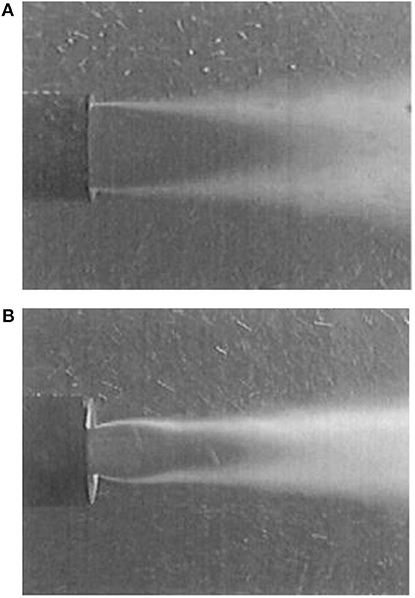
Figure 11. The typical shapes observed by Hwan Kim et al. (2001). (A) Conical shape (nozzle ID: 20mm, mass flux: 280 kg/m2-s). (B) Ellipsoidal shape (nozzle ID: 10.15mm, mass flux: 600 kg/m2-s).
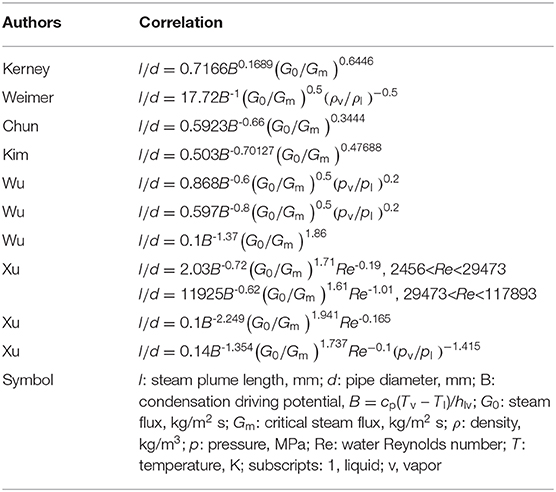
Table 1. Summary sheet of correlations for dimensionless length of steam plume.
De With (2009) analyzed the data from the literatures and indicated that the length of the steam plume is related to the Reynolds number of the steam, which could reflect the inertia of the steam. De With used all the data collected from literatures to developed a diagram of steam plume length with the condensation potential and the Reynolds number of the steam, as shown in Figure 12. The diagram was produced through interpolation using existing data from literatures to create the integrated surface. De With filtered the data that have large deviations in colors from the surrounding colors, for the reason that he assumed that the large deviations are the result of inaccuracies in the measurements and variations in measurement techniques and setups during experiments.
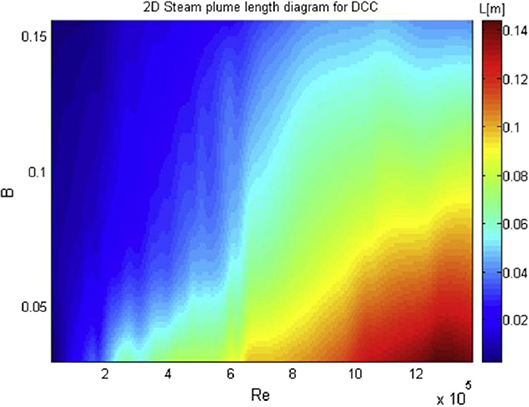
Figure 12. The new diagram of steam plume length developed by De With (2009).
Wu et al. (2007, 2009b,c), Xu et al. (2013, 2017), and Xu and Guo (2016) also conducted experiments to study the steam plume length. They observed different plume shapes in their experiments and proposed correlations to predict dimensionless steam plume length. One of the correlations proposed by Wu took the effects of steam inlet pressure and pool pressure into account. In Xu's study, the steam is jetted into the vertical pipe. All the correlations for the steam plume length are shown in Table 1.
Conclusions
There are nine regime maps developed for the submerged-steam condensation by different researchers depending on different experiments. But the regime boundaries are quite different in each of their regime maps. There are even some contradictions between the regime maps. An important reason is that almost all researchers did not take the diameter of the pipe into account when they the developed regime maps, except Cho and De With. And the pipe diameter has a remarkable influence on the regime.
Though Chun took the pipe diameter into account, the regime boundaries in his regime map are almost linear and not exact enough. De With's regime map may need more experimental data to ensure accuracy, because the limited data may be not enough to draw a continuous regime map. Wu and Xu researched the stable regime minutely but did not research the unstable regime. There are many correlations to predict the dimensionless steam plume length, but they are all semiempirical correlations, and none of them could reveal the mechanism.
In the future, we may pay more attention to the effect of the pipe diameter on the regime map. The regime map could be developed when the diameter is certain. And the comparison of regime maps of different pipe diameters needs to be done to help us know the impacting mechanism of the pipe diameter.
On the other hand, almost all the experiments were conducted under atmospheric pressure, and experiments under other pressures should be performed to satisfy the needs on much wider applications.
Author Contributions
YD wrote this article. XY, JZ, and YZ gave the suggestions to revise this article. All authors contributed to the article and approved the submitted version.
Funding
This work was supported by Postdoctoral Science Foundation of China (2018M643528) and Natural Science Foundation of Sichuan Province of China (2019YJ0298).
Conflict of Interest
The authors declare that the research was conducted in the absence of any commercial or financial relationships that could be construed as a potential conflict of interest.
References
Arinobu, M. (1980). “Studies on the dynamic phenomena caused by steam condensation in water,” in Proceedings of the ANS/ASME/NRC International Topical Meeting on Nuclear Reactor Thermal-hydraulics (New York, NY), 293-302.
Aya, I., Kobayashi, M., and Nariai, H. (1983). Pressure and fluid oscillations in vent system due to steam condensation (II). J. Nuclear Sci. Technol. 20, 213–227 doi: 10.1080/18811248.1983.9733383
Aya, I., Nariai, H., and Kobayashi, M. (1980). Pressure and fluid oscillations in vent system due to steam condensation. J. Nuclear Sci. Technol. 17, 499–515. doi: 10.1080/18811248.1980.9732617
Chan, C. K., and Lee, C. K. B. (1982). A regime map for direct contact condensation. Int. J. Multiphase Flow 8, 11–20. doi: 10.1016/0301-9322(82)90003-9
Cho, S., Song, C. H., Park, C. K., Yang, S. K., and Chung, M. K. (1998). “Experimental study on dynamic Pressure Pulse in direct contact condensation of steam discharging into subcooled water” in 1st Korea-Jopan Symposium on Nuclear Thermal Hydraulics and Safety (NTHASl) (Pushan).
Chun, M. H., Kim, Y. S., and Park, J. W. (1996). An investigation of direct condensation of steam jet in subcooled water. Int. Commit. Heat Mass Transf. 23, 947–958. doi: 10.1016/0735-1933(96)00077-2
De With, A. (2009). Steam plume length diagram for direct contact condensation of steam injected into water. Int. J. Heat Fluid Flow 30, 971–982. doi: 10.1016/j.ijheatfluidflow.2009.06.001
Gregu, G., Takahashi, M., Pellegrini, M., and Mereu, R. (2017). Experimental study on steam chugging phenomenon In a vertical sparger. Int. J. Multiphase Flow 88, 87–98. doi: 10.1016/j.ijmultiphaseflow.2016.09.020
Hwan Kim, H. Y., Yoo Bae, Y., Chul Song, H., Jong Park, K., and Sang Choi, M. (2001). Experimental study on stable steam condensation in a quenching tank. Int. J. Energy Res. 25, 239–252 doi: 10.1002/er.675
Kerney, P. J., Faeth, G. M., and Olson, D. R. (1972). Penetration characteristics of a submerged steam jet. AlChE J. 8, 548–553. doi: 10.1002/aic.690180314
Lahey, R. T., and Moody, F. J. (1993). The thernal-hydraulics of a boiling water nuclear reactor. Am. Nuclear Soc. 284, 581–583.
Nariai, H., and Aya, I. (1986). Fluid and pressure oscillations occurring at direct contact condenstaion of steam flow with cold water. Nuclear Eng. Design 95, 35–45. doi: 10.1016/0029-5493(86)90034-8
Petrovic De With, A., Calay, R. K., and De With, G. (2007). Three-dimensional condensation regime diagram for direct contact condensation of steam injected into water. Int. J. Heat Mass Transf. 50, 1762–1770. doi: 10.1016/j.ijheatmasstransfer.2006.10.017
Weimer, J. C., Faeth, G. M., and Olson, D. R. (1973). Penetration of vapor jets submerged in subcooled liquids. AlChE J. 19, 552–558. doi: 10.1002/aic.690190321
Wu, X. Z., Pan, D. D., Liu, G. Y., and Li, W. J. (2009a). Condensation regime diagram for supersonic/sonic steam jet in subcooled water. Nuclear Eng. Design 239, 3142–3150. doi: 10.1016/j.nucengdes.2009.08.010
Wu, X. Z., Yan, J. J., Li, W. J., Pan, D. D., and Chong, D. T. (2009c). Experimental study on sonic steam jet condensation in quiescent subcooled water. Chem. Eng. Sci. 64, 5002–5012. doi: 10.1016/j.ces.2009.08.007
Wu, X. Z., Yan, J. J., Li, W. J., Pan, D. D., and Liu, G. Y. (2009b). Experimental investigation of over-expanded supersonic steam jet submerged in quiescent water. Exp. Thermal Fluid Sci. 34, 10–19. doi: 10.1016/j.expthermflusci.2009.08.006
Wu, X. Z., Yan, J. J., Shao, S. F., Cao, Y., and Liu, J. (2007). Experimental study on the condensation of supersonic steam jet submerged in quiescent subcooled water: steam plume shape and heat transfer. Int. J. Multiphase Flow 33, 1296–1307. doi: 10.1016/j.ijmultiphaseflow.2007.06.004
Xu, Q., and Guo, L. (2016). Direct contact condensation of steam jet in crossflow of water in a vertical pipe. Experimental investigation on condensation regime diagram and jet penetration length. Int. J. Heat Mass Transf. 94, 528–538. doi: 10.1016/j.ijheatmasstransfer.2015.02.036
Xu, Q., Guo, L., and Chang, L. (2017). Interfacial characteristics of steam jet condensation in crossflow of water in a vertical pipe. Appl. Thermal Eng. 113, 1266–1276. doi: 10.1016/j.applthermaleng.2016.11.094
Xu, Q., Guo, L., Zou, S., Chen, J., and Zhang, X. (2013). Experimental study on direst contact condensation of stable steam jet in water flow in a vertical pipe. Int. J. Heat Mass Transf. 66, 808–817. doi: 10.1016/j.ijheatmasstransfer.2013.07.083
Keywords: submerged, direct contact condensation, regime map, two-phase flow, steam jet
Citation: Du Y, Yan X, Zang J and Zhang Y (2020) Review of Regime Maps of Steam-Submerged Direct Contact Condensation. Front. Energy Res. 8:119. doi: 10.3389/fenrg.2020.00119
Received: 06 October 2019; Accepted: 19 May 2020;
Published: 10 July 2020.
Edited by:
Liangming Pan, Chongqing University, ChinaReviewed by:
Jinbiao Xiong, Shanghai Jiao Tong University, ChinaKeyou S. Mao, Oak Ridge National Laboratory (DOE), United States
Copyright © 2020 Du, Yan, Zang and Zhang. This is an open-access article distributed under the terms of the Creative Commons Attribution License (CC BY). The use, distribution or reproduction in other forums is permitted, provided the original author(s) and the copyright owner(s) are credited and that the original publication in this journal is cited, in accordance with accepted academic practice. No use, distribution or reproduction is permitted which does not comply with these terms.
*Correspondence: Xiao Yan, eWFueGlhb19ucGljQDE2My5jb20=