 Tao Zhang
 Xin Qi
- School of Economics and Management, China University of Petroleum (East China), Dongying, China
Considering increased global emphasis on energy security, low-carbon economy and environmental governance, the proportion of renewable energy will increase in national power grid systems. Wind power generation will play an important role in China's future power systems. Environmental uncertainty will affect the time-varying correlation between carbon efficiency and the performance of the wind power enterprises. Panel data from 2011 to 2018 is used to analyze the development status and existing problems of the wind power industry; further, with the data, the dynamic conditional correlation coefficient is calculated through the DCC-GARCH model, and the breakpoint analysis method is used to analyze the impact of policy and the economic environment on the time-varying correlations between carbon efficiency and the performance of wind power enterprises. The results show that during the China-US trade war, the sudden trade policy changes that increased tariffs led to a sharp rise in interdependence. The relevant polices inspiring the wind power industry are positively correlated with the dynamic conditional correlation coefficient, while the financial performance of alternative fossil fuels is negatively correlated with the dynamic conditional correlation coefficient.
Introduction
China is currently ranked first in carbon dioxide emissions worldwide. In 2017, coal consumption accounted for 60.4% of China's energy consumption, while this number ranges from 5 to 25% for several developed countries. The typical coal-dependent economic model not only aggravates air pollution and harms the global ecological environment, but it also becomes an obstacle to sustainable development (Hongtao and Wenjia, 2018). Therefore, considering the current urgent situation of environmental governance, the shift of major energy sources away from coal and toward renewable energy is meaningful, and there is a close relationship between urbanization and renewable energy (Yang et al., 2016); the Chinese government has issued a series of documents to promote the development of renewable energy (Yuan et al., 2018). Wind power has grown most rapidly in Europe (Bonou et al., 2016), it provides energy in a cost-effective manner and have great potential and (Dawn et al., 2019), while it has become a promising renewable energy source in China (Shen et al., 2019), with wind power generation capacity having increased from 8.555 MW in March 2014 to 176 MW in September 2018.
According to the analysis of the current situation of China's wind power industry in the electricity market based on data from the State Grid, the relevant data from Clean energy installed capacity (solar, wind, hydropower) shows that hydropower is the largest three types of clean energy power generation capacity, followed by Wind power, and finally solar power, but the growth rate of wind power and solar power is higher than that of hydropower.
In terms of power generation, based on the total value over the past 8 years, thermal power generation is still the largest power generation route in China, and the proportion of renewable energy increases year by year. Taking power generation in September 2018 as an example, thermal power, hydropower, wind power and nuclear power generation accounted for 69.98%, 21.13, 4.31, and 4.58% of total power generation, respectively. However, the growth rate for wind power (from August 2010 to December 2018) is 90.5%, which is higher than the other three categories.
The carbon equivalent of a wind power project (the amount of carbon converted from various alloying elements in steel to the actual eutectic point carbon content) for its entire life cycle is ~2.5 to 7.5 times higher than that of a nuclear power and hydropower projects. It makes significant contributions to alleviating environmental acidification during the operational stage (Wang et al., 2018), and human toxicity, eutrophication and ecological toxicity indicators are significantly reduced (Xu et al., 2018). Hence, wind power will play an important role in clean energy development. In addition, wind power generation is an indispensable part of future power systems.
Policy and economic uncertainties affect business decision-making by influencing the external conditions of business operations and consumer behavior. Policies promote corporate cost reduction, reduce emissions, and encourage enterprises to participate in wind power development (Hitaj and Löschel, 2019). And industrial policies or related countermeasures can help the industry to solve the obstacles in the development of low-carbon energy, thereby achieving low-carbon economy and sustainable development. But uncertainty in economic policies is an economic risk in that enterprises cannot accurately predict the timing and scope of policy implementations (Gulen and Ion, 2015). Economic policies frequently impact enterprises in the Chinese market, and some strategic emerging industries need policy support from the government during the process of development, but policy support and specific implementation times are ambiguous; further, some policies may even restrict development for a period of time, bringing challenges to decision-making for wind power enterprises. Meanwhile, macroeconomic fluctuations have always existed, and financial risks are also unavoidable. It is difficult for enterprises to accurately predict the mode of risk occurrence, the scope of coverage and the degree of risk. Therefore, policies and economic uncertainty lead to unstable responses by enterprises.
In cross-market interdependence research, interdependence is dynamic and unexpected events are the main reasons for the change. Energy prices and the carbon market have an impact on the performance of clean energy enterprises. Some relevant research shows that clean energy stock returns are highly sensitive to crude oil volatility (Dutta, 2017), but international oil prices have little impact on China's new energy stocks (Broadstock et al., 2012). Analysis of the impact of fossil fuels (coal, oil, and natural gas) on clean energy stocks by using the Divisia energy price index (Sun et al., 2018) shows that a slight negative correlation was found between fossil fuels and clean energy stocks. Oil prices have a greater influence on clean energy stocks than technological factors (Henriques and Sadorsky, 2008). Measure-Correlate-Predict (MCP) models and artificial neural network methods are often used to predict wind power potential (Vargas et al., 2019). Methods such as GARCH or Copula are widely using to analyze the dynamic interdependence between markets. As a classic method, GARCH is used when studying the dynamic fluctuations of two factors. Some scholars have studied the relationship between European Union Allowance (EUA) and clean energy stocks by VAR-GARCH (Sadorsky, 2012), and multivariate GARCH is used to analyze oil prices and clean energy and technology company stock prices.
At present, the development of low-carbon energy has a wide and profound social impact, and its related deployment and the corresponding changes in government policies will also have an impact on the development of energy companies, and its mechanism of action is particularly important in environmental protection and low-carbon energy development. As a renewable energy source, wind power has great potential for development, but the development of wind power enterprises is affected by many factors, such as talent technology, capital costs, fluctuations in relevant economic interest rates, etc., among which the policy and economic environment are the key factors affecting the decision-making of wind power enterprises. This paper analyzes the development status of the wind power industry with panel data, the dependence relationship between carbon efficiency (tons of the company's CO2 equivalent divided by the company's annual revenue) and wind power enterprise performance, the sudden changes of dependence and the causes of the impacts.
Current Status of Wind Power
According to a report issued by the National Energy Administration, during 2014 and 2015, the largest grid-connected capacity of wind power was in the northwest of China. The province with the greatest grid-connected capacity in 2014 was Xinjiang, and its proportion reached 22%. The added grid-connected capacity of Shanxi and Shandong declined slightly during the period from 2015 to 2017, but it began to rise again in 2018. The implementation of offshore wind power projects in Weifang and other areas is an important factor for the increase in the wind power capacity of Shandong. The province with the largest grid-connected capacity in 2015 was Gansu Province (15%), followed by Ningxia Province (14%). Ningxia Province and Inner Mongolia had large amounts of new wind capacity in the period of 2014-2015, but over the next 3 years, this new capacity quickly returned to a low level.
In 2016, the new grid-connected capacity from wind power was mainly in Yunnan (28%). Yunnan's share in the previous 2 years increased steadily. After a surge in 2016, it quickly declined to below 5%. Jiangsu's new grid-connected capacity accounted for 9% of total capacity in 2016. Since 2014, the new grid-connected capacity of wind power in Jiangsu has been relatively stable, but it has only plummeted since 2017. At the same time, the new grid-connected capacities for Qinghai, Hebei and Henan were all quite close, at ~10% of total capacity. Henan and Hebei had less grid-connected capacities during 2014-2016, and they gradually expanded this capacity after 2017. In 2018, the largest grid-connected capacities from wind power were in Shanghai (12%), followed by Hainan (11%) and Shandong (11%), which was also related to the recent development of offshore wind power projects.
Abandoned wind energy and abandonment rate have always been important factors in recent years and hinders further development of wind power. Both of them are due to the large installed capacity of the power station where the wind power generation is located, which exceeds the local electricity consumption. In addition, the power grid configuration is low, and the electric energy cannot be sent out, resulting in the abandonment of wind power. Abandonment rate refers to the percentage of waste electricity to total wind power. The Figure 1 shows the amounts of abandoned wind power for each province in the first half of 2014-2018. Cities or provinces without wind abandonment can be divided into two categories. One represents those cities with more developed economies, represented by Shanghai, Jiangsu, Zhejiang, and Fujian. They have sufficient capacity to utilize the generated wind power, and the other category is represented by cities with small installed wind power capacities, such as Chongqing, Sichuan, Anhui, and Jiangxi.
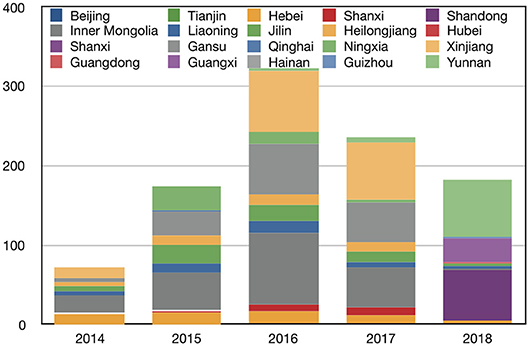
Figure 1. Abandoned wind volume (100 million kWh).
During the years from 2014 to 2017, the northwest and northeast regions exhibited extremely serious abandoned wind problems. Inner Mongolia exhibited the largest amount of abandoned wind power from 2014 to 2016, and the amount of abandoned wind accounted for 32, 27, and 28%, respectively for these years, but this amount decreased slightly in 2017; however, the problem of wind abandonment in Inner Mongolia greatly improved in 2018. The proportion of abandoned wind power dropped rapidly to 1%. Xinjiang is also a region showing a serious problem with abandoned wind power. The proportion of abandoned wind power increased gradually from 19 to 31% from 2014 to 2017. In 2016, the rate of abandoned wind power was the highest, reaching 45%. The abandonment of wind power in Gansu and Xinjiang were similar, with both showing gradual increases in 2014-2017; the highest rate of windfall reached 47%. Ningxia's proportion of abandoned wind power in 2015 was 17%, but it declined rapidly in the next few years and fell to 1% in 2017. Since 2014, Heilongjiang, Liaoning, and Jilin in the northeastern region have shown a gradual decline in the proportion of abandoned wind power, but the abandonment rate in 2015 and 2016 has increased, indicating that the utilization rate of wind power in these areas is decreasing.
After 2017, the problem of wind power abandonment in the northwestern and northeast regions has greatly improved. The new abandonment problem is in Yunnan, Guangxi, and Shandong, which have recently begun to vigorously develop wind power projects. The levels of abandoned wind power in Shandong Province between 2014 and 2015 have been fluctuating by 1%. In 2018, the abandoned wind power surged to 6.31 billion kWh and the rate of abandoned wind power reached 16.7%. The abandonment rate for Yunnan during the period from 2014 to 2017 remained below 5%, but increased to 28.9% in 2018 and the abandonment of wind power has reached a total of 7.13 billion kWh. In Guangxi, the amount of abandoned wind power in 2018 was 3.01 billion kWh, and the rate of abandoned wind power reached 20.5%.
Figure 2 shows the daily closing price fluctuations of some representative wind power company stocks from 2011 to 2018, that is the performance of wind generation manufacturers, and the legend shows the stock codes. Codes 300040, 300499, and 601991 belong to power generation companies, while codes 002080, 600192, 002576 belong to wind power equipment production companies. Table 1 is a statistical description of the daily closing price for these stocks.
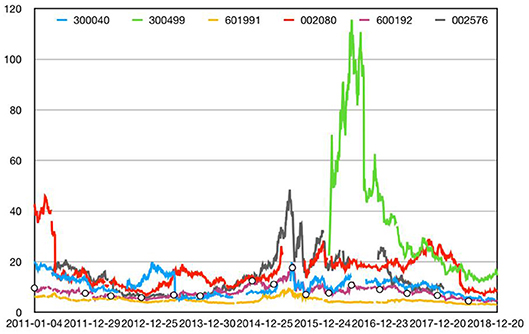
Figure 2. Performance of wind power generation enterprises.
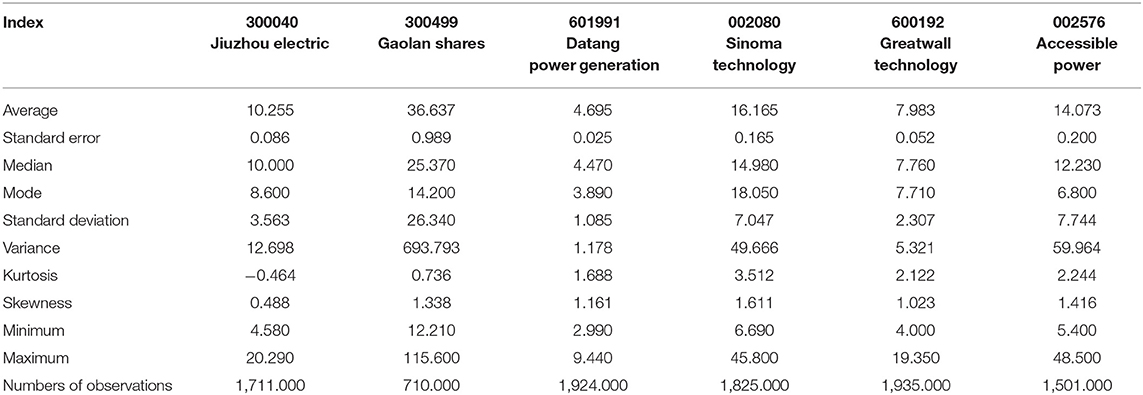
Table 1. Descriptive statistics of wind power enterprise performance data.
Among these, the highest average is for 600499, but this is also the stock showing the largest variance, indicating that the daily closing price fluctuates drastically and that its price is unstable. The kurtosis for stock code 600040 is negative, indicating that there are extremes on both sides of the sample set. The stock price data of the six companies is greater than zero, which proves that the stock price data is right-biased. From the time series, the stock price average near the current time node is larger.
Data and Methods
Data Sources and Description
For the empirical analysis of the relationship between carbon efficiency and wind power enterprise performance from the financial perspective, the characterization indicators selected the SSE 180 carbon efficiency index from December 2016 to November 2018 and the daily closing price data of the wind power sector (data is from tonghuashun database), as shown in Figures 3–6. The SSE 180 carbon efficiency index is a type of green index. The difference from other environmental protection indexes is that the SSE 180 carbon efficiency index mainly reflects carbon emissions from enterprises.
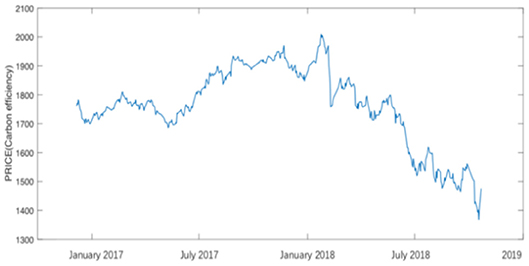
Figure 3. Carbon efficiency.
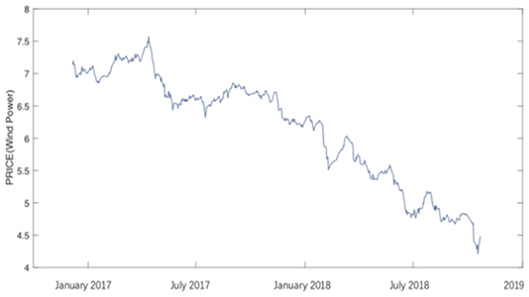
Figure 4. Wind power daily closing price.
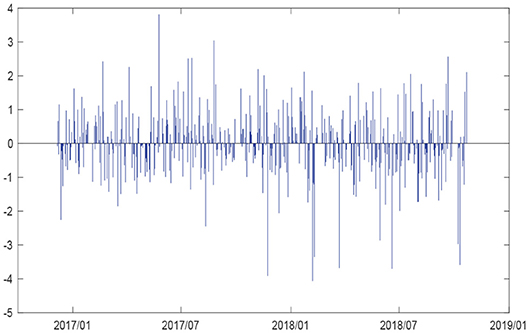
Figure 5. Residual sequence of carbon efficiency.

Figure 6. Residual sequence of wind power.
A statistical description of the daily closing price of wind power enterprises and carbon efficiency data is shown in the Table 2.
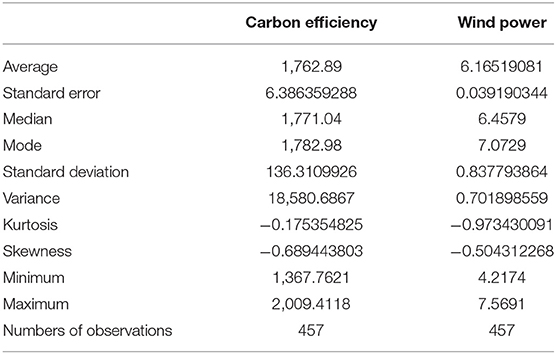
Table 2. Statistical description.
Both carbon efficiency and wind power data are negatively distributed, and the skewness is less than 0, indicating that the data to the left side of the mean are more dispersed. The kurtosis of both datasets is less than zero, indicating that the two datasets are flatter than the positive distribution, the extreme data at both ends is greater, and the wind power data is flatter than the carbon efficiency data.
Model Specifications
The multivariate DCC-GARCH model is used in this paper. The research object is two time series y1,t and y2,t(t=1, 2, … T). In related research in the financial field, the GARCH (1,1) model is used according to the AIC (Akaike Information Criterion), and the mean equation is ARMA (1,1), which is stated as:
where, , and Yt−1 represents the previous period in the time series, λ is an n×1 constant matrix, Φ1 is an n×1 autoregressive coefficient matrix, θ is an n×1 moving average coefficient matrix, and εt is a residual sequence, given by:
where, is a positive definite matrix, so Ht is the conditional covariance matrix of yt. zt is i.i.d. Ht is written as:
where, Dt = diag(hii,t, hjj,t). In actual analysis, it is difficult to achieve a constant conditional correlation. Therefore, Engle (2002) and Tse and Tsui (2002) proposed the DCC model to achieve a dynamic condition correlation, so that Rt can change with time, and Rt is the correlation matrix.
hii,t, hjj,t are based on GARCH(1,1), its conditional variance is:
In the DCC-GARCH model, Rt needs to be transformed and positive at each time point, so the process of constraining through Qt, is the mean value, and a + b < 1.
The parameters in the model are estimated by the quasi-maximum likelihood method.
Empirical Results and Discussion
Results of Relevance
The calculation results using the r software are shown in the Table 3.
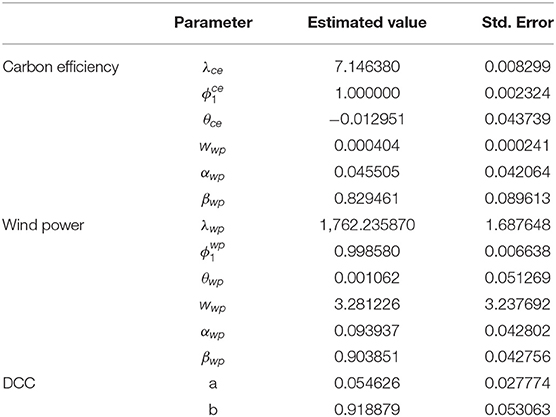
Table 3. DCC-GARCH model fitting results.
The residual sequence is shown below.
Figure 7 shows the trends in the dynamic relationship of carbon efficiency and wind power enterprise performance from December 5, 2016 to October 19, 2018. As shown in the Table 4 below, the mean value of the dynamic condition correlation is 0.66, which is greater than 0.5; this result proves that there is a clear dynamic dependence between carbon efficiency and wind power enterprise performance. In December 2016, the average dynamic condition correlation was 0.69. The average value of the dynamic condition correlation coefficient in 2017 was 0.59, which is below the average. The average dynamic condition correlation coefficient in 2018 was 0.74, indicating that carbon efficiency and wind power enterprise performance were more closely related in 2018.
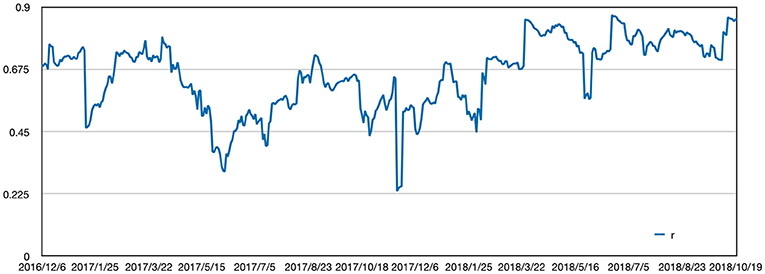
Figure 7. Dynamic condition correlations.
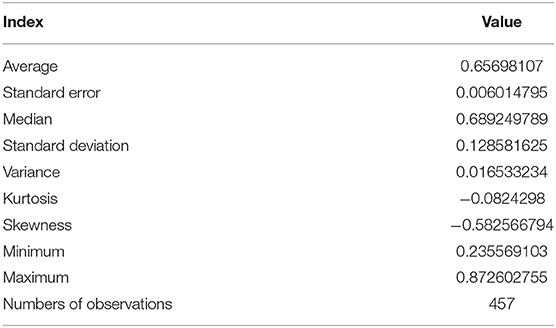
Table 4. Dynamic condition correlation statistical description.
Analysis of the Change of Dependence Relations
According to Figure 8, the immediate timing of sudden drops or surges in the correlation coefficient corresponds to the moments when China and the United States make important decisions regarding their trade relations. As shown in Table 5, on March 22, the Trump administration announced that it might impose a $60 billion tariff on China. After that, China and the United States entered the first round of negotiations. On May 19, the two governments issued a joint statement and the two sides agreed to take certain measures that have reduced the trade deficit with the United States. However, on May 29, the White House suddenly issued a statement that it would impose a 25% tariff on $50 billion of goods imported from China, and the two governments then entered a second round of negotiations. On June 15, the United States issued a list of tariffs.
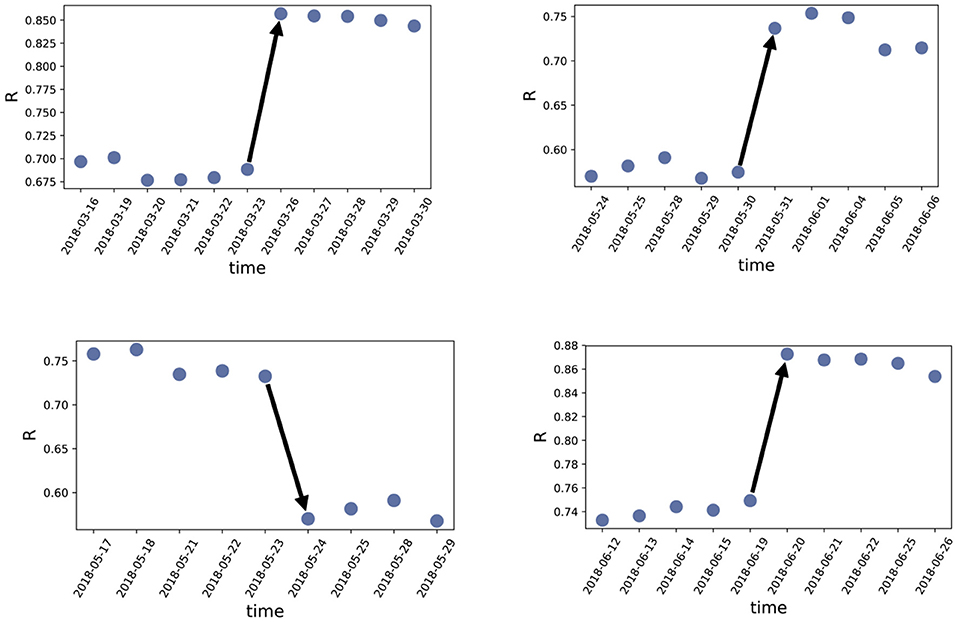
Figure 8. Impact of the trade policy.
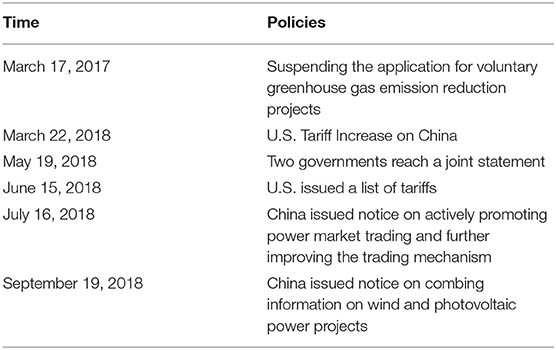
Table 5. Relevant policies.
The Shanghai Composite Index is at a concave inflection point for three rising time points, which may be partly reflected by the fact that the financial markets did not perform poorly after the trade war officially began. At the same time, before March 22, the Trump administration issued a statement that it would tax the Chinese steel industry. As an indispensable raw material for construction in the wind power industry, the competitive price advantage in US market will be weakened, overseas demand will decrease, and domestic supply will increase, leading to a short-term price decline. This reduces the costs for wind power enterprises and improves their profitability, which is beneficial to their performance. Similarly, in the stock market, the wind power sector is divided into trade warfare earnings shares, which can also benefit. The trade war also influences investor sentiment. The Shanghai Composite Index has generally declined since March, investors have become more cautious, their investment behavior in the wind power industry will be reduced from the perspective of economic profitability, and the influence of green preferences by investors on the performance of wind power enterprises will be strengthened. On March 22, the China Energy Administration stated at a meeting that it will further promote the development of renewable energy, deepen reform of the power system, promote the healthy development of industries including wind power and that the policy is industrial encouragement. These are reasons for increasing correlations.
On May 19, the correlation between carbon efficiency and the performance of wind power enterprises dropped sharply. This may be due to the joint statement by the two governments on May 19 that measures would be taken to reduce the deficit. The statement temporarily eased tensions in the trade war and alleviated investor concerns regarding the Chinese economy, resulting in a sharp decline in dynamic dependency, which was almost the same as the increase in the sudden announcement of tariffs on $50 billion on May 29. After two rounds of trade war negotiations, the government and the market have psychological expectations due to the uncertain consequences. Therefore, the impact of policy uncertainty on the correlation between carbon efficiency and wind power enterprise performance will decrease.
When the relevant policy is conservative or tight for the wind power market, the correlation decreases. For example, the National Development and Reform Commission issued an announcement (No. 2, 2017), suspending the application for voluntary greenhouse gas emission reduction projects, due to a non-standard carbon trading market, and the Interim Measures for the Management of Voluntary Greenhouse Gas Emission Reduction Transactions, issued in 2012 were revised, the carbon trading market is facing reorganization. At that time, the relationship between carbon efficiency and wind power enterprise performance weakened. On September 19, 2018, the General Department of the State Energy Administration issued the first Notice on Combing Information on Wind and Photovoltaic Power Projects since the Twelfth Five-Year Plan, which abolished some of the wind power projects that had been planned but had not yet been completed. This policy aims to improve the problem of wind abandonment and prevent short-term over construction leading to energy waste. However, the relationship between carbon efficiency and the performance of wind power enterprises has dropped sharply because the information conveyed by this policy to the market is that the development of clean and carbon-efficient enterprises is limited, thus the dynamic conditions correlation coefficient decreases, as shown in Figure 9.
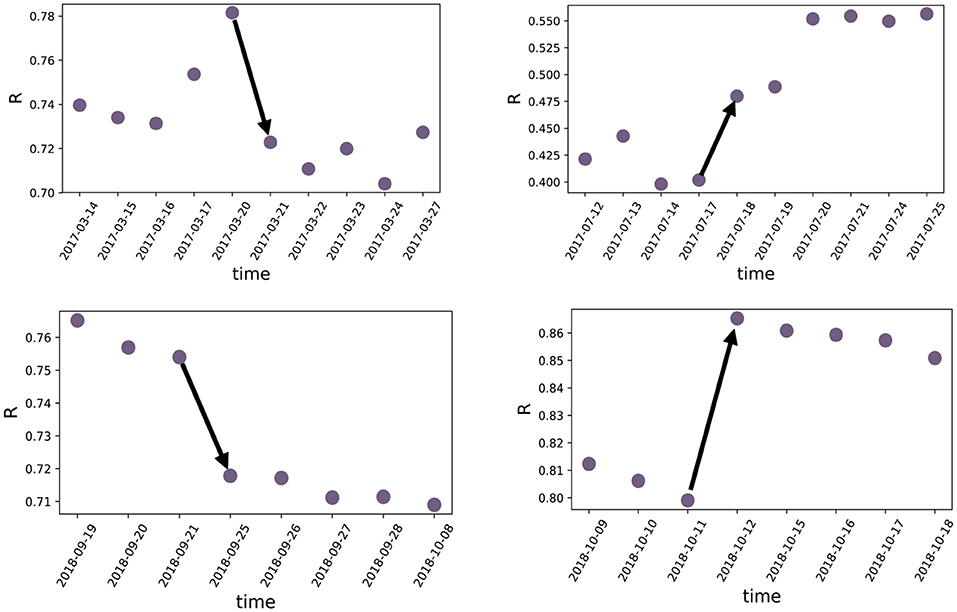
Figure 9. Impacts of economic policy.
Conversely, when the relevant policies are to encourage the wind power market or low carbon emission, the correlation will increase. On July 16, 2018, the National Development and Reform Commission and the National Energy Administration jointly issued the “Notice on Actively Promoting Power Market Trading and Further Improving the Trading Mechanism,” proposing to promote the optimization of large-scale resource allocation and the usage of clean electricity, and to establish a clean energy quota system as soon as possible. On September 28, 2018, the North China Regulatory Bureau of the State Energy Administration promulgated the Beijing-Tianjin-Hebei Green Power Market Trade Rules (Trial Implementation). The policy is to take the approach of guaranteed acquisition of part of the renewable energy power generated and to strengthen the market-oriented transaction of parts other than the guaranteed acquisition of electricity.
Measures to protect the wind power industry and to promote the market-oriented trade of wind power and the decline in the raw materials market have led to a sharp increase in the dependence of carbon efficiency and the performance of wind power enterprises, as shown in Figure 10.
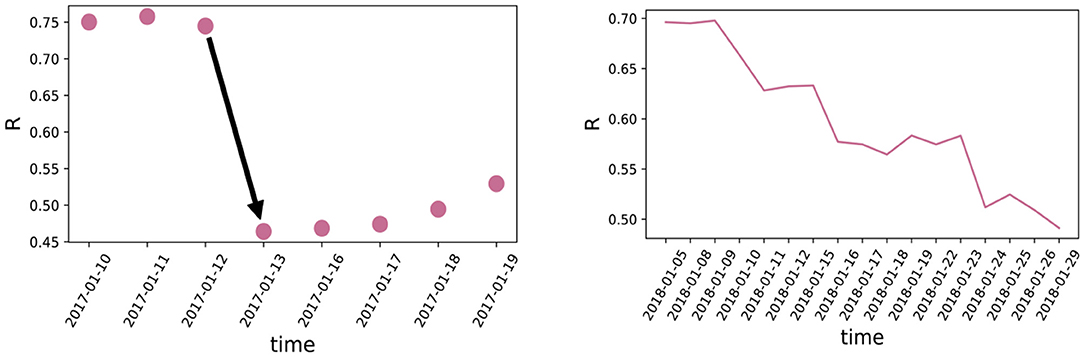
Figure 10. Impacts of economy.
Market changes in traditional energy and raw materials also have an impact on the correlations. When the futures market for traditional energy and raw materials rises sharply, the correlation weakens. For example, on January 11, 2017, coke, iron ore and threaded steel futures rose sharply, increasing by 8.98, 8, and 6.99%, respectively. The dynamic conditions correlation coefficient declined sharply. From Jan. 4 to Jan. 29, 2018, the prices of oil, coal and liquefied natural gas increased due to climate and other factors, and the correlation decreased.
However, there do exist several special situations, when the correlation not only changes by the fluctuation of trade or economic policy and related raw material market. For example, on January 16, 2017, there was a significant decline in correlation of about 39%, but no relevant policies were issued at that time, and the change may be due to the sharp fluctuation of the stock market.
Conclusions
According to the fitting results, the dynamic condition correlation coefficient shows that the average dependence degree is highest in 2018 (0.74) over these 3 years, and the minimum value was 0.59 in 2017. The maximum difference of the dynamic condition correlation coefficient reached 0.6371, and there were some sharp fluctuations at some time nodes.
Policy and economic changes can lead to fluctuations in dynamic conditional correlation coefficients. Policy uncertainties mainly affect the correlations through national economic policies and international trade policies. Sudden international trade policy changes, such as the tariff increase during the trade war, have a short-term impact on this relationship, which is reflected in the sudden drops or surges in the dynamic condition correlation coefficient. The domestic industrial policy also impacts the relationship between carbon efficiency and wind power enterprise performance over short periods of time.
When the national policies are positive for the wind power industry, such as promoting a clean electricity quota system, market-oriented transactions, and urging the implementation of subsidies, the correlations have become tight; when the state adopts austerity policies for the wind power industry, such as restricting the addition of wind power projects and suspending applications for voluntary emission reduction projects, the dynamic condition correlation coefficient plummets. The impact of trade channels on the correlations is mainly reflected by the fluctuations of alternative energy prices of wind energy. When the prices of oil, coal, or steel rise or the clean energy sector falls, the dynamic condition correlation coefficient tends to decline gradually. The speculative psychology of investors is greatly affected by the macroeconomic environment and by short-term financial trends. The price of energy and the updated status of related policies may also face uncertain effects throughout the industrial life cycle. These effects will produce a series of deviations from the performance of the company and accumulate effects. As a result, energy companies fully understanding these impacts and actively paying attention to government industrial policies will avoid unnecessary deviations from plans, thereby achieving harmonious and stable sustainable development between the company and the environment.
Therefore, wind power enterprises should pay close attention to sudden trade policy changes and to changes in the macroeconomic environment, and they should respond to environmental uncertainties by formulating different business decisions. The government can establish an effective incentive mechanism for carbon emission efficiency and introduce a moderate competition mechanism into the electricity market. Then through low-carbon energy management, maintain the coordination and common development of economy and environment.
Data Availability Statement
The original contributions presented in the study are included in the article/supplementary material, further inquiries can be directed to the corresponding author/s.
Author Contributions
TZ: conceptualization, methodology, software, supervision, writing-reviewing and editing. XQ: data curation and writing- original draft preparation. All authors contributed to the article and approved the submitted version.
Funding
This research was supported by the NSFC (Grant No. 71801224) and the Fundamental Research Funds for the Central Universities of P. R. China (20CX04002B).
Conflict of Interest
The authors declare that the research was conducted in the absence of any commercial or financial relationships that could be construed as a potential conflict of interest.
References
Bonou, A., Laurent, A., and Olsen, S. I. (2016). Life cycle assessment of onshore and offshore wind energy-from theory to application. Appl. Energy 180, 327–337. doi: 10.1016/j.apenergy.2016.07.058
Broadstock, D. C., Cao, H., and Zhang, D. (2012). Oil shocks and their impact on energy related stocks in China. Energy Econ. 34, 1888–1895. doi: 10.1016/j.eneco.2012.08.008
Dawn, S., Tiwari, P. K., Goswami, A. K., Singh, A. K., and Panda, R. (2019). Wind power: existing status, achievements and government's initiative towards renewable power dominating India. Energy Strategy Rev. 23, 178–199 doi: 10.1016/j.esr.2019.01.002
Dutta, A. (2017). Oil price uncertainty and clean energy stock returns: new evidence from crude oil volatility index. J. Clean. Prod. 164, 1157–1166. doi: 10.1016/j.jclepro.2017.07.050
Engle, R. (2002). Dynamic conditional correlation: a simple class of multivariate generalized autoregressive conditional heteroskedasticity models. J. Bus. Econ. Stat. 20, 339–350. doi: 10.1198/073500102288618487
Gulen, H., and Ion, M. (2015). Policy uncertainty and corporate investment. Rev. Finan. Stud. 29, 523–564. doi: 10.2139/ssrn.2188090
Henriques, I., and Sadorsky, P. (2008). Oil prices and the stock prices of alternative energy companies. Energy Econ. 30, 998–1010. doi: 10.1016/j.eneco.2007.11.001
Hitaj, C., and Löschel, A. (2019). The impact of a feed-in tariff on wind power development in Germany. Resour. Energy Econ. 57, 18–35. doi: 10.1016/j.reseneeco.2018.12.001
Hongtao, L., and Wenjia, L. (2018). The analysis of effects of clean energy power generation. Energy Proc. 152, 947–952. doi: 10.1016/j.egypro.2018.09.098
Sadorsky, P. (2012). Correlations and volatility spillovers between oil prices and the stock prices of clean energy and technology companies. Energy Econ. 34, 248–255. doi: 10.1016/j.eneco.2011.03.006
Shen, G., Xu, B., Jin, Y., Chen, S., Zhang, W., Guo, J., et al. (2019). Monitoring wind farms occupying grasslands based on remote-sensing data from China's GF-2 HD satellite—A case study of Jiuquan city, Gansu province, China. Resour. Conserv. Recycl. 121, 128–136. doi: 10.1016/j.resconrec.2016.06.026
Sun, C., Ding, D., Fang, X., Zhang, H., and Li, J. (2018). How do fossil energy prices affect the stock prices of new energy companies? Evidence from Divisia energy price index in China's market. Energy 169, 637–645. doi: 10.1016/j.energy.2018.12.032
Tse, Y. K., and Tsui, A. K. C. (2002). A multivariate generalized autoregressive conditional heteroscedasticity model with time-varying correlations. J. Bus. Econ. Stat. 20, 351–362. doi: 10.1198/073500102288618496
Vargas, S. A., Esteves, G. R. T., Maçaira, P. M., Bastos, B. Q., Oliveira, F. L. C., and Souza, R. C. (2019). Wind power generation: a review and a research agenda. J. Clean. Prod. 218, 850–870. doi: 10.1016/j.jclepro.2019.02.015
Wang, L., Wang, Y., Zhou, Z., Garvlehn, M. P., and Bi, F. (2018). Comparative assessment of the environmental impacts of hydro-electric, nuclear and wind power plants in china: life cycle considerations. Energy Proc. 152, 1009–1014. doi: 10.1016/j.egypro.2018.09.108
Xu, L., Pang, M., Zhang, L., Poganietz, W.-R., and Marathe, S. D. (2018). Life cycle assessment of onshore wind power systems in China. Resour. Conserv. Recycl. 132, 361–368. doi: 10.1016/j.resconrec.2017.06.014
Yang, J., Zhang, W., and Zhang, Z. (2016). Impacts of urbanization on renewable energy consumption in China. J. Clean. Prod. 114, 443–451. doi: 10.1016/j.jclepro.2015.07.158
Keywords: time-varying, DCC-GARCH, environmental uncertainty, wind power, deviation
Citation: Zhang T and Qi X (2020) Analysis of Performance Deviation of Wind Power Enterprises in China. Front. Energy Res. 8:126. doi: 10.3389/fenrg.2020.00126
Received: 22 April 2020; Accepted: 27 May 2020;
Published: 30 June 2020.
Edited by:
Jianliang Wang, China University of Petroleum, ChinaReviewed by:
Yudong Wang, Nanjing University of Science and Technology, ChinaLing Tang, Beihang University, China
Copyright © 2020 Zhang and Qi. This is an open-access article distributed under the terms of the Creative Commons Attribution License (CC BY). The use, distribution or reproduction in other forums is permitted, provided the original author(s) and the copyright owner(s) are credited and that the original publication in this journal is cited, in accordance with accepted academic practice. No use, distribution or reproduction is permitted which does not comply with these terms.
*Correspondence: Tao Zhang, emhhbmd0YW9AdXBjLmVkdS5jbg==