 Chengqi Wang
 Xiaodong Sun
 Piyush Sabharwall
- 1Department of Nuclear Engineering and Radiological Sciences, University of Michigan, Ann Arbor, MI, United States
- 2Idaho National Laboratory, Idaho Falls, ID, United States
One of the key postulated accidents in a high-temperature gas-cooled reactor (HTGR) is the pressurized loss of forced cooling (P-LOFC) of the primary loop, which can be triggered by its primary helium circulator trip or turbine trip. If the reactor shutdown cooling system (SCS) fails during a P-LOFC accident, part of the reactor decay heat is absorbed by the reactor core materials and the rest removed by the reactor cavity cooling system (RCCS). In the extended period of P-LOFC accident, compounded with SCS failure, the core decay heat is supposed to be removed by conduction, natural circulation/convection, and radiation. Three-dimensional computational fluid dynamics (CFD) simulations were performed in this research to study the long-term heat removal mechanisms in the General Atomics' Modular High Temperature Gas-cooled Reactor (MHTGR) design during a P-LOFC accident. The reactor core temperature distribution and flow field were obtained at different decay power levels. The sensitivity of the natural circulation flow to the bypass gap width was investigated. The natural circulation flow intensity is relatively weak but very sensitive to the width of the bypass gaps.
Introduction
The high-temperature gas-cooled reactors (HTGRs) have received great attention due to their potential to provide high-temperature process heat in addition to their high thermal-to-electric power conversion efficiency and inherent safety features (Alonso et al., 2014; Fang et al., 2017; Wang et al., 2019). One of the postulated accidents in HTGRs is the pressurized loss of forced cooling (P-LOFC), which is caused by an abnormal trip of the main helium circulator or turbine in the power conversion system. During a P-LOFC accident, core decay heat will be removed by a combination of heat conduction, natural circulation/convection, and finally thermal radiation to the reactor cavity cooling system (RCCS), so the maximum fuel temperature does not exceed the design limit. To perform reactor safety analysis, validated system-level analysis codes are usually adopted to analyze reactor transients and accidents. For example, steam ingress accidents in HTGRs were investigated using a code named RETRAN-02 (Wang et al., 2014) and air-ingress accidents in Gas Turbine Modular High-temperature Reactor (GT-MHR) were studied using GAMMA (No et al., 2007), and RELAP5 (Jin et al., 2012). The P-LOFC accident in the Pebble-bed Modular High-Temperature Gas-cooled Reactor (HTR-PM) was studied using TINT and SPECTRA (Zheng et al., 2018) and their results showed that the fuel temperature design limit, 1,630°C, was not exceeded during the accident. However, the geometries used in the system-level code analyses are usually simplified, which could lead to misleading results under certain circumstances (Oh et al., 2011a, 2012).
In General Atomics' (GA's) Modular High Temperature Gas-cooled Reactor (MHTGR) design, the reactor relies on its shutdown cooling system (SCS) to cool down after reactor scram (U.S. Department of Energy, 1986). However, if the SCS fails to start, the reactor has to remove the core decay heat via passive means. Under this circumstance the materials in the reactor core, especially the graphite, serve as temporary energy storage before passive heat removal capacity exceeds the core decay power. Limited experimental studies are available for P-LOFC accidents in the literature. A prismatic HTGR P-LOFC accident without reactor scram was performed using the High-Temperature engineering Test Reactor (HTTR) (Takamatsu et al., 2014). In addition, an experimental study was performed using a scaled-down, reduced-pressure, dual coolant channel facility and the experimental results showed that the heat transfer coefficient and Nusselt number increased with increasing helium pressure (Said et al., 2018). While the experiment provided very useful information to better understand the accident, three shortcomings were noted: the natural circulation flow velocity was not measured; the boundary conditions applied to the two channels did not necessarily represent the prototypic conditions; and the dual coolant channel experiment did not provide sufficient information to allow readers to estimate the helium velocity and temperature fields during a P-LOFC accident. On the modeling and simulation side, Tung and Johnson (2011) using computational fluid dynamics (CFD), simulated the natural circulation flow pattern in a 1/12 section of a fuel column. Nevertheless, the 1/12 fuel column model cannot reflect the scenario in the prototypic accident because the model assumed all vertical boundaries were symmetric. In reality, heat flux can cross these “symmetric” boundaries depending on the locations of the fuel columns in the core.
To obtain more accurate flow and temperature distributions in an HTGR core under a P-LOFC accident, it is desirable to include in the model all the heat transfer paths, including: the fuel columns, graphite reflectors, helium flow, and reactor pressure vessel (RPV) wall. However, a CFD simulation including all these domains with their prototypic structural features will be very computationally expensive. For example, in GA's MHTGR design, there are about 7,000 coolant channels with a diameter of 15.8 mm and a length of 7.93 m in the active core, which can require billions of mesh elements. Therefore, appropriate simplifications will have to be made to avoid generating overly fine meshes for each individual coolant channel. One strategy is to simplify the fuel columns to a homogeneous porous medium. Using this method, an air ingress accident in the GT-MHR, following a double ended guillotine break on the cross duct, was investigated by Oh et al. (2012). A similar strategy was applied to study the steam and air ingress accidents in HTR-PM and the associated graphite reaction (Ferng and Chen, 2011; Ferng and Chi, 2012a,b). In our current study, the porous medium flow model is adopted to study reactor decay heat removal during an extended period of the P-LOFC accident combined with SCS failure in GA's MHTGR.
CFD Modeling Method
Geometry and Mesh Generation
GA's MHTGR was chosen as the reference design in this research. The active core of MHTGR consists of 66 fuel columns (U.S. Department of Energy, 1986). These fuel columns form an annular region that is surrounded by replaceable graphite reflectors on the inner, outer, top, and bottom sides. The weight of the active core and the replaceable reflectors is loaded onto the graphite posts in the hot plenum just below the reactor core. Permanent graphite reflectors are installed in the annulus between the outer replaceable reflectors and core barrel. In the free volume between the core barrel and the RPV wall, 12 coolant risers are designed to lead the primary helium flow into the upper plenum during normal reactor operation. The MHTGR design is schematically shown in Figure 1A with a side cut view of the RPV and in Figure 1B with a cross-sectional view of the reactor core. In our current study, a 1/12 sector of the core (the highlighted section in Figure 1B) is simulated to take advantages of the azimuthal symmetry of the core.
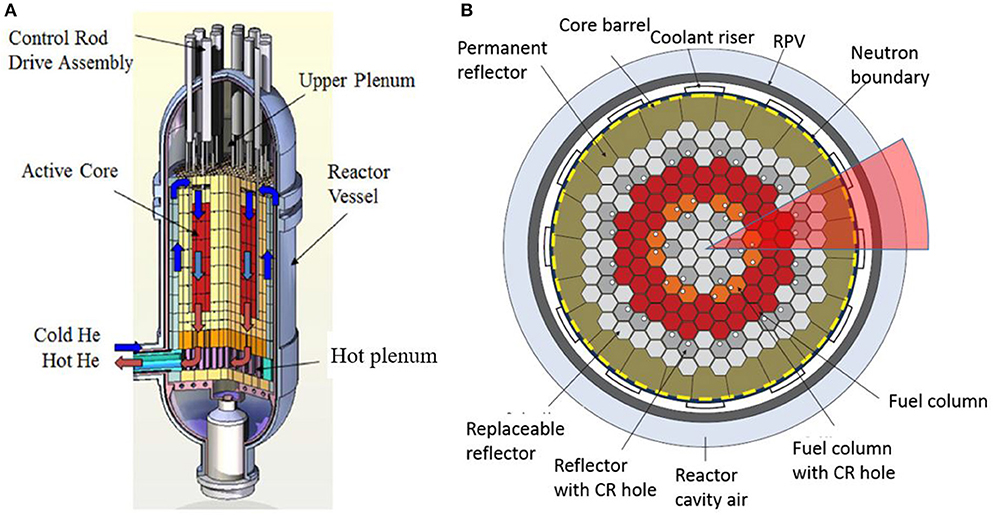
Figure 1. MHTGR design: (A) cut away view of the RPV and (B) cross-sectional view of the reactor core (Nuclear Energy Agency, 2018).
Even with the 1/12 reactor core, maintaining all the detailed structures is still very expensive, if not infeasible, given the computational resources available to the group. Therefore, additional simplifications were made to accelerate the computation. First, the fuel columns and bypass flow gaps between graphite reflectors were regarded as homogeneous porous bodies. The porous body simplification will be discussed in section Porous Medium Parameters. During a P-LOFC accident global natural circulation flow through the primary loop is negligible because the primary loop will be shut off by closing the shut-off valve on the helium circulator. In addition, the lower elevation of the steam generator (SG) prevents a global natural circulation flow from forming. Therefore, it was assumed there is no helium exchange between the upper plenum and coolant risers. Accordingly, the zig-zag helium distribution system below the hot plenum was neglected since it is no longer accessible to the helium flow. Finally, one equivalent helium gap was built to replace the 12 individual coolant risers between the core barrel and RPV wall. The two symmetric planes of the simulation domain are depicted in Figure 2A. A cross-sectional view of the active core and the hot plenum is depicted in Figure 2B. There are seven fuel columns labeled as 1–7 as shown in Figure 2B, which will be referred to in the results section.
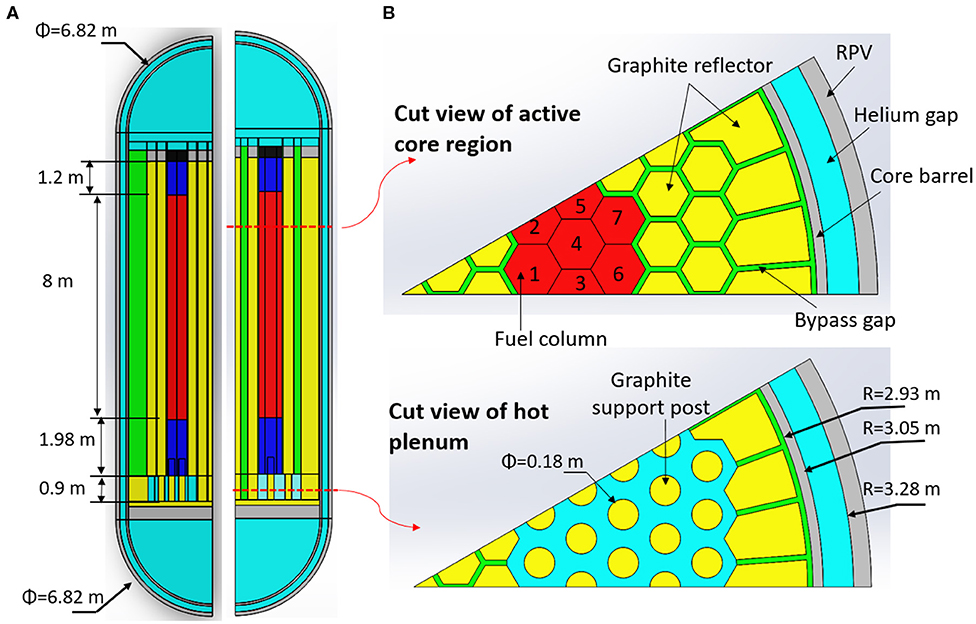
Figure 2. Structure of the simulated domains: (A) two symmetric planes and (B) cross-sectional views of the active core and hot plenum.
In the simulation domain, there are more than one hundred components. Therefore, the meshes were created separately for different domains using ANSYS Meshing or ICEM to take advantage of their abilities in capturing a specific geometric feature. The meshes were then imported to ANSYS Fluent 19.1 (ANSYS Inc., 2018), and merged using the interface tool. The realizable k-ε turbulence model with scalable wall functions was applied to accommodate different mesh sizes. To satisfy the requirements of the turbulence model, the meshes were refined in the near-wall region. The y+ value range is about 50–150 for most regions but some local points have a y+ value <10. The meshes of the fuel columns, hot plenum, and bypass gaps are depicted in Figure 3A with a detailed view of the mesh interfaces shown in Figure 3B. Before the simulation, a mesh independence study was performed. However, the mesh independence study was not performed on the whole integrated model. Instead, grid independence was verified for each flow region separately. For example, the natural circulation flow between the core barrel and RPV was studied using meshes with different sizes, aspect ratio, and prism layer thickness until mesh-independent results were obtained. Then, the mesh information was recorded and applied to the whole integrated model. A total of about 35.7 million mesh elements were generated with a minimum quality of 0.4. The simulated domains and their respective mesh sizes are summarized in Table 1.
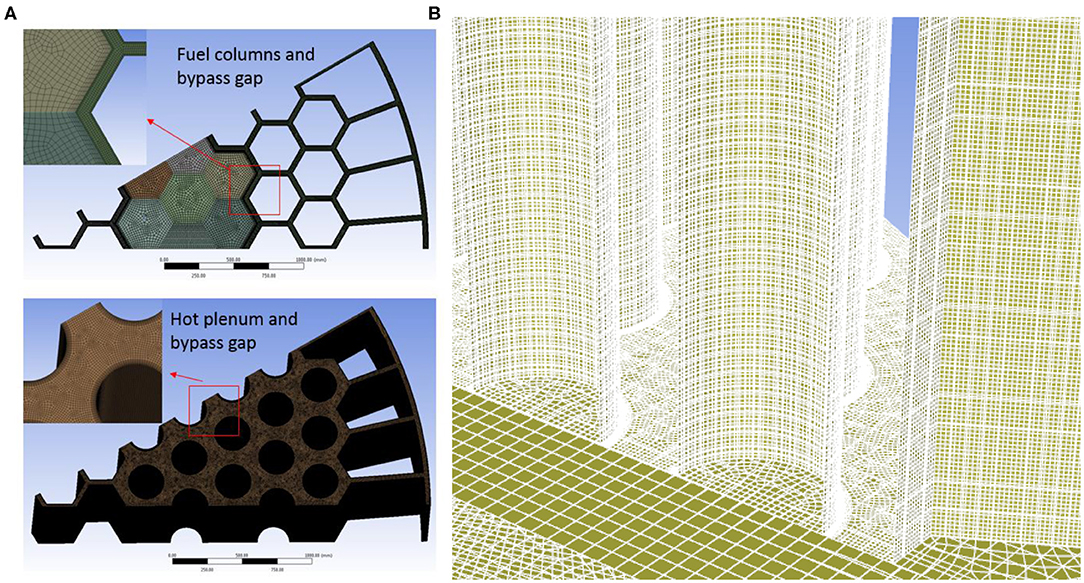
Figure 3. Mesh generation for the: (A) fuel columns, hot plenum, bypass gaps, and (B) mesh interfaces.
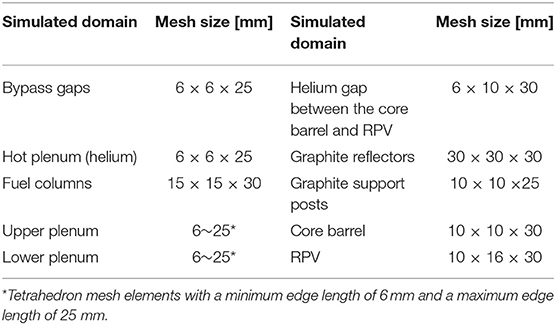
Table 1. Mesh sizes for each computation domain.
Governing Equations and Boundary Condition
The steady-state continuity, momentum and energy equations are solved simultaneously in this model. Equations (1) and (2) are the continuity and momentum equations, respectively, and Equations (3)–(5) are the energy equations for the free flow, reactor solid structure, and porous flow, respectively:
where ρ, , p, , , k, T, and are, respectively, the density, velocity, pressure, stress tensor, gravity acceleration, thermal conductivity, temperature, and power density. The subscript f and s indicate fluid and solid, respectively. The porous flow shares the same continuity and momentum equations with the free flow except that the velocity in porous flow is superficial velocity, defined as , where ε is the porosity. The momentum source in porous flow is discussed later. The effective thermal conductivity keff in Equation (5) is defined as keff = εkf+(1−ε)ks.
In this study, the helium gas was treated as a compressible ideal gas when calculating its density. The Nuclear Safety Standards Commission (KTA) correlations were adopted for its other thermophysical properties (Nuclear Safety Standards Commission, 1978):
It should be noted the units of temperature T and pressure p in Equations (7) and (8) are K and bar, respectively.
The thermal conductivity of un-irradiated graphite IG-110 is about 80–126 W/m-K and its value decreases with increasing temperature (Sumita et al., 2009; Oh et al., 2011b). The irradiated nuclear graphite IG-110 is less sensitive to its temperature, which varies between 30 and 52 W/m-K depending on the irradiation damage level (Sumita et al., 2009). Therefore, in this study, the graphite thermal conductivity was set as 50 W/m-K. The thermal conductivity of core barrel and RPV, in units of W/m/K, was calculated using the correlation for Alloy 800H (T in K):
Since this study focuses on the decay heat removal after a natural circulation flow through the reactor core has been established, the reactor core is cooled down slowly, which could be reasonably regarded as a quasi-steady state condition (Oh et al., 2012). The heat source is the decay heat from the active fuel columns and the final heat sink is the RCCS. The core axial power profile for each fuel ring was divided into three regions with a parabolic curve fit to the results by Strydom and Epiney (2012) to obtain the power profiles. The fitting correlations are expressed by Equations (10)–(12), and a comparison with Strydom and Epiney's values is depicted in Figure 4. It should be noted that the variable z in Equations (10)–(12) is the height measured from the bottom surface of the hot plenum in unit of meters. The correlations were then multiplied by a factor to simulate the reactor decay power. The material thermophysical properties and the power distribution were imported to ANSYS Fluent 19.1 via User Defined Functions (UDF).
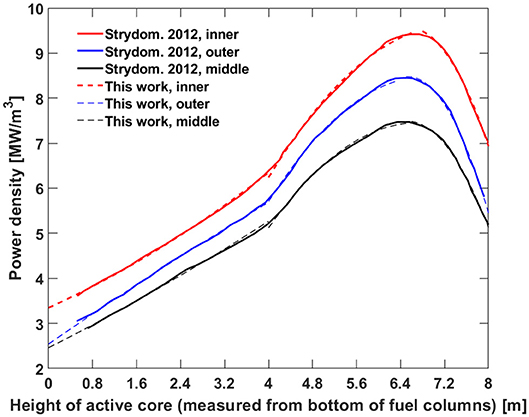
Figure 4. Comparison of the reactor power density correlations with original reference values.
In addition to the helium natural convection flow in the core, thermal radiation between the outer surface of the core barrel and the inner surface of the RPV wall was computed by the surface to surface (S2S) radiation module. The cooling mechanism outside the RPV includes natural convection in the reactor cavity and thermal radiation to the RCCS. The radiation to the RCCS was simulated by assuming an emissivity value of 0.87 for the RPV outer surface with an RCCS temperature of 373 K. The natural convection flow was computed by assigning a heat transfer coefficient with an environment temperature of 423 K. In this work, the heat transfer coefficient was estimated by the following process. First, a steady-state condition is assumed so the energy balance can be written as:
where Q, h, Tw, T∞, , and σ are the total decay power, heat transfer coefficient, RPV wall temperature, reactor cavity air temperature, RCCS temperature, and Stefan-Boltzmann constant, respectively. However, the RPV surface temperature distribution was unknown. Therefore, we assumed an uniform RPV wall temperature distribution when estimate the heat transfer coefficient. Accordingly, Equation (13) can be simplified to:
The Nusselt number for free natural convection over a vertical surface can be calculated by the Churchill correlation (Churchill and Chu, 1975):
Then, the heat transfer coefficient can be obtained by solving Equations (14) and (15). In the calculation, an arbitrary RPV surface temperature was used as an initial estimate. The Rayleigh number and Prandtl number in Equation (15) are evaluated at a gas film temperature that is the mean value of the RPV wall temperature and environment temperature. Therefore, iteration can be carried out to obtain the value of Tw, and thus the value of h. In this work, the heat transfer coefficient is about 15 W/m2-K. The boundary condition of the RPV wall used in this study is more conservative than studies performed by Zheng et al. (2018).
Porous Medium Parameters
The fuel columns were simplified into homogenous porous bodies to avoid generating tremendous extra fine meshes for each individual coolant channel. The pressure loss in these porous bodies should be maintained the same as the prototypic values given the same mass flow rate and temperature conditions. The porous flow is modeled by a momentum source in ANSYS Fluent 19.1 (ANSYS Inc., 2018). For a homogeneous porous medium equation, the momentum source is given as (ANSYS Inc., 2018):
where μ, α, umag, and C2 are the fluid viscosity, permeability, flow velocity magnitude, and inertial resistance factor, respectively. The subscript i indicates a specified flow direction.
The porosity of the porous fuel column is defined as the ratio of the fluid volume to the total fuel column volume:
where N, D, and L are the number of the coolant channels in one fuel column, the diameter of the coolant channel, and the length of the hexagon short edge, respectively. Assume the flow velocity in a prototypic coolant channel is u1, then the flow velocity in the porous medium can be calculated by:
For the natural circulation in the extended P-LOFC accident the flow in the coolant channels falls into the laminar flow regime. Therefore, the pressure change rate in the circular coolant channel, neglecting the developing flow region, is given as:
Equation (19) should be equal to Equation (16) if the same pressure loss is maintained at the same mass flow rate:
Therefore, the porous flow parameter for the fuel columns can be obtained as: m−2 and C2 = 0.
In the prototypic MHTGR design, small bypass gaps with a width of 2~3 mm were left between the graphite reflectors, and between the permanent reflectors and the core barrel, as shown in Figure 1. These gaps are used to accommodate the graphite manufacturing tolerance and thermal expansion during operation. However, the exact dimension of the bypass gaps is unknown because of possible misalignment during installation and graphite densification caused by neutron irradiation. A gap width of 2 mm was therefore adopted as a reference value in this research to study the natural circulation flow pattern for different core decay power levels. Two additional simulations were also carried out with different bypass gap width values, i.e., 3 and 4 mm, to study the sensitivity of the natural circulation flow rate to the bypass gap size. However, the narrow gap leads to difficulties in generating high-quality meshes within an acceptable quantity. In this research, the width of the bypass gaps were enlarged to 40 mm so the length/width ratio can be reduced to avoid high skewness of the mesh elements. To compensate the enlarged cross sectional area of the bypass gaps, a porous flow model was applied. The prototypic gap width is much smaller than the horizontal edge length of the graphite blocks, which can be regarded as infinitely parallel. Using the same method described above, the porous parameters for the bypass gaps are: and C2 = 0, where W is the prototypic gap width and .
To verify the porous body assumption, simulations were performed for the fuel columns and bypass gaps. Comparisons of the two simplifications are shown in Table 2. It can be seen that both simplifications preserve the pressure loss with good accuracy for the same given mass flow rate. However, the maximum temperature of the porous flow simulation is always lower than the theoretical solution due to the thermal equilibrium assumption in the porous heat transfer model. This assumption does not calculate the heat transfer between the solid and fluid domains. Therefore, the temperature gradient near the solid-fluid interface of the prototypic structure cannot be preserved. In general, the porous flow assumption for the fuel columns and bypass gaps is acceptable.
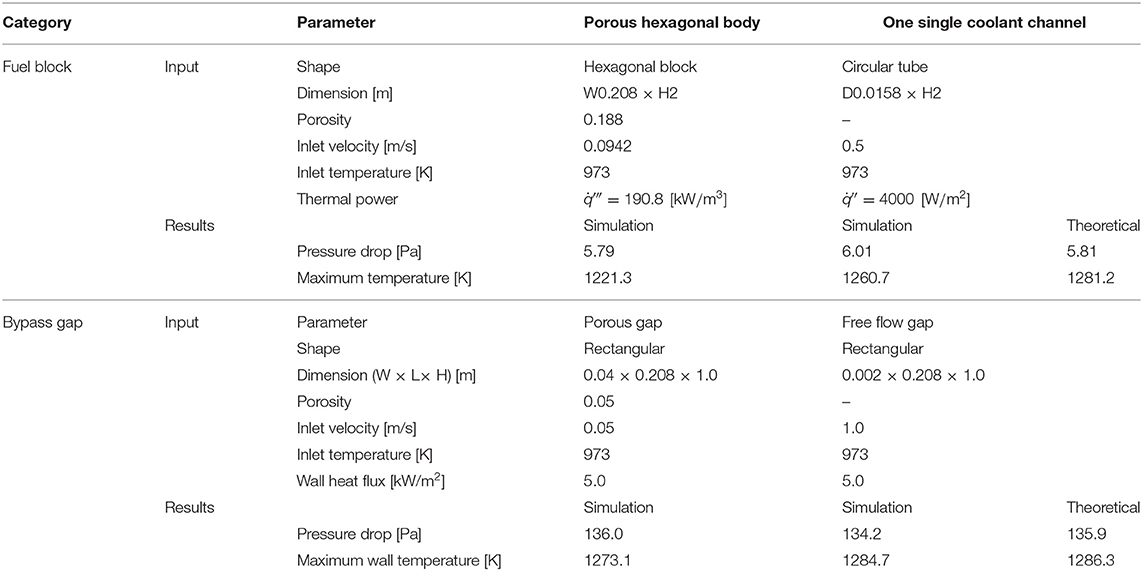
Table 2. Verification of the fuel block and bypass gap simplifications.
Results and Discussion
Decay Heat Removal at Different Power Levels
The reactor temperature distributions at decay power levels of 1, 0.8, and 0.5% are shown in Figure 5. As can be seen, the maximum temperature of the three simulated cases are 2,212, 1,818, and 1,248 K, respectively. The hot zones appear at the upper half region of the active fuel columns due to the peak power values there, as shown in Figure 4. The homogenized temperature distributions of the seven fuel columns in the simulation domain at the core decay power levels of 1.0, 0.8, and 0.5% of the reactor rated power are depicted in Figure 6. Fuel column 7 has the lowest temperature because its distance to the core barrel is the smallest. In Figure 6, the temperature peaks at a height about 8–9 m measured from the bottom of the hot plenum mainly due to the axial power distribution shape (Strydom and Epiney, 2012). The fuel column temperature starts to decrease after the peaks, which indicates that the natural circulation is not strong enough to bring the maximum fuel temperature to the top of the fuel column. Instead, the horizontal thermal conduction through graphite material plays a more dominant role in decay heat removal.
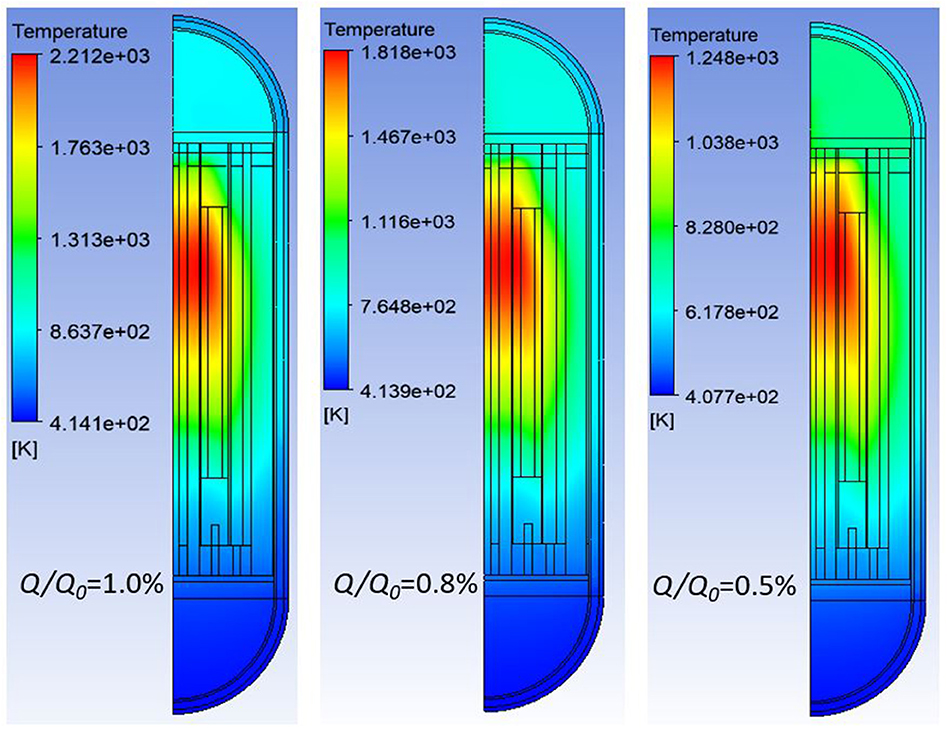
Figure 5. Reactor temperature distribution at different decay power levels.
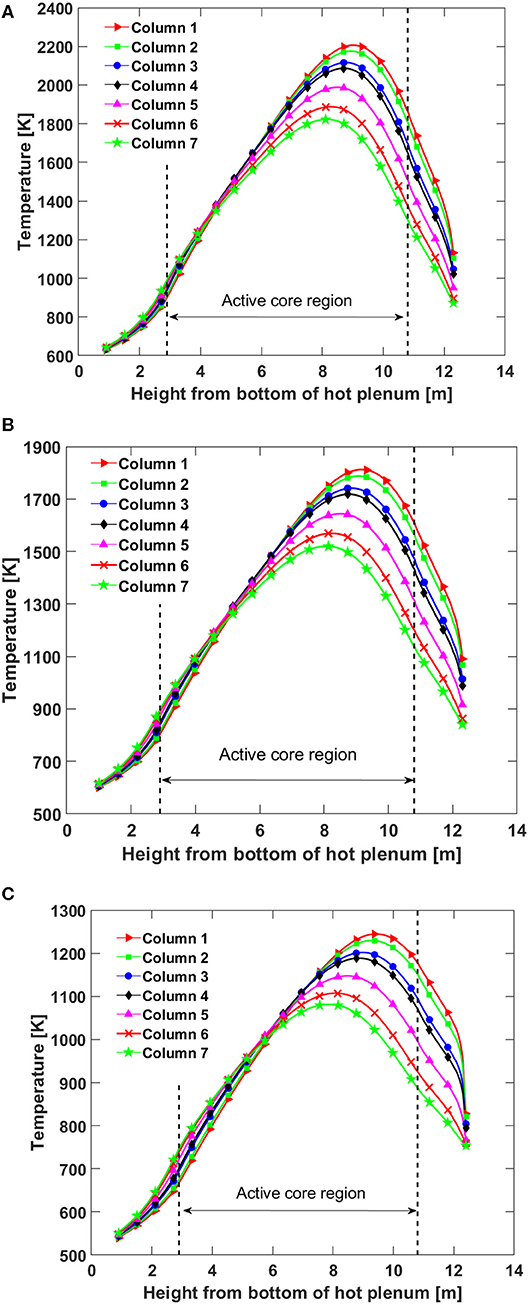
Figure 6. Reactor temperature distributions for the decay power at: (A) 1.0%, (B) 0.8%, and (C) 0.5% of the reactor rated thermal power.
The maximum fuel temperature at the 1.0% decay power exceeds the fuel design limit of 1,873 K for the fuel. However, it does not necessarily mean that the reactor core will be overheated because it depends on the duration of the transient. The time required for the reactor shutdown heat generation rate, i.e., essentially the decay power, to drop to 1.0, 0.8, and 0.5% of the reactor rated power is about 3.48, 10.6, and 111.3 h, respectively, if a typical light water reactor decay power curve is assumed for MHTGR (Todres and Kazimi, 2012). If the decay power during the first 3.48 h heats up the reactor core materials to a temperature close to the design limit, then the design limit might be exceeded. The other possibility is that the accumulated decay energy cannot heat the reactor materials up to a value close to 1,873 K. Then under this scenario, the reactor core will slowly cool down from some time after reactor shutdown.
Therefore, a short-term P-LOFC transient simulation is required in the future to confirm whether there is any fuel overheating and whether that would result in significant fuel damage.
One concern regarding the P-LOFC accident is possible thermal jet flow that can result in overheating of or thermal striping to the upper plenum wall. However, as depicted in Figure 7, the maximum velocity of the upward helium flow from the active core to the upper plenum is only about 0.16 m/s. Figure 8 presents the computed distributions of the helium axial flow velocity in the seven fuel columns for the decay power of 1.0% of the reactor rated power. The helium axial flow velocity profile for the other two cases are very similar to Figure 8, therefore they are not presented.

Figure 7. Vertical helium velocity contour at the decay power of 1.0% of the reactor rated power.
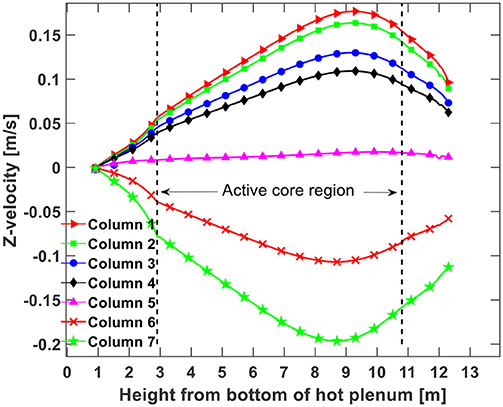
Figure 8. Distributions of the helium axial velocity for a decay power of 1.0% of the reactor rated power.
Due to the lower temperatures in fuel columns 6 and 7, the downward flow mainly occurs in those two fuel columns.
Effect of Bypass Gap Width on Decay Heat Removal
It has been assumed in the literature that the bypass gaps play a significant role in the plenum-to-plenum natural circulation during the HTGR pressurized cooling down process because the lower helium temperature there generates the largest downward flow potential. However, the width of the bypass gaps can vary due to graphite block misalignment, neutron irradiation, and thermal expansion. In this study, three width values, namely 2, 3, and 4 mm, were used in simulations at a decay power level of 0.8% of the reactor rated power to examine its effect on decay heat removal. The temperature distributions along the centerline of the seven fuel columns are given in Figures 9–11 for the three gap width value cases. As can be found, the peak fuel column temperature drops by small values if the gap was enlarged from 2 to 3 mm. However, if the bypass gaps were further enlarged to 4 mm, the peak fuel temperatures drop considerably. The temperature drop is caused by stronger natural circulation flow brought on by the wider bypass gap. In addition, another trend observed is that the temperature peaks move to higher positions with increased bypass gap widths, which also results from the stronger natural circulation flow.
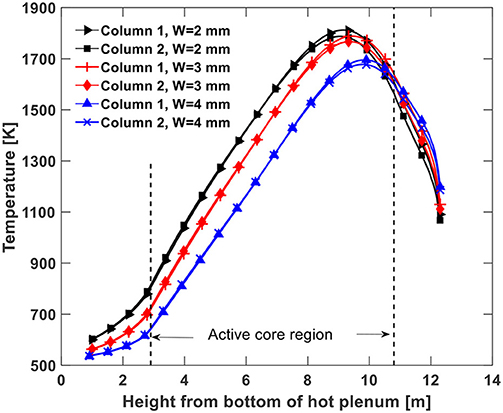
Figure 9. Temperature distributions of fuel columns 1 and 2 with different gap widths.
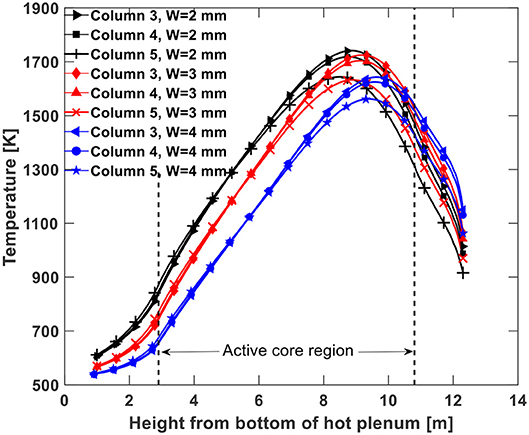
Figure 10. Temperature distributions of fuel columns 3, 4, and 5 with different gap widths.
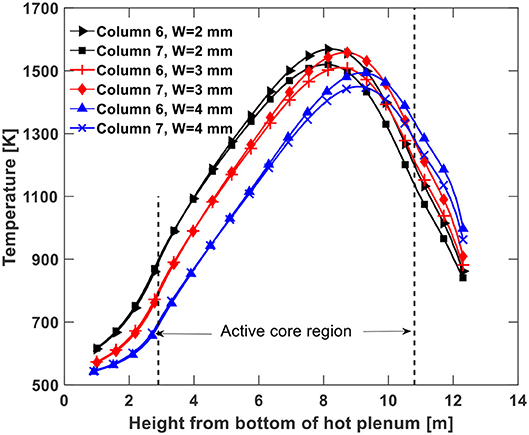
Figure 11. Temperature distributions of fuel columns 6 and 7 with different gap widths.
Figure 12 shows the helium axial flow velocity contours in the fuel columns using three different bypass gaps widths. As discussed in section Porous Medium Parameters, the flow resistance factor drops by a factor of 8 if the bypass gaps are enlarged from 2 to 4 mm with the same helium mass flow rate. Accordingly, the helium flow rate in the bypass gaps should increase with larger bypass gaps, which is confirmed by the simulation data in Table 3. When the bypass gap width is 2 mm the fraction of the downward helium flow in the bypass gaps is only about 16.8% of the total downward flow, which increases to 78% when the gap width is 4 mm. Depending on the location of the downward flow, the heat transfer rate of the helium natural circulation is different. The closer the downward flow is to the core barrel, the more effectively it can be cooled. This is the main reason for the decreased maximum fuel temperature with increasing bypass gaps, as depicted in Figures 9–11.
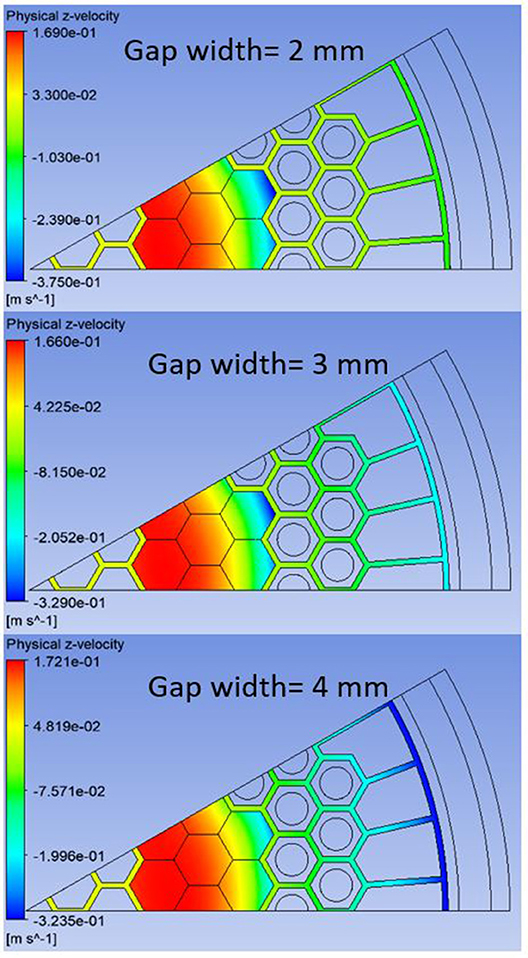
Figure 12. Distributions of the helium axial velocity at the top of the active core (z = 10.88 m measured from the bottom surface of the hot plenum) with different bypass gap widths.
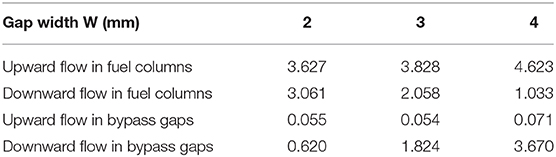
Table 3. Helium mass flow rate in the fuel columns and bypass gaps for the 1/12 core sector [ × 10−2 kg/s].
Conclusion
Three-dimensional CFD simulations were performed to investigate the development of the plenum-to-plenum natural circulation flow during an extended P-LOFC accident in the MHTGR. Potential heat transfer paths were included in the simulation while the multi-channel reactor core was regarded as a porous medium.
Helium natural circulation flow and temperature distributions in the reactor were obtained at three decay power levels, 1.0, 0.8, and 0.5% of the reactor rated power. The helium flow velocity distributions are similar in the three cases studied. Maximum fuel temperature appears in the upper half of the fuel column region due to the larger heat generation rate there. The helium natural circulation flow does not lead to significant thermal jets into the upper plenum. In general, the heat conduction through the graphite reflectors and RPV vessel to the RCCS in the horizontal direction plays a dominant role in decay heat removal. In addition, the simulation results suggest additional transient studies covering the first several hours after reactor shutdown be conducted for reactor safety analysis in the future.
Helium natural circulation flow is very sensitive to the width of the bypass gaps between graphite blocks, permanent reflectors, and the core barrel. The helium flow in the bypass gaps is only about 16.8% of the total flow when the bypass gap width is 2 mm. However, this increase to 78% in this simulation if the width is enlarged to 4 mm. In conclusion, the enlarged bypass gaps have two effects on the natural circulation pattern. First, the total helium flow rate will be increased and second, more downward flow occurs in the bypass gaps. These effects lead to lower maximum fuel temperature for larger bypass gap widths. In addition, the stronger natural circulation brings the maximum fuel temperature to a higher position. Therefore, the actual width of the bypass gaps is worth of investigation in detail.
Data Availability Statement
The datasets generated for this study are available on request to the corresponding author.
Author Contributions
CW performed this study under the supervision of XS and PS. All authors contributed to the article and approved the submitted version.
Funding
This research was performed using funding received from the DOE Office of Nuclear Energy's Nuclear Energy University Program (NEUP). The authors appreciate the financial support from the DOE NEUP office.
Conflict of Interest
The authors declare that the research was conducted in the absence of any commercial or financial relationships that could be construed as a potential conflict of interest.
Acknowledgments
The authors wish to acknowledge Prof. Annalisa Manera and Dr. Victor Petrov of the University of Michigan for their insightful suggestions to this work.
References
Alonso, G., Ramirez, R., Valle, E., and Del Castillo, R. (2014). Process heat cogeneration using a high temperature reactor. Nucl. Eng. Des. 280, 137–143. doi: 10.1016/j.nucengdes.2014.10.005
ANSYS Inc. (2018). ANSYS Fluent User's Guide. 19.1. Canonsburg, PA. Available online at: https://www.afs.enea.it/project/neptunius/docs/fluent/html/ug/main_pre.htm (accessed February 12, 2020).
Churchill, S. W., and Chu, H. H. S. (1975). Correlating equations for laminar and turbulent free convection from a vertical plate. Int. J. Heat Mass Transf. 18, 1323–1329. doi: 10.1016/0017-9310(75)90243-4
Fang, C., Morris, R., and Li, F. (2017). Safety features of high temperature gas cooled reactor. Sci. Technol. Nucl. Install. 2017, 3–6. doi: 10.1155/2017/9160971
Ferng, Y. M., and Chen, C. T. (2011). CFD investigating thermal-hydraulic characteristics and hydrogen generation from graphite-water reaction after SG tube rupture in HTR-10 reactor. Appl. Therm. Eng. 31, 2430–2438. doi: 10.1016/j.applthermaleng.2011.04.007
Ferng, Y. M., and Chi, C. W. (2012a). CFD investigating the air ingress accident for a HTGR simulation of graphite corrosion oxidation. Nucl. Eng. Des. 248, 55–65. doi: 10.1016/j.nucengdes.2012.03.041
Ferng, Y. M., and Chi, C. W. (2012b). CFD investigating the air ingress accident occurred in a HTGR-simulation of thermal-hydraulic characteristics. Nucl. Eng. Des. 245, 28–38. doi: 10.1016/j.nucengdes.2012.01.004
Jin, H. G., No, H. C., and Park, B. H. (2012). Effects of the onset time of natural circulation on safety in an air ingress accident involving a HTGR. Nucl. Eng. Des. 250, 626–632. doi: 10.1016/j.nucengdes.2012.06.028
No, H. C., Lim, H. S., Kim, J., Oh, C., Siefken, L., and Davis, C. (2007). Multi-component diffusion analysis and assessment of GAMMA code and improved RELAP5 code. Nucl. Eng. Des. 237, 997–1008. doi: 10.1016/j.nucengdes.2006.10.020
Nuclear Energy Agency (2018). NEA Benchmark of the Modular High-Temperature Gas-Cooled Reactor-350 MW Core Design Volumes I and II. Available online at: http://www.oecd.org/officialdocuments/publicdisplaydocumentpdf/?cote=NEA/NSC/R(2017)4&docLanguage=En (accessed February 12, 2020).
Nuclear Safety Standards Commission (1978). Safety Standards of the Nuclear Safety Standards Commission (KTA) Part 1: Calculation of the Material Properties of Helium.
Oh, C. H., Kang, H. S., and Kim, E. S. (2011a). Air-ingress analysis: part 2 - computational fluid dynamic models. Nucl. Eng. Des. 241, 213–225. doi: 10.1016/j.nucengdes.2010.05.065
Oh, C. H., Kim, E. S., and Kang, H. S. (2012). Natural circulation patterns in the VHTR air-ingress accident and related issues. Nucl. Eng. Des. 249, 228–236. doi: 10.1016/j.nucengdes.2011.09.031
Oh, C. H., Kim, E. S., No, H. C., and Cho, N. Z. (2011b). Final Report on Experimental Validation of Stratified Flow Phenomena, Graphite Oxidation, and Mitigation Strategies of Air Ingress Accidents. Idaho Falls, ID.
Said, I. A., Taha, M. M., Usman, S., and Al-Dahhan, M. H. (2018). Effect of helium pressure on natural convection heat transfer in a prismatic dual-channel circulation loop. Int. J. Therm. Sci. 124, 162–173. doi: 10.1016/j.ijthermalsci.2017.10.004
Strydom, G., and Epiney, A. S. (2012). “RELAP5-3D results for Phase I (exercise 2) of the OECD/NEA MHTGR-350 MW Benchmark,” in International Congress on Advances in Nuclear Power Plants (Chicago, IL), 387–395.
Sumita, J., Shibata, T., Nakagawa, S., Iyoku, T., and Sawa, K. (2009). Development of an evaluation model for the thermal annealing effect on thermal conductivity of IG-110 graphite for high-temperature gas-cooled reactors. J. Nucl. Sci. Technol. 46, 690–698. doi: 10.1080/18811248.2007.9711576
Takamatsu, K., Tochio, D., Nakagawa, S., Takada, S., Yan, X. L., Sawa, K., et al. (2014). Experiments and validation analyses of HTTR on loss of forced cooling under 30% reactor power. J. Nucl. Sci. Technol. 51, 1427–1443. doi: 10.1080/00223131.2014.967324
Todres, N. E., and Kazimi, M. S. (2012). Nuclear Systems, Volume 1, Thermal Hydraulic Fundamentals, 2nd Edn. Moca Raton, FL: CRC Press. doi: 10.1201/b14887
Tung, Y., and Johnson, R. W. (2011). “CFD calculations of natural circulation in a high temperature gas reactor rollowing pressurized circulator shutdown,” in Proceedings of the ASME 2011 International Mechanical Engineering Congress and Exposition (Denver, CO), 1–9. doi: 10.1115/IMECE2011-64259
Wang, C., Sun, X., and Christensen, R. N. (2019). Multiphysics simulation of moisture-graphite oxidation in MHTGR. Ann. Nucl. Energy 131, 483–495. doi: 10.1016/j.anucene.2019.03.040
Wang, Y., Zheng, Y., Li, F., and Shi, L. (2014). Analysis on blow-down transient in water ingress accident of high temperature gas-cooled reactor. Nucl. Eng. Des. 271, 404–410. doi: 10.1016/j.nucengdes.2013.12.009
Keywords: HTGRs, CFD, P-LOFC, natural circulation, decay heat removal, MHTGR
Citation: Wang C, Sun X and Sabharwall P (2020) CFD Investigation of MHTGR Natural Circulation and Decay Heat Removal in P-LOFC Accident. Front. Energy Res. 8:129. doi: 10.3389/fenrg.2020.00129
Received: 17 February 2020; Accepted: 27 May 2020;
Published: 30 June 2020.
Edited by:
Wenxi Tian, Xi'an Jiaotong University, ChinaReviewed by:
Heng Xie, Tsinghua University, ChinaYixiang Liao, Helmholtz-Gemeinschaft Deutscher Forschungszentren (HZ), Germany
Nejdet Erkan, The University of Tokyo, Japan
Copyright © 2020 Wang, Sun and Sabharwall. This is an open-access article distributed under the terms of the Creative Commons Attribution License (CC BY). The use, distribution or reproduction in other forums is permitted, provided the original author(s) and the copyright owner(s) are credited and that the original publication in this journal is cited, in accordance with accepted academic practice. No use, distribution or reproduction is permitted which does not comply with these terms.
*Correspondence: Xiaodong Sun, eGRzdW5AdW1pY2guZWR1